| World Journal of Oncology, ISSN 1920-4531 print, 1920-454X online, Open Access |
| Article copyright, the authors; Journal compilation copyright, World J Oncol and Elmer Press Inc |
| Journal website https://wjon.elmerpub.com |
Original Article
Volume 000, Number 000, October 2025, pages 000-000

Understanding the Role of All-Trans Retinoic Acid in Acute Myeloid Leukemia Cells
Hadeel Al Sadouna, b, c, i, Fatimah Alamoudia, d, Noha Alamoudia, Hossam Tayebb, c, Raed Felimbanb, e, Raed Alserihia, b, f, Elrashed B. Yasing, i, Rizwan Khanh, Abdul Wahab Noorwalia
aStem Cell Unit, King Fahad Medical Research Centre, King Abdulaziz University, Jeddah, Saudi Arabia
bDepartment of Medical Laboratory Sciences, Faculty of Applied Medical Sciences, King Abdulaziz University, Jeddah 21589, Saudi Arabia
cNanomedicine Unit, Center of Innovation in Personalized Medicine (CIPM), King Abdulaziz University, Jeddah 21589, Saudi Arabia
dDepartment of Hematology Laboratory, Dr. Soliman Fakeeh Hospital, Jeddah, Saudi Arabia
e3D Bioprinting Unit, Centre of Innovation in Personalized Medicine (CIPM), King Abdulaziz University, Jeddah 21589, Saudi Arabia
fHematology Research Unit, King Fahd Medical Research Center, King Abdulaziz University, Jeddah, Saudi Arabia
gDepartment of Medical Laboratory Technology, Faculty of Applied Medical Sciences, King Abdulaziz University, Rabigh 25732, Saudi Arabia
hNeonatology, University Maternity Hospital, Limerick, Limerick, Ireland
iCorresponding Authors: Elrashed B. Yasin, Department of Medical Laboratory Technology, Faculty of Applied Medical Sciences, King Abdulaziz University, Rabigh 25732, Saudi Arabia; Hadeel Al Sadoun, Stem Cell Unit, King Fahad Medical Research Centre, King Abdulaziz University, Jeddah, Saudi Arabia
Manuscript submitted September 11, 2025, accepted September 25, 2025, published online October 10, 2025
Short title: ATRA-Induced Differentiation in AML Cells
doi: https://doi.org/10.14740/wjon2676
| Abstract | ▴Top |
Background: All-trans retinoic acid (ATRA) has revolutionized the management of acute promyelocytic leukemia (APL) and has generated interest in differentiation therapy as means to reduce reliance on conventional chemotherapy in other subtypes of acute myeloid leukemia (AML). However, the precise relationship between immunophenotypic changes and morphological maturation during ATRA-induced differentiation remains poorly defined. This study aimed to investigate the phenotypic and morphological progression of HL60 cells treated with ATRA and to establish quantitative correlations between surface marker expression and cell morphology.
Methods: HL60 cells were treated with 1 µM ATRA. Expression of myeloid and monocytic surface markers (CD38, CD45, CD11b, human leukocyte antigen (HLA)-DR, CD15, CD13, CD33) was analyzed in parallel with morphological assessment using Giemsa-stained cytospin preparations. Pearson correlation analysis was applied to link surface marker expression with specific stages of granulocytic differentiation. In addition, the mRNA expression of myeloid-specific transcription factors PU.1, RUNX1 and CEBPα was evaluated following ATRA treatment.
Results: ATRA induced a stepwise maturation of HL60 cells from promyelocytes through metamyelocytes and band forms to segmented neutrophils, recapitulating physiological granulopoiesis. Acquisition of mature morphology correlated positively with CD38, CD45, CD11b, HLA-DR, and CD15 expression, while CD13 and CD33 were progressively downregulated and inversely correlated with differentiation. Importantly, this study established quantitative links between distinct immunophenotypic signatures and defined morphological stages, a relationship not clearly demonstrated in previous HL60 studies. Concomitantly, ATRA upregulated transcription factors PU.1, RUNX1 and CEBPα, supporting the coordinated regulation of phenotypic and morphological maturation.
Conclusions: Our study reveals that ATRA not only promotes broad differentiation of HL60 cells but also orchestrates a targeted reprogramming that synchronizes morphological maturation with distinct immunophenotypic shifts, mediated by transcriptional upregulation of PU.1, RUNX1 and CEBPα. This integrative profiling - linking molecular, functional, and morphological parameters - offers a nuanced understanding of the differentiation trajectory and establishes a robust framework for assessing ATRA and other differentiation-based strategies in AML. By delineating these correlations, our findings pave the way for therapeutic approaches that leverage controlled leukemic cell maturation, potentially minimizing the cytotoxic burden associated with conventional chemotherapy.
Keywords: AML; Differentiation; ATRA
| Introduction | ▴Top |
Acute myeloid leukemia (AML) is characterized by impaired cell differentiation and uncontrolled proliferation, resulting in the accumulation of immature myeloid cells in the bone marrow and peripheral blood [1]. Despite continuous advancements in treatment, AML remains associated with high mortality rates across all age groups [2]. Standard AML therapy relies on chemotherapeutic agents that induce apoptosis in rapidly dividing cells, but these treatments are nonspecific and often result in severe side effects, such as hair loss and immunosuppression [3].
The introduction of all-trans retinoic acid (ATRA), a differentiation agent, revolutionized the treatment of acute promyelocytic leukemia (APL), a subtype of AML. ATRA, in combination with chemotherapy, has become the standard regimen for treating APL, raising hopes for reducing or even replacing chemotherapy in patients with APL and potentially other AML subtypes [4]. ATRA, the bioactive metabolite of vitamin A, plays a key role in regulating cellular differentiation by activating retinoic acid receptor-mediated signaling pathways.
APL is cytogenetically defined by reciprocal translocation t(15;17), which produces the PML-RARα fusion protein, a critical driver of differentiation arrest at the promyelocyte stage [5, 6]. Although the HL60 cell line was originally derived from a patient with APL, subsequent karyotyping reclassified it as an AML subtype known as AML with maturation (formerly AML M2) [7, 8]. Notably, HL60 cells lack t(15;17) translocation, the PML-RARα fusion protein, and the tumor suppressor gene p53 [9, 10]. Nevertheless, HL60 cells retain functional RARα receptors and remain responsive to ATRA-induced differentiation [11, 12]. As a result, HL60 cells are widely used as an in vitro model to study myeloid differentiation, molecular mechanisms, and therapeutic interventions in leukemia [13].
In this study, we aimed to investigate how ATRA promotes the differentiation of HL60 promyelocytes into mature granulocytes by examining changes in both cell surface marker expression and cellular morphology, as well as the correlations between these parameters. Using a panel of CD markers associated with myeloid and monocytic maturation, we assessed the differentiation process and compared these findings with the morphological changes observed in Giemsa-stained slides. Our results demonstrated that ATRA treatment transformed a heterogeneous population of promyelocytes into a mature granulocyte population resembling a normal physiological distribution, with neutrophils comprising nearly 60% of the cells. We observed consistent upregulation of CD38, CD15, human leukocyte antigen (HLA)-DR, and CD45, with a gradual increase in CD11b over time. Furthermore, we identified a negative correlation between the expressions of CD38, CD15, CD45, and CD11b and the number of promyelocytes and a positive correlation with the number of mature neutrophils.
| Materials and Methods | ▴Top |
Maintaining HL60 cells
The HL-60 cell line was originally established from the peripheral blood of a patient with APL. The cells were maintained in complete growth medium consisting of RPMI (Sigma) supplemented with 10% fetal bovine serum (FBS) (Sigma-Aldrich, Inc., Missouri, St. Louis, MO, USA), 1% penicillin/streptomycin (P/S) (Sigma-Aldrich, Inc., Missouri, St. Louis, MO, USA), and 1% L-glutamine. The cell suspension was incubated at 37 °C in a 5% CO2 incubator. Every 2 to 3 days, or when the count reached 1 × 10⁶ cells/mL, the cells were pelleted via centrifugation at 300 × g for 5 min, and 2 × 10⁵ viable cells/mL were resuspended in complete growth medium.
Differentiation of HL60 cells by ATRA
ATRA (Cat. No. PHR1187, 100 mg, Sigma-Aldrich, Inc., Missouri, St. Louis, MO, USA) (100 mg) was first reconstituted in DMSO to obtain a final stock concentration of 40 mg/mL. This stock was further diluted in complete growth media to a final working concentration of 1 µM, as recommended previously [14]. First, HL60 cells were seeded in six-well plates at concentrations ranging from 2 × 10⁵ to 5 × 10⁵ cells/mL. Media containing 1 µM ATRA were added on days 1, 3, and 5 post-treatments. The number of cells was maintained between 2 × 10⁵ and 5 × 10⁵ throughout the differentiation assay.
Flow cytometry analysis
HL60 cells were harvested for flow cytometry analysis on days 5, 6, and 7 post-ATRA differentiation for ATRA-treated cells and control cells. A single-cell suspension was prepared by 5 min of centrifugation at 400 × g, and 1 × 10⁶ cells/mL were resuspended in 0.5 mL of fluorescence-activated cell sorting (FACS) buffer (2% fetal bovine serum (FBS) in phosphate-buffered saline (PBS) without Ca++ or Mg++). For each staining reaction, 100 µL of the cell suspension was stained with the following antibodies: 0.5 µg of fluorescein isothiocyanate (FITC) anti-CD64 (IM1604U; Beckman Coulter Inc., USA), 0.5 µg of FITC anti-CD15 (IM1423U; Beckman Coulter Inc., USA), 0.0312 µg of phycoerythrin (PE) anti-CD38 (A07779; Beckman Coulter Inc., USA), 0.075 µg of energy coupled dye (ECD) anti-CD34 (IM2709U; Beckman Coulter), 0.0312 µg of ECD anti-CD14 (IM2707U; Beckman Coulter Inc., USA), 0.375 µg of phycoerythrin-cyanine 5.5 (PC5.5) anti-CD13 (A79389; Beckman Coulter Inc., USA), 0.000975 µg of PC5.5 anti-HLADR (B20024; Beckman Coulter Inc., USA), 0.5 µg of phycoerythrin-cyanine 7 (PC7) anti-CD45 (IM3548; Beckman Coulter Inc., USA), 0.0625 µg of allophycocyanin (APC) anti-CD11b (A87782; Beckman Coulter Inc., USA) or 0.0312 µg of APC anti-CD33 (IM2471; Beckman Coulter Inc., USA). The viability of HL60 cells after treatment was determined via the use of 7-aminoactinomycin D (7-AAD) (A07704; Beckman Coulter Inc., USA). Flow cytometry was performed via a Navios flow cytometer (Beckman Coulter Inc., USA), and the results were analyzed via Beckman Coulter-Navios software (Beckman Coulter Inc., USA).
Preparation of cytospin and Giemsa staining for morphology
On days 5, 6, and 7 post-treatment, 1 mL of treated or untreated cells was collected via a Cytotek kit (Sakura Finetek Inc., Torrance, CA, USA). In brief, two drops of cells were added to the chamber, covered with parafilm, and centrifuged at 800 revolutions per minute (rpm) for 10 min. After the cells were dried, they were stained with Giemsa stain (Sigma-Aldrich, Inc., Missouri, St. Louis, MO, USA) via a Sysmex SP-10 machine. The slides were inspected via microscopy (B382PLi-ALC-Optika Microscope) (OPTIKA S.r.l., Via Rigla, BG, Italy) at × 10 and × 40 magnifications.
Quantitative reverse transcription polymerase chain reaction (qRT-PCR) analysis of transcription factors
Total RNA was extracted from HL-60 cells treated with ATRA (days 1, 3 and 5) via the RNeasy Kit (Qiagen), followed by DNase I treatment (Qiagen). The RNA concentration was quantified via a NanoDrop spectrophotometer. cDNA synthesis was performed via the Promega reverse transcription kit with both oligo(dT) and random primers. qRT-PCR was carried out using SYBR Green Master Mix on a StepOnePlus system. The primer sequences and PCR settings are listed here (Supplementary Material 1, wjon.elmerpub.com) [15-18].
Statistical analysis
All statistical significance was determined via GraphPad Prism 8, version 8.2.1 (GraphPad Software, Inc., Bangalore, India). The data are shown as the means ± standard error of the mean (SEM). A P value < 0.05 was considered significant. A correlation study was carried out via the Spearman coloration coefficient (r) via GraphPad Prism 8.
| Results | ▴Top |
ATRA treatment affected the cell population dynamics
Using forward and side scatter parameters in flow cytometry, we analyzed dot plot data to assess the impact of 1 µM wild-type ATRA on the HL60 cell population over time. Specifically, we compared untreated control HL60 cells to treated cells on days 5, 6, and 7.
In this experimental setup, HL60 cells were cultured in RPMI medium containing 1 µM ATRA, which was administered on days 0, 3, and 5, ensuring continuous exposure to the compound. The dot plot in Figure 1 illustrates two distinct cell populations: 1) R1 (red population) represents undifferentiated HL60 cells characterized by higher forward scatter (FSC) and lower side scatter (SSC), indicative of mononuclear cell morphology; 2) R2 (gray population) represents differentiated cells with lower FSC and higher SSC, indicative of increased granularity and multinuclear morphology, suggestive of mature granulocytes or neutrophils.
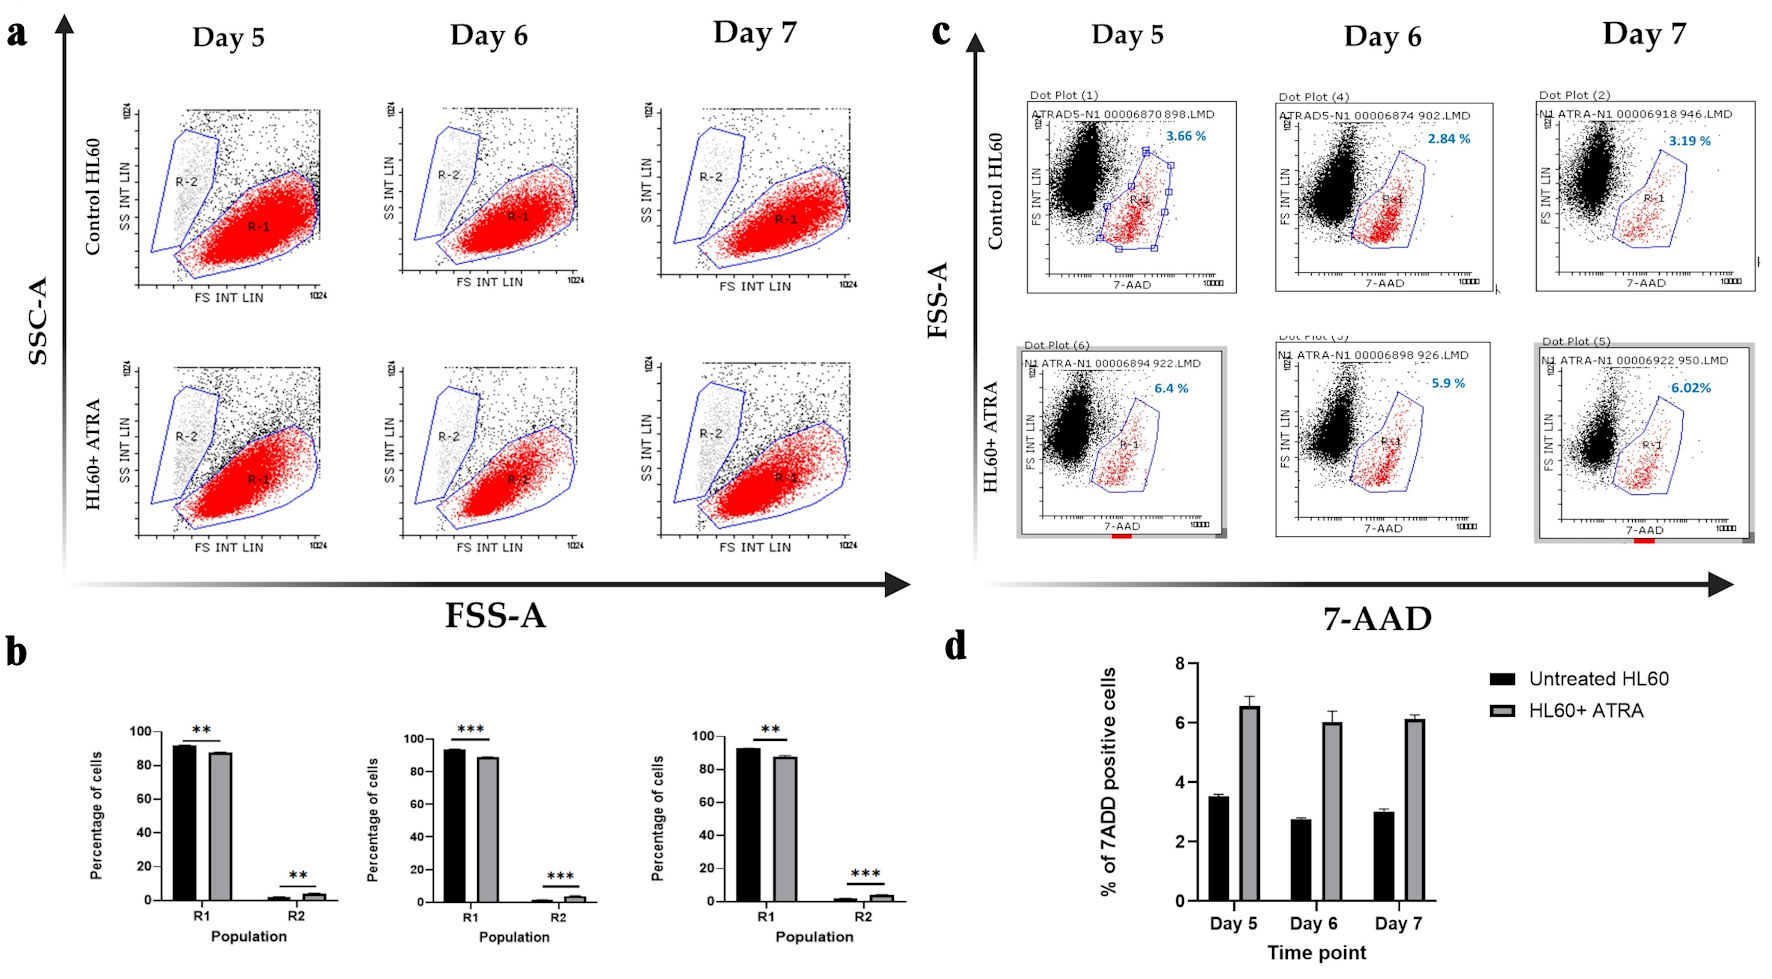 Click for large image | Figure 1. Dot plot analysis of HL-60 cell populations following ATRA treatment. (a) Representative dot plots showing R1 (red; immature cells) and R2 (gray; mature cells) populations in untreated HL-60 control cells (top row) and ATRA-treated HL-60 cells (bottom row). (b) Mean percentages of R1 and R2 populations in untreated control HL-60 cells (black bars) and ATRA-treated cells (gray bars). Data represent n = 3; error bars indicate the standard error of the mean (SEM). Statistical significance is denoted as **P ≤ 0.05, and ***P ≤ 0.005. (c) Representative dot plots showing 7-AAD-negative (viable) and 7-AAD-positive (nonviable; red) cell populations in HL-60 control cells (top row) and ATRA-treated HL-60 cells (bottom row). The percentage of 7-AAD-positive cells is shown in blue above the gate. (d) Mean percentage of 7-AAD-positive cells in untreated control HL-60 cells (black bars) and ATRA-treated cells (gray bars). Data represent n = 3; error bars indicate SEM. SSC-A: side scatter area; FSC-A: forward scatter area; 7-AAD: 7-aminoactinomycin D; ATRA: all-trans retinoic acid. |
Figure 1a shows the distribution of the R1 and R2 populations on days 5, 6, and 7 following ATRA treatment, whereas Figure 1b shows these changes, highlighting statistically significant differences at each time point. The data demonstrated that ATRA treatment led to a significant reduction in the R1 (immature) population and a corresponding increase in the R2 (mature) population across all the examined time points.
We next tested whether ATRA administration via a continuous feeding approach could affect the viability of HL60 cells, ensuring that repeated dosing remains safe, while also examining whether 1 µM ATRA induces apoptosis. Previous studies reported that early administration of ATRA at concentrations ranging from 10-5 to 10-8 M can induce apoptosis in primary AML cells within 48 h [19]. Therefore, we aimed to assess whether 1 µM ATRA impacts HL60 cell viability at later time points, specifically from day 5 to day 7.
We used 7-AAD as a marker of nonviable cells and analyzed cell populations by plotting 7-AAD on the x-axis against forward scatter on the y-axis. In untreated HL60 cells, 3.6% were positive for 7-AAD, a percentage that remained relatively constant up to day 7, representing the baseline level of nonviable cells (Fig. 1c). In response to the administration of 1 µM ATRA every 2 days, the percentage of the 7-AAD-positive population increased slightly from about 3% to about 6%, indicating that ATRA has minimal cytotoxicity and does not significantly induce apoptosis (Fig. 1c).
This conclusion is supported by the literature, which considers a 7-AAD-positive population less than 10% as indicative of low cytotoxicity [19]. Our results confirm that repeated dosing with 1 µM ATRA is safe for HL60 cell viability, causing only a minor (about 3%) increase in cell death compared with that of the untreated control.
ATRA treatment increased the immunophenotype of mature granulocytes
The differentiation potential of ATRA is mostly based on the expression of CD11b with or without CD14 expression in differentiated cells [20, 21]. In our study, we examined the baseline expression of cell surface markers in HL60 AML cells prior to differentiation to compare the expression of these markers with that of post differentiation markers. HL60 cells were identified by a high level of CD15 and positive but low expression of the CD45, CD38, and CD11b markers (Fig. 2a, b, yellow histogram and bar).
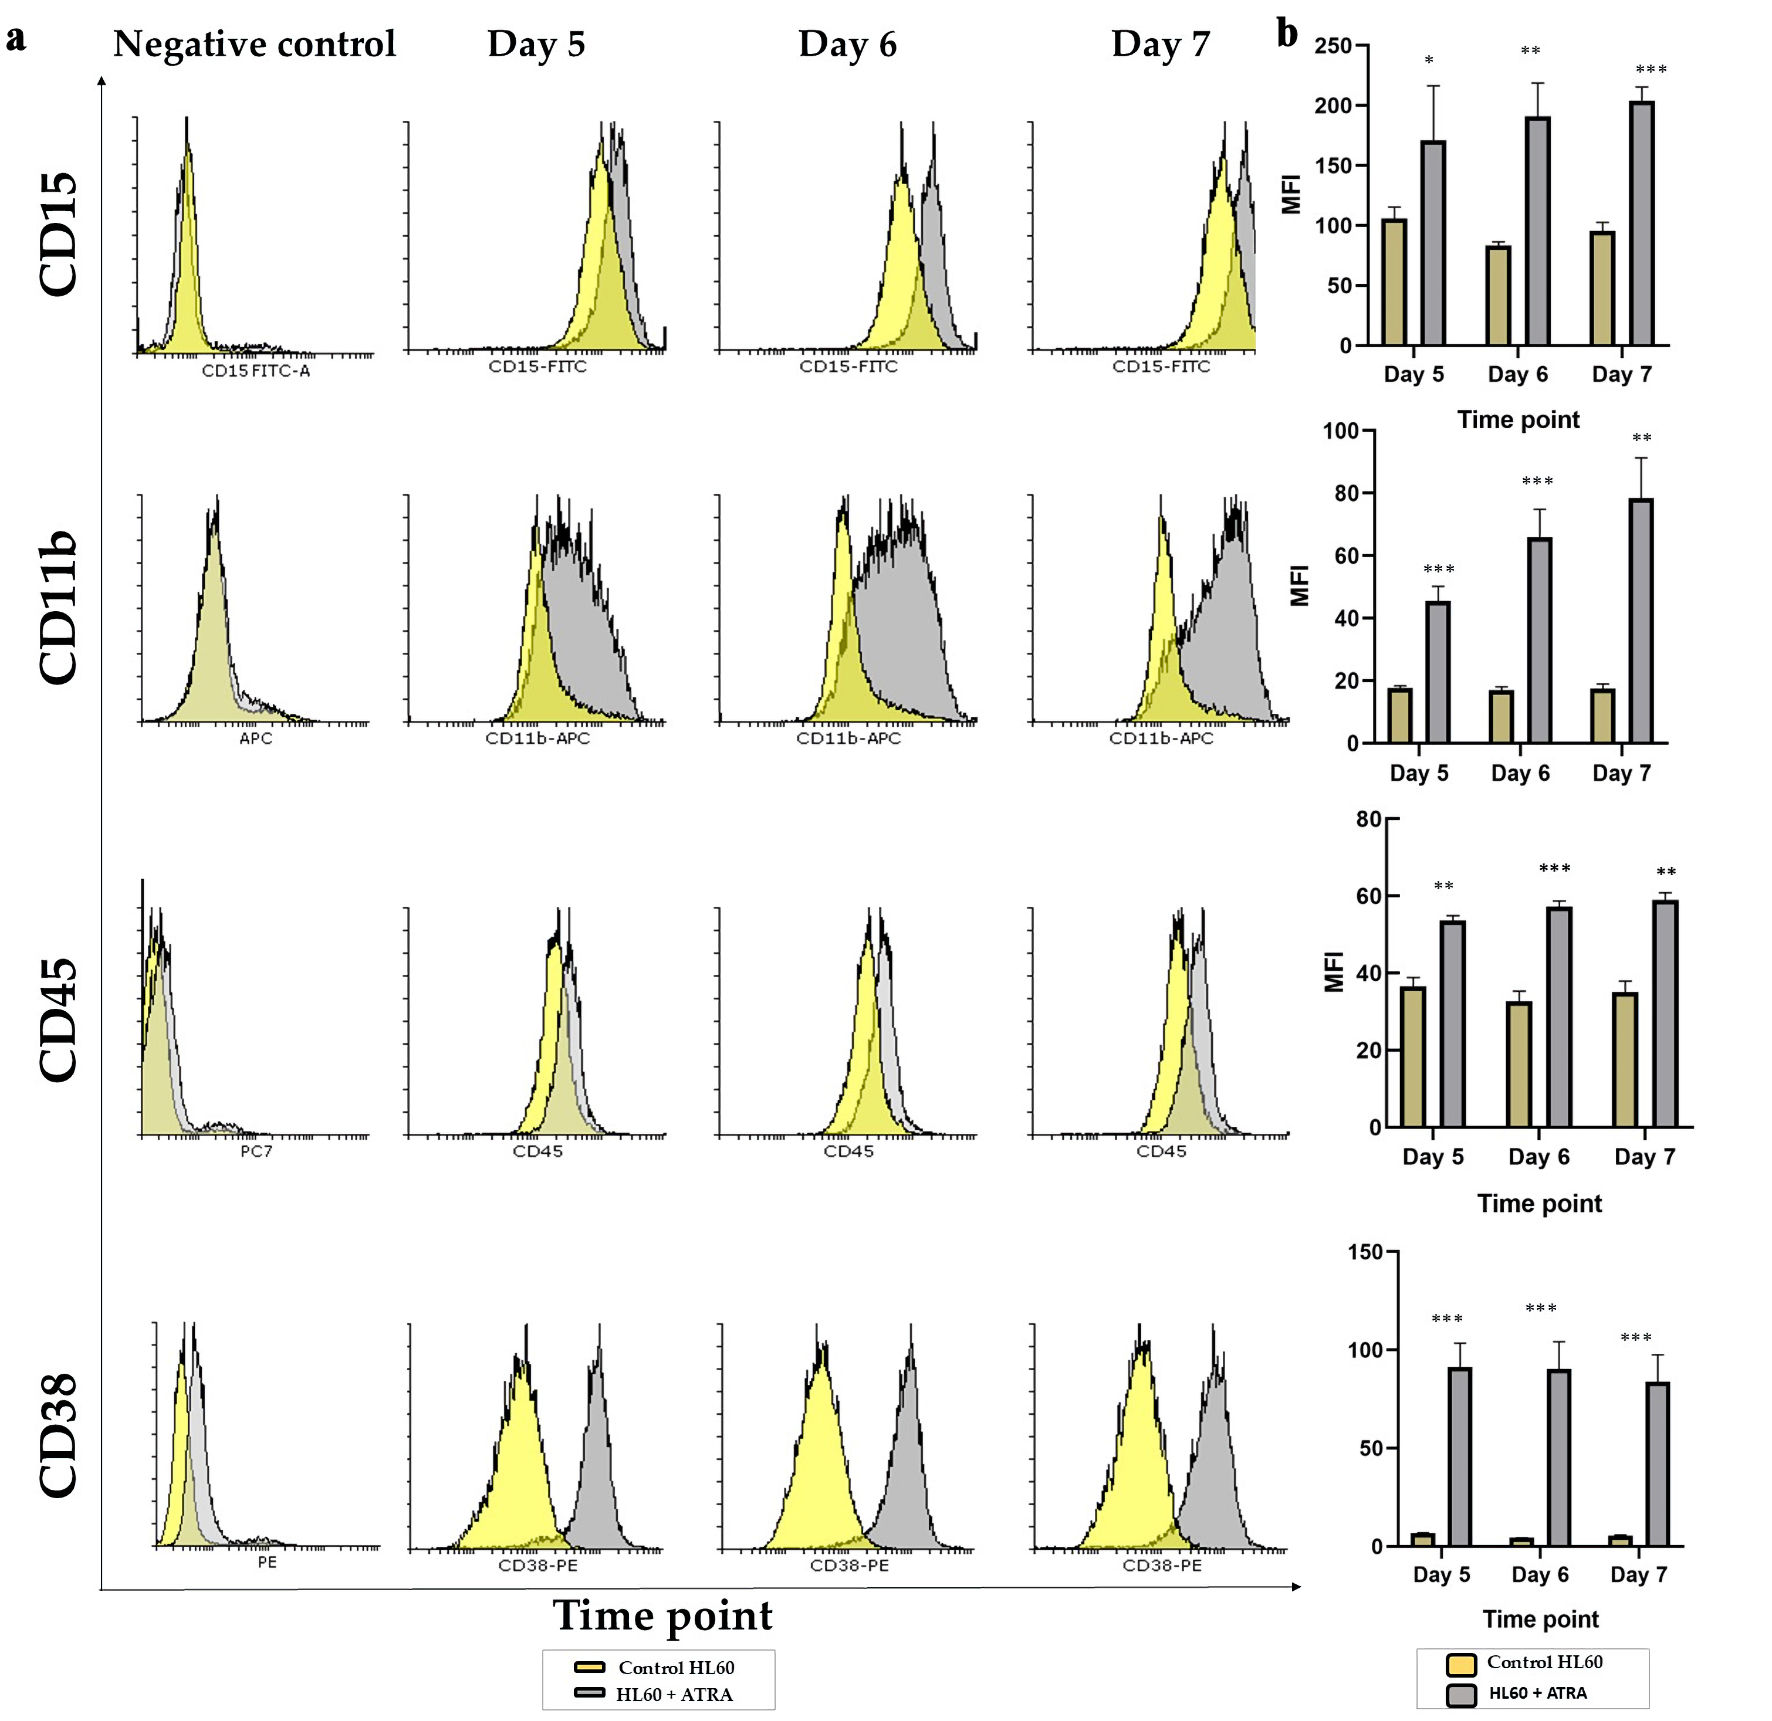 Click for large image | Figure 2. Analysis of the granulocytic maturation of HL60 leukemia cells following ATRA induction: (a) Representative overlay histogram plots of CD15, CD11b, CD45 and CD38 markers on day 5 (left panel), day 6 (middle panel) and day 7 (right panel) comparing the ATRA-treated HL60 cells (gray shading) to untreated controls (yellow shading). All negative controls are represented by an overlay histogram of the MFI of control HL60- and ATRA-treated cells in the no-antibody control. (b) MFI for the same markers in ATRA-treated HL60 for either 5 days, 6 days or 7 days (gray bar) or the control HL60 (yellow bar) n = 3, error bars = SEM; *P ≤ 0.05, **P ≤ 0.005, ***P ≤ 0.0005. ATRA: all-trans retinoic acid; SEM: standard error of mean; MFI: mean fluorescence intensity. |
In response to 1 µM wild-type ATRA, flow analyses were carried out on days 5, 6, and 7 after differentiation. Figure 2a shows the shift in the histogram comparing undifferentiated HL60, a yellow histogram, to differentiated HL60, a gray histogram. Figure 2b shows the statistical analysis of the mean fluorescence intensity (MFI) for each marker, comparing undifferentiated HL60 cells (yellow bars) to differentiated HL60 cells (gray bars). The CD15 histogram shifted to the right, and the MFI was significantly increased at days 5, 6, and 7 in a time-dependent manner (P < 0.05, P < 0.005, and P < 0.0005, respectively). CD11b expression also gradually and significantly increased in response to 1 µM ATRA, with P < 0.005 at all time points (Fig. 2b). The same was applied to CD45, with the histogram and MFI showing a slight but significant shift (P < 0.005), corresponding to an increase in the marker. CD38 represents a marker for the success of ATRA, which significantly shifted to the right compared with that of the control (Fig. 2a) and was stably and significantly increased, with P < 0.005 at all time points. The above data confirmed that from day 5, changes in granulocytic markers were apparent and increased gradually in a time-dependent manner for CD15, CD45 and CD11b, while the CD38 marker was stably upregulated in response to 1 µM ATRA.
The data above confirmed a maturation-towered granulocytic pathway with upregulation of CD15, CD45, CD11b and CD38 on day 5, which continued until day 7 in response to 1 µM ATRA that was fed into the HL60 cells.
To better understand the effect of ATRA treatment on surface marker expression in HL60 cells, we analyzed both monocytic and early myeloid markers. Specifically, we assessed CD14, CD64, and HLA-DR to evaluate the potential for monocytic differentiation and functional activation, as well as CD33, CD13, and CD34 as markers of immaturity and the blast phenotype.
As shown in Supplementary Material 2 (wjon.elmerpub.com), CD14, CD64, and CD34 were not expressed in untreated HL60 cells and remained undetectable following ATRA-induced differentiation. In contrast, CD13 and CD33, which are constitutively expressed, were significantly downregulated at all the examined time points (P < 0.05, P < 0.005, P < 0.0005) (Fig. 3a, b), indicating a shift away from the immature myeloid phenotype. Notably, although the pan-monocytic markers CD14 and CD64 were unaffected, HLA-DR - a marker associated with both phagocytic activity and early myeloid/blast cells - was modestly but significantly upregulated (P < 0.05).
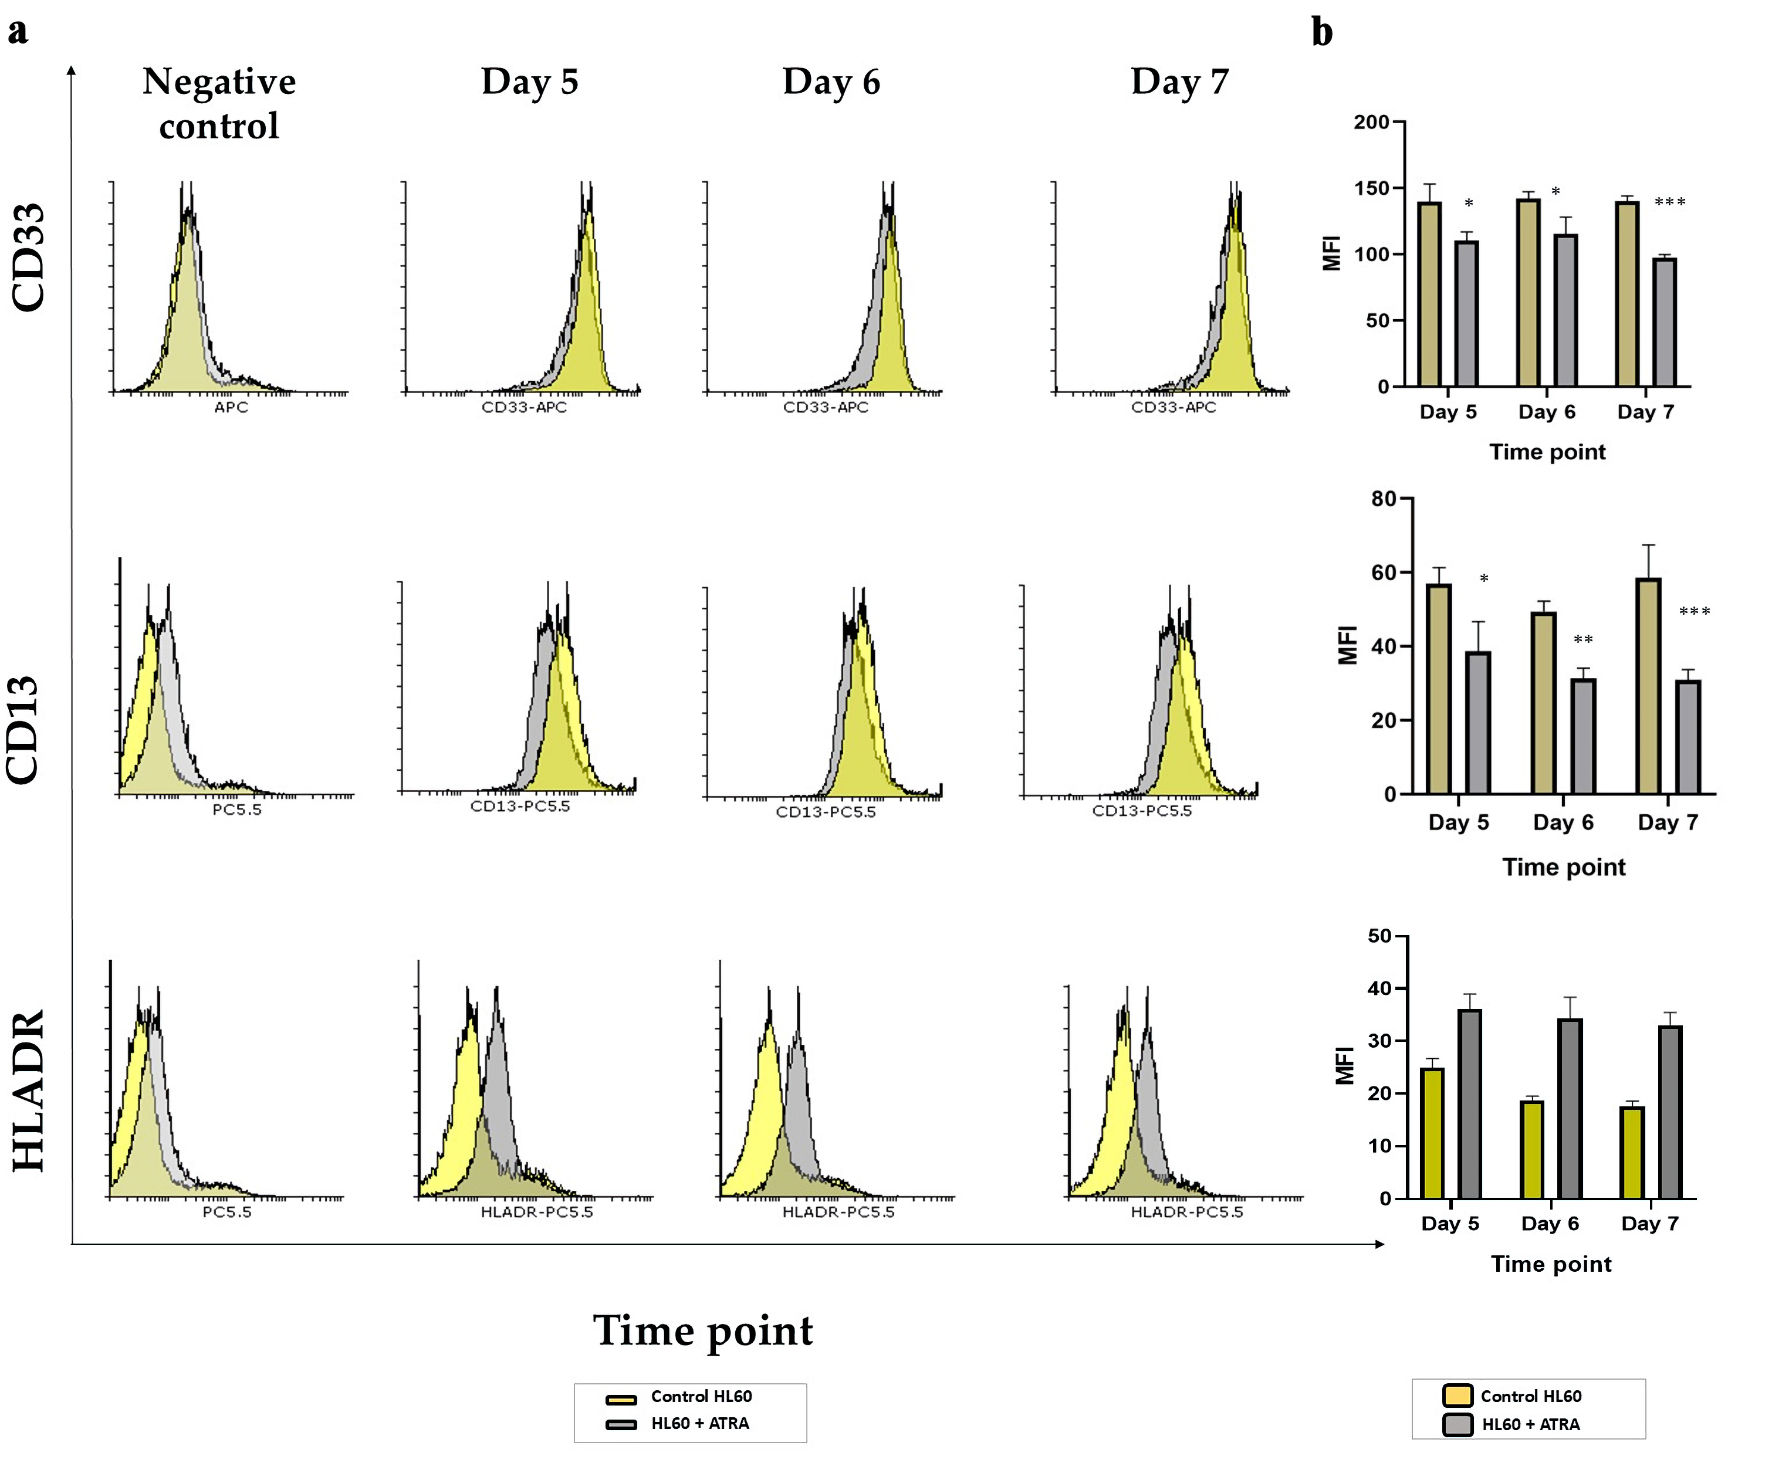 Click for large image | Figure 3. Analysis of markers of immaturity in HL60 leukemia cells following ATRA induction: (a) Representative histogram plots of CD13, CD33 and HLA-DR markers on day 5 (second panel), day 6 (third panel) and day 7 (right panel) comparing the ATRA-treated HL60 cells (gray shading) to untreated controls (yellow shading). All negative controls (left panel) represent an overlay histogram of the MFI of the HL60 control and ATRA-treated non-Ab control; (b) MFI for the same markers in ATRA-treated HL60 for either 5 days, 6 days or 7 days (gray bar) or the control HL60 (yellow bar) n = 3, error bars = SEM; *P ≤ 0.05, **P ≤ 0.005, ***P ≤ 0.0005. ATRA: all-trans retinoic acid; HLA: human leukocyte antigen; SEM: standard error of mean; MFI: mean fluorescence intensity. |
Together, these findings suggest that ATRA promotes a more mature phenotype in HL60 cells, as evidenced by the downregulation of immature markers (CD13 and CD33) and the slight induction of HLA-DR, potentially reflecting minor monocytic activation alongside granulocytic differentiation.
ATRA treatment changed the morphology of HL60 cells from homogenous promyelocytes to heterogeneous mature cells
By examining Giemsa-stained slides from ATRA-treated HL60 cells and control cells, we observed six different morphological changes in ATRA-treated cells. All appeared at days 5, 6, and 7 post differentiation. Figure 4 shows the morphology of each cell type, as well as the percentage of cells present each day, comparing ATRA-treated to untreated HL60 controls. HL60 mostly contains promyelocytes, as shown in Figure 4a. The percentage of promyelocytes remained between 95% and 100% in untreated HL60 cells and was reduced significantly to 33% on day 5, reaching no more than 1% on day 7 post-ATRA differentiation (P ≤ 0.0005) compared with that in untreated controls. The following maturation stage of granulocytes, metamyelocytes, was significantly upregulated from 1-2% in the control group to 23% on day 5 and 29% on day 7 (P ≤ 0.0005) (Fig. 4b). As granulocytes mature into polymorphonuclear (PMN) granulocytes, the metamyelocytes give rise to bands, whereas the nucleus forms a U-shaped structure that has not yet been segmented or separated by a thin filament. The band cells did not appear in untreated HL60 cells but were apparent on day 5 in 15% of the population. This percentage gradually decreased as the cells further matured on days 6 and 7, reaching 4% on day 6 and 2.6% on day 7, which resembled the normal count of band cells in peripheral blood (Fig. 4c). These findings confirmed that ATRA differentiates HL60 cells as normal primary cells throughout all stages of maturation in cell culture. Finally, Figure 4d shows the impact of the 7-day differentiation protocol on fully matured neutrophils that were absent from HL60 and appeared in 22% of the cells on day 5, which further increased to 36% on day 6 and finally to 63% of the PMNs on day 7 post-differentiation. Thus, we confirmed that ATRA-dependent maturation is a gradual process that slowly replaces HL60 from 100% promyelocytes to almost 1% promyelocytes, 29% metamyelocytes, 2.6% bands, and 63% PMN cells. The remaining monocytes accounted for no more than 2% of the total monocytes (Fig. 4e), which also increased gradually from 1.6% on day 5 to 2.3% on day 7. In addition, a small population of mitotic cells, indicative of active proliferation, was consistently observed in approximately 1-2% of the total cell population. This proportion remained largely unaffected by ATRA treatment, with only minimal changes detected. A full-field view of the cell populations at each time point, comparing untreated HL60 cells to those treated with ATRA, is provided here (Supplementary Material 3, wjon.elmerpub.com).
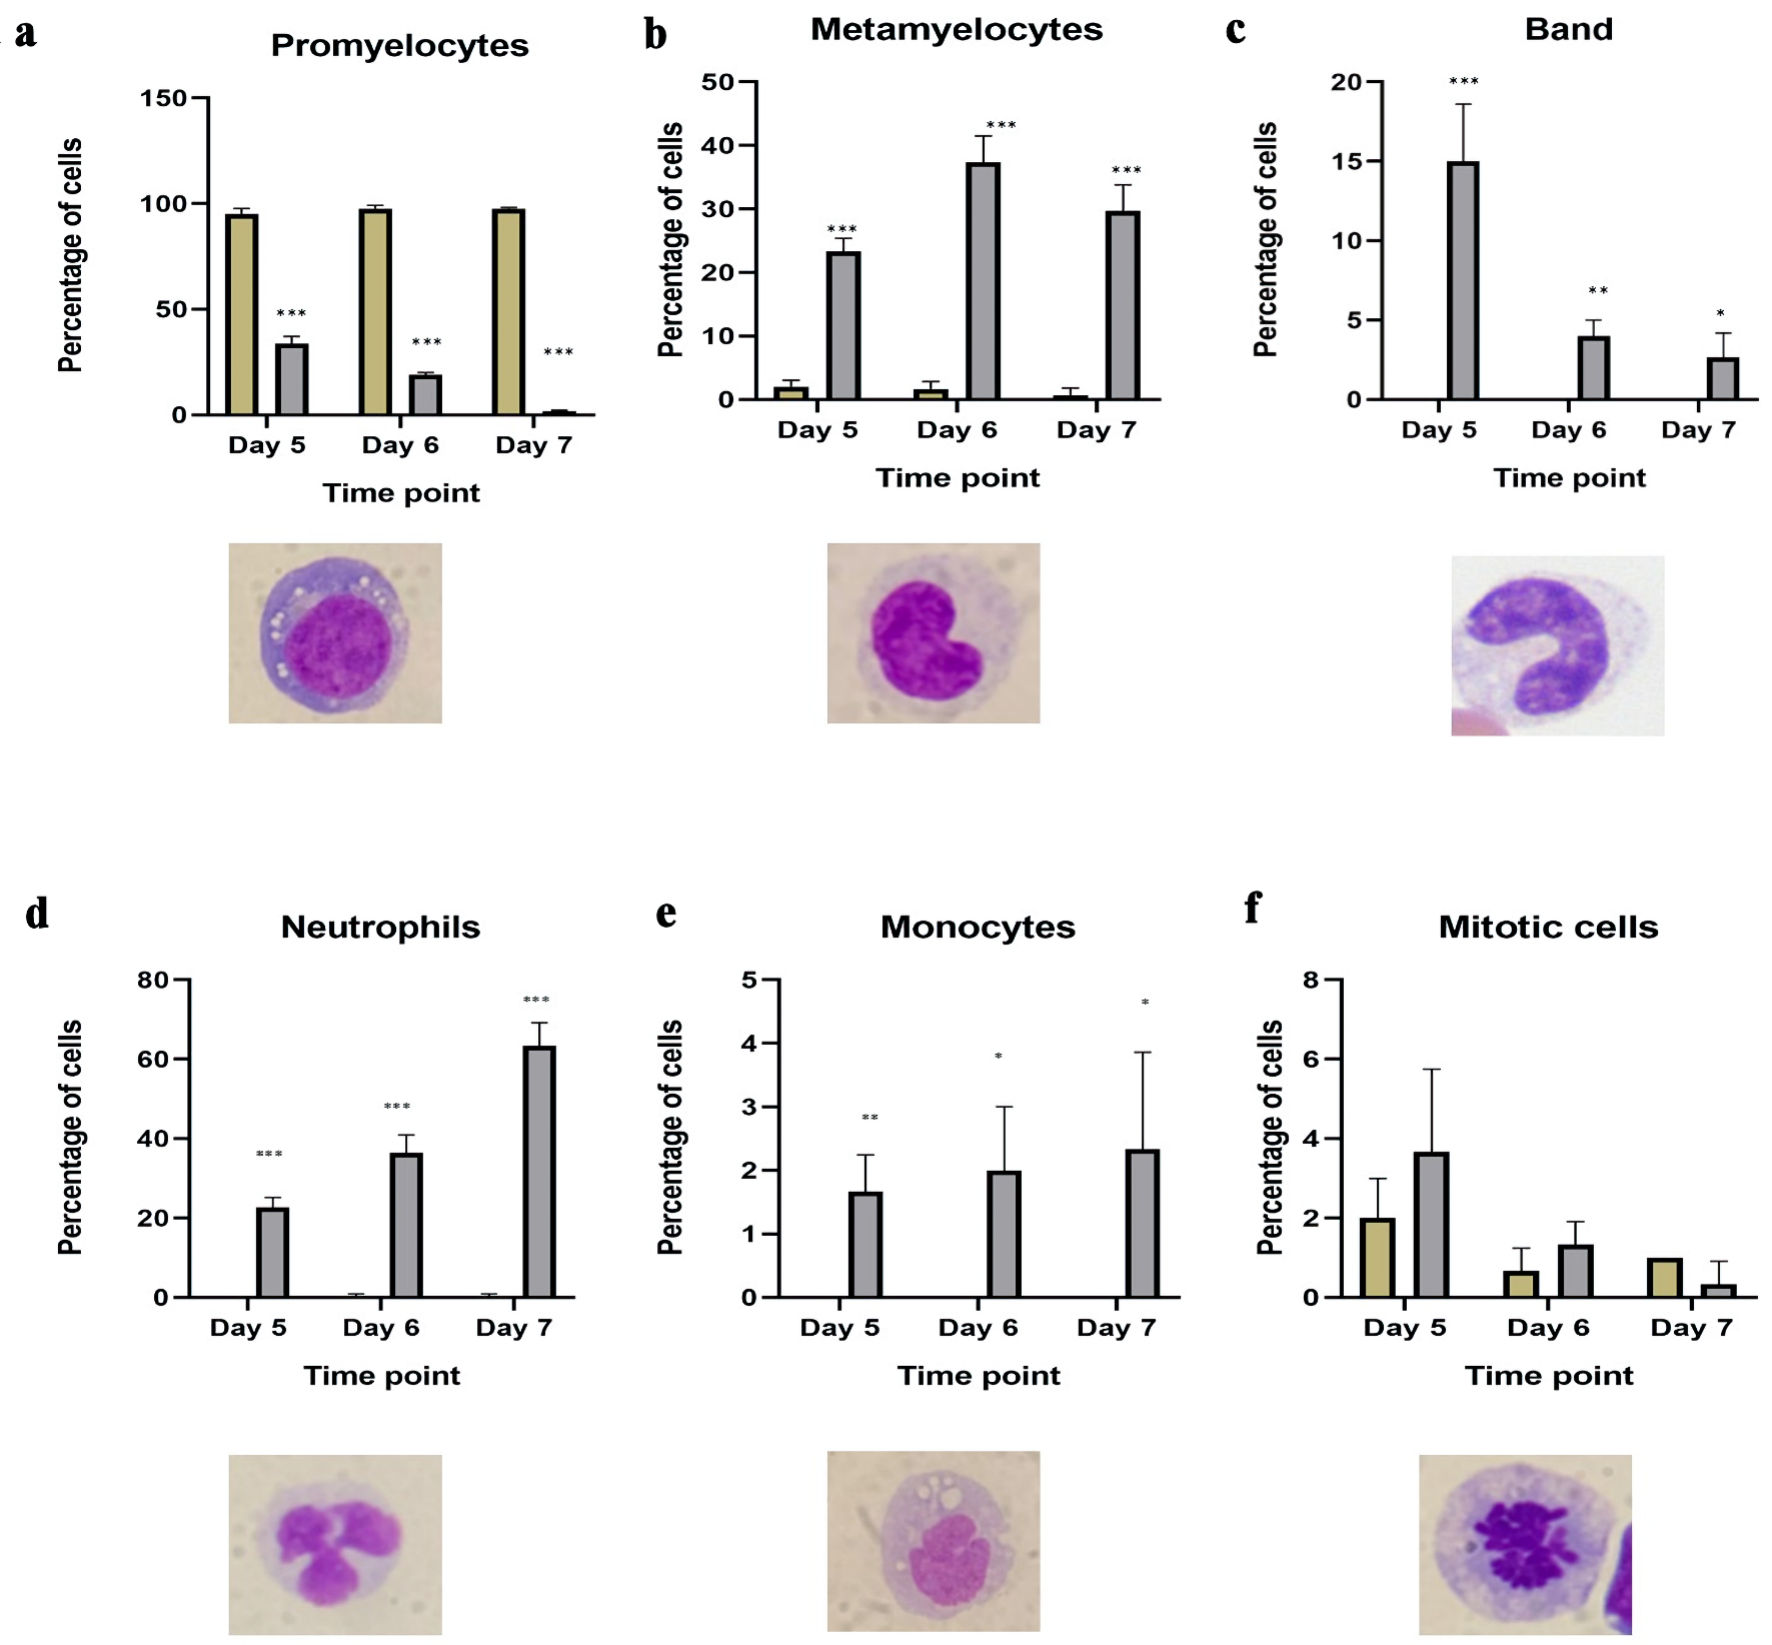 Click for large image | Figure 4. Morphological changes in HL60 cells from ATRA-treated HL60 cells. Number of granulocytic mature cells, including (a) promyelocytes; (b) metamyelocytes; (c) bands; (d) segmented neutrophils in untreated HL60 (blue bar) and ATRA-treated (red bar) cells on days 5, 6 and 7 post differentiation; (e) number of monocytes in ATRA-treated cells (red bar) and control HL60 (blue bar) cells on days 5, 6 and 7 post differentiation; (f) number of mitotic cells showing the impact of ATRA on proliferation in ATRA-treated cells (red bar) and HL60 control (blue bar) cells on days 5, 6 and 7 post differentiation (n = 3, error bars = SEM; *P ≤ 0.05, **P ≤ 0.005, ***P ≤ 0.0005). ATRA: all-trans retinoic acid; SEM: standard error of mean. |
Collectively, our data demonstrate that treatment with 1 µM ATRA for 7 days induces time-dependent differentiation of HL60 promyelocytes into more mature granulocytic forms, including metamyelocytes, band cells, and segmented neutrophils, with a minor emergence of monocytic features. No morphological evidence of eosinophilic or basophilic differentiation -lineages that also originate from promyelocytes - was observed following ATRA exposure.
ATRA treatment positively correlated with granulocytes maturation markers and negatively correlated with promyelocytes immature markers
While many studies assessed cellular differentiation on the basis of either morphology or surface marker expression, our aim was to bridge phenotype and function by analyzing the correlation between ATRA-responsive surface markers and the morphological maturation stages of HL60 cells. Specifically, we performed Pearson correlation analyses between each surface marker and the proportion of morphologically defined cell subtypes. For promyelocytes (immature cells), we observed strong negative correlations with all five markers that were significantly upregulated in response to ATRA: CD15, CD45, CD38, CD11b, and HLA-DR (R = -0.8 to -0.9, P < 0.0001) (Fig. 5a). Conversely, CD13 and CD33, which were downregulated following ATRA treatment, were strongly positively correlated with the percentage of promyelocytes (R = 0.89 and 0.90, respectively; P < 0.0001) (Fig. 5a). At the metamyelocyte stage, CD15, CD45, CD38, CD11b, and HLA-DR continued to exhibit strong positive correlations (R of about 0.9, P < 0.0001) (Fig. 5b), whereas CD13 and CD33 demonstrated strong negative correlations (R = -0.86, P < 0.0001) (Fig. 5b). For mature segmented neutrophils (PMNs), CD15, CD45, CD38, CD11b, and HLA-DR again showed strong positive correlations with increasing PMN percentages (R = 0.8 to 0.9, P < 0.0001) (Fig. 5c), whereas CD13 and CD33 remained negatively correlated (R = -0.84 and -0.86, respectively; P < 0.0001) (Fig. 5c). Collectively, these findings highlight a consistent pattern: the expression of CD15, CD45, CD38, CD11b, and HLA-DR increases in parallel with the morphological maturation of HL60 cells from promyelocytes to metamyelocytes and ultimately to mature neutrophils. In contrast, CD13 and CD33 are closely associated with the immature promyelocytic phenotype and decrease with ATRA-induced differentiation.
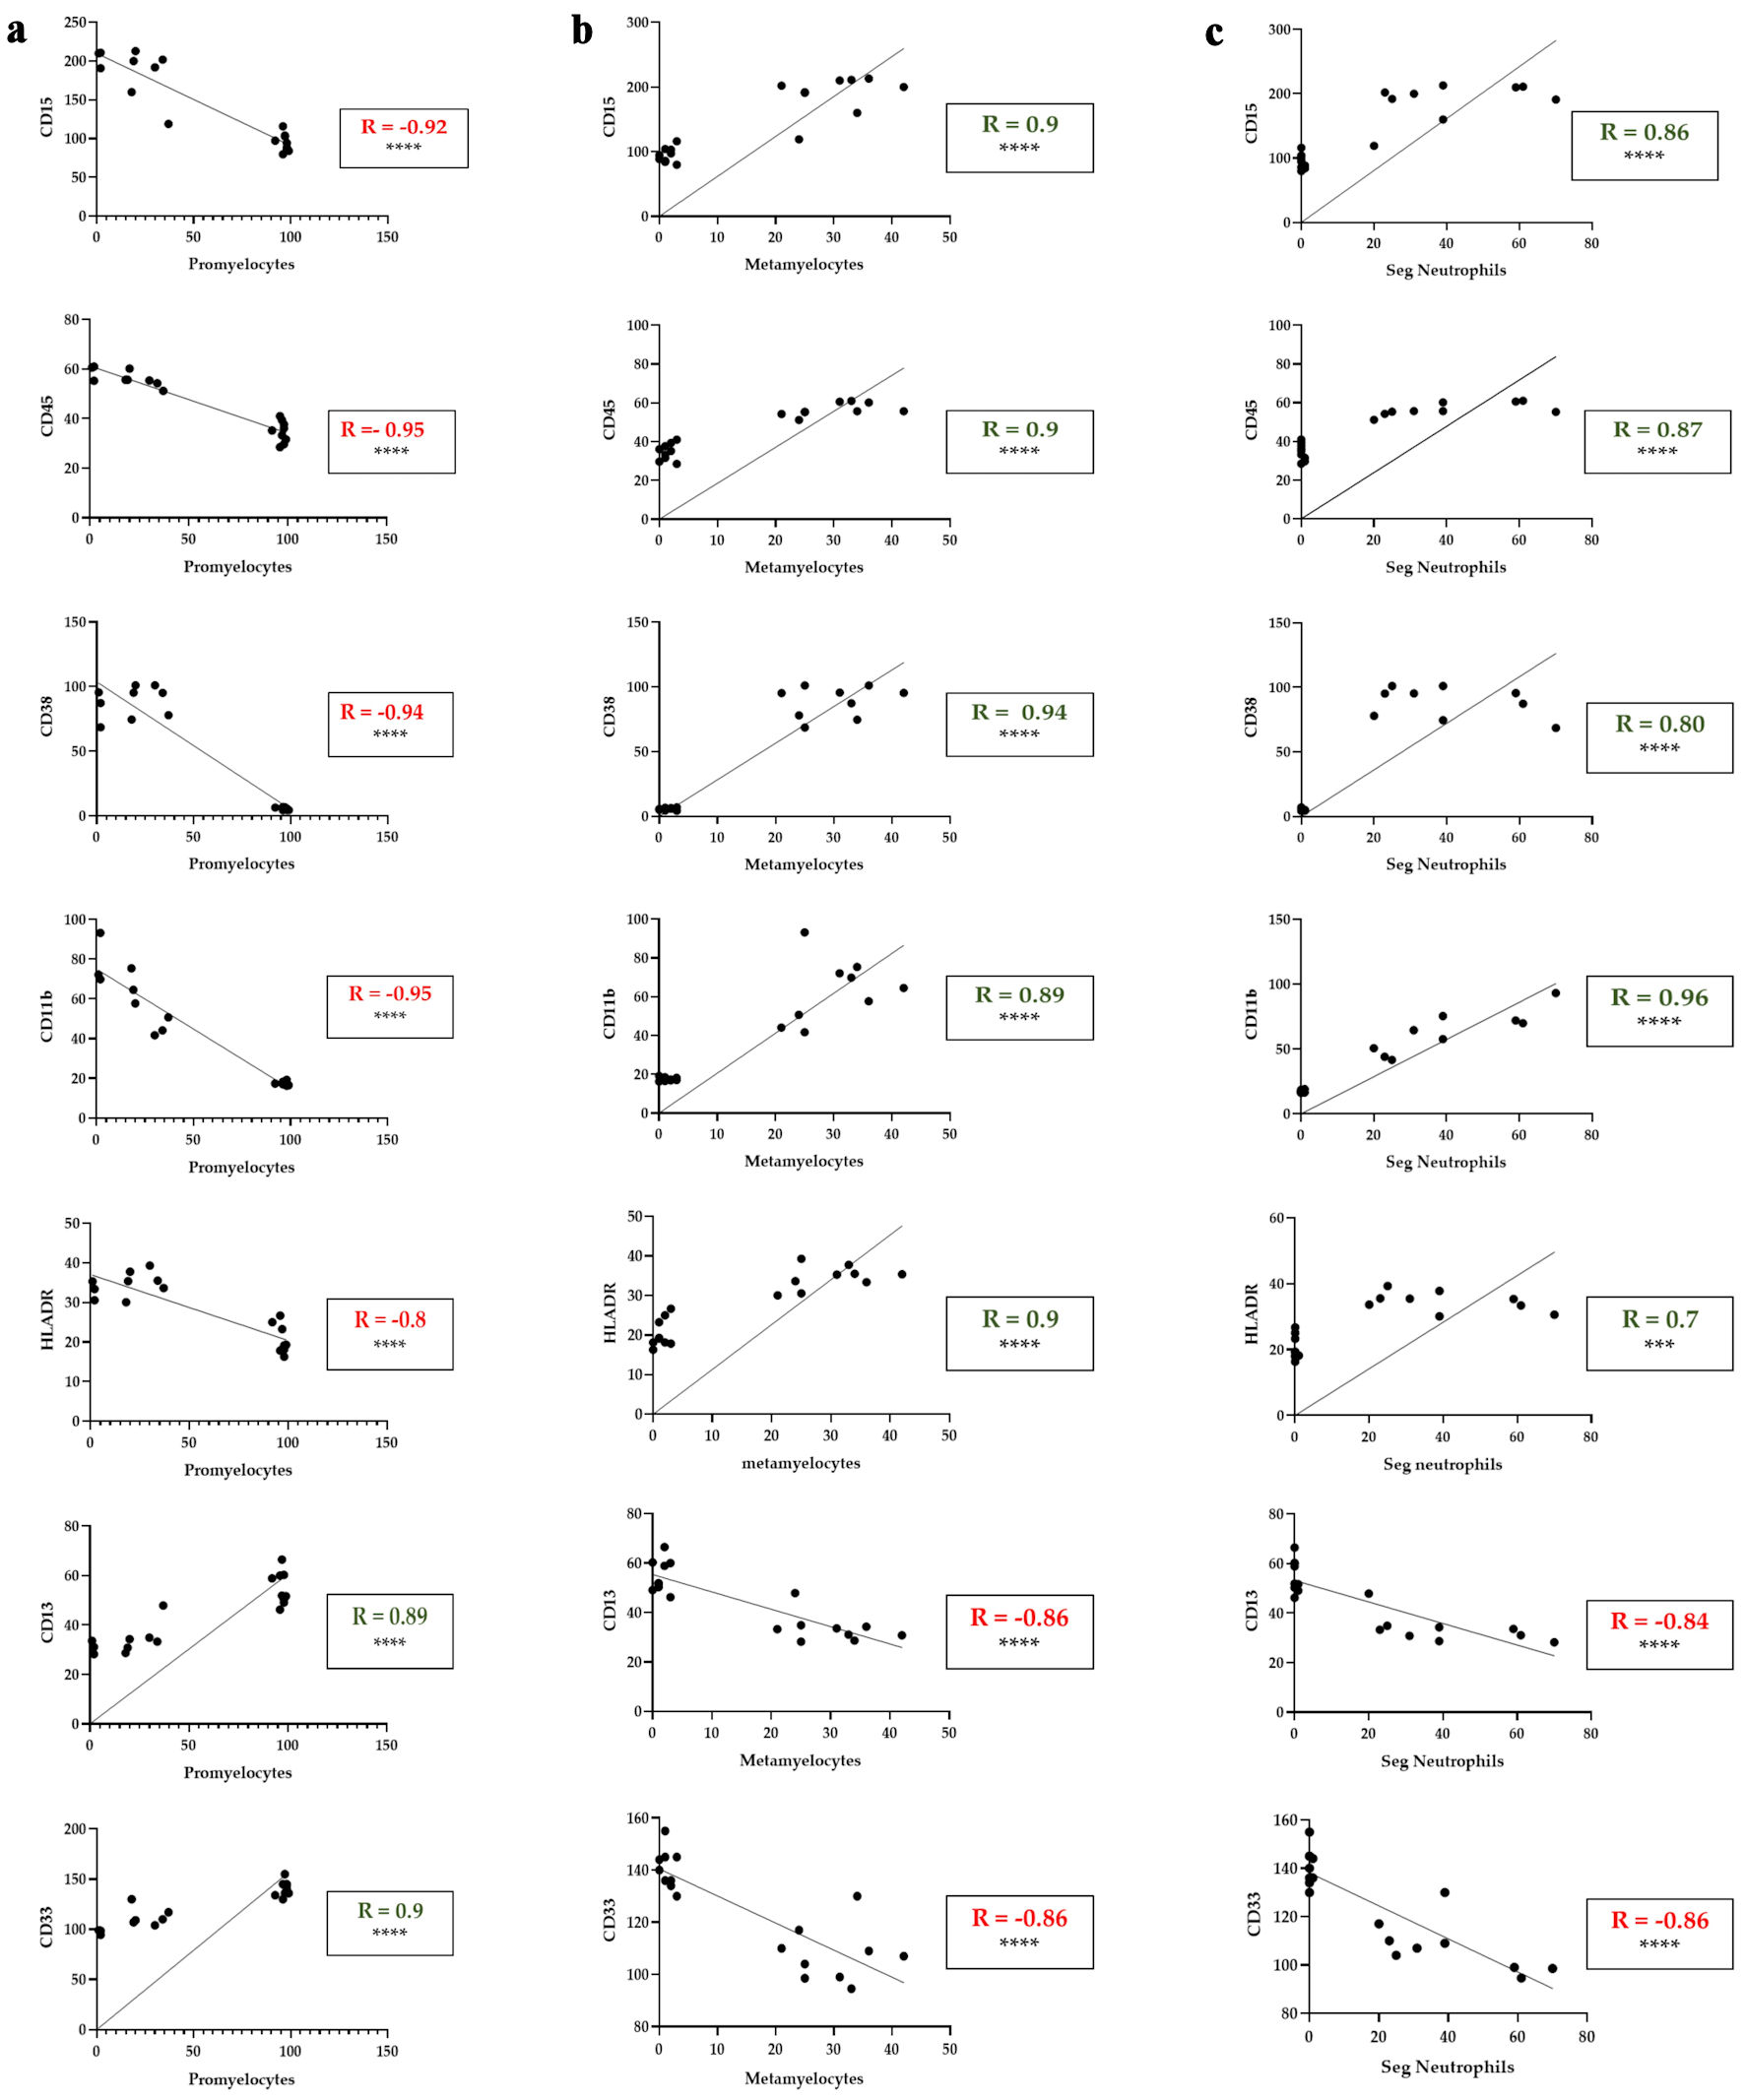 Click for large image | Figure 5. Correlation between myeloid differentiation markers and the percentage of promyelocytes, metamyelocytes and segmented neutrophils in ATRA-treated HL60 cells. (a) Correlations between CD15, CD45, CD38, CD11b, HLA-DR, CD13 and CD33 expression (MFI) and the percentage of promyelocytes with differential counts. (b) Correlations between CD15, CD45, CD38, CD11b, HLA-DR, CD13 and CD33 expression (MFI) and the percentage of metamyelocytes with differential counts. (c) Correlations between CD15, CD45, CD38, CD11b, HLA-DR, CD13 and CD33 expression (MFI) and the percentage of segmented neutrophils in the differential count. The data represent the MFI from flow cytometry (y-axis) and morphological differential counts (x-axis) from days 5, 6, and 7 of treatment. The green R values indicate positive correlations; the red R values indicate negative correlations. ***P < 0.001; ****P < 0.0001. Seg.Neutrophils: segmented neutrophils; MFI: mean fluorescence intensity; HLA: human leukocyte antigen. |
ATRA induced the mRNA expression of myeloid-specific transcription factors
Previous studies have shown that ATRA influences several myeloid-specific transcription factors at early time points. In particular, CEBPα has been described as a key target in ATRA-induced differentiation [22]. RUNX1 plays a key role in monocyte maturation by working in synergy with SPI1 to activate the M-CSFR promoter [23]. PU.1, a master transcription factor, was also shown to be upregulated in response to 1 µM ATRA in the APL cell line NB4 [24]. Therefore, we examined the mRNA levels of CEBPa, SPI1 proto-oncogene (SPI1), and runt-related transcription factor 1 (RUNX1), along with one of their downstream targets, macrophage colony-stimulating factor receptor (M-CSFR), in an attempt to explain the upregulation of HLA-DR observed via flow cytometry as a marker of monocyte activation. Continuous ATRA feeding was expected to affect the expression of these transcription factors at later time points, which is consistent with findings in the literature.
To evaluate this, RNA was extracted at days 5, 6, and 7 to assess the impact of repeated ATRA-containing media on gene expression during late differentiation. Using the delta-delta threshold cycle (ΔΔCt) method and β-actin as a housekeeping gene, we found that CEBPa, RUNX1, and SPI1 were upregulated on day 6 by approximately 3-fold, 5.6-fold, and 1-fold, respectively (Fig. 6). Notably, only RUNX1 remained upregulated on day 7, whereas M-CSFR was not significantly changed at any of the time points. These findings suggest that the observed HLA-DR upregulation and subtle morphological changes toward monocytic features may occur through mechanisms independent of M-CSFR signaling.
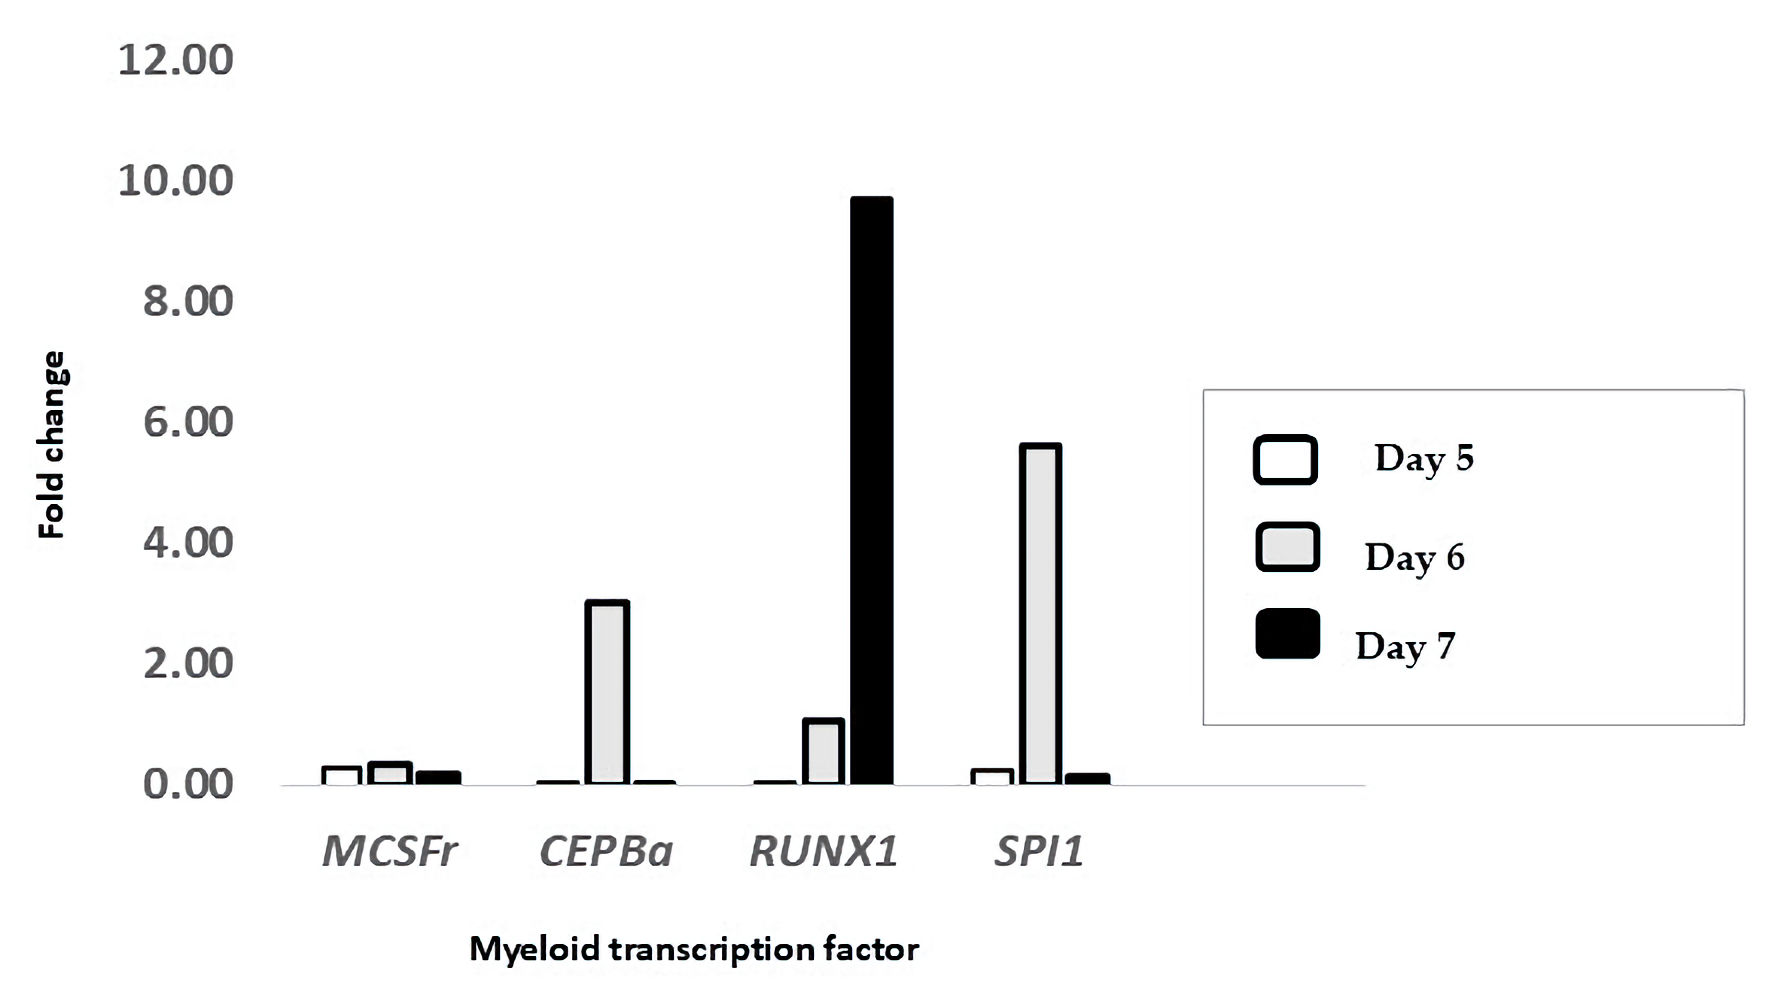 Click for large image | Figure 6. Treatment with ATRA upregulated the mRNA expression of key myeloid transcription factors. The expression levels of M-CSFR, CEBPA, RUNX1, and SPI1 were measured in HL-60 cells treated with ATRA and compared to those in untreated controls on day 5 (white bars), day 6 (gray bars), and day 7 (black bars) post-treatment. The data are presented as the fold change relative to that of untreated cells and were calculated via the ΔΔCt method using β-actin as the reference gene (n = 3). ATRA: all-trans retinoic acid; M-CSFR: macrophage colony-stimulating factor receptor; CEBPα: CCAAT/enhancer-binding protein alpha; RUNX1: runt-related transcription factor 1; SPI1: spleen focus-forming virus proviral integration oncogene (PU.1); ΔΔCt: delta-delta threshold cycle; β-actin: beta-actin. |
These findings support our hypothesis that continuous ATRA exposure enhances the expression of key differentiation transcription factors -CEBPα, RUNX1, and SPI1 - particularly by day 6, which aligns with the phenotypic transition marked by CD11b and CD15 expression. These data confirm that repeated ATRA dosing is both biologically and molecularly effective in driving the differentiation of HL60 cells toward mature granulocytes.
| Discussion | ▴Top |
Differentiation therapy represents a pivotal strategy in the treatment of AML, targeting the impaired maturation of leukemic cells while potentially reducing the toxicity associated with conventional chemotherapy. In this study, we examined the effects of ATRA on HL-60 cells using a repeated dosing regimen, in which fresh ATRA-containing RPMI medium was administered every 2 days. This continuous exposure model ensured sustained intracellular drug availability, enabling the temporal assessment of differentiation. Notably, this approach resulted in a progressive and significant upregulation of myeloid-granulocytic markers: CD15, CD45, CD11b, and CD38, beginning on day 5 and persisting through day 7. Conversely, the immaturity-associated markers CD13 and CD33 were significantly downregulated at all time points. No changes were observed in the monocytic markers CD14 and CD64, whereas HLA-DR showed a modest but consistent increase following differentiation. We also observed a shift in morphology from a homogeneous population resembling promyelocytes to a heterogeneous population resembling the physiological differential count. These changes correlated with the flow cytometric expression of myeloid markers. In addition, the mRNA expression of key transcription factors involved in myeloid differentiation, SPI1, RUNX1, and CEPBα, was notably upregulated, particularly on day 6 post-induction, corresponding to 24 h after the final administration of 1 µM ATRA. The increase in the expression of the CD15, CD45, CD11b, and CD38 markers on days 5, 6, and 7 in response to 1 µM ATRA is consistent with the findings of previous studies and indicates a transition toward myeloid maturation. The upregulation of CD11b and CD15 also implies that HL-60 cells adapt to the normal hematopoiesis process of myeloid cells [25], whereas promyelocytes exhibit low levels of CD11b and CD15. CD11b is commonly used as a myeloid marker for granulocyte differentiation [26]. The granulocytic differentiation markers CD11b and CD15 were significantly upregulated at all time points following ATRA treatment. CD15, in particular, is widely used to identify maturing myeloid cells, and its consistent increase confirms the successful induction of granulocytic differentiation [27, 28]. CD38, although not lineage specific, is a recognized marker of ATRA-induced maturation in HL60 cells [21, 29]. Its robust upregulation across all time points supports the initiation of differentiation pathways. Forward and side scatter analyses further supported these findings, revealing an apparent decrease in the R1 population, undifferentiated mononuclear cells, and an increase in the R2 population, granular multilobed cells. These morphological changes that were aligned with the immunophenotypic shifts, confirming that the HL60 promyelocyte population underwent ATRA-induced differentiation primarily into granulocytes, with minimal evidence of monocytic or intermediate-stage features.
The immunophenotype of untreated HL60 cells in our study closely resembled that of APL (AML-M3), characterized by the expression of CD13, CD15, and CD33 and the absence of HLA-DR, a marker typically expressed in AML-M2 [30]. Baseline levels of CD13hi and CD33hi in HL60 cells reflected their promyelocytic origin. However, treatment with 1 µM ATRA led to a progressive reduction in both CD13 and CD33 expression, demonstrating a strong positive correlation with promyelocytes (R = 0.89 - 0.9, P < 0.0001) and a negative correlation with more mature stages, such as metamyelocytes and neutrophils (R = -0.86, P < 0.0001). This pattern deviates from normal myelopoiesis, in which CD13 typically increases in cells undergoing maturation, whereas CD33 decreases [25]. This discrepancy likely reflects intrinsic differences between primary myeloid cells and HL60 cells, an APL-derived cell line that lacks PML-RARα translocation.
In contrast, the monocytic markers CD14 and CD64 were neither expressed at baseline nor induced by ATRA, suggesting a lack of monocytic differentiation. This finding is consistent with previous reports showing minimal expression of CD14 in HL60 cells after ATRA treatment, whereas NB4 cells presented greater monocytic marker induction under similar conditions [32, 33]. Despite the absence of CD14 and CD64, we observed a 2.3% increase in morphologically defined monocytes by day 7, which may be linked to the modest upregulation of HLA-DR, a marker found on both granulocytes and monocytes [33, 34]. Interestingly, HLA-DR expression, although low at baseline, increased slightly but significantly with ATRA treatment. While HLA-DR is not typically associated with granulocytic lineages, its expression has been reported to increase following stimulation with cytokines such as granulocyte-macrophage colony-stimulating factor (GM-CSF) [35]. CD34, a marker of hematopoietic progenitors, remained undetectable at baseline and was unaffected by ATRA treatment. These findings confirm the lack of stem-like features in HL60 cells and support the idea that HL-60 cells undergo differentiation following ATRA treatment. The homogenous population of HL60 cells transitioned into a heterogeneous population comprising mature cell stages, including neutrophils, metamyelocytes, and monocytes. This shift mimics the distribution observed in normal myelopoiesis. Notably, treatment of HL-60 cells with ATRA had no clear effect on the number of mitotic figures, suggesting that cellular proliferation remained active despite differentiation. These findings are consistent with previous studies demonstrating that HL60 cells, when treated with 1 µM ATRA for 96 h, undergo morphological changes indicating maturation [36]. To guide drug assessment, we analyzed which immunophenotypic markers of differentiation correlated with specific morphological changes. Morphological evaluation of Giemsa-stained HL60 cells revealed a pattern of granulocytic maturation that closely mirrored the immunophenotypic profile detected by flow cytometry, as confirmed through correlation analysis. A marked decrease in the percentage of promyelocytes from > 95% to < 1% over 7 days significantly correlated with the downregulation of the immaturity-associated markers CD13 and CD33. Simultaneously, the increase in metamyelocytes, band cells, and segmented neutrophils corresponded with the progressive increase in the expression of differentiation markers, including CD15, CD11b, CD45, and CD38. Notably, a transient increase in band cells was observed on day 5, followed by a shift toward PMNs by day 7. This stagewise transition - from promyelocytes to metamyelocytes, then bands, and finally segmented neutrophils - recapitulates physiological granulopoiesis and demonstrates that HL60 cells can mimic normal myeloid maturation under ATRA stimulation. This progression was further supported by the temporal upregulation of CD11b and CD15, markers indicative of terminal granulocytic differentiation. As previously reported, tracking antigen expression over time, particularly that of markers such as CD11b, CD14, and CD15, provides a robust method to monitor whether leukemic blasts are maturing in response to therapy [37].
The limited emergence of monocytes (about 2%) and the absence of CD14/CD64 expression suggest that the impact of ATRA on HL60 cells is largely restricted to the granulocytic lineage, with minimal monocytic differentiation. Similarly, the presence of a small, stable population of mitotic cells throughout treatment indicates that proliferation is not fully arrested during differentiation, which is consistent with the known ability of ATRA to induce maturation without necessarily inducing cell cycle exit at the early stage.
Understanding the relationship between surface marker expression and morphological changes during ATRA-induced differentiation offers valuable insight for optimizing treatment strategies, particularly in cases of APL lacking the PML-RARα translocation, such as HL-60 cells, and for guiding the development of future combination therapies. Moreover, the observed correlation between immunophenotypic shifts and morphological progression supports the conclusion that the changes were attributable to differentiation rather than to the cytotoxic effects of the drug. The above hypothesis was supported by very subtle changes in 7ADDs observed in ATRA-treated HL60 cells.
Our data provide mechanistic insights into the effect of ATRA on HL-60 cells, confirming that the myeloid-specific transcription factors CEBPα, SPI1, and RUNX1, which act cooperatively to promote granulocytic and monocytic differentiation [38, 39], were all upregulated in response to 1 µM ATRA. CEBPα was significantly upregulated on day 6 post-treatment. This delayed response is consistent with previous reports in primary APL samples and may be attributed to the relatively low RARα expression in HL-60 cells. In contrast, earlier CEBPα induction is observed in other cell lines, such as KG-1, which have higher RARα levels [40]. Mueller et al (2006) demonstrated that ATRA restored differentiation in t(15;17)-positive APLs through PU.1 upregulation, where CEBPα binds to the PU.1 promoter region [41]. RUNX1, also known as AML1, has been shown to play a compensatory role when PU.1 is downregulated in AML. Under these conditions, RUNX1 may support leukemogenesis by triggering autophagy-based survival programs instead of relying on growth factor-mediated signaling [42]. Taken together, the observed upregulation of SPI1, CEBPα, and RUNX1 supports their role in mediating ATRA-induced differentiation, particularly under repeated dosing in HL-60 cells lacking the PML-RARα fusion.
While our study focused on ATRA-induced differentiation in HL60 cells, there is increasing evidence that the therapeutic potential of ATRA extends to other leukemia models, including chronic myeloid leukemia (CML). Notably, ATRA has shown efficacy in the CML cell line KCL-22 M, which harbors a mutation in the BCR-ABL fusion gene following tyrosine kinase inhibitor (TKI) resistance [24]. Wang et al demonstrated that ATRA can inhibit the emergence of such mutations, partly by upregulating CD38, a differentiation marker with NADase enzymatic activity [43]. Reduced CD38 expression has been implicated in disease progression from the chronic phase to the accelerated phase of CML, highlighting its functional significance.
In summary, the present study evaluated the impact of ATRA on the HL60 leukemia cell line and demonstrated that repeated and sequential ATRA dosing upregulated myeloid-granulocytic differentiation markers (CD15, CD45, CD11b, and CD38) and downregulated immature markers (CD13 and CD33), with minimal monocytic differentiation (CD14 and CD64) observed. Morphological testing revealed a clear shift from undifferentiated to granulocytic cells, indicating the myelopoiesis process. Immunophenotypic shifts are correlated with morphological changes, inferring differentiation rather than cytotoxicity. Here, we demonstrated that the expression of surface markers in cells is correlated with morphological changes during ATRA-induced differentiation in an APL cell model at multiple time points. These findings suggest that ATRA directs HL60 differentiation toward normal granulopoiesis, highlighting its potential use as a therapeutic candidate in differentiation-based AML treatment strategies.
| Supplementary Material | ▴Top |
Suppl 1. The primer sequences and PCR settings used for qRT-PCR.
Suppl 2. Monocytic differentiation of HL-60 cells induced by ATRA.
Suppl 3. Morphological analysis of HL60 cells treated with ATRA over three time points.
Acknowledgments
This project was funded by the Deanship of Scientific Research (DSR) at King Abdulaziz University, Jeddah, under grant no. RG-2-141-38. The authors, therefore, acknowledge and thank DSR for its technical and financial support.
Financial Disclosure
This project was funded by the Deanship of Scientific Research (DSR) at King Abdulaziz University, Jeddah, under grant no. RG-2-141-38.
Conflict of Interest
The authors declare that they have no conflict of interest.
Informed Consent
Not applicable.
Author Contributions
Conceptualization: H.A.S.; methodology: F.A. and N.A.; validation: H.T., R.A.S. and R.F.; formal analysis: H.A.S., N.A. and F.A.; investigation: H.A.S., N.A. and F.A.; resources: A.W.N., R.F. and H.T.; data curation: E.B.Y.; writing - original draft preparation: H.A.S., H.T. and E.B.Y.; writing - review and editing: R.K. and E.B.Y., R.A.S.; visualization: R.K. and R.A.S.; supervision: H.A.S. and A.W.N.; project administration: H.A.S.; funding acquisition: H.A.S. All the authors have read and agreed to the published version of the manuscript.
Data Availability
The authors declare that data supporting the findings of this study are available within the article.
| References | ▴Top |
- Zipfel PF, Skerka C. From magic bullets to modern therapeutics: Paul Ehrlich, the German immunobiologist and physician coined the term 'complement'. Mol Immunol. 2022;150:90-98.
doi pubmed - Acute Myeloid Leukemia (AML) Survival. 2024. Available from: https://www.cancerresearchuk.org/about-cancer/acute-myeloid-leukaemia-aml/survival.
- Wikramanayake TC, Haberland NI, Akhundlu A, Laboy Nieves A, Miteva M. Prevention and treatment of chemotherapy-induced alopecia: what is available and what is coming? Curr Oncol. 2023;30(4):3609-3626.
doi pubmed - Kuley-Bagheri Y, Kreuzer KA, Monsef I, Lubbert M, Skoetz N. Effects of all-trans retinoic acid (ATRA) in addition to chemotherapy for adults with acute myeloid leukaemia (AML) (non-acute promyelocytic leukaemia (non-APL)). Cochrane Database Syst Rev. 2018;8(8):CD011960.
doi pubmed - Borrow J, Goddard AD, Sheer D, Solomon E. Molecular analysis of acute promyelocytic leukemia breakpoint cluster region on chromosome 17. Science. 1990;249(4976):1577-1580.
doi pubmed - de The H, Lavau C, Marchio A, Chomienne C, Degos L, Dejean A. The PML-RAR alpha fusion mRNA generated by the t(15;17) translocation in acute promyelocytic leukemia encodes a functionally altered RAR. Cell. 1991;66(4):675-684.
doi pubmed - Gallagher R, Collins S, Trujillo J, McCredie K, Ahearn M, Tsai S, Metzgar R, et al. Characterization of the continuous, differentiating myeloid cell line (HL-60) from a patient with acute promyelocytic leukemia. Blood. 1979;54(3):713-733.
pubmed - Skopek R, Palusinska M, Kaczor-Keller K, Pingwara R, Papierniak-Wygladala A, Schenk T, Lewicki S, et al. Choosing the right cell line for acute myeloid leukemia (AML) research. Int J Mol Sci. 2023;24(6).
doi pubmed - Sak K, Everaus H. Established human cell lines as models to study anti-leukemic effects of flavonoids. Curr Genomics. 2017;18(1):3-26.
doi pubmed - Kwa FAA, Cole-Sinclair MF, Kapuscinski MK. Combination treatment of p53-Null HL-60 cells with histone deacetylase inhibitors and chlorambucil augments apoptosis and increases BCL6 and p21 gene expression. Curr Mol Pharmacol. 2019;12(1):72-81.
doi pubmed - Collins SJ, Robertson KA, Mueller L. Retinoic acid-induced granulocytic differentiation of HL-60 myeloid leukemia cells is mediated directly through the retinoic acid receptor (RAR-alpha). Mol Cell Biol. 1990;10(5):2154-2163.
doi pubmed - Nervi C, Grippo JF, Sherman MI, George MD, Jetten AM. Identification and characterization of nuclear retinoic acid-binding activity in human myeloblastic leukemia HL-60 cells. Proc Natl Acad Sci U S A. 1989;86(15):5854-5858.
doi pubmed - Lemons RS, Eilender D, Waldmann RA, Rebentisch M, Frej AK, Ledbetter DH, Willman C, et al. Cloning and characterization of the t(15;17) translocation breakpoint region in acute promyelocytic leukemia. Genes Chromosomes Cancer. 1990;2(2):79-87.
doi pubmed - Liquori A, Ibanez M, Sargas C, Sanz MA, Barragan E, Cervera J. Acute promyelocytic leukemia: a constellation of molecular events around a single PML-RARA fusion gene. Cancers (Basel). 2020;12(3):624.
doi pubmed - Jia JB, Wang WQ, Sun HC, Zhu XD, Liu L, Zhuang PY, Zhang JB, et al. High expression of macrophage colony-stimulating factor-1 receptor in peritumoral liver tissue is associated with poor outcome in hepatocellular carcinoma after curative resection. Oncologist. 2010;15(7):732-743.
doi pubmed - Freitas D, Campos D, Gomes J, Pinto F, Macedo JA, Matos R, Mereiter S, et al. O-glycans truncation modulates gastric cancer cell signaling and transcription leading to a more aggressive phenotype. EBioMedicine. 2019;40:349-362.
doi pubmed - Freisinger E, Cramer C, Xia X, Murthy SN, Slakey DP, Chiu E, Newsome ER, et al. Characterization of hematopoietic potential of mesenchymal stem cells. J Cell Physiol. 2010;225(3):888-897.
doi pubmed - Avellino R, Havermans M, Erpelinck C, Sanders MA, Hoogenboezem R, van de Werken HJ, Rombouts E, et al. An autonomous CEBPA enhancer specific for myeloid-lineage priming and neutrophilic differentiation. Blood. 2016;127(24):2991-3003.
doi pubmed - Zembruski NC, Stache V, Haefeli WE, Weiss J. 7-Aminoactinomycin D for apoptosis staining in flow cytometry. Anal Biochem. 2012;429(1):79-81.
doi pubmed - Dimberg A, Bahram F, Karlberg I, Larsson LG, Nilsson K, Oberg F. Retinoic acid-induced cell cycle arrest of human myeloid cell lines is associated with sequential down-regulation of c-Myc and cyclin E and posttranscriptional up-regulation of p27(Kip1). Blood. 2002;99(6):2199-2206.
doi pubmed - Congleton J, Jiang H, Malavasi F, Lin H, Yen A. ATRA-induced HL-60 myeloid leukemia cell differentiation depends on the CD38 cytosolic tail needed for membrane localization, but CD38 enzymatic activity is unnecessary. Exp Cell Res. 2011;317(7):910-919.
doi pubmed - Park DJ, Chumakov AM, Vuong PT, Chih DY, Gombart AF, Miller WH, Jr., Koeffler HP. CCAAT/enhancer binding protein epsilon is a potential retinoid target gene in acute promyelocytic leukemia treatment. J Clin Invest. 1999;103(10):1399-1408.
doi pubmed - Himes SR, Cronau S, Mulford C, Hume DA. The Runx1 transcription factor controls CSF-1-dependent and -independent growth and survival of macrophages. Oncogene. 2005;24(34):5278-5286.
doi pubmed - Albanesi J, Noguera NI, Banella C, Colangelo T, De Marinis E, Leone S, Palumbo O, et al. Transcriptional and metabolic dissection of ATRA-induced granulocytic differentiation in NB4 acute promyelocytic leukemia cells. Cells. 2020;9(11).
doi pubmed - van Lochem EG, van der Velden VH, Wind HK, te Marvelde JG, Westerdaal NA, van Dongen JJ. Immunophenotypic differentiation patterns of normal hematopoiesis in human bone marrow: reference patterns for age-related changes and disease-induced shifts. Cytometry B Clin Cytom. 2004;60(1):1-13.
doi pubmed - Barber N, Belov L, Christopherson RI. All-trans retinoic acid induces different immunophenotypic changes on human HL60 and NB4 myeloid leukaemias. Leuk Res. 2008;32(2):315-322.
doi pubmed - Guo Y, Gao F, Wang Q, Wang K, Pan S, Pan Z, Xu S, et al. Differentiation of HL-60 cells in serum-free hematopoietic cell media enhances the production of neutrophil extracellular traps. Exp Ther Med. 2021;21(4):353.
doi pubmed - Gadhoum SZ, Sackstein R. CD15 expression in human myeloid cell differentiation is regulated by sialidase activity. Nat Chem Biol. 2008;4(12):751-757.
doi pubmed - MacDonald RJ, Shrimp JH, Jiang H, Zhang L, Lin H, Yen A. Probing the requirement for CD38 in retinoic acid-induced HL-60 cell differentiation with a small molecule dimerizer and genetic knockout. Sci Rep. 2017;7(1):17406.
doi pubmed - Plesa A, et al. Diagnostics of the AML with immunophenotypical data. Math Model Nat Phenom. 2006;1(2):104-123.
- Trayner ID, Bustorff T, Etches AE, Mufti GJ, Foss Y, Farzaneh F. Changes in antigen expression on differentiating HL60 cells treated with dimethylsulphoxide, all-trans retinoic acid, alpha1,25-dihydroxyvitamin D3 or 12-O-tetradecanoyl phorbol-13-acetate. Leuk Res. 1998;22(6):537-547.
doi pubmed - Hsu H, Lin YC, Tsai W. 3086 - apoptotic cells-derived CD14(+) microparticles promote the phagocytic activity of neutrophilic precursor cells in the phagocytosis of apoptotic cells. Experimental Hematology. 2023;124:S93.
- Quirant-Sanchez B, Plans-Galvan O, Lucas E, Argudo E, Martinez-Caceres EM, Armestar F. HLA-DR expression on monocytes and sepsis index are useful in predicting sepsis. Biomedicines. 2023;11(7).
doi pubmed - Davis RE, Sharma S, Conceicao J, Carneiro P, Novais F, Scott P, Sundar S, et al. Phenotypic and functional characteristics of HLA-DR(+) neutrophils in Brazilians with cutaneous leishmaniasis. J Leukoc Biol. 2017;101(3):739-749.
doi pubmed - Zhan Y, Lew AM, Chopin M. The pleiotropic effects of the GM-CSF rheostat on myeloid cell differentiation and function: more than a numbers game. Front Immunol. 2019;10:2679.
doi pubmed - Gu J, Zhu X, Li Y, Dong D, Yao J, Lin C, Huang K, et al. miRNA-21 regulates arsenic-induced anti-leukemia activity in myelogenous cell lines. Med Oncol. 2011;28(1):211-218.
doi pubmed - Craig FE, Foon KA. Flow cytometric immunophenotyping for hematologic neoplasms. Blood. 2008;111(8):3941-3967.
doi pubmed - Oakford PC, James SR, Qadi A, West AC, Ray SN, Bert AG, Cockerill PN, et al. Transcriptional and epigenetic regulation of the GM-CSF promoter by RUNX1. Leuk Res. 2010;34(9):1203-1213.
doi pubmed - Imperato MR, Cauchy P, Obier N, Bonifer C. The RUNX1-PU.1 axis in the control of hematopoiesis. Int J Hematol. 2015;101(4):319-329.
doi pubmed - Marchwicka A, Marcinkowska E. Regulation of expression of CEBP genes by variably expressed vitamin d receptor and retinoic acid receptor alpha in human acute myeloid leukemia cell lines. Int J Mol Sci. 2018;19(7).
doi pubmed - Mueller BU, Pabst T, Fos J, Petkovic V, Fey MF, Asou N, Buergi U, et al. ATRA resolves the differentiation block in t(15;17) acute myeloid leukemia by restoring PU.1 expression. Blood. 2006;107(8):3330-3338.
doi pubmed - Bender A, Boydere F, Jayavelu AK, Tibello A, Konig T, Aleth H, Meyer Zu Horste G, et al. Redistribution of PU.1 partner transcription factor RUNX1 binding secures cell survival during leukemogenesis. EMBO J. 2024;43(24):6291-6309.
doi pubmed - Wang Z, Liu Z, Wu X, Chu S, Wang J, Yuan H, Roth M, et al. ATRA-induced cellular differentiation and CD38 expression inhibits acquisition of BCR-ABL mutations for CML acquired resistance. PLoS Genet. 2014;10(6):e1004414.
doi pubmed
This article is distributed under the terms of the Creative Commons Attribution Non-Commercial 4.0 International License, which permits unrestricted non-commercial use, distribution, and reproduction in any medium, provided the original work is properly cited.
World Journal of Oncology is published by Elmer Press Inc.