Figures
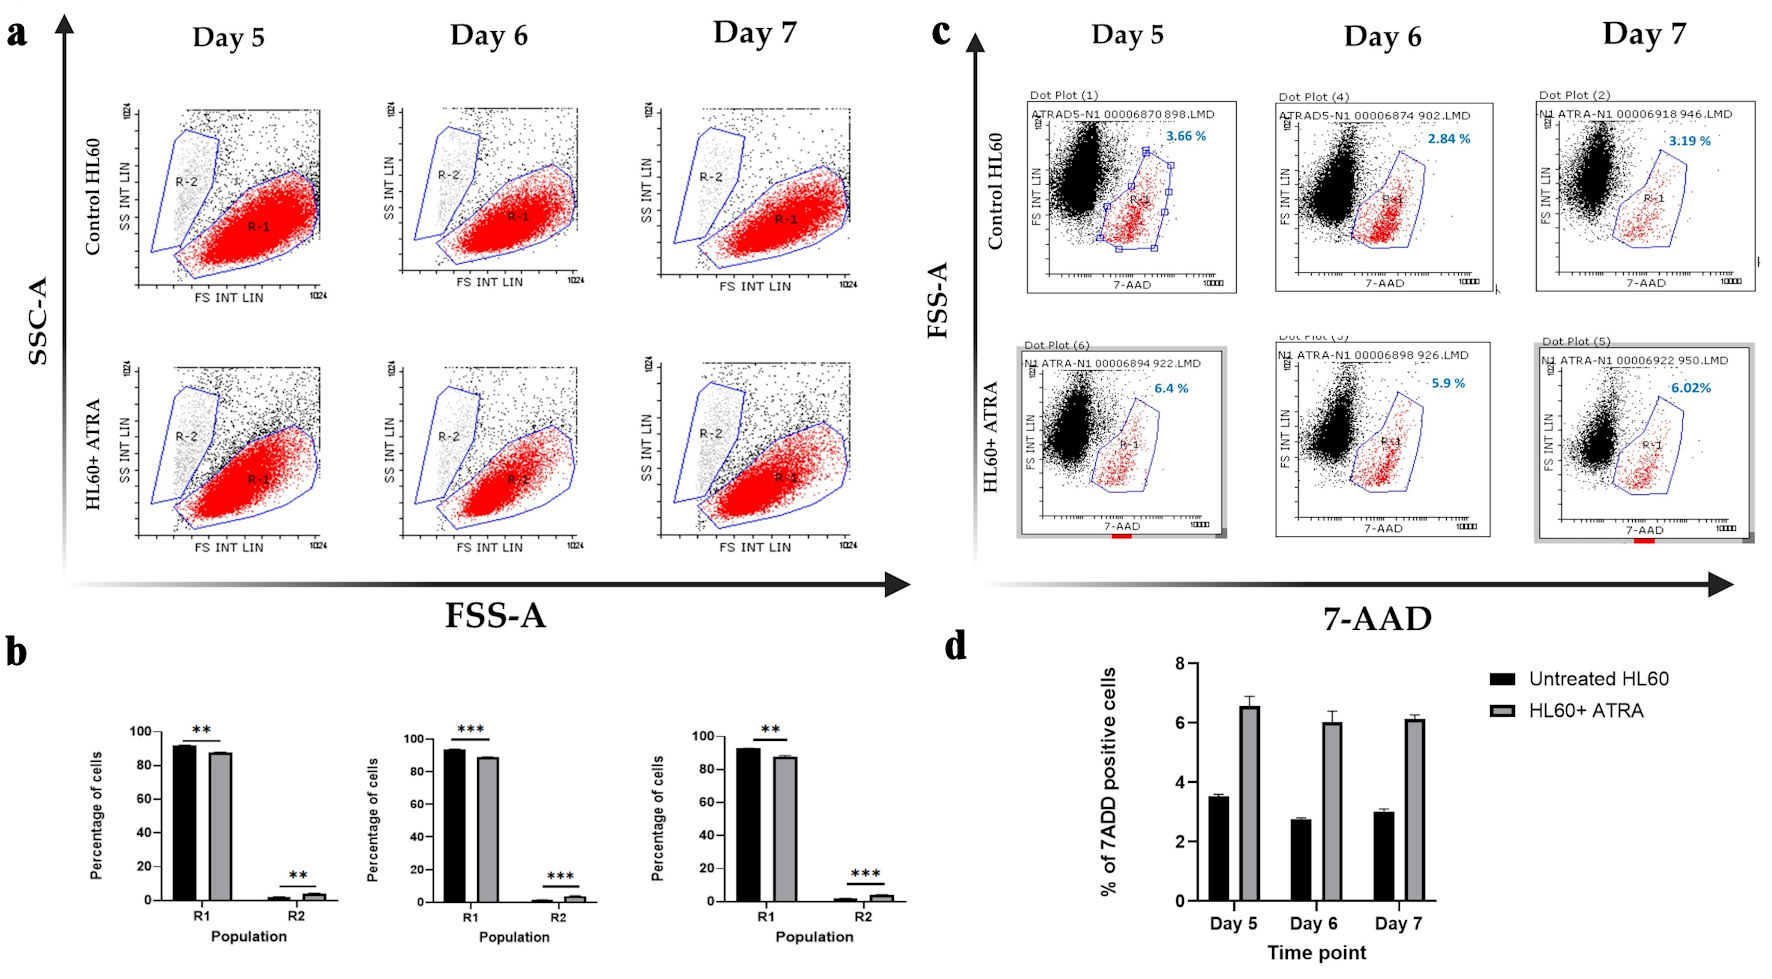
↓ Figure 1. Dot plot analysis of HL-60 cell
populations following ATRA treatment. (a) Representative dot plots showing R1 (red; immature cells) and
R2 (gray; mature cells) populations in untreated HL-60 control cells (top row) and ATRA-treated HL-60
cells (bottom row). (b) Mean percentages of R1 and R2 populations in untreated control HL-60 cells
(black bars) and ATRA-treated cells (gray bars). Data represent n = 3; error bars indicate the standard
error of the mean (SEM). Statistical significance is denoted as **P ≤ 0.05, and ***P ≤
0.005. (c) Representative dot plots showing 7-AAD-negative (viable) and 7-AAD-positive (nonviable; red)
cell populations in HL-60 control cells (top row) and ATRA-treated HL-60 cells (bottom row). The
percentage of 7-AAD-positive cells is shown in blue above the gate. (d) Mean percentage of
7-AAD-positive cells in untreated control HL-60 cells (black bars) and ATRA-treated cells (gray bars).
Data represent n = 3; error bars indicate SEM. SSC-A: side scatter area; FSC-A: forward scatter area;
7-AAD: 7-aminoactinomycin D; ATRA: all-trans retinoic acid.
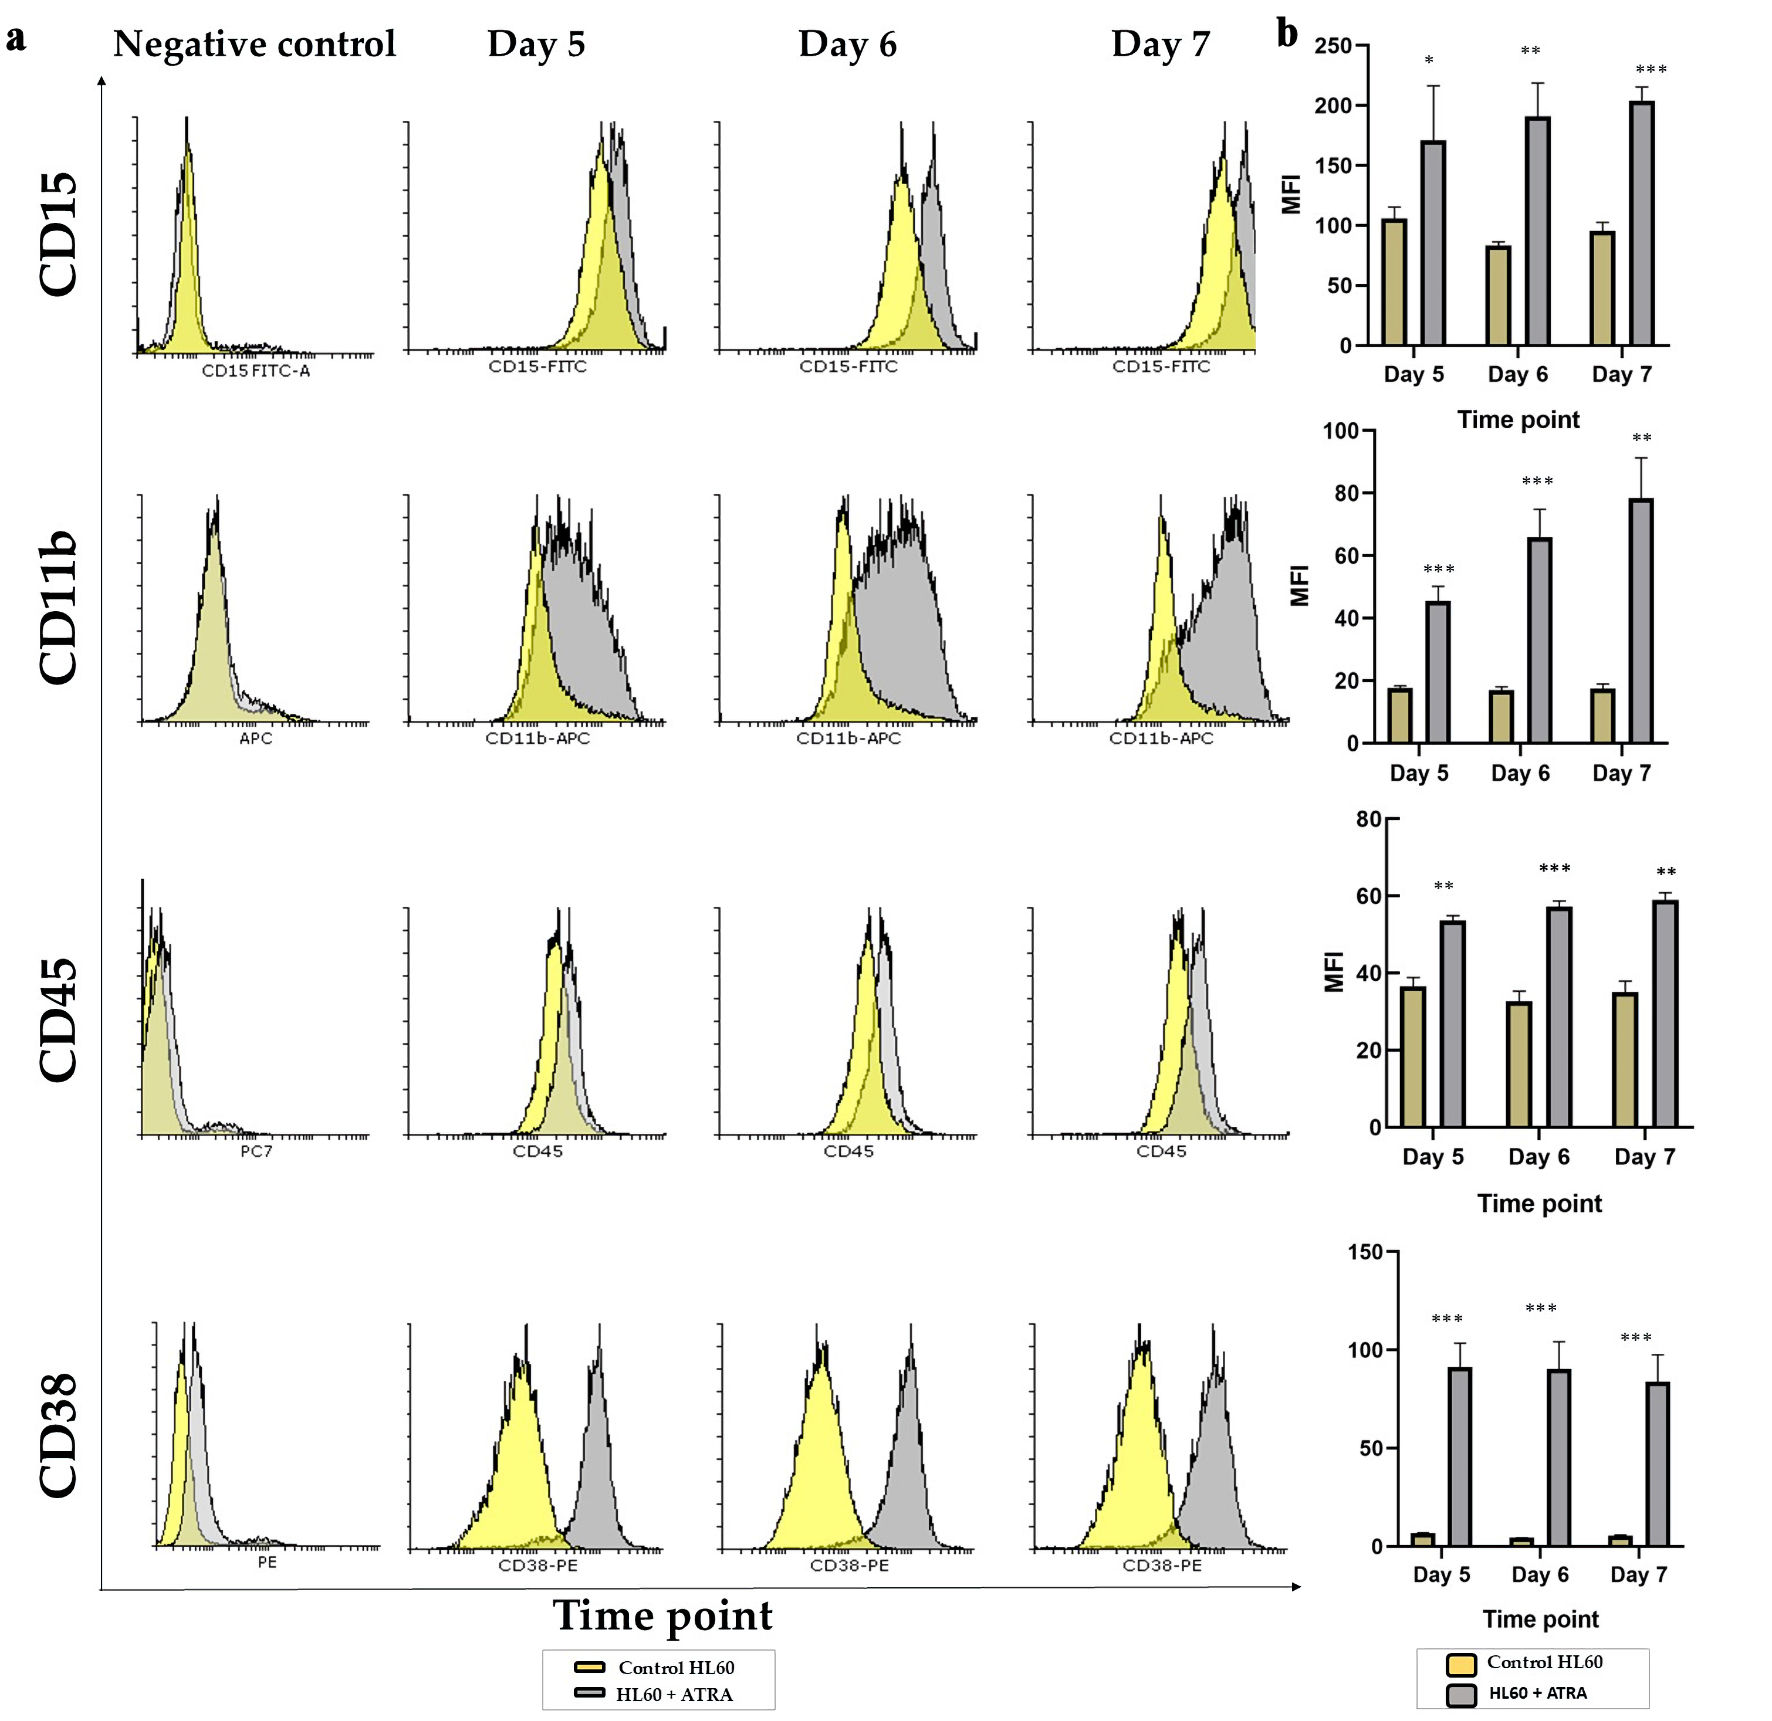
↓ Figure 2. Analysis of the granulocytic
maturation of HL60 leukemia cells following ATRA induction: (a) Representative overlay histogram plots
of CD15, CD11b, CD45 and CD38 markers on day 5 (left panel), day 6 (middle panel) and day 7 (right
panel) comparing the ATRA-treated HL60 cells (gray shading) to untreated controls (yellow shading). All
negative controls are represented by an overlay histogram of the MFI of control HL60- and ATRA-treated
cells in the no-antibody control. (b) MFI for the same markers in ATRA-treated HL60 for either 5 days, 6
days or 7 days (gray bar) or the control HL60 (yellow bar) n = 3, error bars = SEM; *P ≤ 0.05,
**P ≤ 0.005, ***P ≤ 0.0005. ATRA: all-trans retinoic acid; SEM: standard error of mean;
MFI: mean fluorescence intensity.
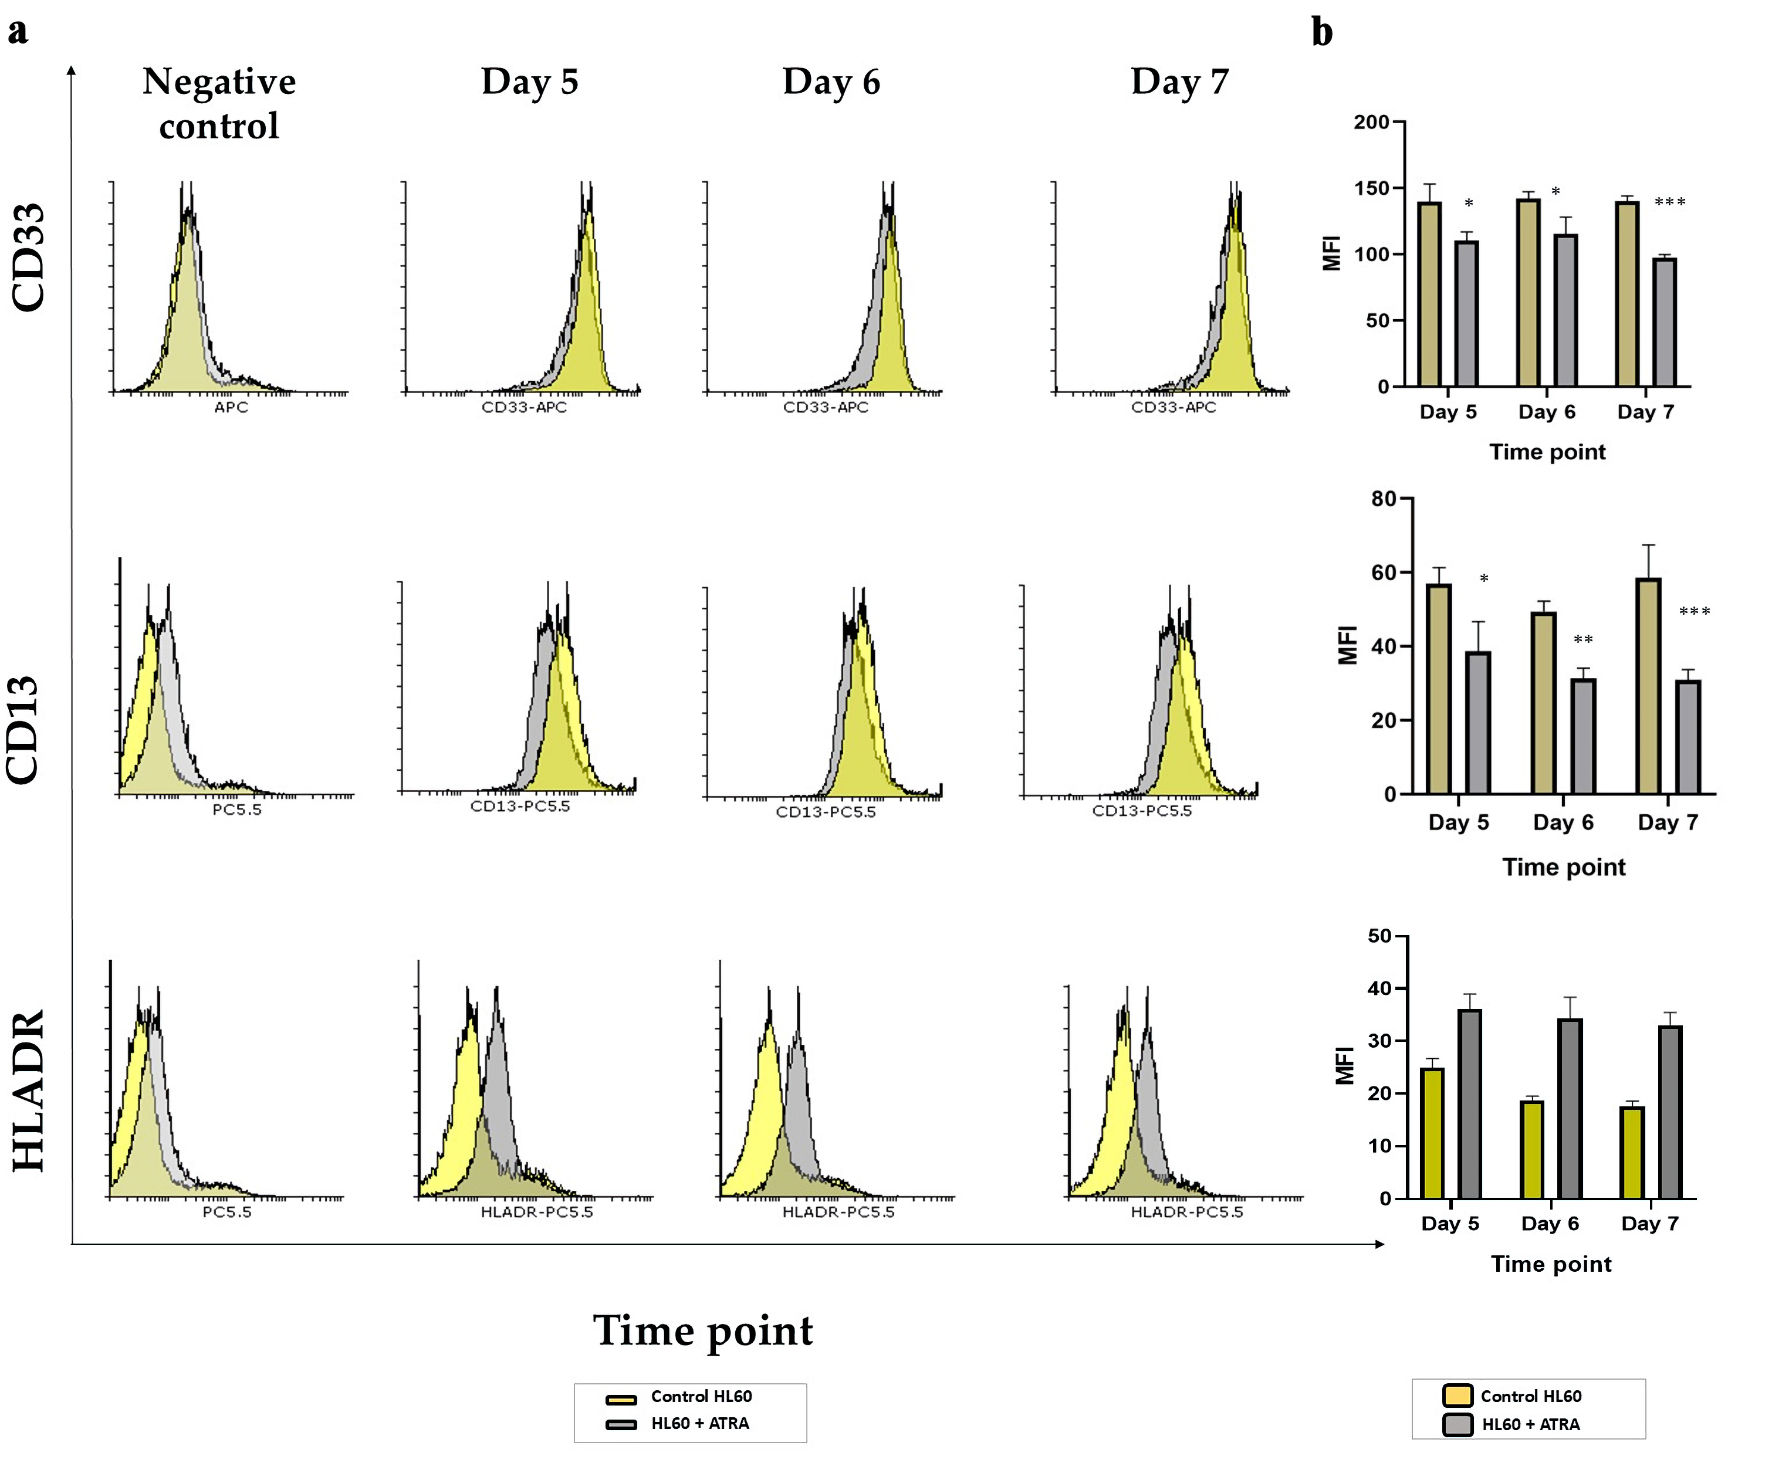
↓ Figure 3. Analysis of markers of immaturity in
HL60 leukemia cells following ATRA induction: (a) Representative histogram plots of CD13, CD33 and
HLA-DR markers on day 5 (second panel), day 6 (third panel) and day 7 (right panel) comparing the
ATRA-treated HL60 cells (gray shading) to untreated controls (yellow shading). All negative controls
(left panel) represent an overlay histogram of the MFI of the HL60 control and ATRA-treated non-Ab
control; (b) MFI for the same markers in ATRA-treated HL60 for either 5 days, 6 days or 7 days (gray
bar) or the control HL60 (yellow bar) n = 3, error bars = SEM; *P ≤ 0.05, **P ≤ 0.005,
***P ≤ 0.0005. ATRA: all-trans retinoic acid; HLA: human leukocyte antigen; SEM: standard error
of mean; MFI: mean fluorescence intensity.
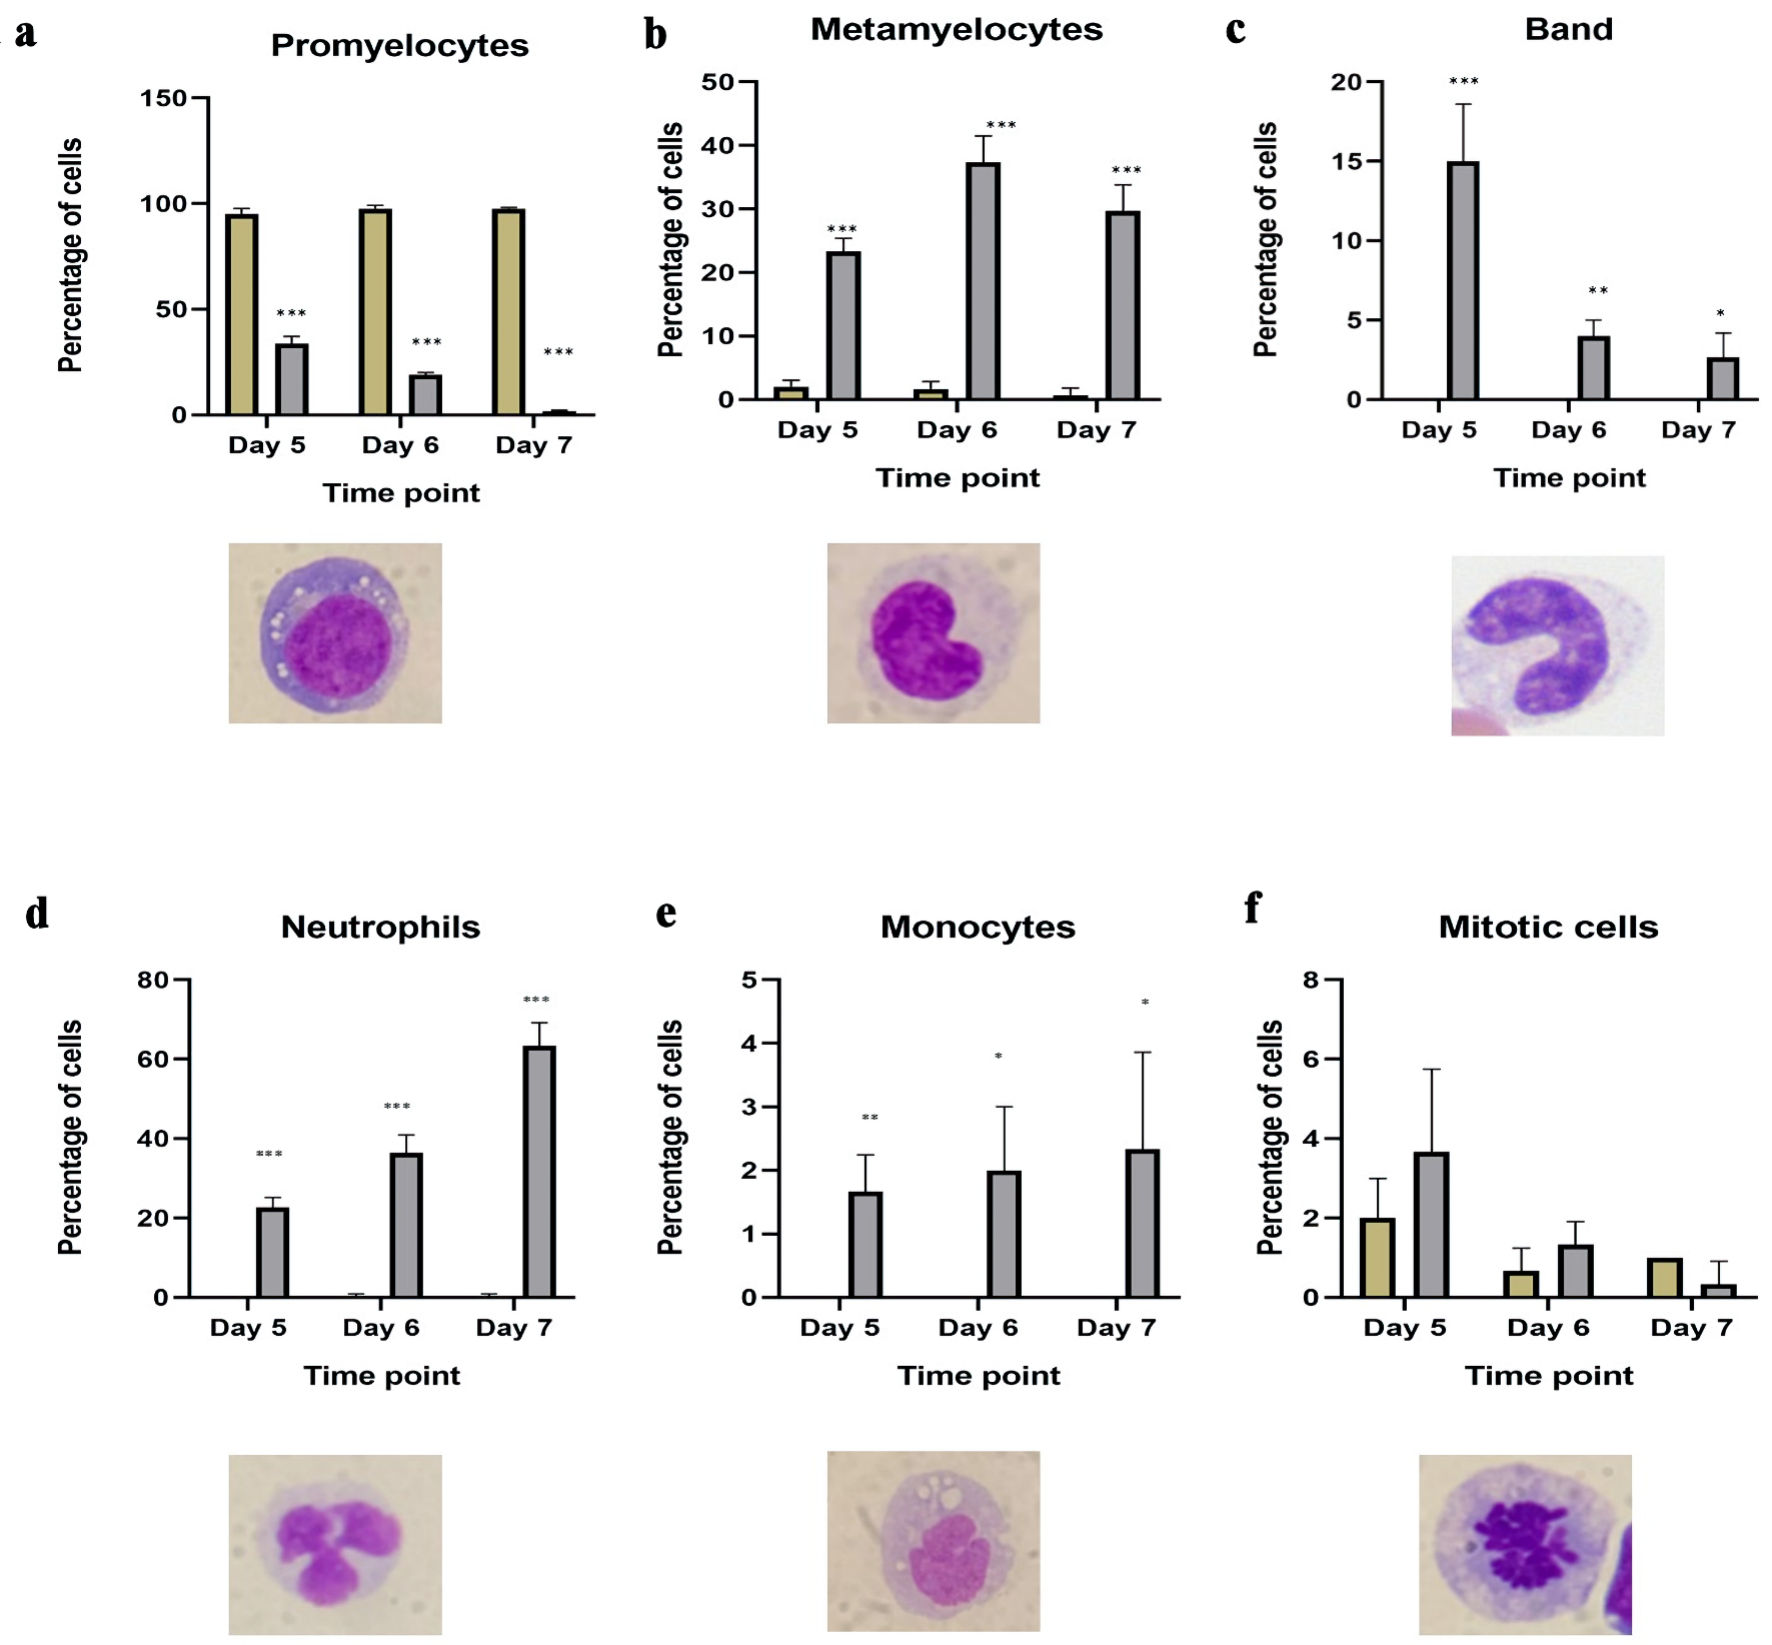
↓ Figure 4. Morphological changes in HL60 cells
from ATRA-treated HL60 cells. Number of granulocytic mature cells, including (a) promyelocytes; (b)
metamyelocytes; (c) bands; (d) segmented neutrophils in untreated HL60 (blue bar) and ATRA-treated (red
bar) cells on days 5, 6 and 7 post differentiation; (e) number of monocytes in ATRA-treated cells (red
bar) and control HL60 (blue bar) cells on days 5, 6 and 7 post differentiation; (f) number of mitotic
cells showing the impact of ATRA on proliferation in ATRA-treated cells (red bar) and HL60 control (blue
bar) cells on days 5, 6 and 7 post differentiation (n = 3, error bars = SEM; *P ≤ 0.05, **P
≤ 0.005, ***P ≤ 0.0005). ATRA: all-trans retinoic acid; SEM: standard error of mean.
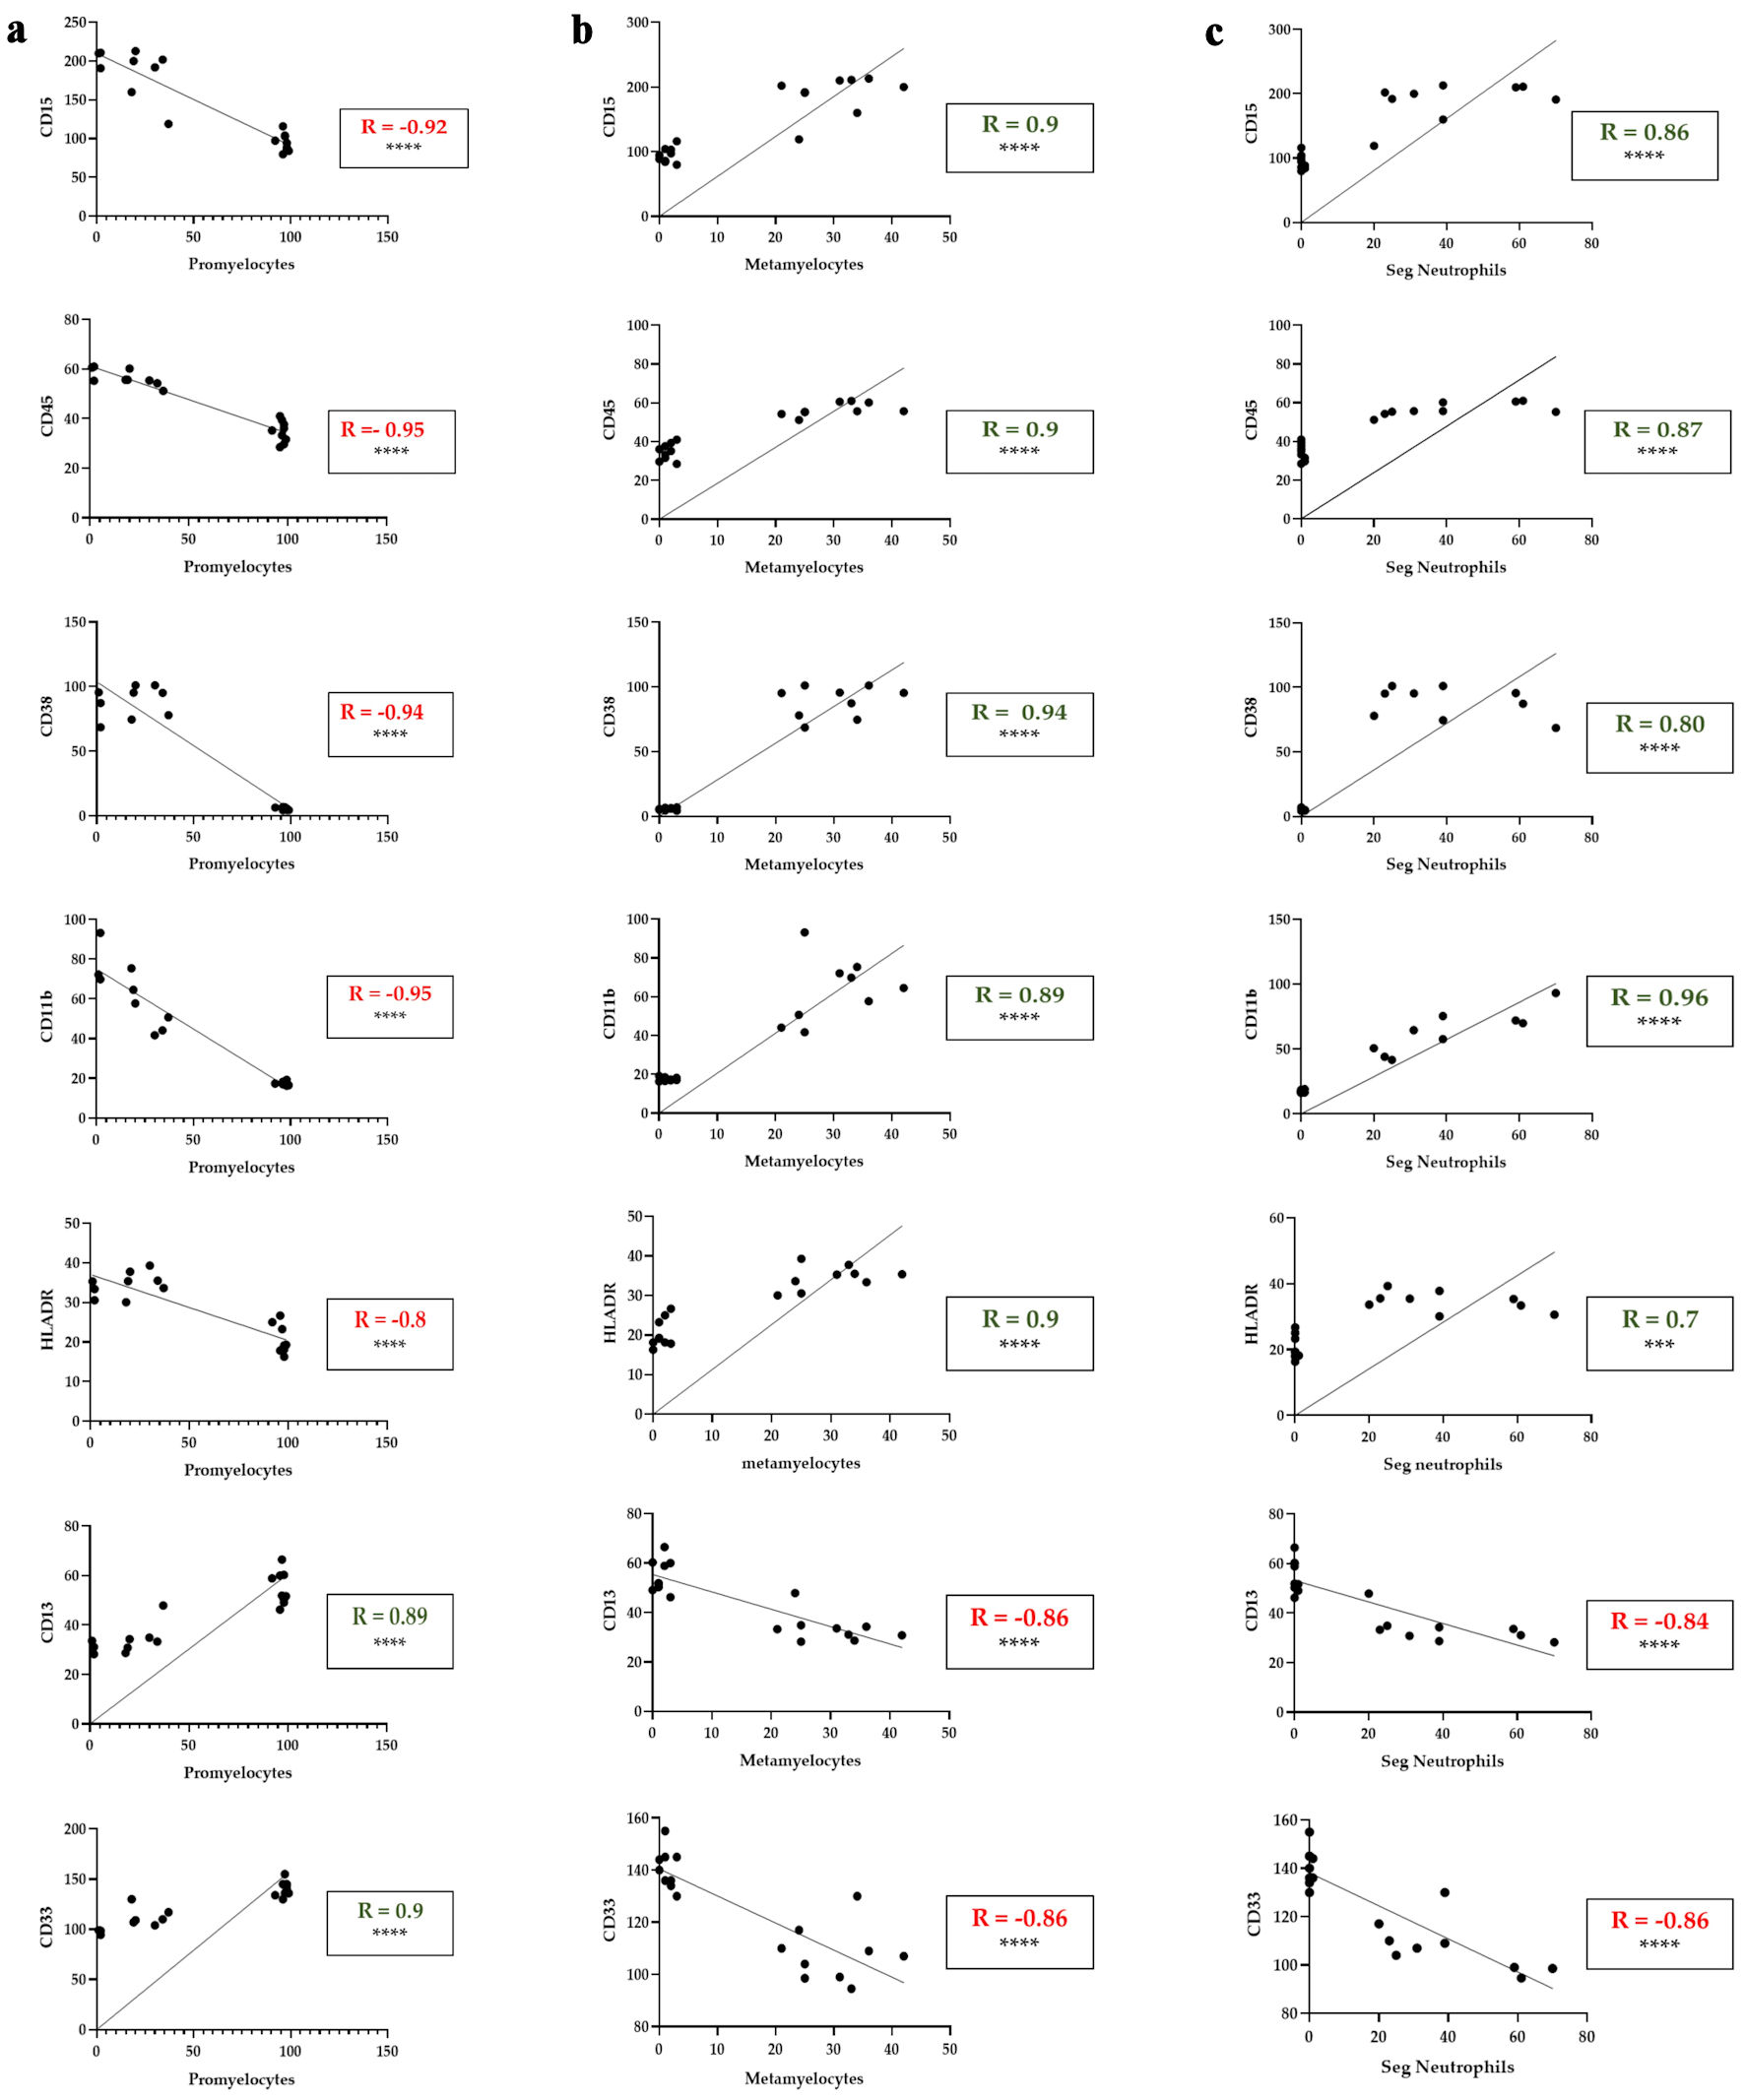
↓ Figure 5. Correlation between myeloid
differentiation markers and the percentage of promyelocytes, metamyelocytes and segmented neutrophils in
ATRA-treated HL60 cells. (a) Correlations between CD15, CD45, CD38, CD11b, HLA-DR, CD13 and CD33
expression (MFI) and the percentage of promyelocytes with differential counts. (b) Correlations between
CD15, CD45, CD38, CD11b, HLA-DR, CD13 and CD33 expression (MFI) and the percentage of metamyelocytes
with differential counts. (c) Correlations between CD15, CD45, CD38, CD11b, HLA-DR, CD13 and CD33
expression (MFI) and the percentage of segmented neutrophils in the differential count. The data
represent the MFI from flow cytometry (y-axis) and morphological differential counts (x-axis) from days
5, 6, and 7 of treatment. The green R values indicate positive correlations; the red R values indicate
negative correlations. ***P < 0.001; ****P < 0.0001. Seg.Neutrophils: segmented neutrophils; MFI:
mean fluorescence intensity; HLA: human leukocyte antigen.
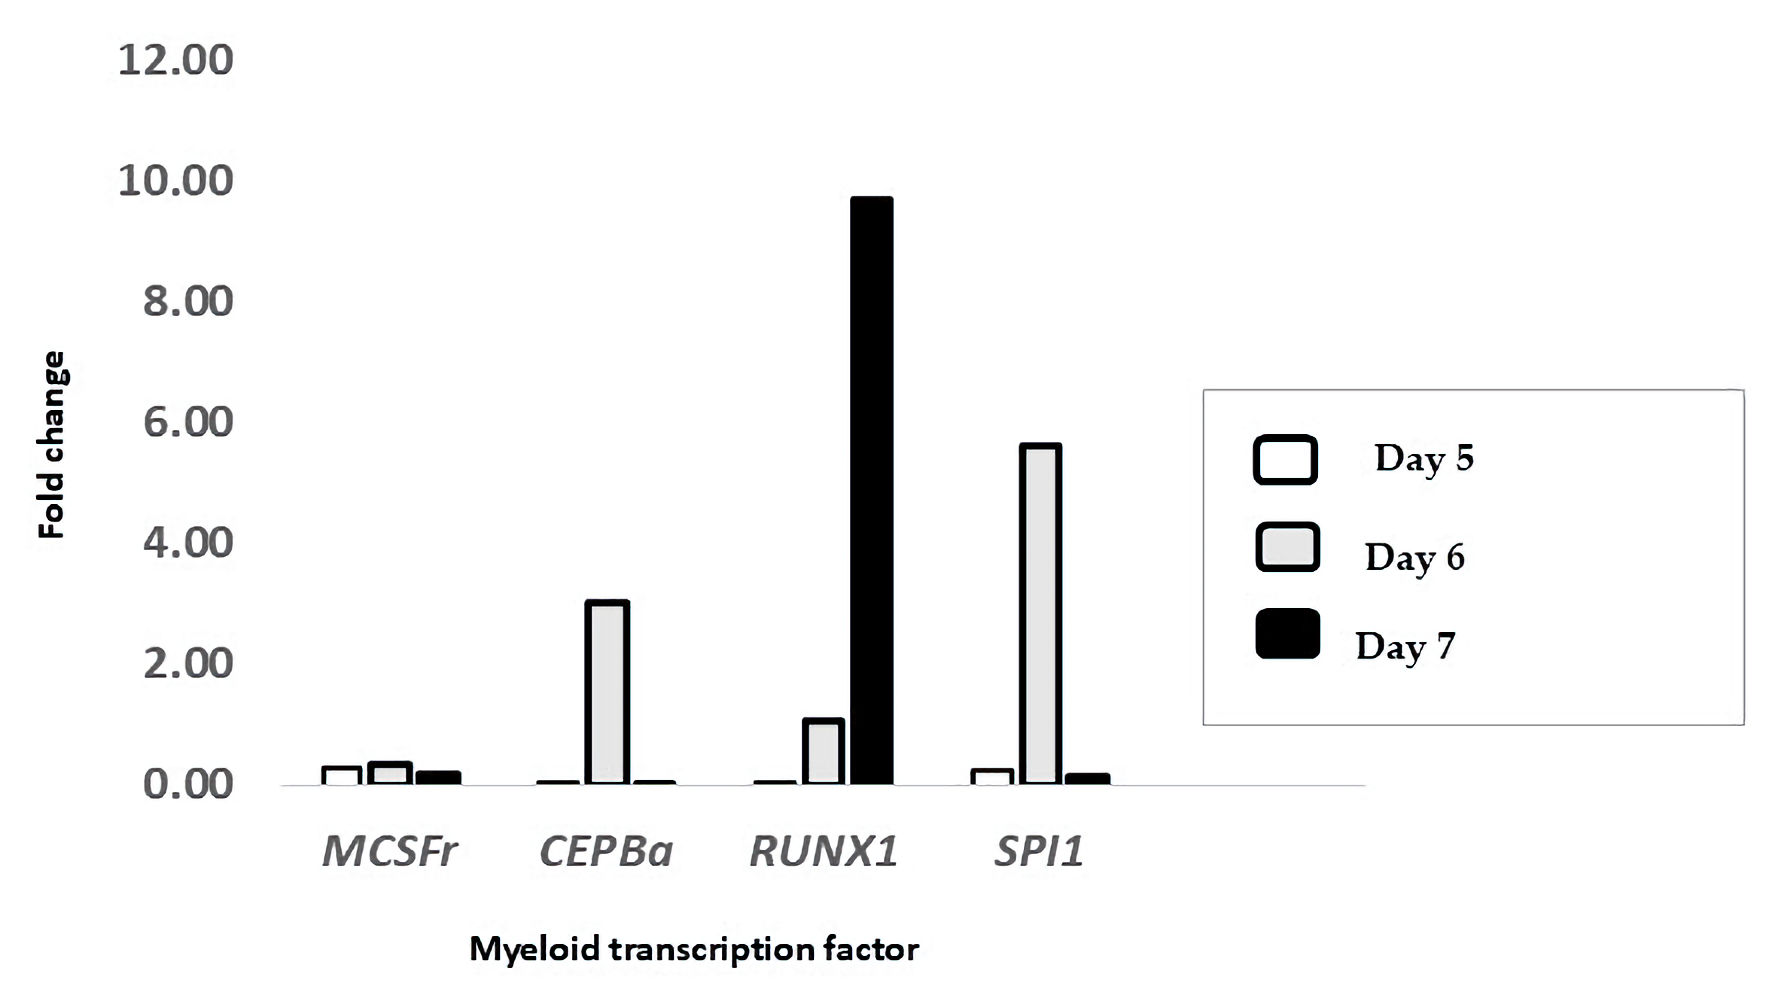
↓ Figure 6. Treatment with ATRA upregulated the
mRNA expression of key myeloid transcription factors. The expression levels of M-CSFR, CEBPA,
RUNX1, and SPI1 were measured in HL-60 cells treated with ATRA and compared to those in
untreated controls on day 5 (white bars), day 6 (gray bars), and day 7 (black bars) post-treatment. The
data are presented as the fold change relative to that of untreated cells and were calculated via the
ΔΔCt method using β-actin as the reference gene (n = 3). ATRA: all-trans retinoic
acid; M-CSFR: macrophage colony-stimulating factor receptor; CEBPα: CCAAT/enhancer-binding
protein alpha; RUNX1: runt-related transcription factor 1; SPI1: spleen focus-forming
virus proviral integration oncogene (PU.1); ΔΔCt: delta-delta threshold cycle;
β-actin: beta-actin.