| World Journal of Oncology, ISSN 1920-4531 print, 1920-454X online, Open Access |
| Article copyright, the authors; Journal compilation copyright, World J Oncol and Elmer Press Inc |
| Journal website https://www.wjon.org |
Original Article
Volume 15, Number 6, December 2024, pages 882-901
ACTR10 Overexpression Facilitates the Progression and Tyrosine Kinase Inhibitor Resistance in Hepatocellular Carcinoma
Jie Luoa, f, Kai Qinb, f, Rong Quan Hec, Jian Di Lid, Zhi Guang Huangd, Bin Tong Yinc, Tong Wuc, Yu Zhen Chenc, Di Yuan Qine, Jia Yuan Luod, Mei Wud, Bang Teng Chid, Gang Chend, Jian Jun Lib, g, Yu Bin Huangb, g
aDepartment of Oncology, The Second Affiliated Hospital of Guangxi Medical University, Nanning 530007, Guangxi, China
bDepartment of General Surgery, The Second Affiliated Hospital of Guangxi Medical University, Nanning 530007, Guangxi, China
cDepartment of Medical Oncology, The First Affiliated Hospital of Guangxi Medical University, Nanning 530021, Guangxi, China
dDepartment of Pathology, The First Affiliated Hospital of Guangxi Medical University, Nanning 530021, Guangxi, China
eDepartment of Computer Science and Technology, School of Computer and Electronic Information, Guangxi University, Nanning 530004, Guangxi, China
fThese authors contributed equally to this work.
gCorresponding Author: Jian Jun Li and Yu Bin Huang, Department of General Surgery, The Second Affiliated Hospital of Guangxi Medical University, Nanning 530007, Guangxi, Chinaand
Manuscript submitted October 16, 2024, accepted November 25, 2024, published online December 11, 2024
Short title: ACTR10 Overexpression in HCC
doi: https://doi.org/10.14740/wjon1944
| Abstract | ▴Top |
Background: In the present day, hepatocellular carcinoma (HCC) remains a formidable threat to human health. Actin-related protein 10 (ACTR10) is related to tyrosine kinase inhibitor (TKI) resistance. A comprehensive analysis of ACTR10 in HCC will further our understanding of the molecular mechanisms underlying this resistance phenomenon, shedding light on potential therapeutic strategies for combating TKI resistance in HCC.
Methods: We conducted an integration of high-throughput datasets across various centers, analyzing ACTR10 expression using the Cancer Cell Line Encyclopedia (CCLE) and assessing its implications through clustered regularly interspaced short palindromic repeats (CRISPR) knockout screen. Pathogenic mechanisms were elucidated through enrichment analysis. Prognostic assessment utilized Kaplan-Meier survival and univariate Cox analyses. An integrated analysis of gene expression profiles related to TKI in HCC was conducted, and TKI resistance mechanisms were explored through enrichment analysis. Potential therapeutic drugs were identified using the Drug Gene Budger database and molecular docking techniques.
Results: The standardized mean difference (SMD) of 0.34 (95% confidence interval (CI): 0.22 - 0.45, P < 0.05) and ACTR10-dependent growth in HCC cells confirm its upregulation in HCC. The area under the summary receiver operating characteristic (sROC) curve was 0.69, indicating moderate discriminative ability of ACTR10 in HCC patients. ACTR10 exerts its pro-cancer effect by influencing RNA splicing, mRNA processing and nucleocytoplasmic transport. A hazard ratio of 2.19 (95% CI: 1.56 - 3.08, P < 0.05) identifies ACTR10 as an independent prognostic risk factor. Additionally, the SMD of 0.88 (95% CI: 0.01 - 0.76, P < 0.05) validates ACTR10 as a TKI-resistance gene, mediating resistance via enhanced exocytosis, autophagy, and apoptosis in HCC patients. Trichostatin A emerges as a prospective targeted agent for HCC.
Conclusion: The upregulation of ACTR10 accelerates HCC progression, promotes TKI resistance, and emerges as a prospective target for the treatment of HCC.
Keywords: Hepatocellular carcinoma; Actin-related protein 10; Risk factor; Tyrosine kinase inhibitor resistance; Prospective therapeutic target
| Introduction | ▴Top |
Nowadays, hepatocellular carcinoma (HCC) remains a significant challenge [1]. Targeted therapy has emerged as a potential therapeutic strategy in the treatment of HCC [2-5]. Tyrosine kinase inhibitors (TKIs) are drugs that specifically inhibit enzymes involved in cell signaling pathways and thus can suppress tumor growth and progression [6-9]. In cases of HCC, TKIs have shown efficacy in inhibiting key proteins and receptors involved in tumor angiogenesis, cell proliferation and survival, such as vascular endothelial growth factor receptor (VEGFR), platelet-derived growth factor receptor (PDGFR) and epidermal growth factor receptor (EGFR) [10-12]. Several TKIs, including sorafenib, lenvatinib and regorafenib, have been authorized for the treatment of advanced HCC and have demonstrated enhanced overall survival and progression-free survival in clinical trials, making them important options in the current management of HCC [5, 13-15]. Ongoing research continues to explore the potential of TKIs in combination therapies and their effects in different patient populations for optimal treatment outcomes in patients with HCC.
However, resistance to TKIs poses a significant challenge in the treatment of HCC. Despite the initial effectiveness of TKIs in targeting key signaling pathways, the development of resistance limits their long-term therapeutic benefit. Several mechanisms contribute to this acquired TKI resistance, including the activation of alternate signaling pathways, generation of mutations in the target kinase domain, overexpression of drug efflux transporters and activation of pro-survival signaling pathways. Additionally, the intricate interplay between HCC cells and the surrounding microenvironment can promote resistance to TKIs [10, 15-18]. TKI resistance may also be associated with numerous unknown molecular mechanisms. Therefore, understanding these mechanisms and identifying potential biomarkers are critical for devising strategies to overcome or circumvent TKI resistance in HCC and ultimately improve treatment outcomes for patients with this aggressive type of liver cancer.
In the context of resistance to standard first-line TKIs such as sorafenib, lenvatinib, regorafenib, and cabozantinib for HCC, there appears to be a growing interest in exploring novel systemic treatments. Emerging clinical trials are investigating the potential of combining TKIs with immune checkpoint inhibitors. This approach is viewed as promising for potentially addressing TKI resistance. A comprehensive review suggested that these combined strategies may be associated with favorable efficacy and safety profiles, potentially offering new avenues in the management of HCC [19]. To acquire a comprehensive understanding of the expression profile of genes related to TKI resistance in HCC, we initially collected global datasets generated from high-throughput gene microarrays and RNA sequencing conducted in TKI resistance experiments. We then performed data integration and analysis, which revealed a set of potential TKI-resistance genes, including actin-related protein 10 (ACTR10) gene, ACTR10. Also known as Arp10, Arp11, ACTR11 and HARP11, ACTR10 is located at 14q23.1 and has 13 exons. ACTR10 is predicted to involve in the retrograde axonal transport of mitochondria and is suggested to be present in the cytosol, extracellular region and secretory granules. Furthermore, it is predicted to be a component of the dynactin complex. Notably, ACTR10 lacking the dynactin binding domain can still bind mitochondria, suggesting its involvement in the dynactin-mitochondria interaction [20]. However, limited research has been conducted on ACTR10, and there is no mention in the literature of its relationship with TKIs. In terms of its prominence in tumor research, one paper reported that high expression of ACTR10 has prognostic value in cases of primary central nervous system lymphoma [21]; however, no studies on ACTR10 in HCC have been published to date.
Therefore, in this study, we comprehensively integrated data from various sources to analyze the role of ACTR10 in HCC and investigated its clinical value in HCC development and TKI resistance. Furthermore, we undertook a pathway analysis to explore our preliminary interpretations of the clinical significance of ACTR10. Additionally, we used drug databases and molecular docking techniques to identify potential drugs for the treatment of HCC.
| Materials and Methods | ▴Top |
Detection of the transcriptomic and cellular expressions of ACTR10 in HCC
Global HCC microarrays and sequencing datasets from public databases
To understand the expression of ACTR10 in HCC and non-HCC liver tissue, ACTR10 expression profiles were retrieved from the Gene Expression Omnibus (GEO), The Cancer Genome Atlas (TCGA), the International Cancer Genome Consortium (ICGC), the Genotype-Tissue Expression (GTEx) project, ArrayExpress, the Sequence Read Archive (SRA) and scientific literature databases. The search terms were as follows: “hepatocellular carcinoma” OR HCC OR “hepatic carcinoma”. The inclusion criteria were as follows: 1) the sample type was human primary HCC tissue; 2) the experimental group comprised samples from patients with HCC samples, while the control group included samples from non-cancerous liver samples; and 3) the sample size of each group was no less than 3. The exclusion criteria were as follows: 1) the sample size was less than 3; 2) ACTR10 expression was absent; and 3) the sample was metastatic or recurrent HCC. The mRNA expression matrices were normalized and log2(x + 1) transformed. Datasets from the same GEO platform were merged to form a larger matrix, and the limma and sva packages of R was used to remove batch effects.
ACTR10 mRNA expression in HCC cell lines
To validate the expression of ACTR10, the mRNA expression matrix of HCC cell lines was acquired from the Cancer Cell Line Encyclopedia (CCLE) dataset. The mRNA expression analysis was conducted using R v4.0.3 and ggplot2 (v3.3.3), and the results were visualized using a horizontal bar chart [22].
Effect of ACTR10 on HCC cell growth
A clustered regularly interspaced short palindromic repeats (CRISPR) knockout screen was used to clarify the role of the ACTR10 gene in HCC cells. Dependency scores for the ACTR10 gene in different HCC cell lines were calculated using the CERES algorithm. A negative score indicates that the cell lines would grow at a slower rate if the specific gene was knocked out. In our study, if the score was less than -1 in more than 75% of the HCC cell lines, we considered the gene essential to the survival of HCC [23].
The potential pathogenic molecular mechanisms of ACTR10 in HCC
To investigate the pathogenic molecular mechanisms of ACTR10 in HCC, the meta package (version 4.18-2) was used to determine the standardized mean difference (SMD) for 61,521 genes in HCC tissue and non-HCC liver tissue samples. The overexpressed genes (OEGs) in the HCC samples were filtered using the following criteria: 1) gene expressed in no less than three studies; 2) SMD > 0; and 3) 95% confidence interval (CI) did not overlap with zero. Spearman correlation analysis was performed to determine the genes co-expressed with ACTR10. These co-expressed genes (CEGs) were filtered using the following criteria: 1) gene co-expressed with ACTR10 in no less than 10 studies; 2) Spearman correlation coefficient ≥ 0.30; and 3) P < 0.05. After the filtering was performed, the HCC OEGs were intersected with the ACTR10 CEGs. The overlapping genes were annotated using clusterProfiler, and the potential pathogenic molecular mechanisms of ACTR10 were explored using the Gene Ontology (GO), Kyoto Encyclopedia of Genes and Genomes (KEGG) and Reactome platforms.
Clinical value of ACTR10 in HCC
Prognostic value of ACTR10 in HCC
The prognostic information was derived from high-throughput datasets. The high-risk group consisted of patients with higher ACTR10 expression, and all other patients were categorized into the low-risk group. Kaplan-Meier (K-M) survival analysis was used to evaluate the prognostic value of ACTR10, and univariate Cox analysis was used to measure the hazard risk between the high- and low-risk groups. The results are presented in a forest plot. A hazard ratio (HR) and lower CI greater than 1 indicated that ACTR10 was a risk factor in HCC patients.
ACTR10 expression profiles in HCC with TKI resistance
To reveal the effect of ACTR10 on TKI resistance, TKI-resistant HCC microarrays and high-throughput sequencing datasets were searched and downloaded from the GEO, the SRA and ArrayExpress. The search terms were as follows: (“hepatocellular carcinoma” OR HCC OR “hepatic carcinoma”) AND (“Tyrosine Kinase Inhibitor” OR TKI OR Sorafenib OR Nexavar OR Regorafenib OR Stivarga OR Lenvatinib OR Lenvima OR Cabozantinib OR Cabometyx OR Ramucirumab OR Cyramza OR Axitinib OR Tivantinib OR Cabozantinib OR Ruxolitinib OR Imatinib OR Pazopanib OR Sunitinib OR Nintedanib OR Apatinib OR Dovitinib). The inclusion criteria were as follows: 1) the sample type was HCC tissue or an HCC cell line; 2) the control group consisted of TKI-sensitive HCC samples and the experimental group consisted of TKI-resistant HCC samples; and 3) the sample size of each group was no less than 3. The exclusion criteria were as follows: 1) the sample size was less than 3 and 2) ACTR10 expression was absent. The included datasets were normalized and log2(x + 1) transformed.
The potential mechanisms used by ACTR10 to mediate TKI resistance in HCC
Batch computation of SMDs was used to identify differentially expressed genes in drug-resistant HCC and thus determine the functional role of ACTR10 in TKI resistance. Highly expressed genes were defined as having a positive SMD, and poorly expressed genes were defined as having a negative SMD, with the 95% CI not including zero. Genes found to be highly expressed after TKI treatment were considered to be potentially involved in TKI resistance. This set of potential TKI resistance-related genes, which included ACTR10, was subjected to subsequent enrichment analysis. The enrichment analysis of the upregulated genes was performed using R package clusterProfiler.
Prediction of a targeted drug for HCC patients and molecular docking experiments
Drug candidates known to significantly downregulate ACTR10 were screened using the Drug Gene Budger (DGB) database [24]. The prediction was conducted using the combat package, which removed the batch effects of the original CMap datasets. The limma package was utilized for calculating P values, and the Benjamini-Hochberg procedure was used to evaluate q values [25]. In this study, P and q values < 0.05 and a logFoldChange value < -1 were used as the screening conditions to obtain target-specific drugs. Finally, molecular docking experiments were performed to explore the relationship between ACTR10 and the target-specific drugs. The crystal structure of ACTR10 (AlphaFold DB:AF-Q9NZ32-F1) was downloaded from the RCSB PDB database. PyMOL 2.4 was applied to remove the solvent molecules and co-crystallized ligands of ACTR10, and POCASA 1.1 was used to predict the active site of ACTR10. The targeted drug structures were downloaded from the PubChem database, and the AutoDockTools application was used to process ACTR10 and the drug structure. Molecular docking was performed using AutoDock Vina 1.5.7. In the docking results, a lower affinity energy value indicated a more stable docking of the drug to the active site of ACTR10. The docking results were visualized using PyMOL 2.4.
Statistical analysis
A non-parametric test was employed to assess the expression differences of ACTR10 between HCC and non-cancerous liver controls. A two-sided P-value < 0.05 indicated that the difference was statistically significant. Receiver operating characteristic (ROC) curves were constructed using the pROC package in R software. STATA 12.0 (College Station, TX, USA) was applied to calculate the SMD and to fit the summary ROC (sROC) curve. The heterogeneity was evaluated using the Q-test and I2 statistical value. In the Q-test, if P ≤ 0.05 and I2 > 50%, a random-effects model was applied to calculate the SMD; otherwise, a fixed model was used. The area under the curve (AUC) of the sROC curve was used to indicate the discriminatory ability of ACTR10 in HCC. Sensitivity, specificity and diagnostic likelihood ratio (DLR) were utilized to evaluate the diagnostic potential of ACTR10. Prognostic and TKI-resistance data were analyzed in the same way. Publication bias was assessed using Egger’s and Begg’s tests, and a P-value ≥ 0.05 implied no publication bias.
Ethical approval
The study was conducted in accordance with the Declaration of Helsinki. Our study is based on open-access databases TCGA, GEO, ArrayExpress, ICGC, GTEx, and SRA, which were reviewed and approved by the Ethics Committee of The First Affiliated Hospital of Guangxi Medical University and The Second Affiliated Hospital of Guangxi Medical University. Users can download relevant data for free for research and publish relevant articles.
| Results | ▴Top |
Upregulation of ACTR10 expression in HCC
Analysis of global microarrays and sequencing data
A flow chart of the ACTR10 mRNA dataset screening process is shown in Figure 1. A total of 112 datasets from 40 different platforms were screened for subsequent analysis, and detailed information on each screened dataset is shown in Table 1, including the number, mean and standard deviation. The 5,098 HCC cases and 3,742 non-HCC cases enrolled in this study were sufficient for examining ACTR10 expression in HCC.
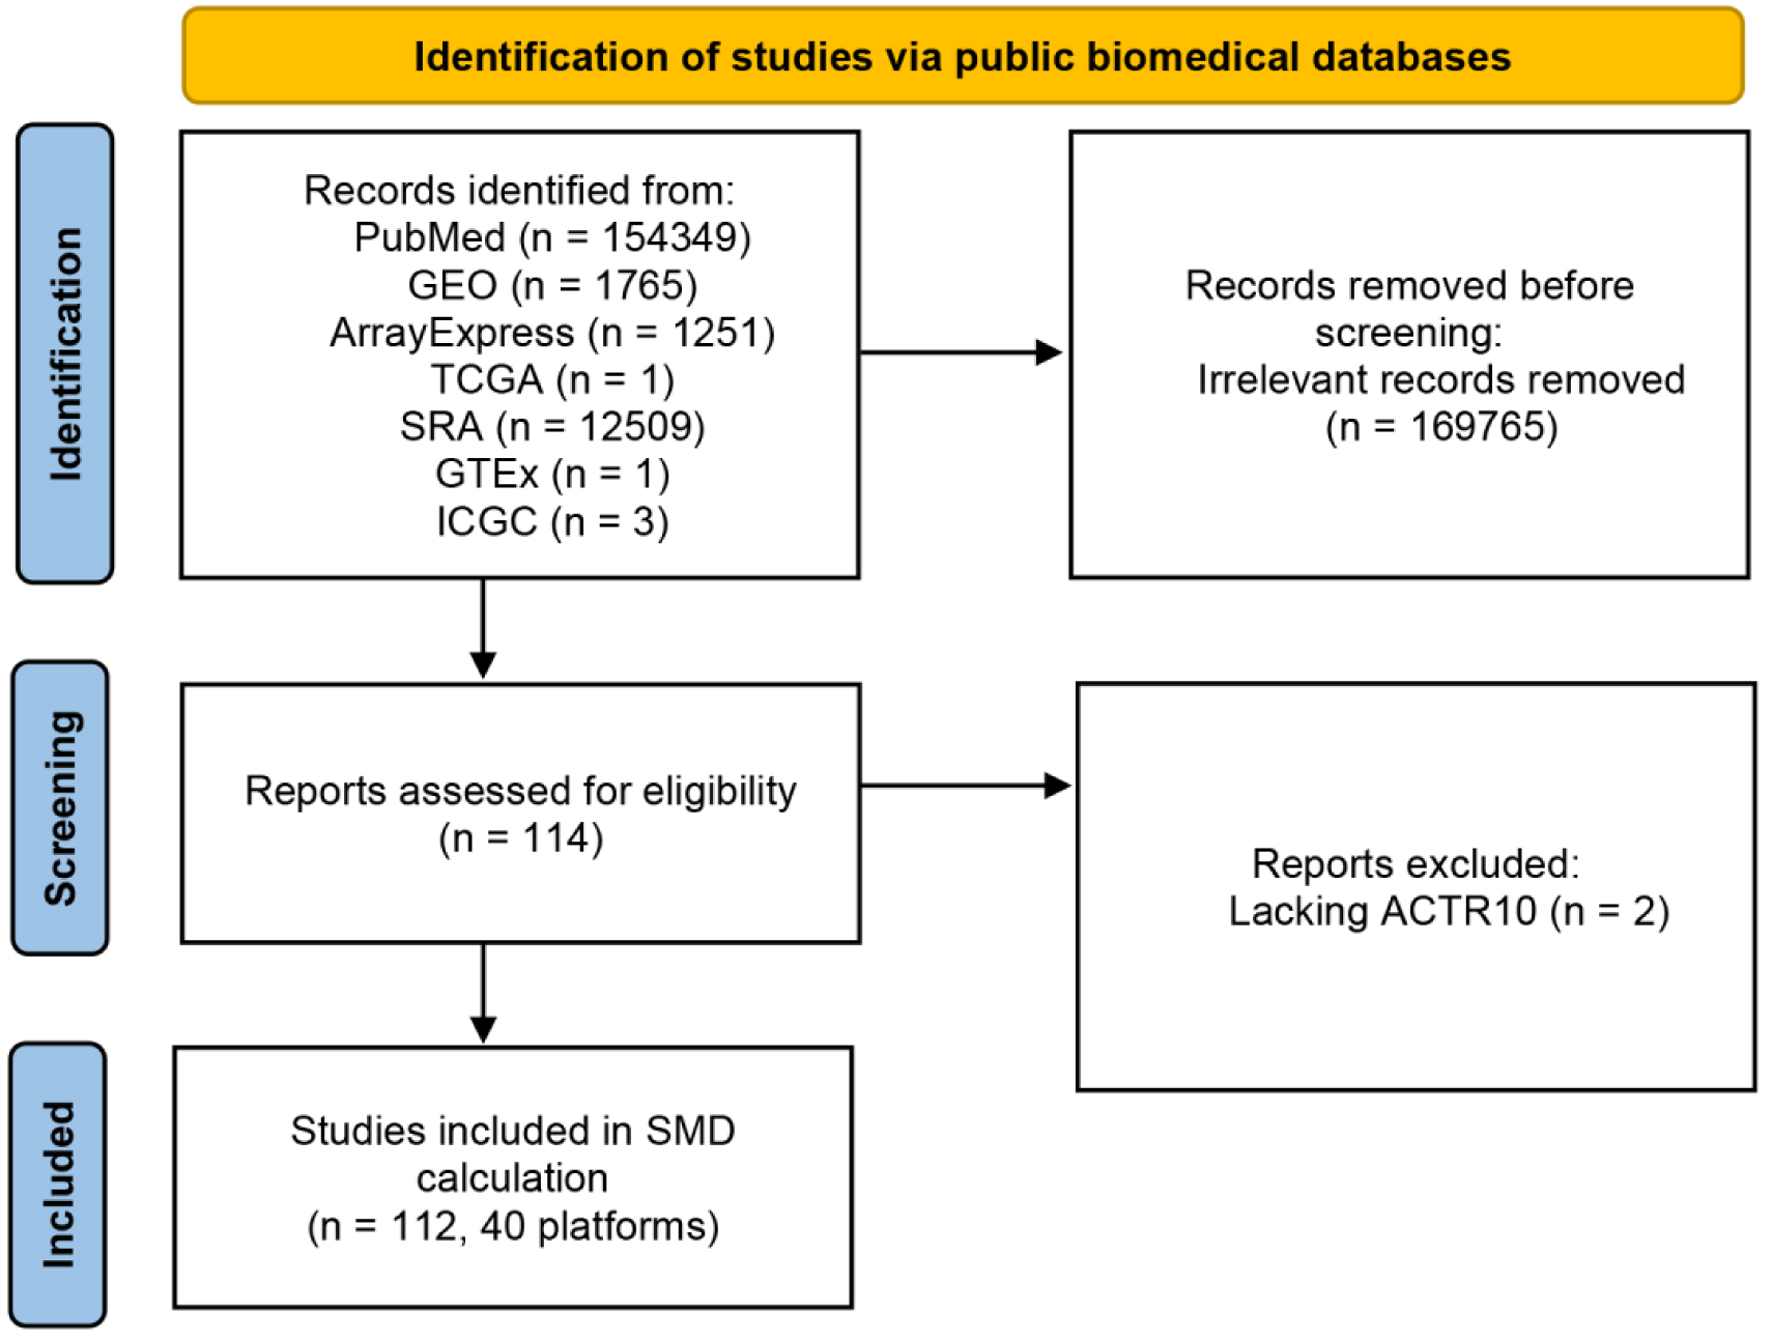 Click for large image | Figure 1. Flow chart of ACTR10 mRNA dataset screening. GEO: Gene Expression Omnibus; GTEx: Genotype-Tissue Expression; ICGC: International Cancer Genome Consortium; SRA: Sequence Read Archive; TCGA: The Cancer Genome Atlas. |
 Click to view | Table 1. Information on the ACTR10 mRNA Datasets |
High expression of ACTR10 mRNA in HCC
We used a non-parametric text to compare the expression of ACTR10 in the HCC and non-HCC samples. In Supplementary Material 1 (wjon.elmerpub.com), it can be observed that ACTR10 was highly expressed in HCC tissue compared with non-HCC tissue in 19 datasets and that there was a statistically significant difference in the expression (P < 0.05). However, the trend of ACTR10 expression was not completely consistent; the remaining datasets did not reveal statistically significant differences. The results of an integrated analysis of all datasets corroborated the finding of upregulated ACTR10 expression in HCC with a random effect (SMD = 0.34, 95% CI: 0.22 - 0.45, I2 = 79%, P < 0.05) (Fig. 2a). Moreover, the Begg’s and Egger’s analyses implied that there was no publication bias (P = 0.650 and 0.368) (Fig. 2b, c).
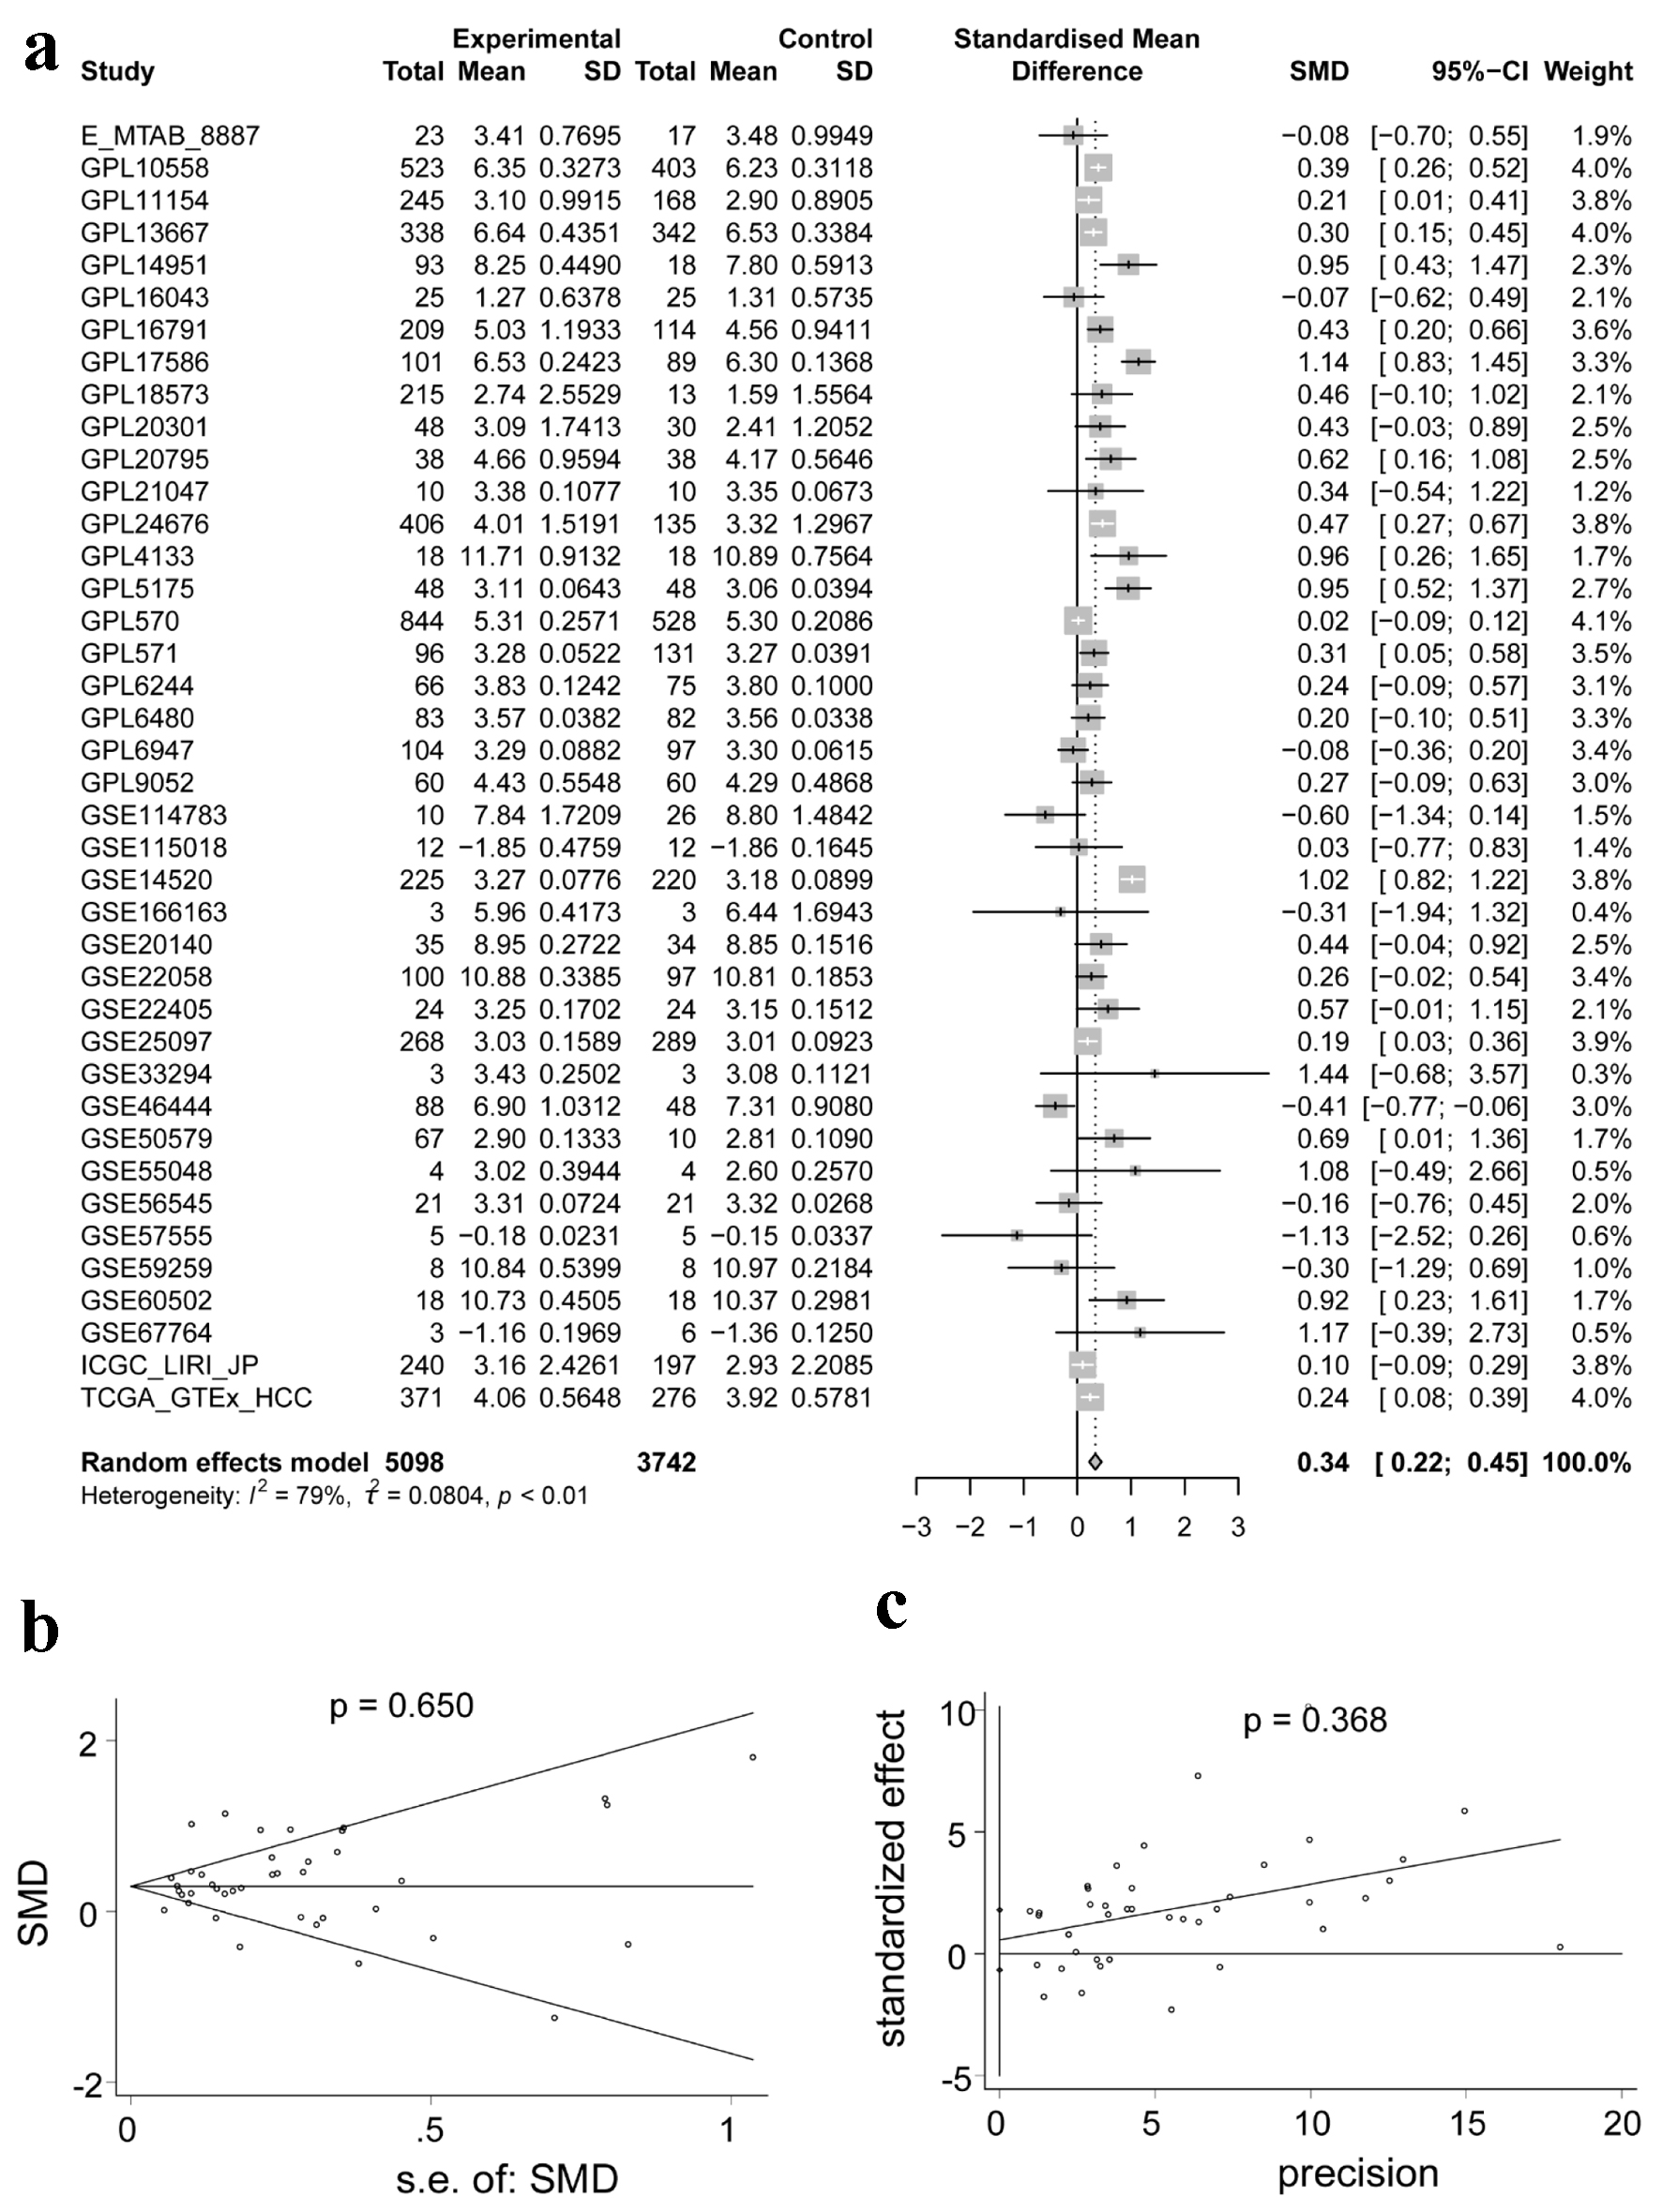 Click for large image | Figure 2. Integrated analysis of the expression of ACTR10 in HCC. (a) Forest plot showing the high expression of ACTR10 in HCC tissues compared to non-HCC liver tissues. (b, c) Plots showing the results of Egger’s and Begg’s tests, which showed that there was no publication bias. HCC: hepatocellular carcinoma; SMD: standardized mean difference. |
Moderate discriminatory ability of ACTR10 in HCC
An sROC curve was employed to evaluate the capacity of ACTR10 to distinguish HCC samples from non-HCC samples. The AUCs of the combined sROC curves, sensitivities and specificities were 0.69 (95% CI: 0.65 - 0.73), 0.52 (95% CI: 0.44 - 0.61) and 0.78 (95% CI: 0.69 - 0.85), respectively (Fig. 3a-c). The positive DLR was 2.37 (95% CI: 1.85 - 3.05, I2 = 87.55%), and the negative DLR was 0.61 (95% CI: 0.54 - 0.69, I2 = 89.5%) (Fig. 3d, e). Both the sROC curve and forest plot affirmed the moderate capability of ACTR10 to distinguish HCC from non-HCC tissues.
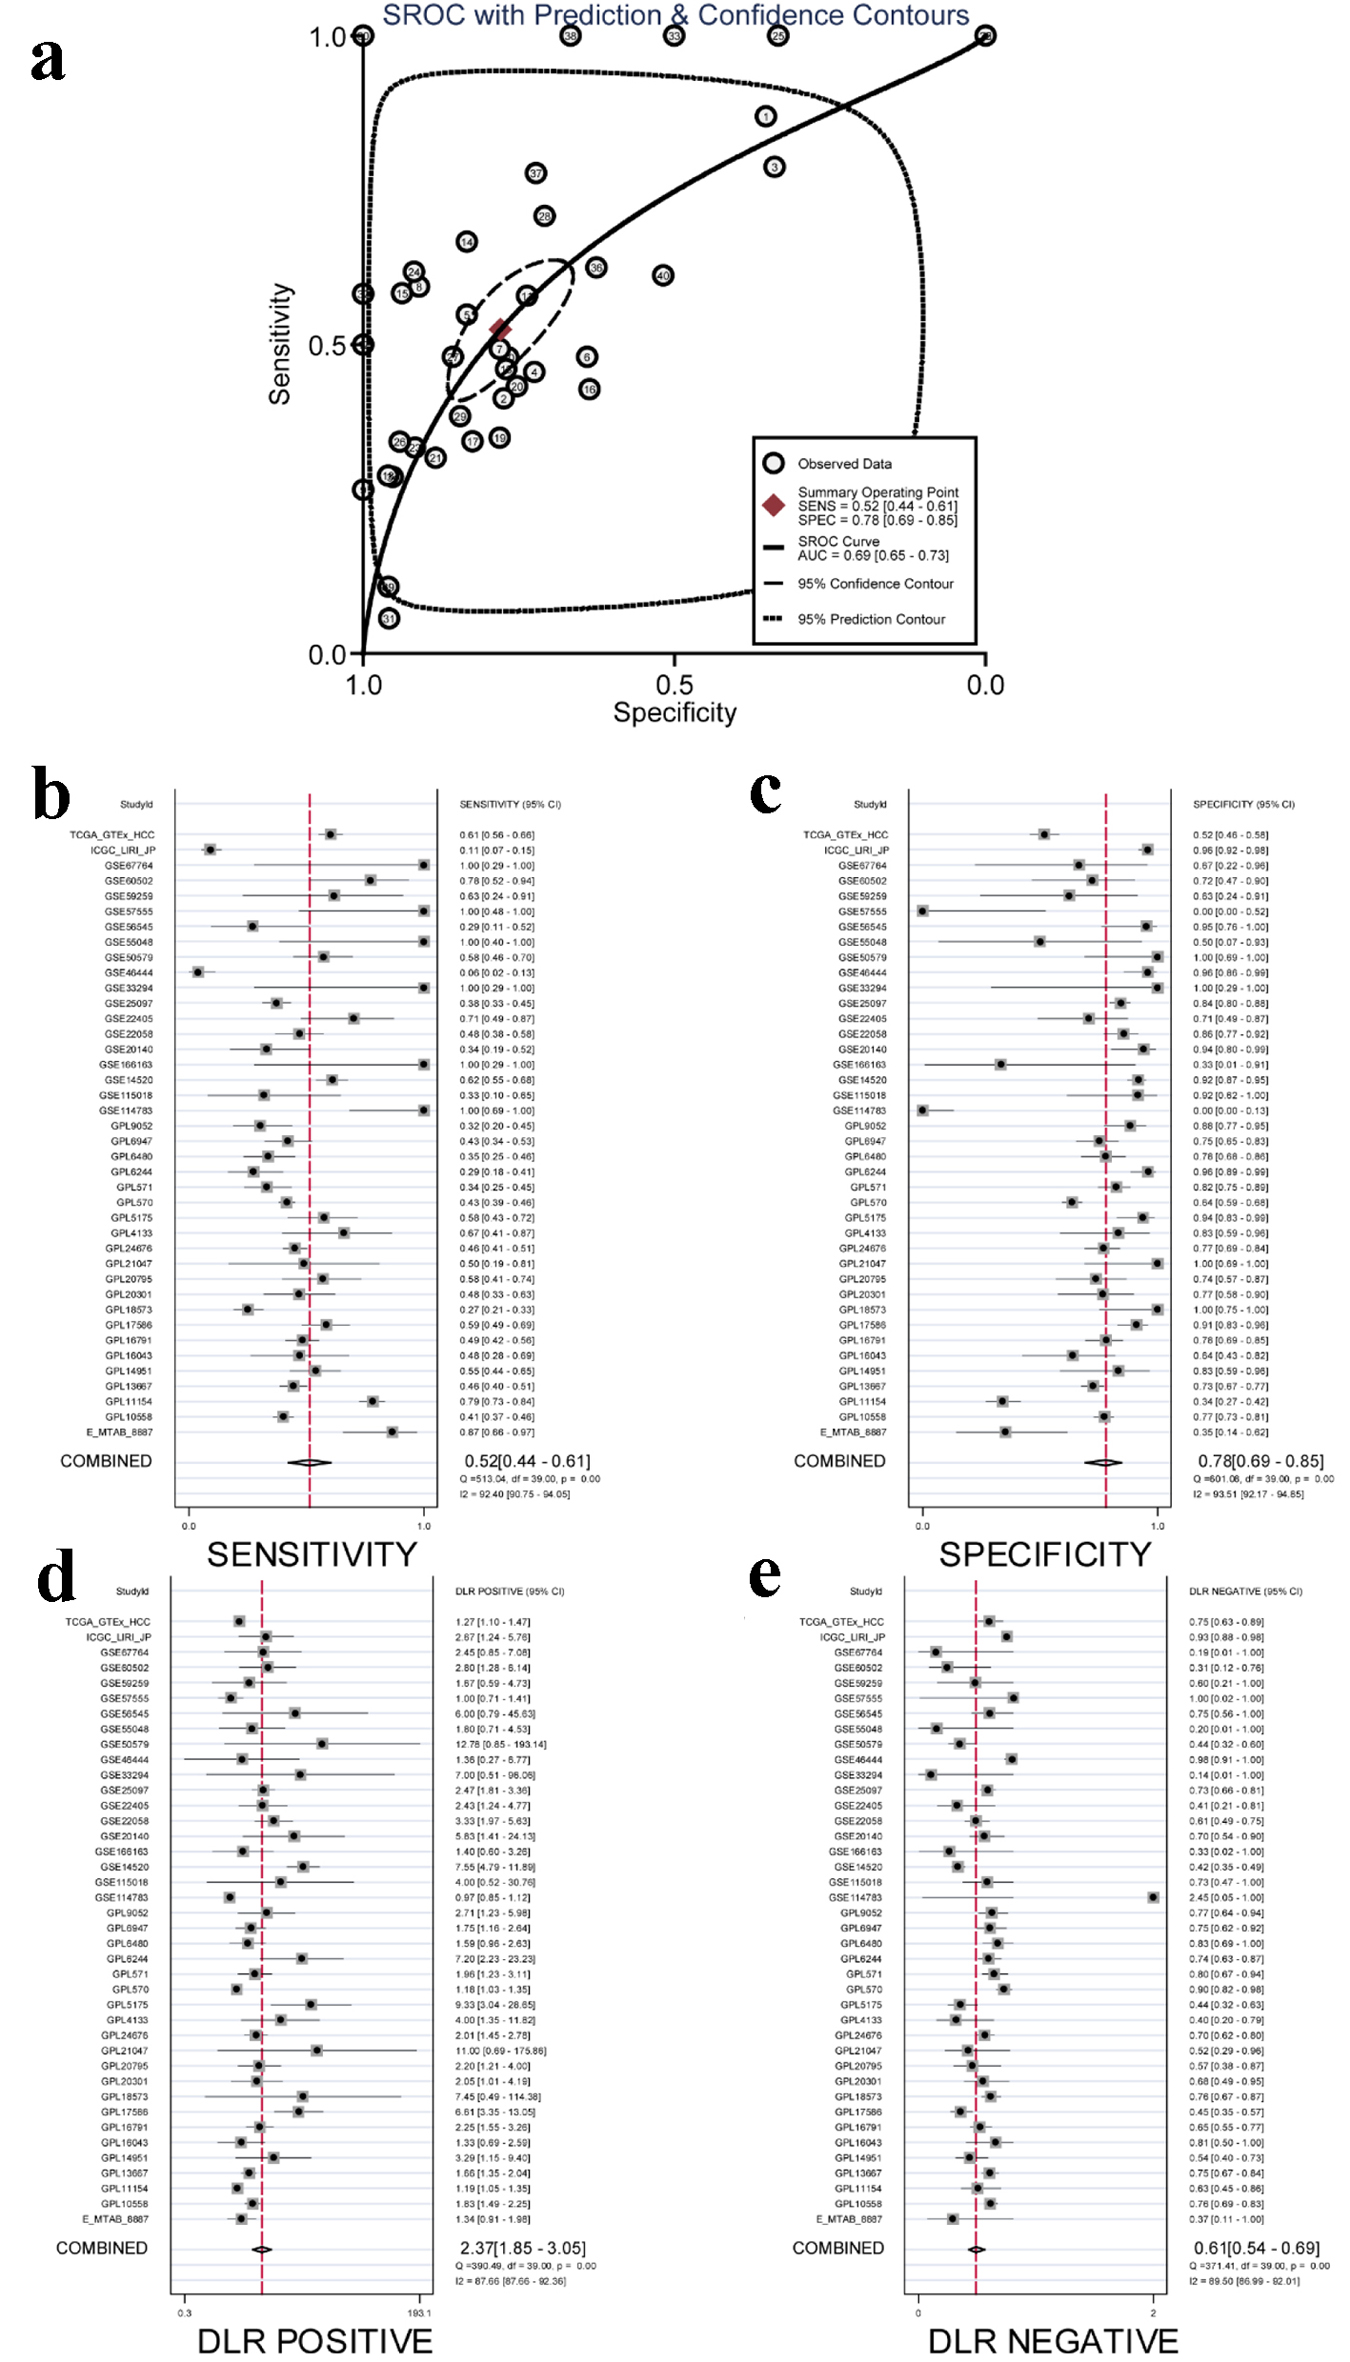 Click for large image | Figure 3. Integrated analysis of the diagnostic performance of ACTR10 in HCC. (a) The AUC of the sROC curve was 0.69 (95% CI: 0.65 - 0.73), with a sensitivity of 0.52 (95% CI: 0.44 - 0.61) and a specificity of 0.78 (95% CI: 0.69 - 0.85). (b) The combined sensitivity was 0.52 (95% CI: 0.44 - 0.61). (c) The combined specificity was 0.78 (95% CI: 0.69 - 0.85). (d) The combined positive DLR was 2.37 (95% CI: 1.85 - 3.05). (e) The combined negative DLR was 0.61 (95% CI: 0.54 - 0.69). AUC: area under the curve; CI: confidence interval; DLR: diagnostic likelihood ratio; HCC: hepatocellular carcinoma; sROC: summary receiver operating characteristic. |
ACTR10 mRNA expression profile in HCC cell lines
Figure 4 shows the relative ACTR10 expression levels in 21 HCC cell lines from the CCLE dataset. It can be seen from the results that ACTR10 was expressed to varying degrees in the different HCC cell lines. Among these cell lines, the JHH-2 and SNU-449 cell lines had the highest expression levels.
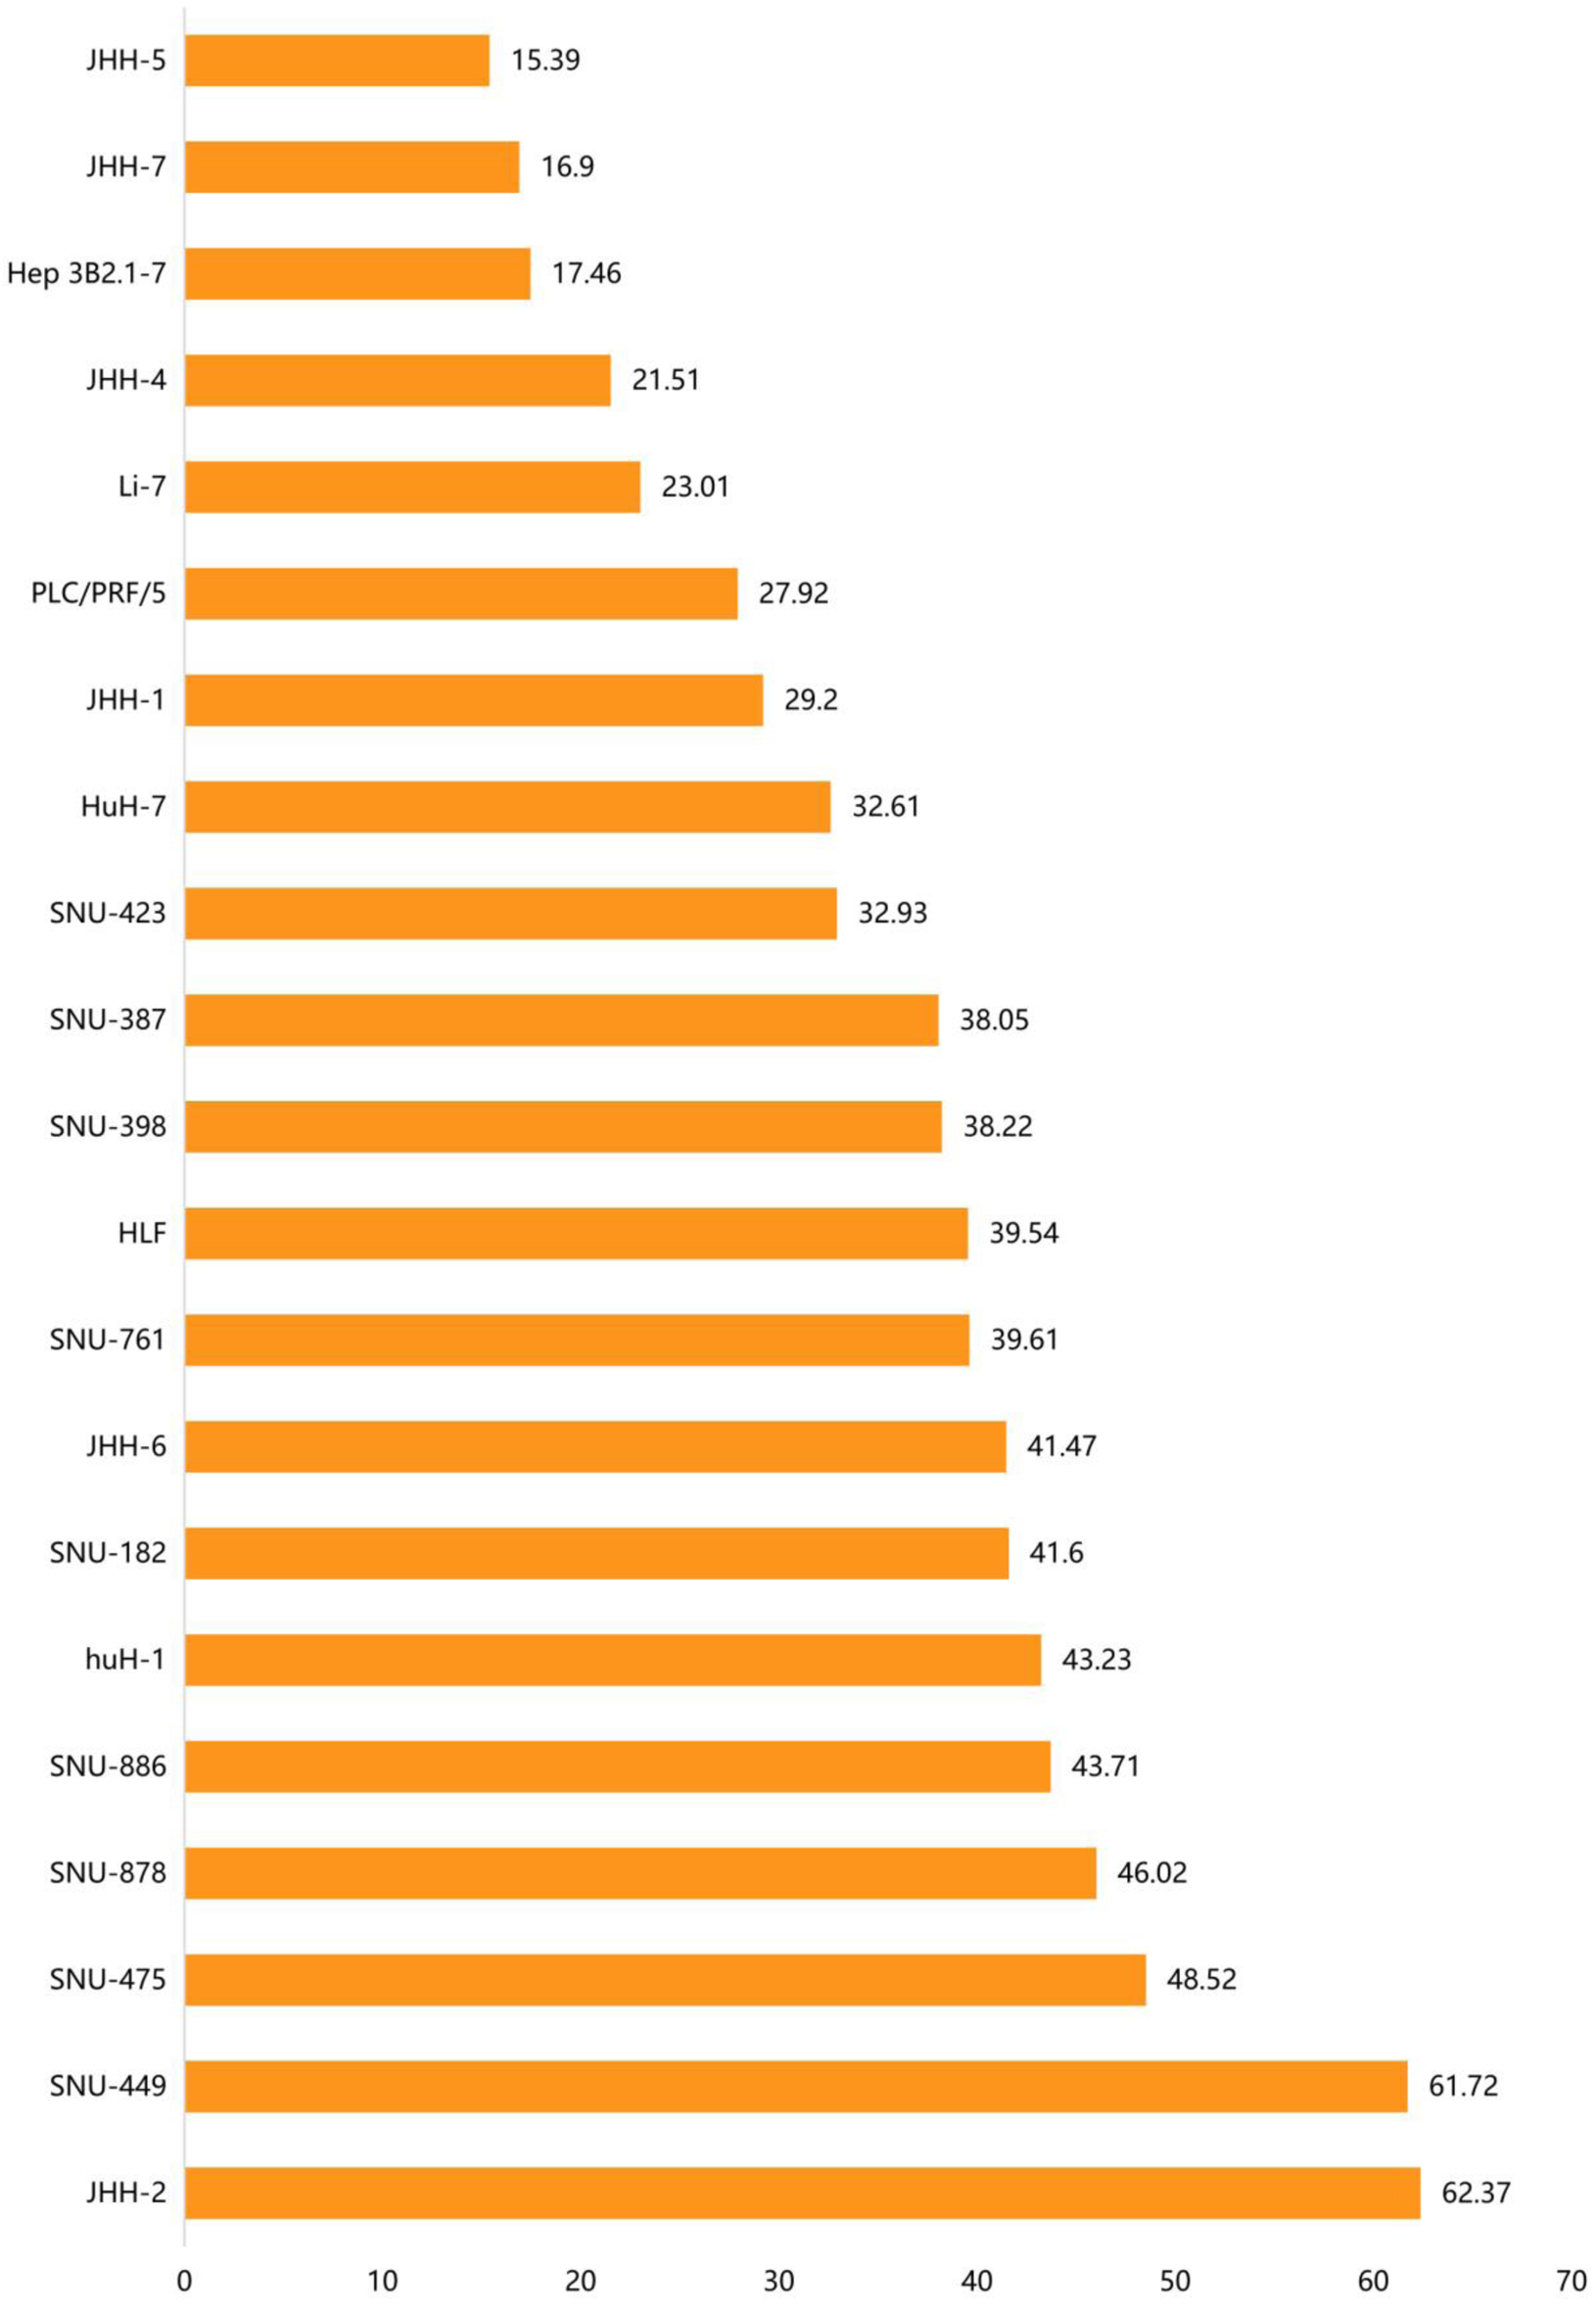 Click for large image | Figure 4. The distribution of ACTR10 mRNA expression in different HCC cell lines. The abscissa represents the distribution of ACTR10 mRNA expression (TPM) and the ordinate represents the different HCC cell lines. HCC: hepatocellular carcinoma. |
Knocking out ACTR10 inhibited HCC cell proliferation
To observe the effect of ACTR10 on the growth of HCC cells, we examined the gene effect scores of ACTR10 in HCC cell lines using CRISPR knockout screen technology. As depicted in Figure 5, 19 HCC cell lines were found to have lower growth and proliferation rates after the ACTR10 gene was knocked out. Among these cell lines, 15 cell lines had a score < -1, which indicated that the ACTR10 gene was an essential gene (15/19, 78.9%).
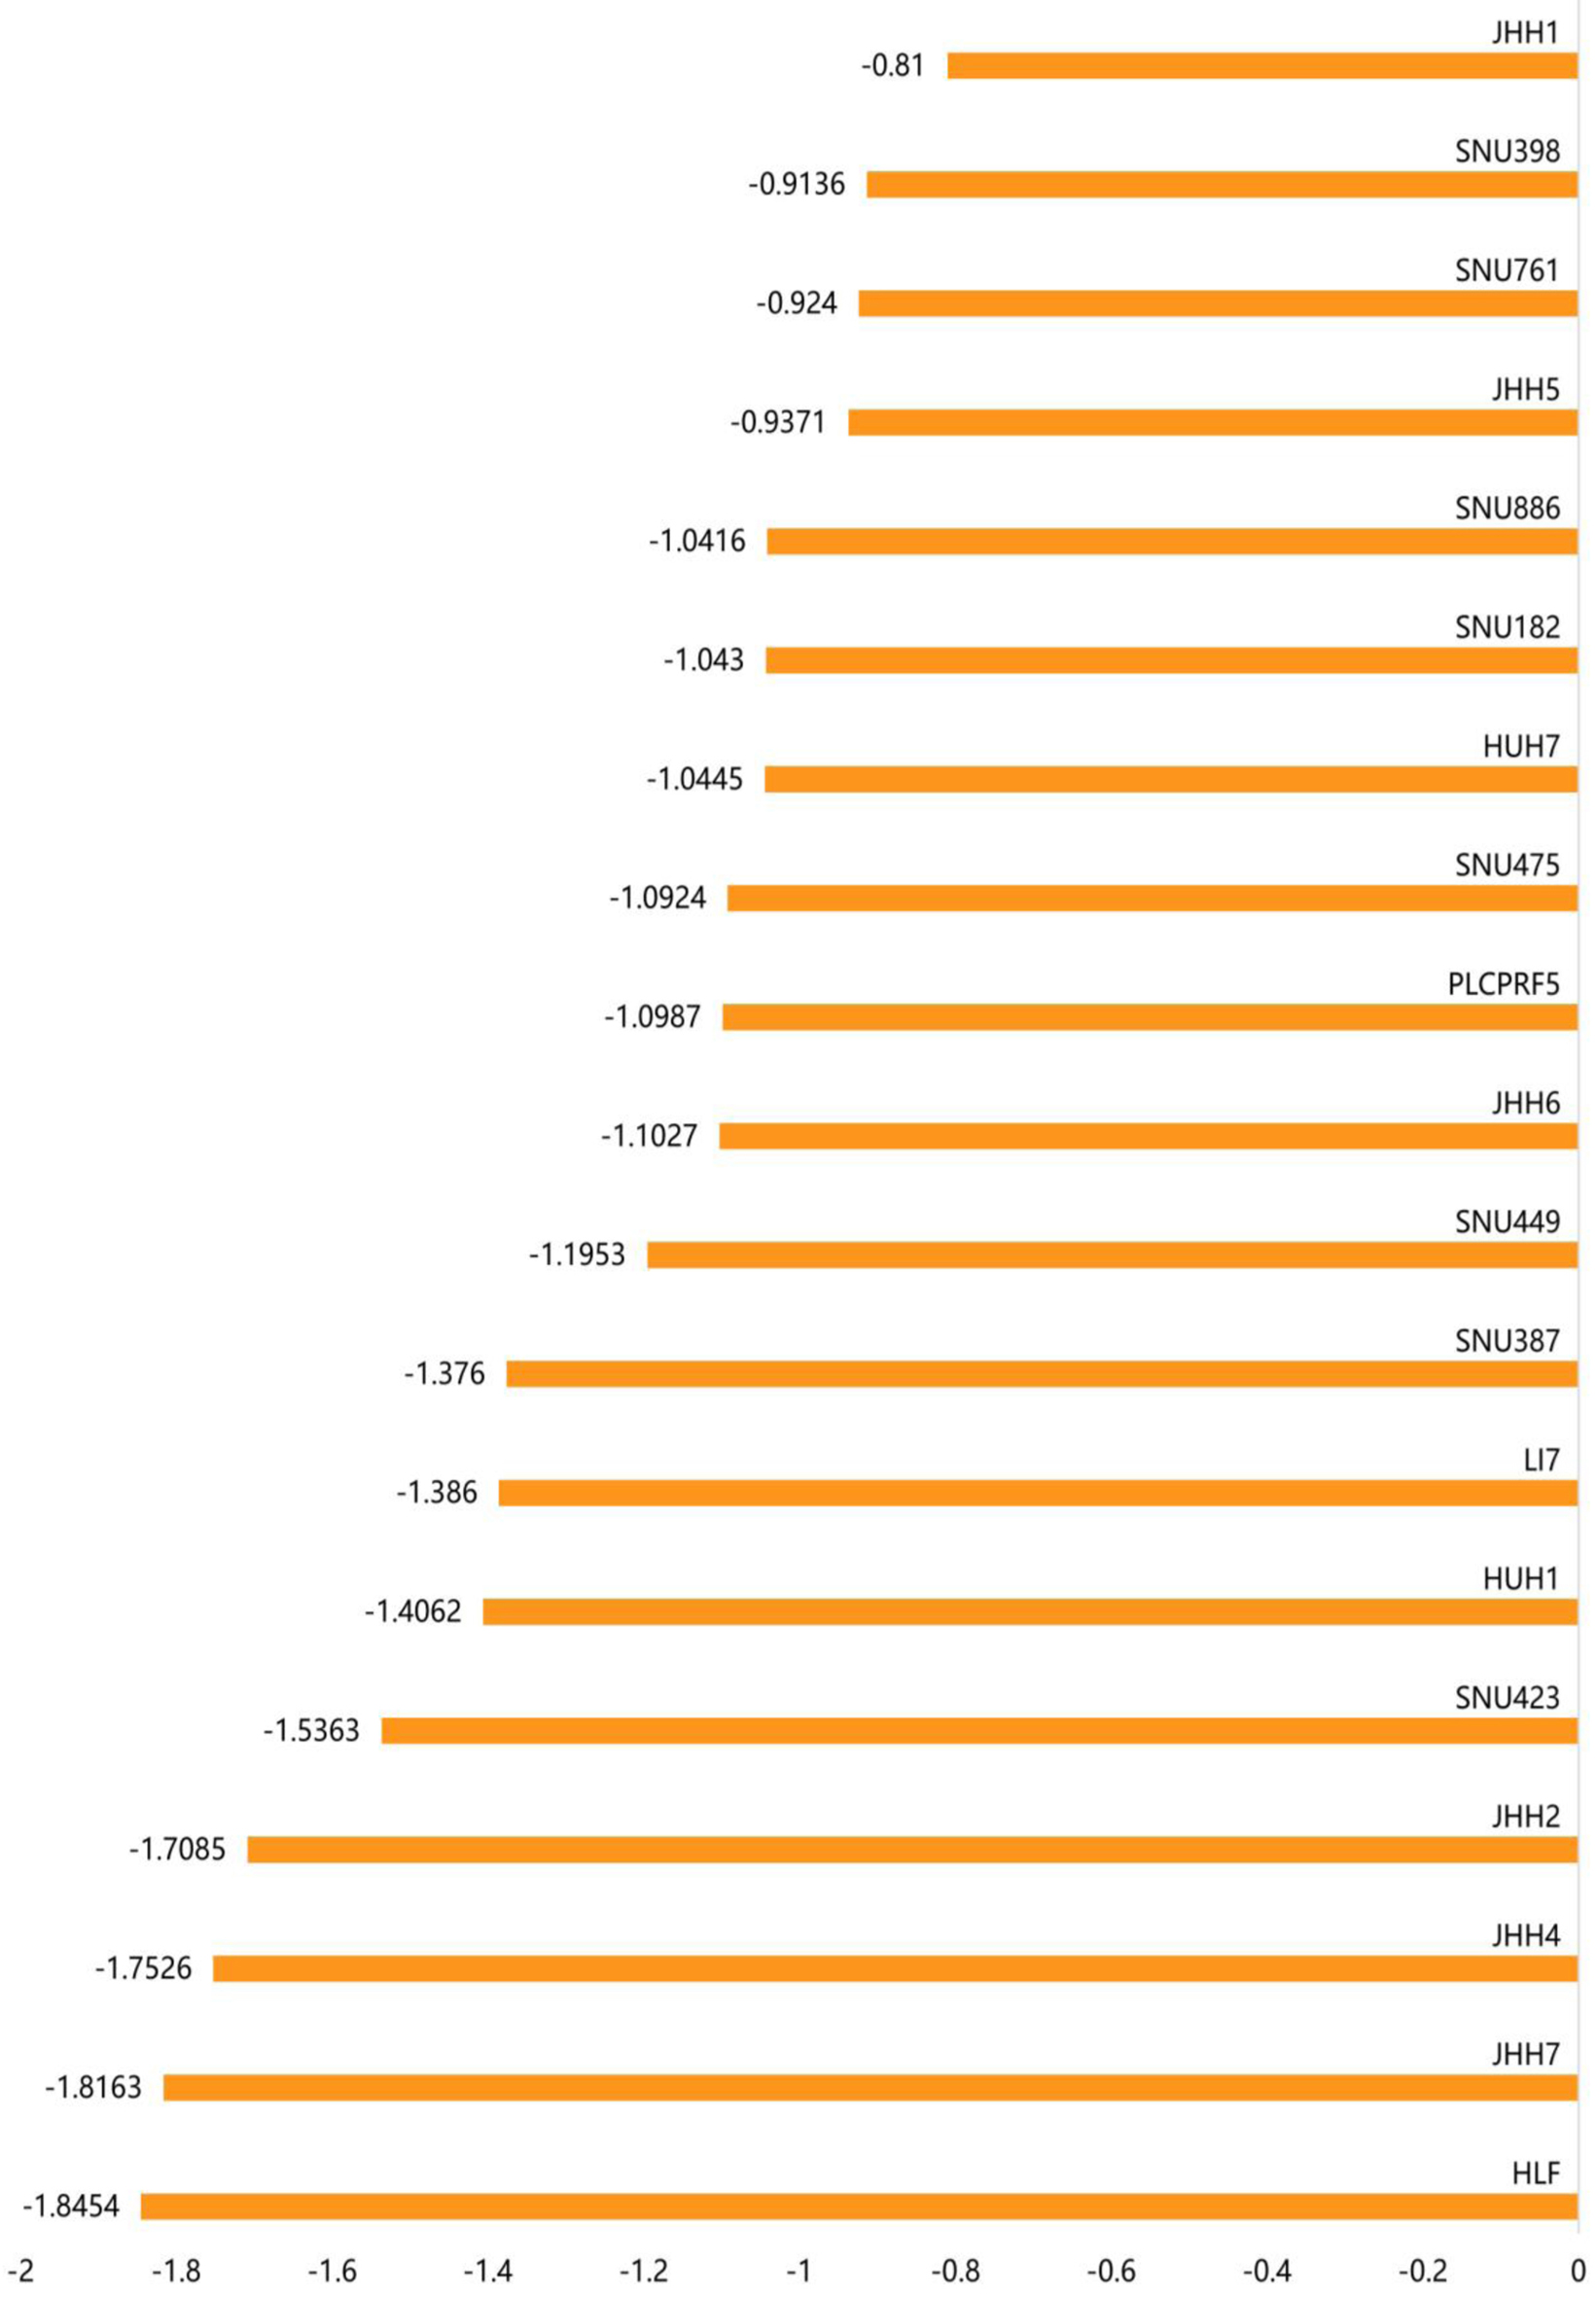 Click for large image | Figure 5. The gene effect scores for the ACTR10 gene in the 19 HCC cell lines. The abscissa represents the gene effect score of ACTR10 in each HCC cell line and the ordinate represents the 19 HCC cell lines. HCC: hepatocellular carcinoma. |
The potential pathogenic molecular mechanisms of ACTR10 in HCC
The SMD and Pearson correlation coefficients were calculated to explore potential mechanistic genes associated with ACTR10. There were 9,248 OEGs identified in the HCC samples, and 1,578 ACTR10 CEGs were identified. In total, there were 1,237 intersecting genes, and these were used in subsequent GO, KEGG and Reactome enrichment analyses (Fig. 6a). The GO analysis showed that the significantly enriched pathways were mRNA processing, RNA splicing, ribonucleoprotein complex biogenesis, RNA splicing via transesterification reactions with bulged adenosine as nucleophile, RNA splicing via transesterification reactions and mRNA splicing via spliceosome. In the KEGG analysis, the top enrichment item was nucleocytoplasmic transport, and in the Reactome analysis, the top three items were processing of capped intron-containing pre-mRNA, mRNA splicing-major pathway and mitotic anaphase (Fig. 6b-d).
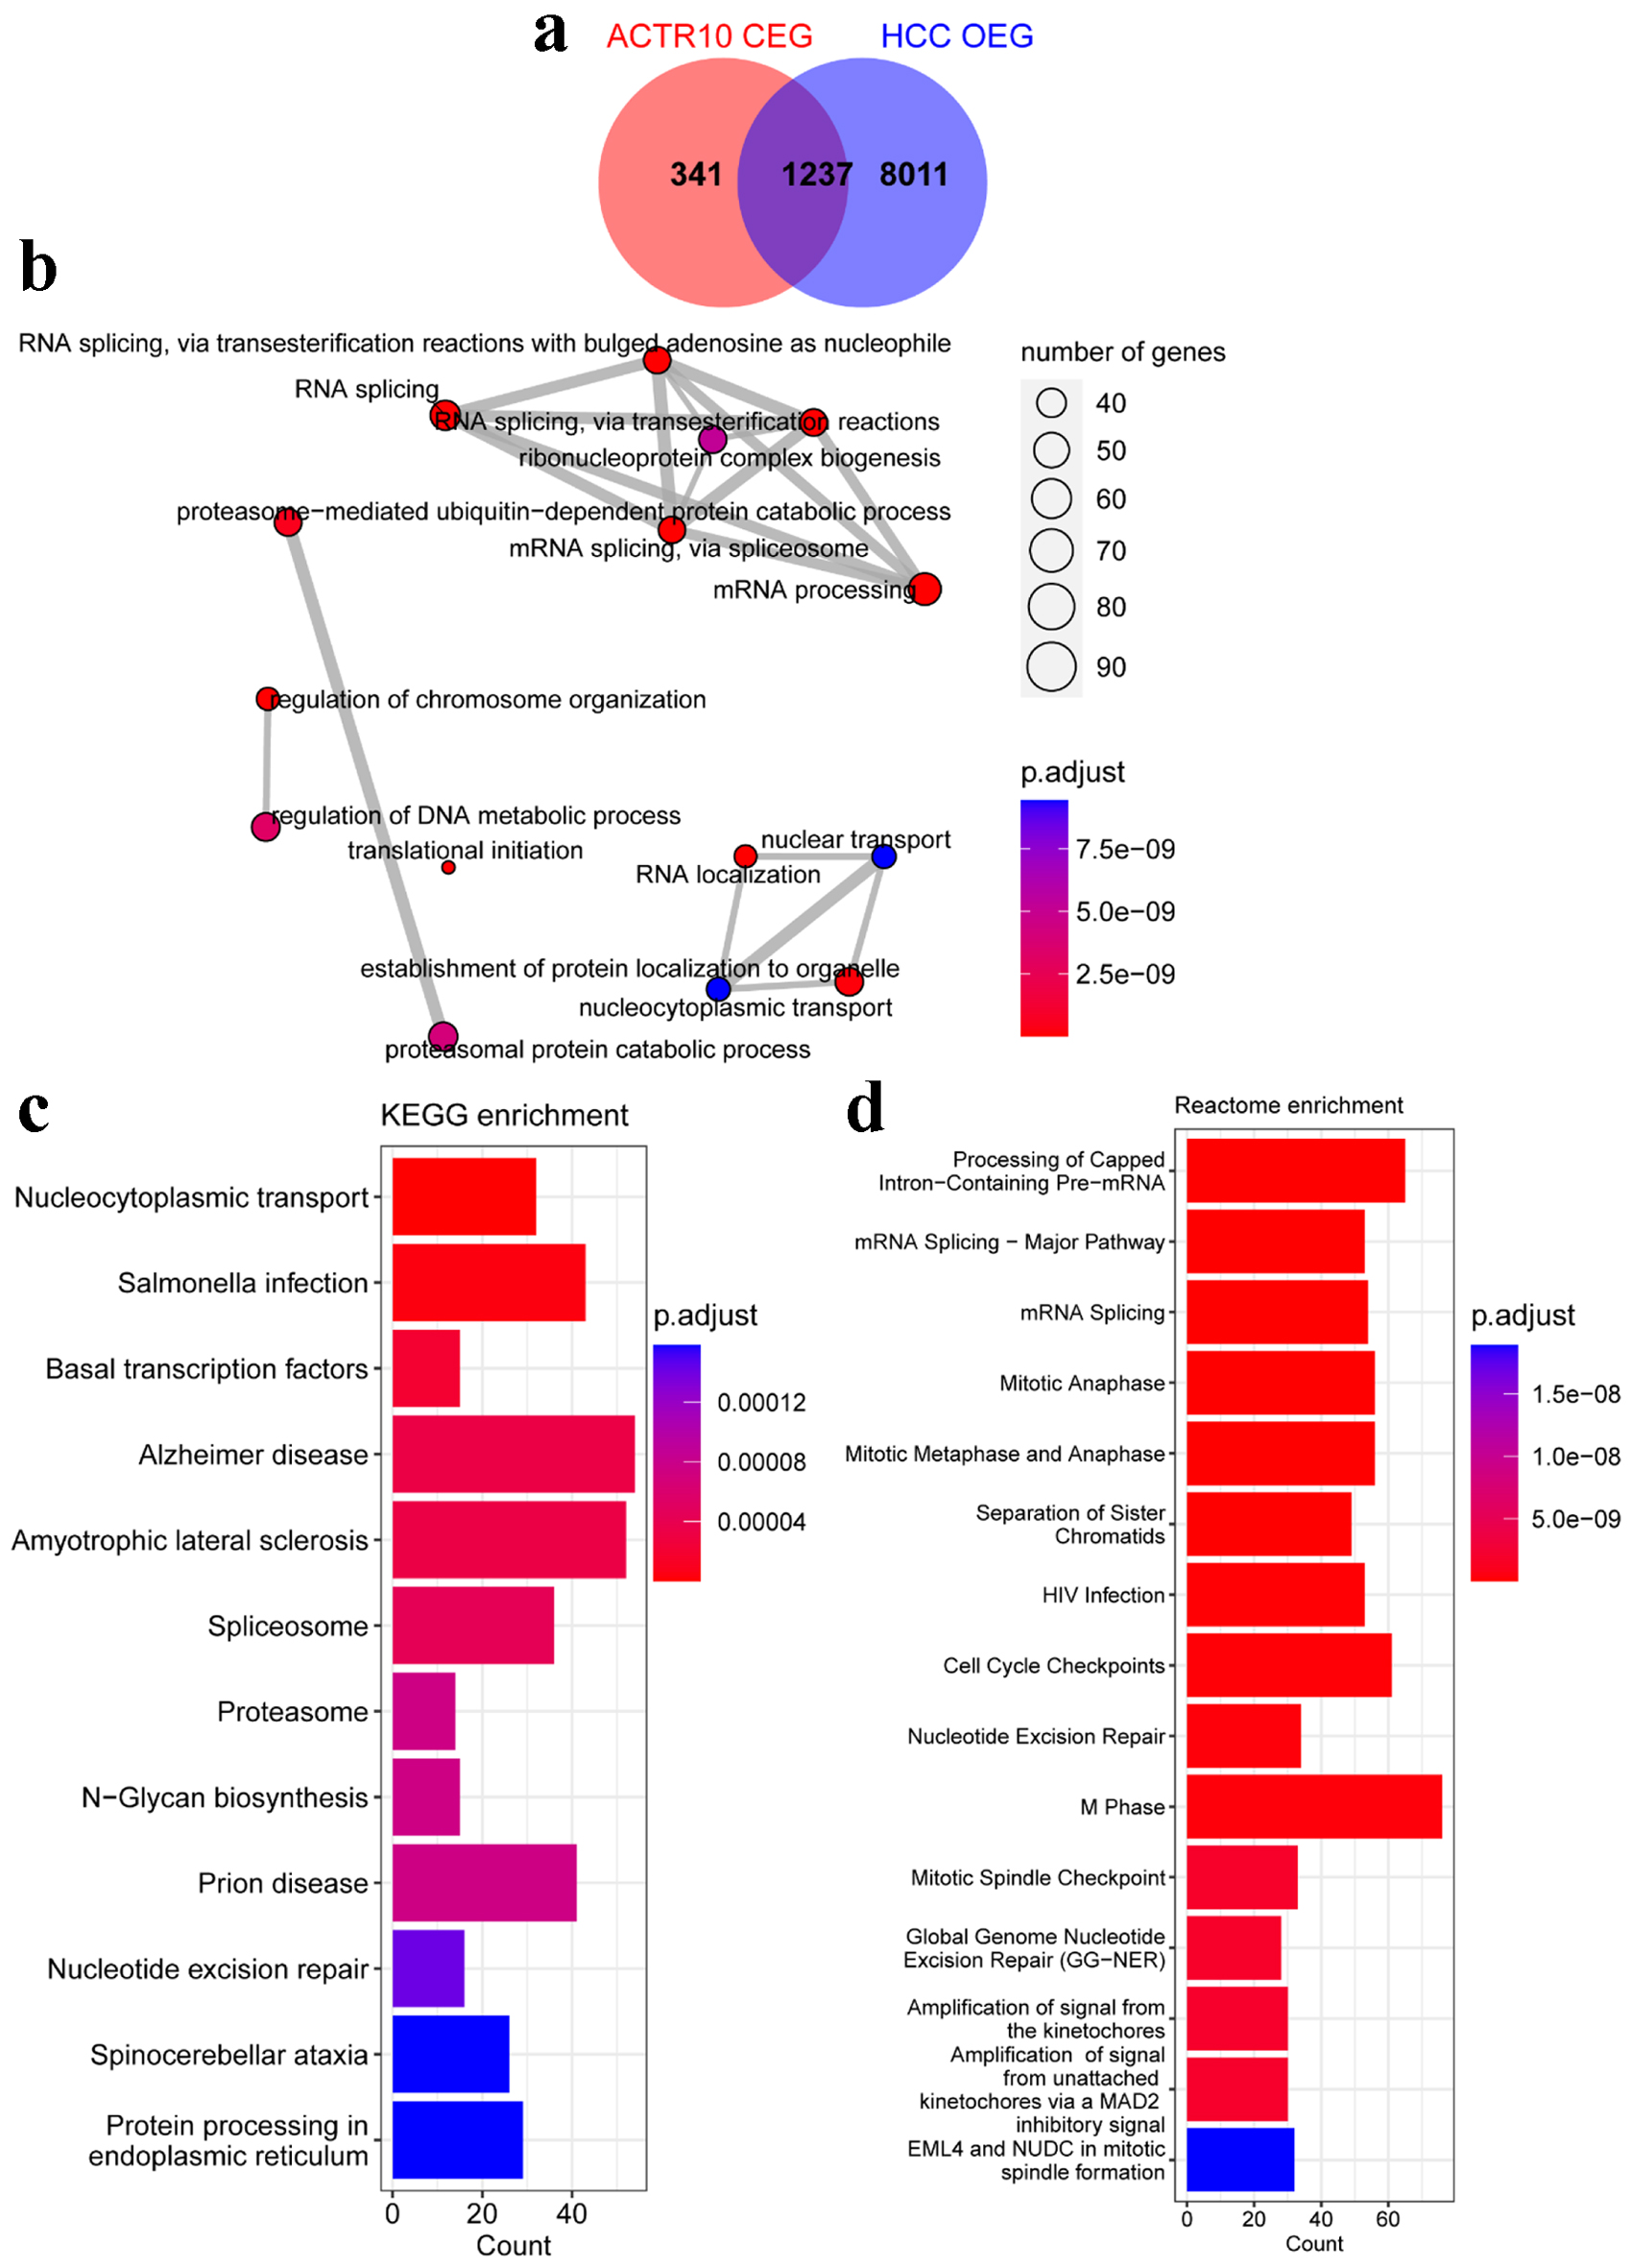 Click for large image | Figure 6. Analyses of the potential pathogenic molecular mechanisms of ACTR10 in HCC. (a) Intersecting genes were identified by overlapping the HCC OEGs and ACTR10 CEGs. (b) The intersecting genes were subjected to GO functional enrichment. (c) The intersecting genes were subjected to KEGG signal pathway analysis. (d) The intersecting genes were subjected to Reactome signal pathway analysis. CEGs: co-expressed genes; GO: Gene Ontology; HCC: hepatocellular carcinoma; KEGG: Kyoto Encyclopedia of Genes and Genomes; OEGs: overexpressed genes. |
High expression of ACTR10 indicated poor prognosis in HCC and TKI resistance
The impact of ACTR10 on the prognosis of HCC patients
As shown in Figure 7, three datasets were selected for use in the survival analysis, and Table 2 provides information on the sample size of each dataset and the platform used to collate each dataset. The prognostic data of the HCC patients were recorded for K-M survival and univariate Cox regression analyses. The K-M survival analysis results across the three datasets consistently indicated that the high expression of ACTR10 was tied to a poorer prognosis. Subsequently, pooled HRs, which incorporated the Cox regression analyses results from the three datasets, implicated ACTR10 as a hazardous factor for HCC (HR = 2.19, 95% CI = 1.56 - 3.08, I2 = 0%, P = 0.48) (Fig. 8).
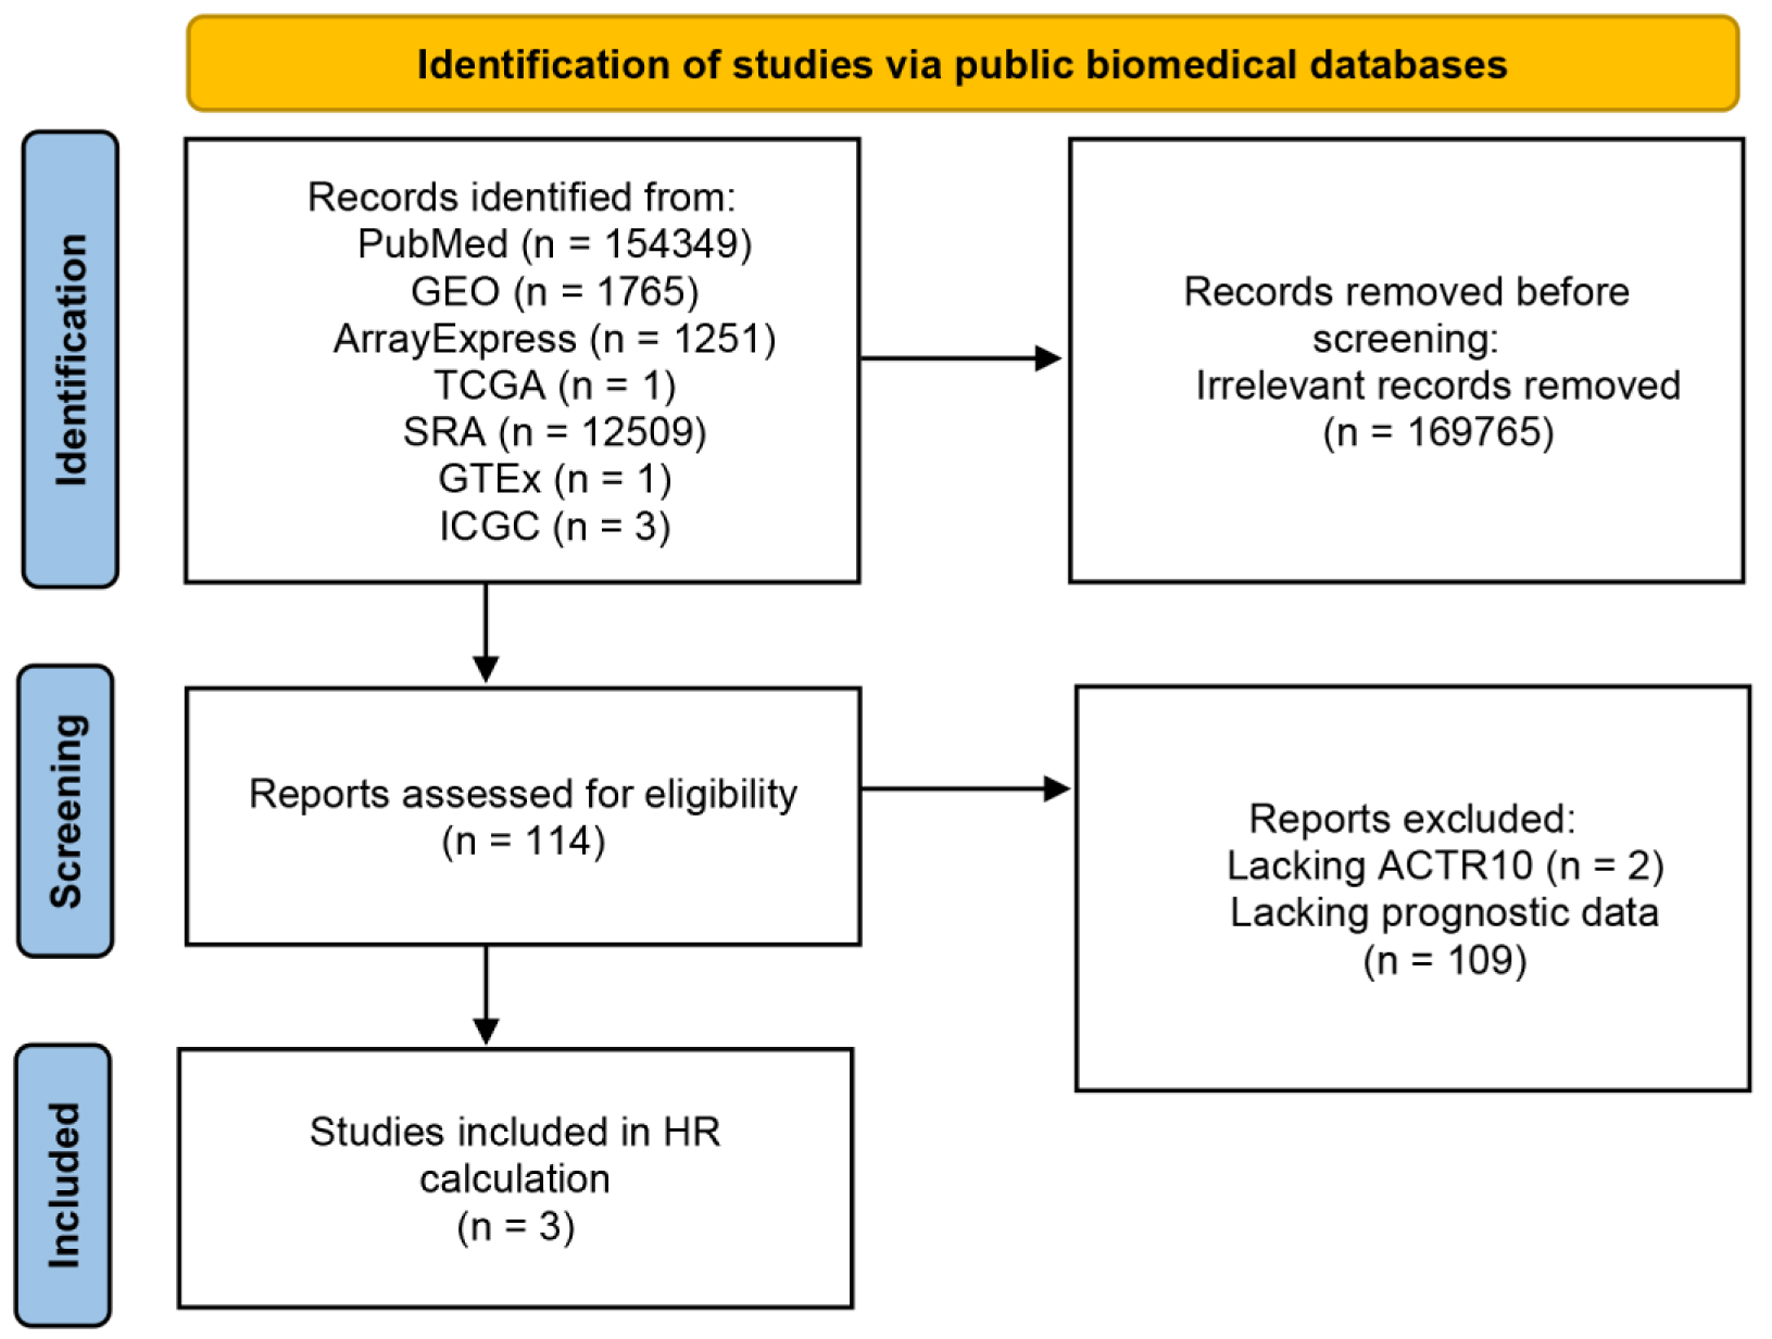 Click for large image | Figure 7. Flow chart showing the process used to screen and select the datasets for the survival analysis. GEO: Gene Expression Omnibus; GTEx: Genotype-Tissue Expression; ICGC: International Cancer Genome Consortium; SRA: Sequence Read Archive; TCGA: The Cancer Genome Atlas. |
 Click to view | Table 2. Information on the Datasets Used for the Survival Analysis |
 Click for large image | Figure 8. The resultant forest plot showed that ACTR10 was a risk factor for HCC patients. HCC: hepatocellular carcinoma; HR: hazard ratio. |
The expression of ACTR10 in HCC with TKI resistance
Figure 9 shows the process used to select the 12 datasets included in the transcriptome-level TKI resistance analysis. Detailed information on the selected datasets is presented in Table 3. Among the 12 datasets, only GSE158458_1, GSE158458_2 and GSE94550 showed high expression of ACTR10 in the experimental group (P < 0.05, Supplementary Material 2, wjon.elmerpub.com). ACTR10 expression was found to be significantly higher in the TKI-resistant HCC samples compared to that in the TKI-sensitive HCC samples, as determined by a random-effects model (Fig. 10a; SMD = 0.88, 95% CI: 0.01 - 1.76, I2 = 54%, P = 0.01). Moreover, the results of the Begg’s and Egger’s tests implied that there was no publication bias, with P = 0.193 and 0.630 (Fig. 10b, c).
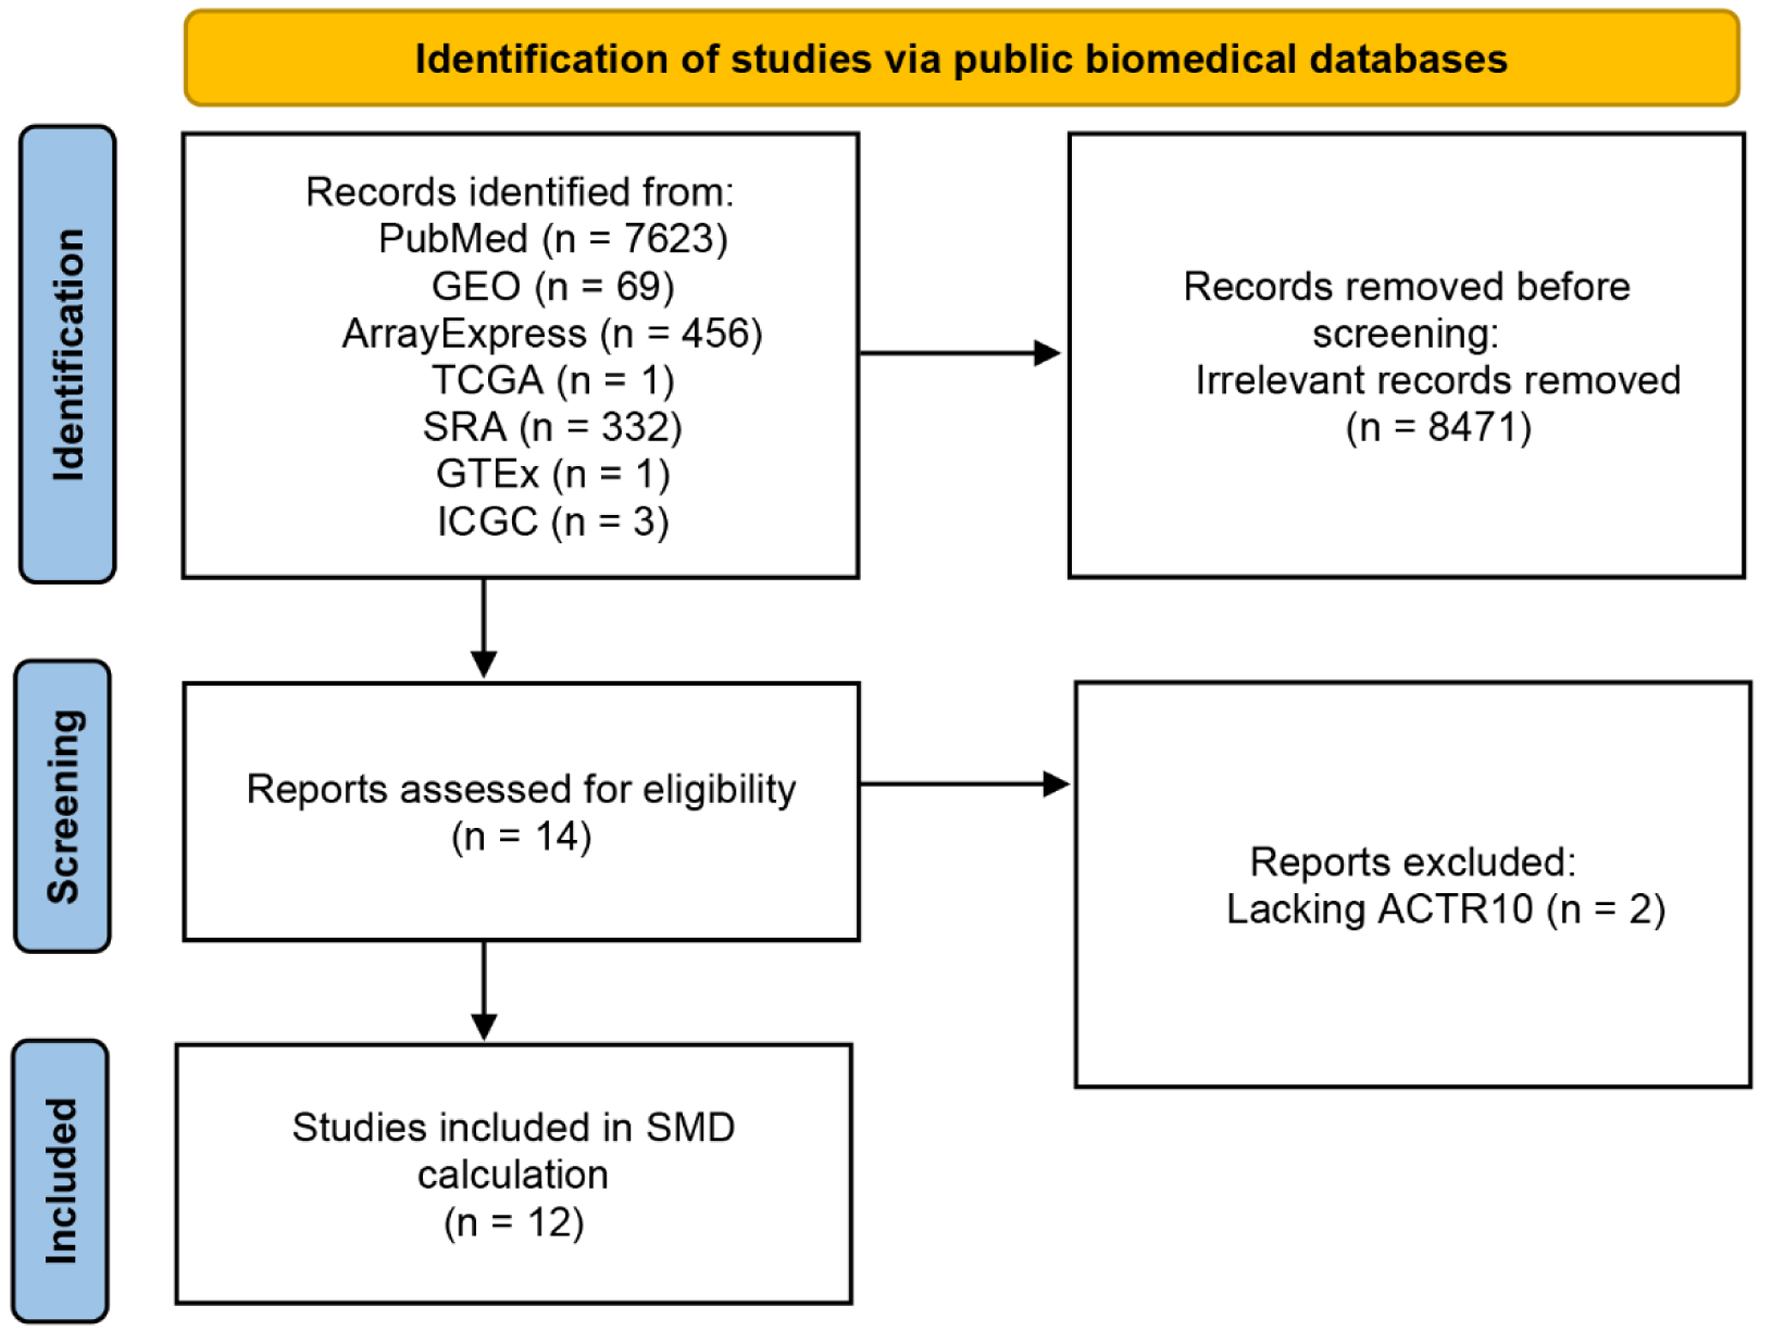 Click for large image | Figure 9. Flow chart showing the process used to screen and select the datasets for the transcriptome-level TKI-resistance analysis. GEO: Gene Expression Omnibus; GTEx: Genotype-Tissue Expression; ICGC: International Cancer Genome Consortium; SRA: Sequence Read Archive; TCGA: The Cancer Genome Atlas; TKI: tyrosine kinase inhibitor. |
 Click to view | Table 3. Information on the Datasets Used in the Transcriptome-Level TKI-Resistance Analysis |
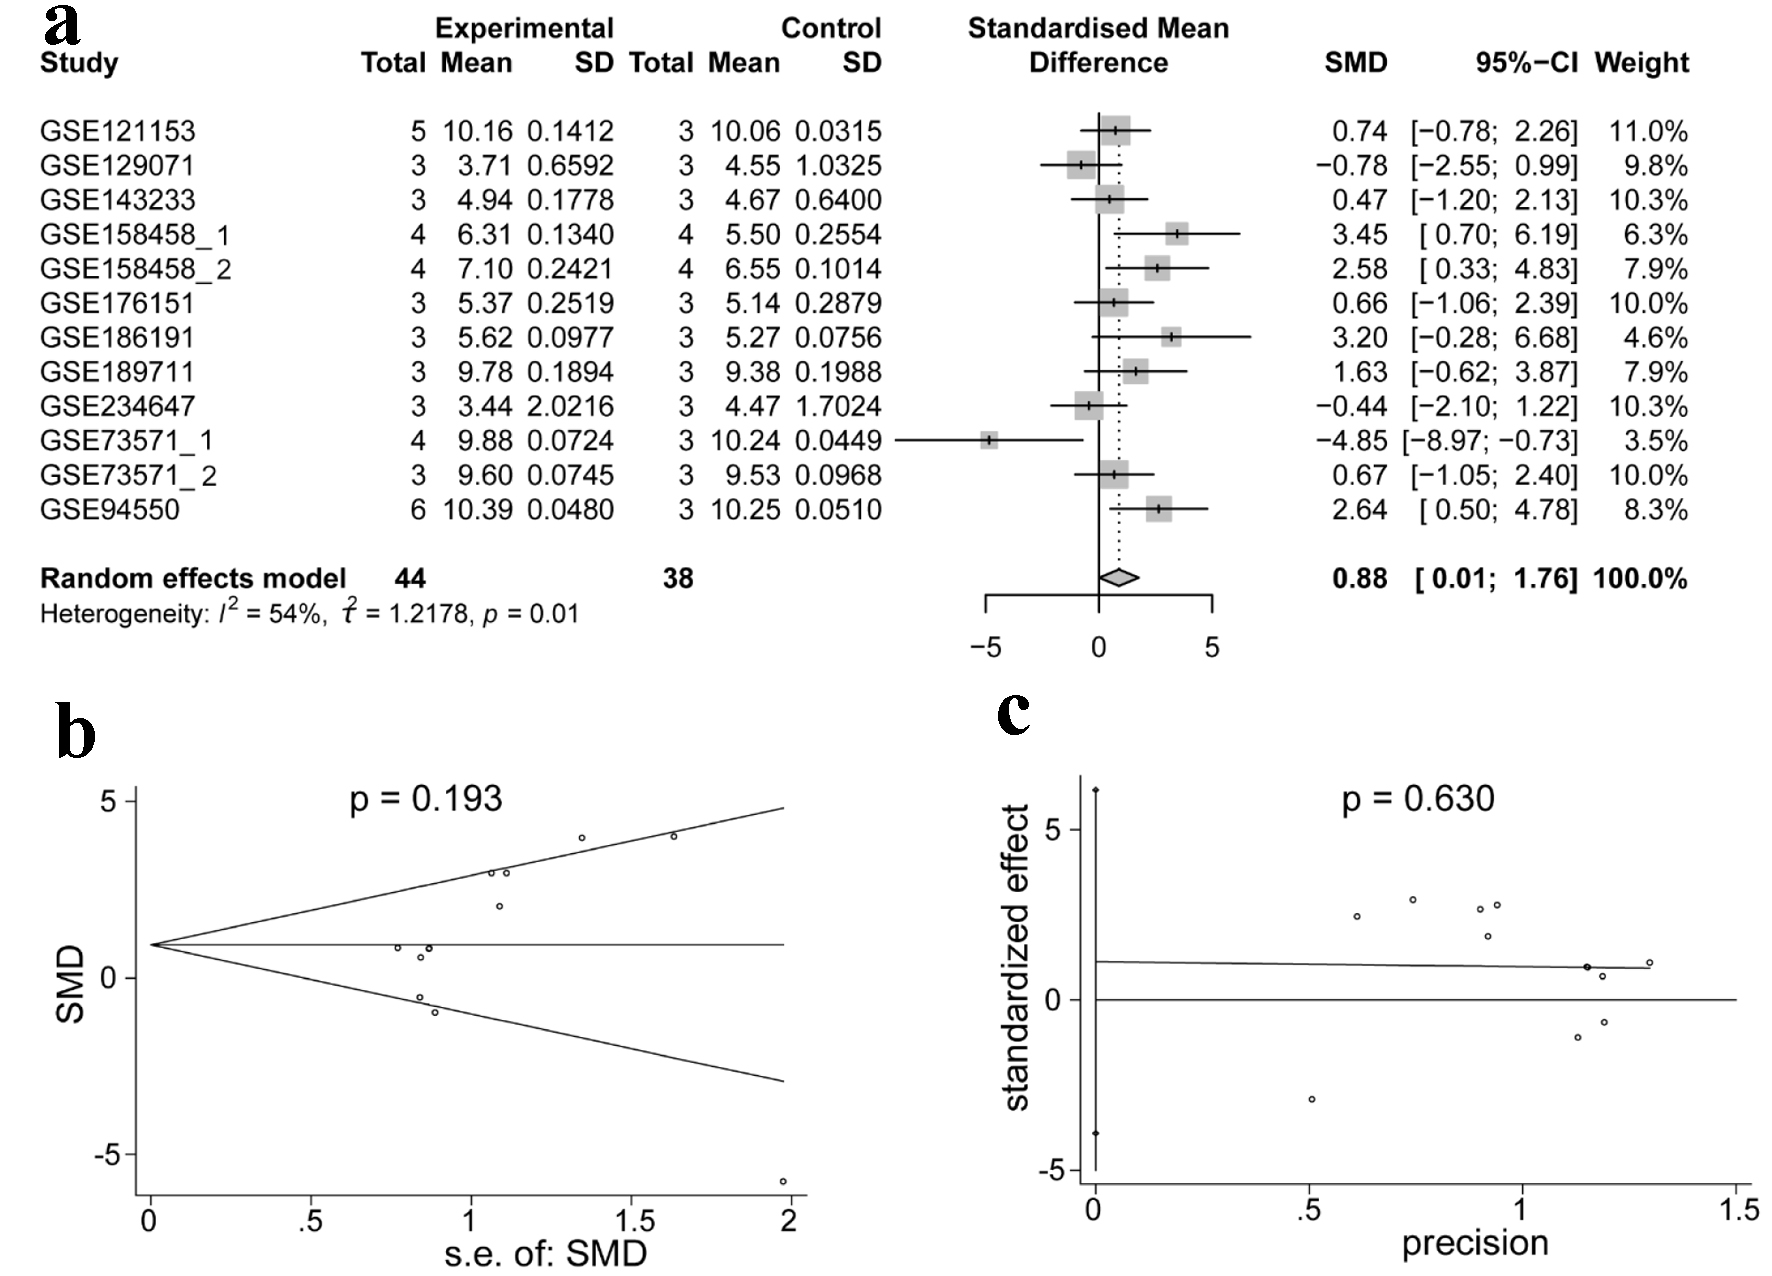 Click for large image | Figure 10. Integrated analysis of the expression of ACTR10 in TKI-resistant HCC. (a) Forest plot showing the high expression of ACTR10 in TKI-resistant HCC samples compared to TKI-sensitive samples. (b, c) The results of Egger’s and Begg’s tests showed that there was no publication bias. HCC: hepatocellular carcinoma; TKI: tyrosine kinase inhibitor. |
Predictive ability of upregulated ACTR10 in HCC with TKI resistance
To assess the discriminatory capacity of ACTR10 in patients with TKI-resistant and TKI-sensitive HCC, the ROC curves of the RNA sequencing datasets listed in Figure 11 were generated. The GSE158458_1, GSE158458_2, GSE186191 and GSE94550 datasets indicated that ACTR10 had excellent discriminatory capacity, and the GSE121153, GSE176151 and GSE189711 datasets showed that ACTR10 had moderate predictive ability (P < 0.05, Supplementary Material 3, wjon.elmerpub.com). The AUCs of the combined sROC curves, sensitivities and specificities were 0.99 (95% CI: 0.98 - 1.00), 0.99 (95% CI: 0.61 - 1.00) and 0.73 (95% CI: 0.23 - 0.96), respectively (Fig. 11a-c). The positive DLR was 3.71 (95% CI: 0.74 - 18.58, I2 = 72.25%) and the negative DLR was 0.01 (95% CI: 0.00 - 0.80, I2 = 81.29%) (Fig. 11d, e).
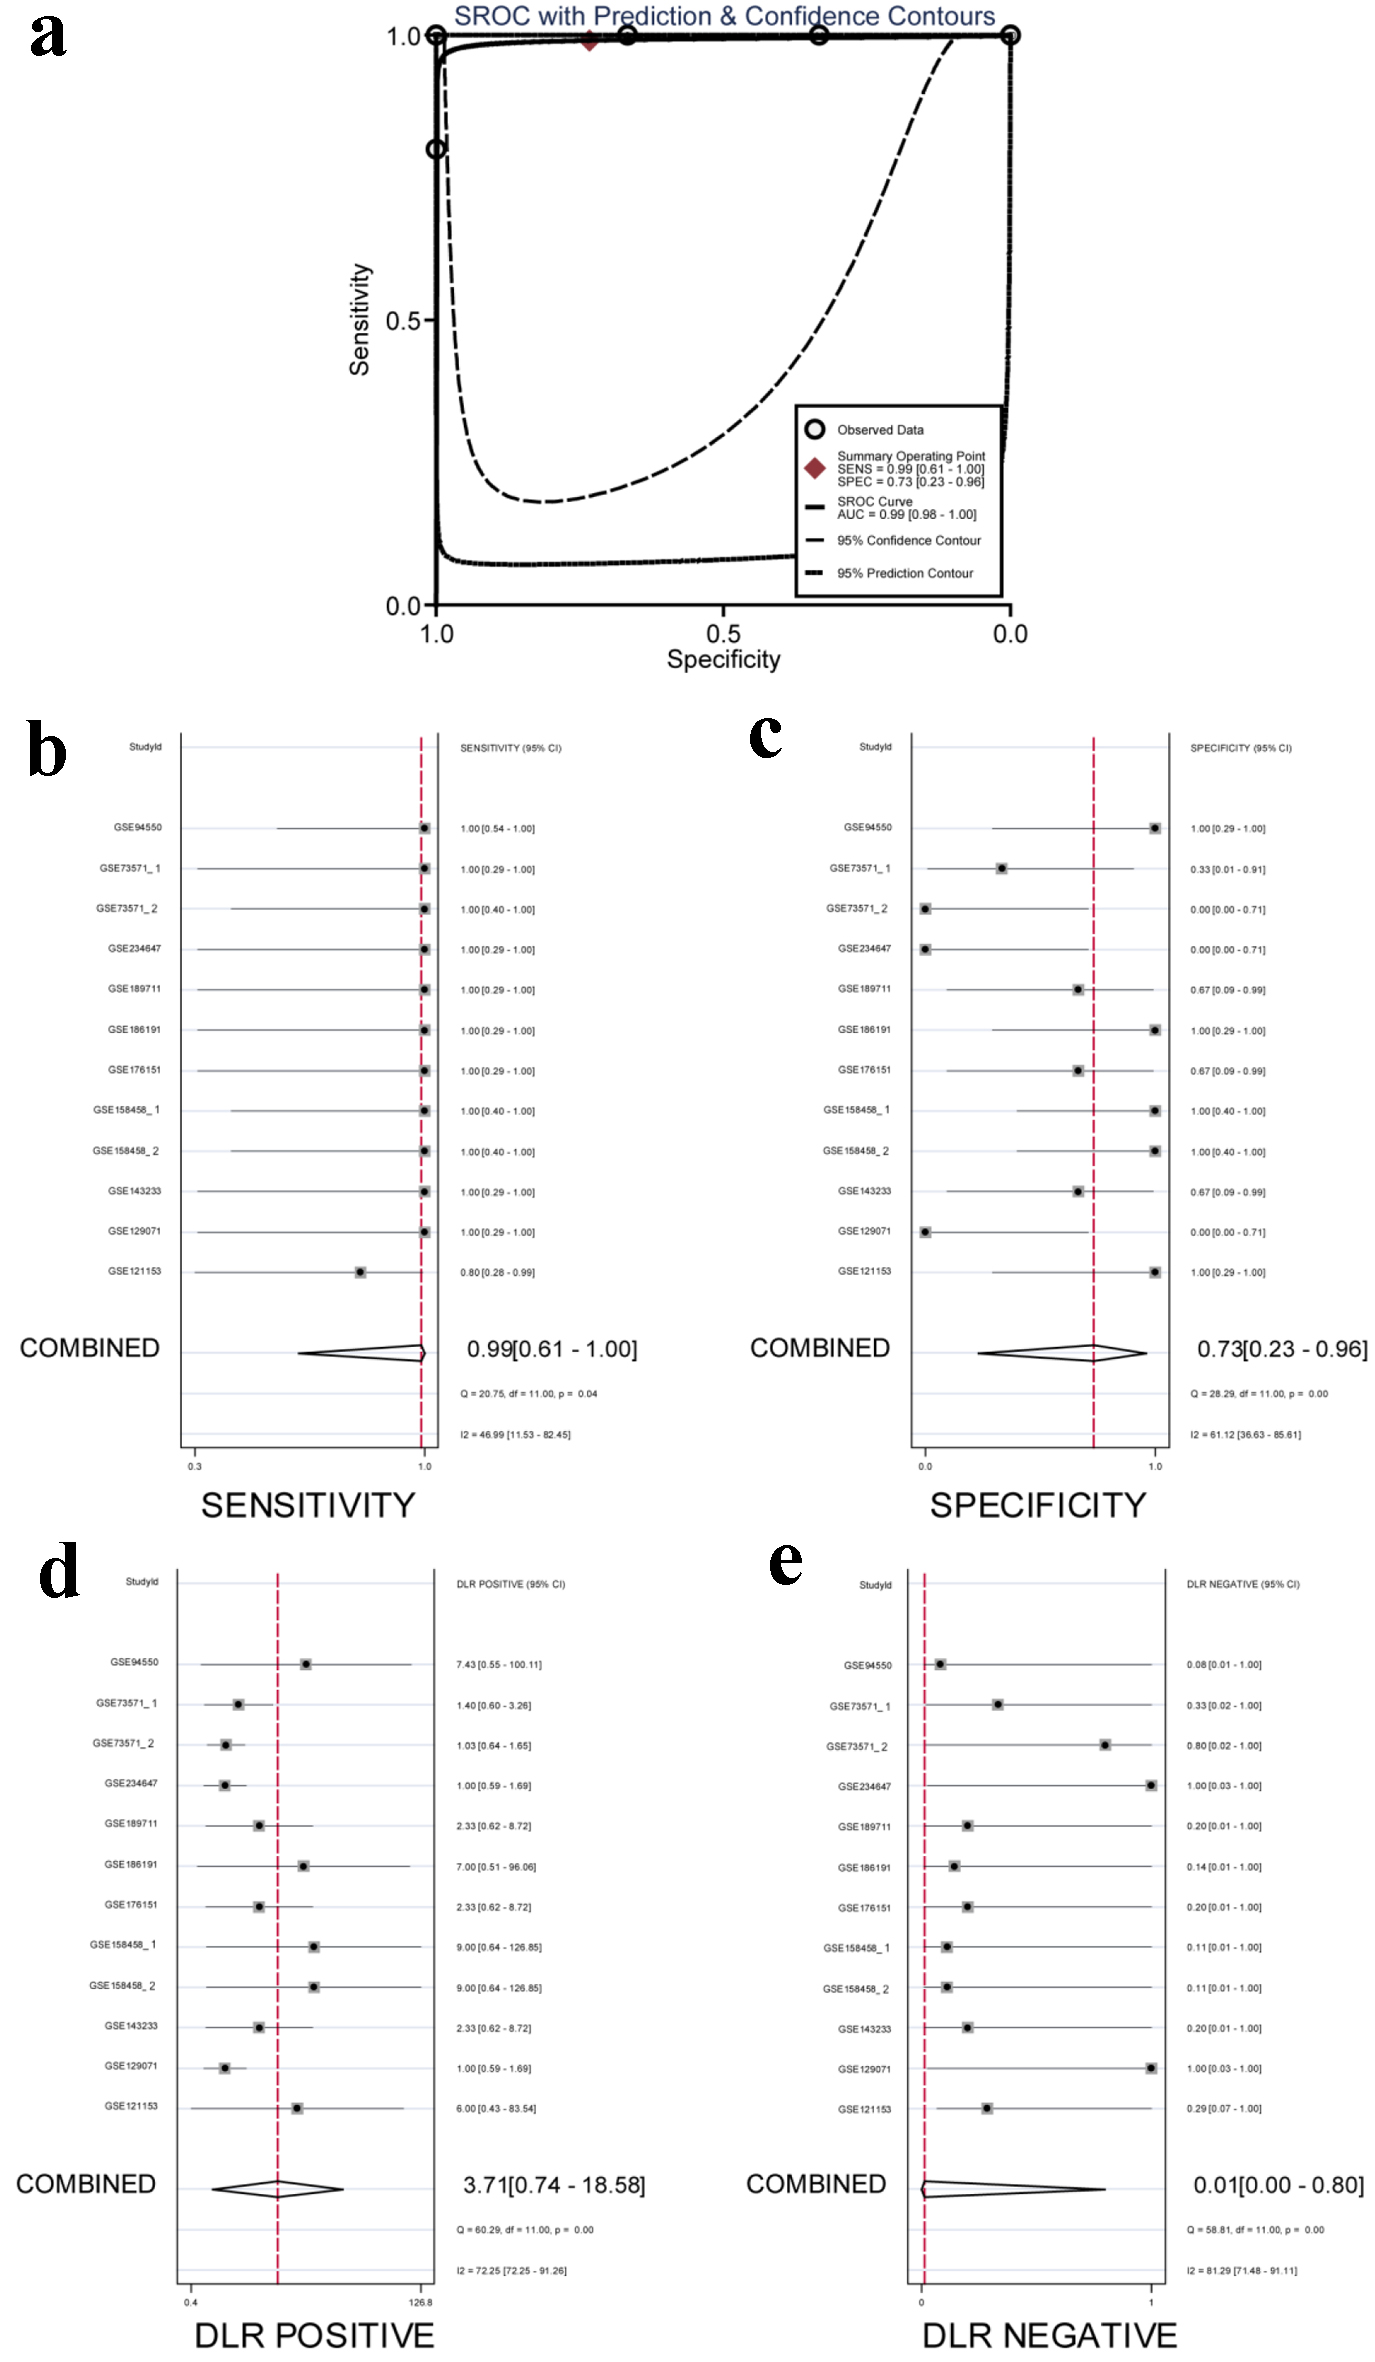 Click for large image | Figure 11. Integrated analysis of the diagnostic performance of ACTR10 in TKI-resistant HCC. (a) The AUC of the sROC curve was 0.99 (95% CI: 0.98 - 1.00), with a sensitivity of 0.99 (95% CI: 0.61 - 1.00) and a specificity of 0.73 (95% CI: 0.23 - 0.96). (b) The combined sensitivity was 0.99 (95% CI: 0.61 - 1.00). (c) The combined specificity was 0.73 (95% CI: 0.23 - 0.96). (d) The combined positive DLR was 3.71 (95% CI: 0.74 - 18.58). (e) The combined negative DLR was 0.01 (95% CI: 0.00 - 0.80). AUC: area under the curve; CI: confidence interval; DLR: diagnostic likelihood ratio; HCC: hepatocellular carcinoma; sROC: summary receiver operating characteristic; TKI: tyrosine kinase inhibitor. |
The potential molecular mechanisms used by ACTR10 in HCC to mediate TKI resistance
We used GO, KEGG and Reactome analyses to investigate the role(s) that ACTR10 plays in the mechanism(s) underlying TKI resistance. The top three items identified in the GO analysis were positive regulation of exocytosis, membrane docking and the execution phase of apoptosis in the biological process (BP) category. In terms of the cellular component (CC) category, the top three items were early endosome membrane, early endosome and late endosome. In the molecular function (MF) category, the most significant items were SNARE binding, protease binding and phosphatidylinositol phosphate binding (Supplementary Material 4A, wjon.elmerpub.com). In the KEGG pathway analysis, the only pathway found to be enriched was the autophagy-animal pathway (Supplementary Material 4B, wjon.elmerpub.com). In the Reactome analysis, caspase activation via death receptors in the presence of ligand was the most significantly enriched pathway. Additionally, there was a notable enrichment in the suppression of phagosomal maturation and the insertion of tail-anchored proteins into the endoplasmic reticulum membrane (Supplementary Material 4C, wjon.elmerpub.com ).
Trichostatin A specifically targets ACTR10 in HCC
In the final part of this study, we predicted drugs that likely target ACTR10 and performed molecular docking experiments to investigate the relationships between ACTR10 and the predicted drugs. Trichostatin A was identified as an ACTR10-specific drug, and basic information on trichostatin A is shown in Table 4. In the docking experiments, hydrogen bonds were observed between trichostatin A and the residues THR-309 and PHE-24 of ACTR10 (Fig. 12).
 Click to view | Table 4. Potential Drugs Targeting ACTR10 in DGB Database |
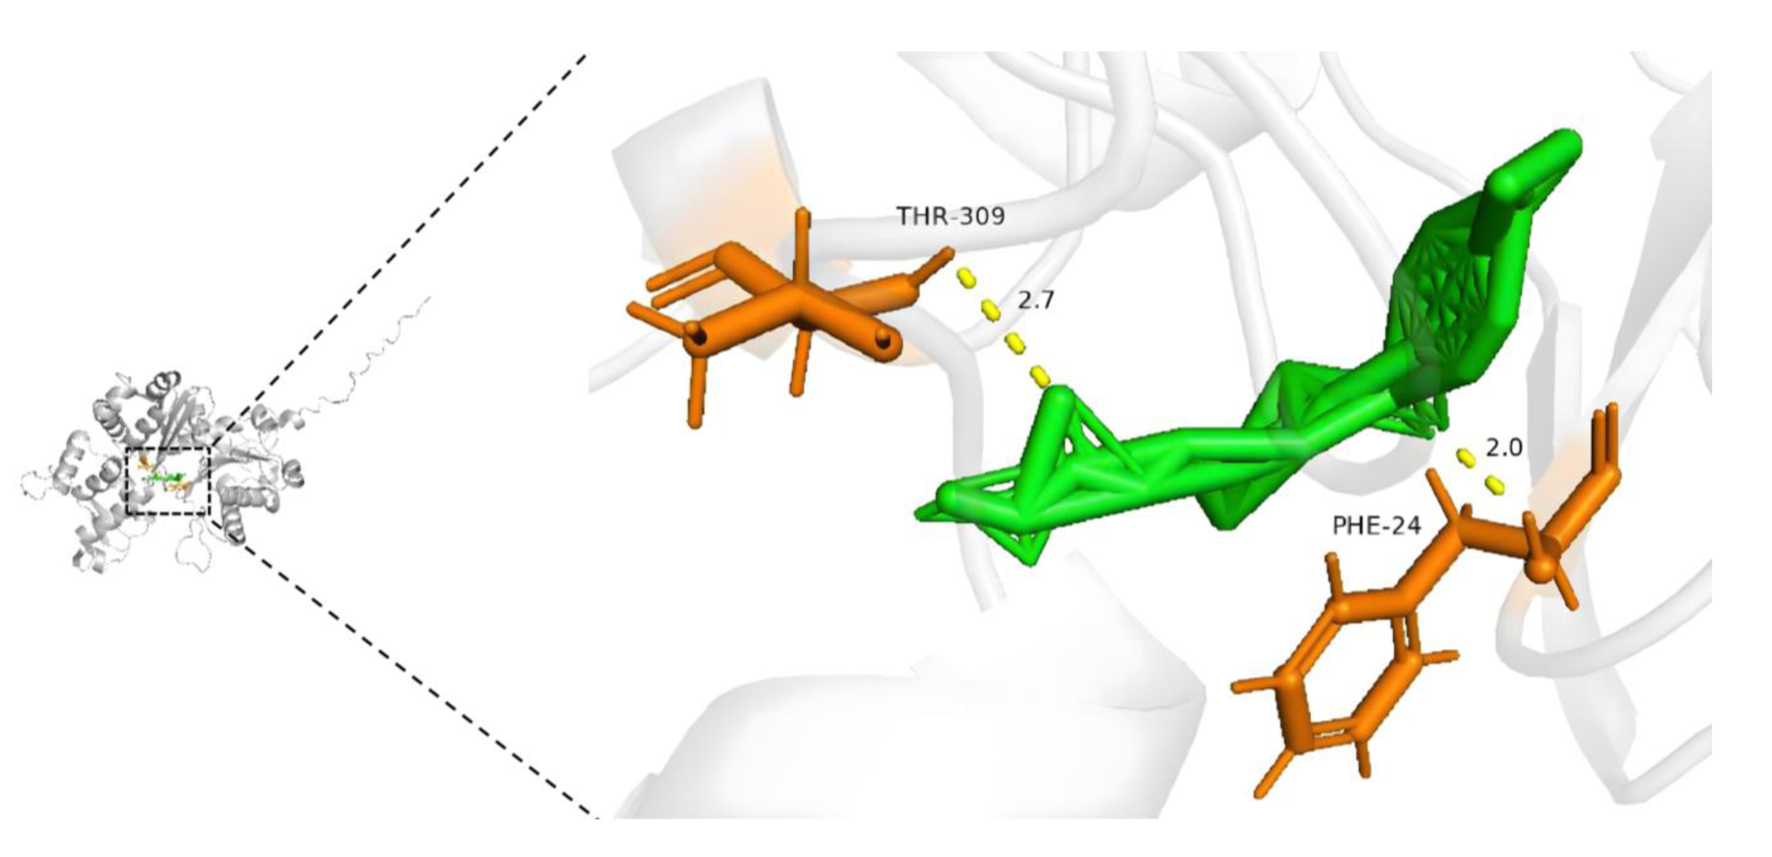 Click for large image | Figure 12. Molecular docking model of trichostatin A and ACTR10 (affinity energy = -8.1 kcal/mol). |
| Discussion | ▴Top |
To date, the association between ACTR10 and HCC has been underexplored. Here, for the first time, we conducted a multi-center study to investigate the differences in ACTR10 expression between 5,098 HCC samples and 3,742 non-cancerous samples and to elucidate the pathological molecular mechanisms involving ACTR10 in HCC. We comprehensively evaluated the clinical value of ACTR10 in HCC by examining prognostic and TKI-resistant transcriptome datasets and have shown that ACTR10 expression significantly varies between HCC and non-HCC liver tissues in many ways. We also examined the value of ACTR10 expression in early disease detection and its associated regulatory pathways and genes. In addition, we conducted drug prediction and molecular docking experiments to identify and analyze therapeutic drugs that could be used to target ACTR10 and counter TKI resistance in HCC.
In recent years, it has been reported that ACTR10 is associated primarily with the development of specific diseases. Xu et al reported that ACTR10 is a hub gene with low expression in Alzheimer’s disease [26]. Takashima et al found that low expression of ACTR10 in primary central nervous system lymphoma may serve as an independent prognostic factor and tends to indicate a poor prognosis [21]. In our study, we comprehensively evaluated 112 datasets and found that ACTR10 expression was high in HCC tissues. The results of our ACTR10 mRNA expression and CRISPR knockout screening data analyses confirmed this cellular-level observation and provided specific guidance on the most appropriate cell lines to use in our future experiments.
ACTR10 and its gene showed high expression at the cellular and genomic levels, respectively, which further stimulated us to explore its role in the pathogenesis of HCC. GO, KEGG and Reactome analyses revealed that ACTR10 may mediate the pathogenesis of HCC by effecting various cellular functions, such as mRNA processing, RNA splicing, nucleocytoplasmic transport and processing of capped intron-containing pre-mRNA. mRNA processing and RNA splicing are basic cellular functions that result in a single gene being transcribed and translated into multiple proteins, and the ribonucleoprotein complex is necessary for RNA splicing [27, 28]. Aberrant gene splicing can facilitate the development of diseases, especially carcinogenesis and tumor progression [28-30]. The nuclear transport system (NTS) mediates nucleocytoplasmic transport, and all the signal transduction cascades that involve molecules that cross the nuclear membrane rely on the NTS. Pathways that have been found to exert influence on the occurrence and development of HCC, such as the WNT/β-catenin, IL6-JAK/STAT, MAPK, PI3K-AKT/mTOR, TGF-β and p53 pathways, are closely related to NTS [31]. Furthermore, nuclear transport factors are also being investigated as drug targets for the treatment of HCC [31]. Hence, our results suggest that ACTR10 may promote HCC development and progression by effecting various cellular functions, including mRNA processing, RNA splicing and nucleocytoplasmic transport.
To examine the clinical value of ACTR10 in HCC, K-M and univariate Cox regression analyses were performed. The results unequivocally confirmed that ACTR10 was an independent risk factor for prognosis, indicating that HCC patients with high ACTR10 expression had shorter overall survival times. In addition, we found that ACTR10 was significantly highly expressed in TKI-resistant HCC samples, and this led us to comprehensively evaluate ACTR10 expression in TKI-resistant HCC samples collected from multiple platforms. The Wilcoxon test results demonstrated that the expression of ACTR10 was upregulated in most TKI-resistant HCC samples compared to the TKI-sensitive HCC samples. Subsequent integration analysis further validated this observation. Moreover, the AUC analysis demonstrated that ACTR10 exhibited an outstanding ability to distinguish between HCC patients with TKI resistance and those with TKI sensitivity. Notably, considering the robust negative-positive likelihood ratio, ACTR10 showed an enhanced proficiency in the assessment of negative outcomes. In light of recent findings, an important avenue for future research involves the therapeutic implications of capecitabine in conjunction with ACTR10 expression in HCC. Previous studies have highlighted that HCC patients who do not respond to first-line therapy with sorafenib may benefit from second-line treatment with capecitabine, demonstrating favorable efficacy and safety profiles [32-34]. Integrating ACTR10 as a biomarker could potentially refine patient selection for this treatment, enhancing personalized therapy approaches and improving clinical outcomes. Future studies should focus on the mechanistic pathways involved and assess the predictive value of ACTR10 in determining response to capecitabine, thereby optimizing treatment regimens for HCC.
To explore the molecular mechanisms and functions involving ACTR10 that lead to TKI resistance in HCC, genes found to be highly expressed in TKI-resistant samples were subjected to separate GO, KEGG and Reactome enrichment analyses. The GO analysis suggested that ACTR10 may promote resistance to TKI in HCC patients through positive regulation of exocytosis, early endosome membrane and SNARE binding. The intricate process of exocytosis constitutes a significant aspect contributing to the development of TKI resistance. Hu et al revealed that activation of the EGFR-STAT3-ABCB1 pathway led to acquired lenvatinib resistance in HCC patients by significantly enhancing exocytosis [35]. In their experiments with oral squamous cell carcinoma samples, Kim et al found that ABCA2 drove lysosomal exocytosis that enhanced tolerance to multiple TKIs and that the key was to regulate lysosomal transport [36]. The endosome is the sorting station for different internalized proteins, it is where they select their transport routes, and it plays a critical role in the initial stages of exocytosis [37]. SNAREs have been shown to be highly conserved membrane proteins that mediate membrane fusion in trafficking pathways and play key roles in endosomal sorting, homotypic fusion and exocytosis [38]. The KEGG analysis indicated that autophagy may play a crucial role in TKI resistance in HCC patients. Autophagy is considered to be a protective mechanism that cancer cells use against anti-cancer drugs, and inhibition of autophagy has been shown to reduce resistance to some anti-cancer drugs, such as TKIs and 5-fluorouracil [39, 40]. The Reactome analysis implied that ACTR10 may contribute to TKI resistance in HCC patients by effecting caspase activation via death receptors in the presence of ligands. Others have shown that elevated expression of death receptors induces apoptosis in tumor cells, which alleviates resistance to TKI [41, 42]. However, our results were not consistent with the findings of those studies. This might be attributed to ACTR10 inducing apoptosis in TKI-sensitive cells, resulting in an increased proportion of TKI-resistant cells. In brief, these results led us to propose that ACTR10 might be directly or indirectly involved in the regulation of exocytosis, thus playing a role in TKI resistance.
To identify drugs that can be used to treat HCC and counteract TKI resistance, we screened for drugs using the DGB database and utilized molecular docking techniques. Our findings substantiated the notion that trichostatin A could serve as a targeted therapeutic agent. Zhao et al discovered that trichostatin A may attenuate TKI resistance in non-small cell lung cancer by inhibiting histone deacetylation and thereby participating in the epigenetic activation of Bcl-2-like protein 11 [43]. In summary, trichostatin A may play a pivotal role in the treatment of HCC by targeting ACTR10.
However, there were several limitations of this study. First, the included datasets had high heterogeneity during the integrated statistical analysis. This might have been a result of the different methods and platforms used to generate the datasets. To manage the significant heterogeneity, we utilized a random-effects model in our analysis. Second, compared to the large number of HCC samples utilized, the number of TKI-resistant HCC samples was relatively limited. Thus, future research should include larger sample sizes and comprehensive information on clinical features. Third, the methodologies utilized in this study did not allow us to identify the mechanism of ACTR10 in HCC; therefore, further in vivo or in vitro studies should be conducted to identify the regulatory axis of ACTR10 in HCC. Fourth, future research should explore integrating artificial intelligence with the ACTR10 biomarker to expand therapeutic strategies for HCC, enhancing precision medicine approaches [44].
Conclusion
This is the first study to evaluate the clinical significance of ACTR10 in HCC. ACTR10 was found to be significantly upregulated in patients with HCC compared with non-tumor patients. It potentially exerts a pro-cancer effect by influencing RNA splicing, mRNA processing and/or nucleocytoplasmic transport. It was also found that ACTR10 is a potential independent prognostic risk factor, with significant overexpression in TKI-resistant HCC cases. ACTR10 emerged as an excellent biomarker, effectively distinguishing TKI-resistant HCC samples from TKI-sensitive HCC samples. Furthermore, ACTR10 may mediate TKI resistance in HCC, possibly through mechanisms involving heightened exocytosis, autophagy and apoptosis. Additionally, trichostatin A was identified as a prospective targeted drug for the treatment of HCC.
| Supplementary Material | ▴Top |
Suppl 1. Expression of ACTR10 in HCC samples. A statistically significant trend of high expression of ACTR10 was observed in the presented 19 datasets. The red violin plots show the HCC samples and the blue violin plots show the non-HCC samples.
Suppl 2. ACTR10 was highly expressed in the TKI-resistant HCC samples, as shown by the violin plots. TKI-S: tyrosine kinase inhibitor-sensitive; TKI-R: tyrosine kinase inhibitor-resistant.
Suppl 3. The discriminative ability of ACTR10 in TKI-sensitive and TKI-resistant samples. AUC: area under the curve.
Suppl 4. Analysis of the TKI-resistance mechanisms of ACTR10 in HCC. (A) GO functional enrichment analysis of differentially expressed genes in TKI-resistant samples. (B) KEGG signal pathway enrichment analysis of differentially expressed genes in TKI-resistant samples. (C) Reactome signal pathway enrichment analysis of differentially expressed genes in TKI-resistant samples. GO: Gene Ontology; KEGG: Kyoto Encyclopedia of Genes and Genomes.
Acknowledgments
The authors manifest great appreciation to all those involved in this research.
Financial Disclosure
Guangxi Zhuang Autonomous Region Health Committee Scientific Research Project, No. Z20201147; China Undergraduate Innovation and Entrepreneurship Training Program, No. 202210598043X, No. S202310598056X; Innovation Project of Guangxi Graduate Education, No. JGY2023068; Guangxi Higher Education Undergraduate Teaching Reform Project, No. 2022JGA146; Guangxi Educational Science Planning Key Project, No. 2022ZJY2791; Guangxi Medical University Undergraduate Education and Teaching Reform Project, No. 2023Z10; China Undergraduate Innovation and Entrepreneurship Training Program (X202410598360); Future Academic Star of Guangxi Medical University (WLXSZX24073).
Conflict of Interest
The authors declare that they have no conflict of interest.
Informed Consent
This study was not involved in human samples, so there is no need to obtain informed consent.
Author Contributions
Co-first authors: Jie Luo and Kai Qin; co-corresponding authors: Jian Jun Li and Yu Bin Huang; Jie Luo, Kai Qin, Jian Jun Li and Yu Bin Huang conceived and designed the study; Rong Quan He, Jian Di Li, Zhi Guang Huang and Bin Tong Yin analyzed the data and performed all the graphs; Tong Wu, Yu Zhen Chen, Di Yuan Qin, Jia Yuan Luo, Mei Wu, Bang Teng Chi and Gang Chen provided technical support and experimental materials; Jie Luo and Kai Qin drafted the manuscript; Jian Jun Li and Yu Bin Huang revised the manuscript. The decision for co-first authorship is based on the substantial and equal contributions of Jie Luo and Kai Qin to the conception, design, execution, and interpretation of the research presented in this manuscript. Both authors have played a crucial role in drafting and revising the manuscript and have approved the final version. The designation of co-corresponding authors, Jian Jun Li and Yu Bin Huang, is attributed to their shared responsibility in overseeing the submission, revision, and communication aspects of this work with the journal. Both authors actively participated in the development of the manuscript and are equally accountable for its content.
Data Availability
The datasets analyzed during our study were available in public open access databases. The list of open access databases is as follows. Gene expression data were obtained from multiple databases, including The Cancer Genome Atlas (TCGA; https://www.cancer.gov/tcga), the Gene Expression Omnibus (GEO; https://www.ncbi.nlm.nih.gov/geo/), ArrayExpress (https://www.ebi.ac.uk/arrayexpress/), the International Cancer Genome Consortium (ICGC; https://icgc.org/), the Genotype-Tissue Expression project (GTEx; https://gtexportal.org/), and the Sequence Read Archive (SRA; https://www.ncbi.nlm.nih.gov/sra). All data are already released and could be obtained using above web links.
| References | ▴Top |
- Wen KW, Kakar S. Hepatic precancerous lesions and early hepatocellular carcinoma. Gastroenterol Clin North Am. 2024;53(1):109-132.
doi pubmed - Zhang Z, Jiao T, Li J, Hu B, Zhang W, Wang Z, Wan T, et al. Efficacy of treatment based on TKIs in combination with PD-1 inhibitors for unresectable recurrent hepatocellular carcinoma. World J Surg Oncol. 2023;21(1):53.
doi pubmed pmc - Tabrizian P, Abdelrahim M, Schwartz M. Immunotherapy and transplantation for hepatocellular carcinoma. J Hepatol. 2024;80(5):822-825.
doi pubmed - Peng C, Ye Z, Ju Y, Huang X, Zhan C, Wei K, Zhang Z. Mechanism of action and treatment of type I interferon in hepatocellular carcinoma. Clin Transl Oncol. 2024;26(2):326-337.
doi pubmed - Leowattana W, Leowattana T, Leowattana P. Systemic treatment for unresectable hepatocellular carcinoma. World J Gastroenterol. 2023;29(10):1551-1568.
doi pubmed pmc - Zhang SL, Yi XF, Huang LT, Sun L, Ma JT, Han CB. Rational application of EGFR-TKI adjuvant therapy in patients with completely resected stage IB-IIIA EGFR-mutant NSCLC: a systematic review and meta-analysis of 11 randomized controlled trials. BMC Cancer. 2023;23(1):719.
doi pubmed pmc - Liao D, Zhang J, Yan T, Chen S, Li W, Shangguan D, She Z. Recent advances in the management of adverse events associated with lorlatinib. Onco Targets Ther. 2023;16:731-738.
doi pubmed pmc - Wang Z, Zhou F, Xu S, Wang K, Ding H. The efficacy and safety of immune checkpoint inhibitors for patients with EGFR-mutated non-small cell lung cancer who progressed on EGFR tyrosine-kinase inhibitor therapy: a systematic review and network meta-analysis. Cancer Med. 2023;12(18):18516-18530.
doi pubmed pmc - Yang C, Jin X, Liu X, Wu G, Yang W, Pang B, Jiang J, et al. TRIM15 forms a regulatory loop with the AKT/FOXO1 axis and LASP1 to modulate the sensitivity of HCC cells to TKIs. Cell Death Dis. 2023;14(1):47.
doi pubmed pmc - Zhang Z, Wu H, Zhang Y, Shen C, Zhou F. Dietary antioxidant quercetin overcomes the acquired resistance of sorafenib in sorafenib-resistant hepatocellular carcinoma cells through epidermal growth factor receptor signaling inactivation. Naunyn Schmiedebergs Arch Pharmacol. 2024;397(1):559-574.
doi pubmed - Huang C, Zhu XD, Shen YH, Xu B, Wu D, Ji Y, Chen LL, et al. Radiographic and alpha-fetoprotein response predict pathologic complete response to immunotherapy plus a TKI in hepatocellular carcinoma: a multicenter study. BMC Cancer. 2023;23(1):416.
doi pubmed pmc - Zhu J, Fang P, Wang C, Gu M, Pan B, Guo W, Yang X, et al. The immunomodulatory activity of lenvatinib prompts the survival of patients with advanced hepatocellular carcinoma. Cancer Med. 2021;10(22):7977-7987.
doi pubmed pmc - Lu H, Liang B, Xia X, Zheng C. Efficacy and safety analysis of TACE + donafenib + toripalimab versus TACE + sorafenib in the treatment of unresectable hepatocellular carcinoma: a retrospective study. BMC Cancer. 2023;23(1):1033.
doi pubmed pmc - Rallis KS, Makrakis D, Ziogas IA, Tsoulfas G. Immunotherapy for advanced hepatocellular carcinoma: from clinical trials to real-world data and future advances. World J Clin Oncol. 2022;13(6):448-472.
doi pubmed pmc - Wang H, Chu F, Zhang XF, Zhang P, Li LX, Zhuang YL, Niu XF, et al. TPX2 enhances the transcription factor activation of PXR and enhances the resistance of hepatocellular carcinoma cells to antitumor drugs. Cell Death Dis. 2023;14(1):64.
doi pubmed pmc - Yi K, Kong H, Zheng C, Zhuo C, Jin Y, Zhong Q, Mintz RL, et al. A LIGHTFUL nanomedicine overcomes EGFR-mediated drug resistance for enhanced tyrosine-kinase-inhibitor-based hepatocellular carcinoma therapy. Biomaterials. 2023;302:122349.
doi pubmed - Zhang S, Yuan L, Danilova L, Mo G, Zhu Q, Deshpande A, Bell ATF, et al. Spatial transcriptomics analysis of neoadjuvant cabozantinib and nivolumab in advanced hepatocellular carcinoma identifies independent mechanisms of resistance and recurrence. Genome Med. 2023;15(1):72.
doi pubmed pmc - Qin A, Qin Y, Lee J, Musket A, Ying M, Krenciute G, Marincola FM, et al. Tyrosine kinase signaling-independent MET-targeting with CAR-T cells. J Transl Med. 2023;21(1):682.
doi pubmed pmc - Stefanini B, Ielasi L, Chen R, Abbati C, Tonnini M, Tovoli F, Granito A. TKIs in combination with immunotherapy for hepatocellular carcinoma. Expert Rev Anticancer Ther. 2023;23(3):279-291.
doi pubmed - Drerup CM, Herbert AL, Monk KR, Nechiporuk AV. Regulation of mitochondria-dynactin interaction and mitochondrial retrograde transport in axons. Elife. 2017;6:e22234.
doi pubmed pmc - Takashima Y, Kawaguchi A, Fukai J, Iwadate Y, Kajiwara K, Hondoh H, Yamanaka R. Survival prediction based on the gene expression associated with cancer morphology and microenvironment in primary central nervous system lymphoma. PLoS One. 2021;16(6):e0251272.
doi pubmed pmc - Ghandi M, Huang FW, Jane-Valbuena J, Kryukov GV, Lo CC, McDonald ER, 3rd, Barretina J, et al. Next-generation characterization of the Cancer Cell Line Encyclopedia. Nature. 2019;569(7757):503-508.
doi pubmed pmc - Ho KH, Huang TW, Liu AJ, Shih CM, Chen KC. Cancer essential genes stratified lung adenocarcinoma patients with distinct survival outcomes and identified a subgroup from the terminal respiratory unit type with different proliferative signatures in multiple cohorts. Cancers (Basel). 2021;13(9):2128.
doi pubmed pmc - Nishiguchi H, Omura T, Sato A, Kitahiro Y, Yamamoto K, Kunimasa J, Yano I. Luteolin protects against 6-hydoroxydopamine-induced cell death via an upregulation of HRD1 and SEL1L. Neurochem Res. 2024;49(1):117-128.
doi pubmed pmc - Wang Z, He E, Sani K, Jagodnik KM, Silverstein MC, Ma'ayan A. Drug Gene Budger (DGB): an application for ranking drugs to modulate a specific gene based on transcriptomic signatures. Bioinformatics. 2019;35(7):1247-1248.
doi pubmed pmc - Xu H, Jia J. Immune-related hub genes and the competitive endogenous RNA network in Alzheimer’s disease. J Alzheimers Dis. 2020;77(3):1255-1265.
doi pubmed - Matera AG, Wang Z. A day in the life of the spliceosome. Nat Rev Mol Cell Biol. 2014;15(2):108-121.
doi pubmed pmc - Lopez-Canovas JL, Herman-Sanchez N, Del Rio-Moreno M, Fuentes-Fayos AC, Lara-Lopez A, Sanchez-Frias ME, Amado V, et al. PRPF8 increases the aggressiveness of hepatocellular carcinoma by regulating FAK/AKT pathway via fibronectin 1 splicing. Exp Mol Med. 2023;55(1):132-142.
doi pubmed pmc - Lee SE, Alcedo KP, Kim HJ, Snider NT. Alternative splicing in hepatocellular carcinoma. Cell Mol Gastroenterol Hepatol. 2020;10(4):699-712.
doi pubmed pmc - Lopez-Canovas JL, Del Rio-Moreno M, Garcia-Fernandez H, Jimenez-Vacas JM, Moreno-Montilla MT, Sanchez-Frias ME, Amado V, et al. Splicing factor SF3B1 is overexpressed and implicated in the aggressiveness and survival of hepatocellular carcinoma. Cancer Lett. 2021;496:72-83.
doi pubmed - Beck M, Schirmacher P, Singer S. Alterations of the nuclear transport system in hepatocellular carcinoma - new basis for therapeutic strategies. J Hepatol. 2017;67(5):1051-1061.
doi pubmed - Marinelli S, Granito A, Piscaglia F, Renzulli M, Stagni A, Bolondi L. Metronomic capecitabine in patients with hepatocellular carcinoma unresponsive to or ineligible for sorafenib treatment: report of two cases. Hepat Mon. 2013;13(9):e11721.
doi pubmed pmc - Granito A, Marinelli S, Terzi E, Piscaglia F, Renzulli M, Venerandi L, Benevento F, et al. Metronomic capecitabine as second-line treatment in hepatocellular carcinoma after sorafenib failure. Dig Liver Dis. 2015;47(6):518-522.
doi pubmed - Trevisani F, Brandi G, Garuti F, Barbera MA, Tortora R, Casadei Gardini A, Granito A, et al. Metronomic capecitabine as second-line treatment for hepatocellular carcinoma after sorafenib discontinuation. J Cancer Res Clin Oncol. 2018;144(2):403-414.
doi pubmed - Hu B, Zou T, Qin W, Shen X, Su Y, Li J, Chen Y, et al. Inhibition of EGFR overcomes acquired lenvatinib resistance driven by STAT3-ABCB1 signaling in hepatocellular carcinoma. Cancer Res. 2022;82(20):3845-3857.
doi pubmed pmc - Kim MS, Yang SH, Kim MS. Role of ABCA2 and its single nucleotide polymorphisms (4873T>A and 4879G>C) in the regulation of multi-drug resistance in oral squamous carcinoma cells. Biochem Biophys Res Commun. 2023;666:1-9.
doi pubmed - Jovic M, Sharma M, Rahajeng J, Caplan S. The early endosome: a busy sorting station for proteins at the crossroads. Histol Histopathol. 2010;25(1):99-112.
doi pubmed pmc - Bennett MK. SNAREs and the specificity of transport vesicle targeting. Curr Opin Cell Biol. 1995;7(4):581-586.
doi pubmed - Fan T, Zhang C, Zong M, Zhao Q, Yang X, Hao C, Zhang H, et al. Peptidylarginine deiminase IV promotes the development of chemoresistance through inducing autophagy in hepatocellular carcinoma. Cell Biosci. 2014;4:49.
doi pubmed pmc - Ahn JH, Lee M. Suppression of autophagy sensitizes multidrug resistant cells towards Src tyrosine kinase specific inhibitor PP2. Cancer Lett. 2011;310(2):188-197.
doi pubmed - Wang F, Ye X, Zhai D, Dai W, Wu Y, Chen J, Chen W. Curcumin-loaded nanostructured lipid carrier induced apoptosis in human HepG2 cells through activation of the DR5/caspase-mediated extrinsic apoptosis pathway. Acta Pharm. 2020;70(2):227-237.
doi pubmed - Zhang J, Sun L, Cui J, Wang J, Liu X, Aung TN, Qu Z, et al. Yiqi Chutan Tang reduces gefitinib-induced drug resistance in non-small-cell lung cancer by targeting apoptosis and autophagy. Cytometry A. 2020;97(1):70-77.
doi pubmed pmc - Zhao M, Zhang Y, Li J, Li X, Cheng N, Wang Q, Cai W, et al. Histone deacetylation, as opposed to promoter methylation, results in epigenetic BIM silencing and resistance to EGFR TKI in NSCLC. Oncol Lett. 2018;15(1):1089-1096.
doi pubmed pmc - Dimopoulos P, Mulita A, Antzoulas A, Bodard S, Leivaditis V, Akrida I, Benetatos N, et al. The role of artificial intelligence and image processing in the diagnosis, treatment, and prognosis of liver cancer: a narrative-review. Gastroenterol Rev. 2024;19(3):221-230.
doi
This article is distributed under the terms of the Creative Commons Attribution Non-Commercial 4.0 International License, which permits unrestricted non-commercial use, distribution, and reproduction in any medium, provided the original work is properly cited.
World Journal of Oncology is published by Elmer Press Inc.