Figures
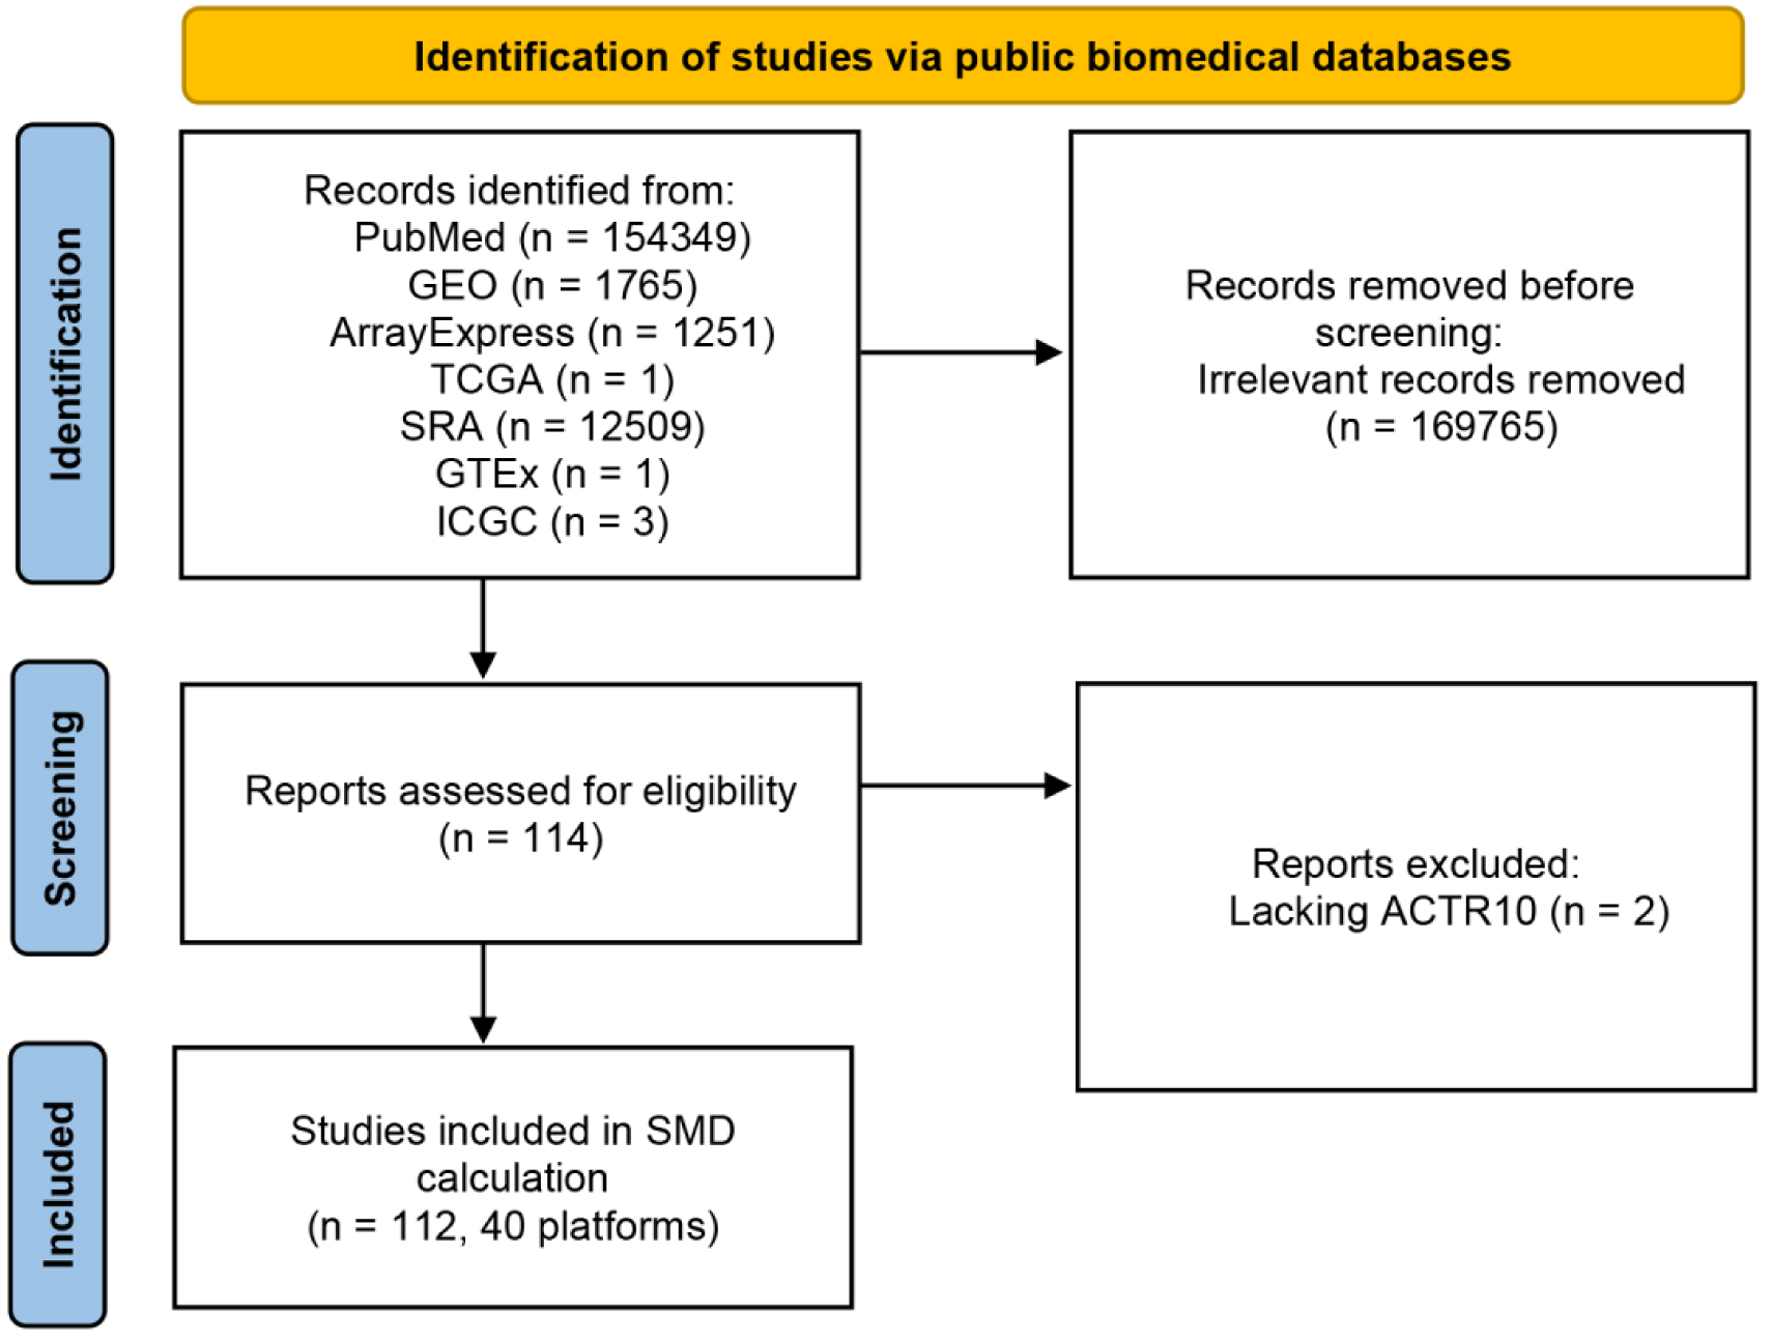
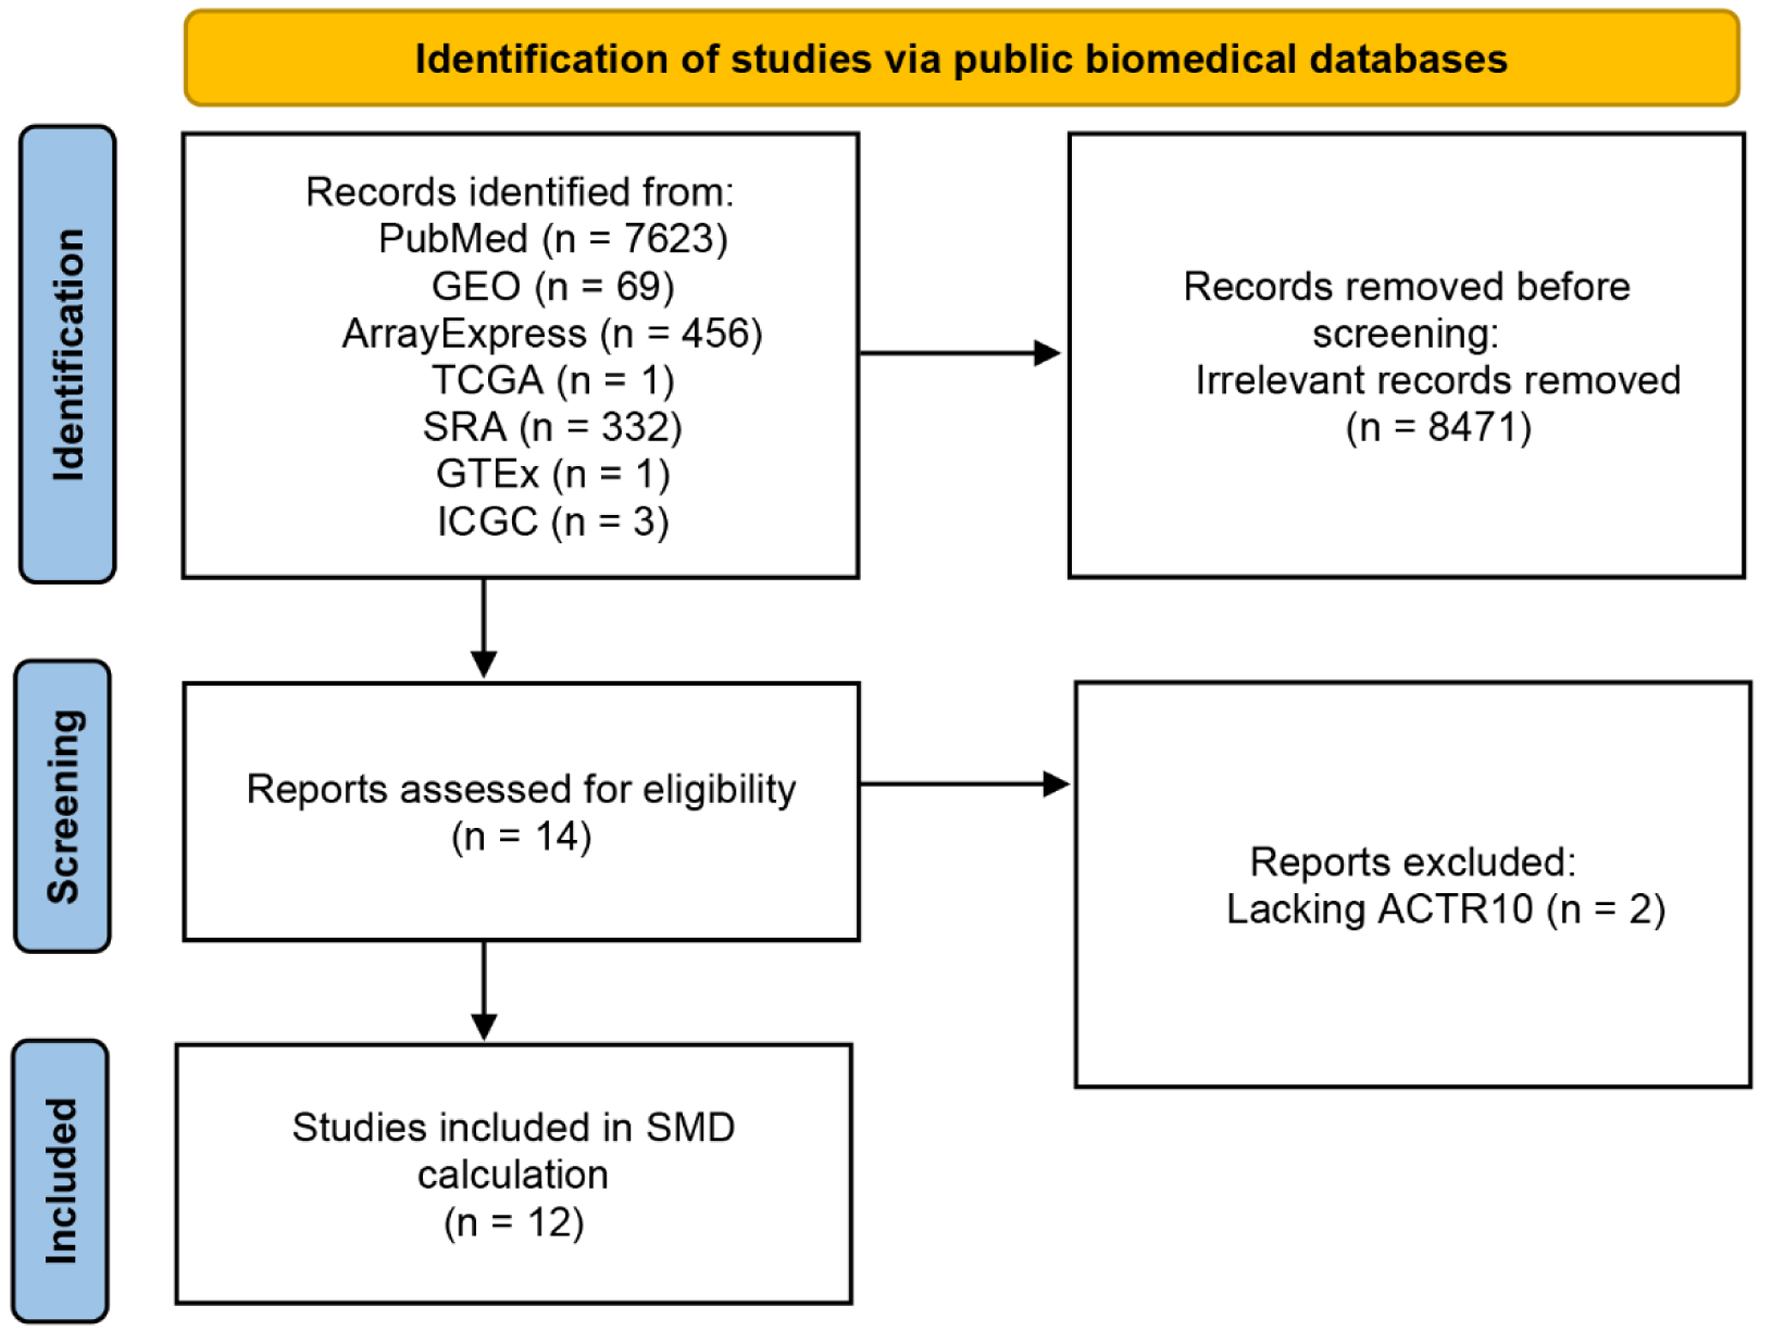
↓ Figure 1. Flow chart of ACTR10 mRNA
dataset screening. GEO: Gene Expression Omnibus; GTEx: Genotype-Tissue Expression; ICGC: International
Cancer Genome Consortium; SRA: Sequence Read Archive; TCGA: The Cancer Genome Atlas.
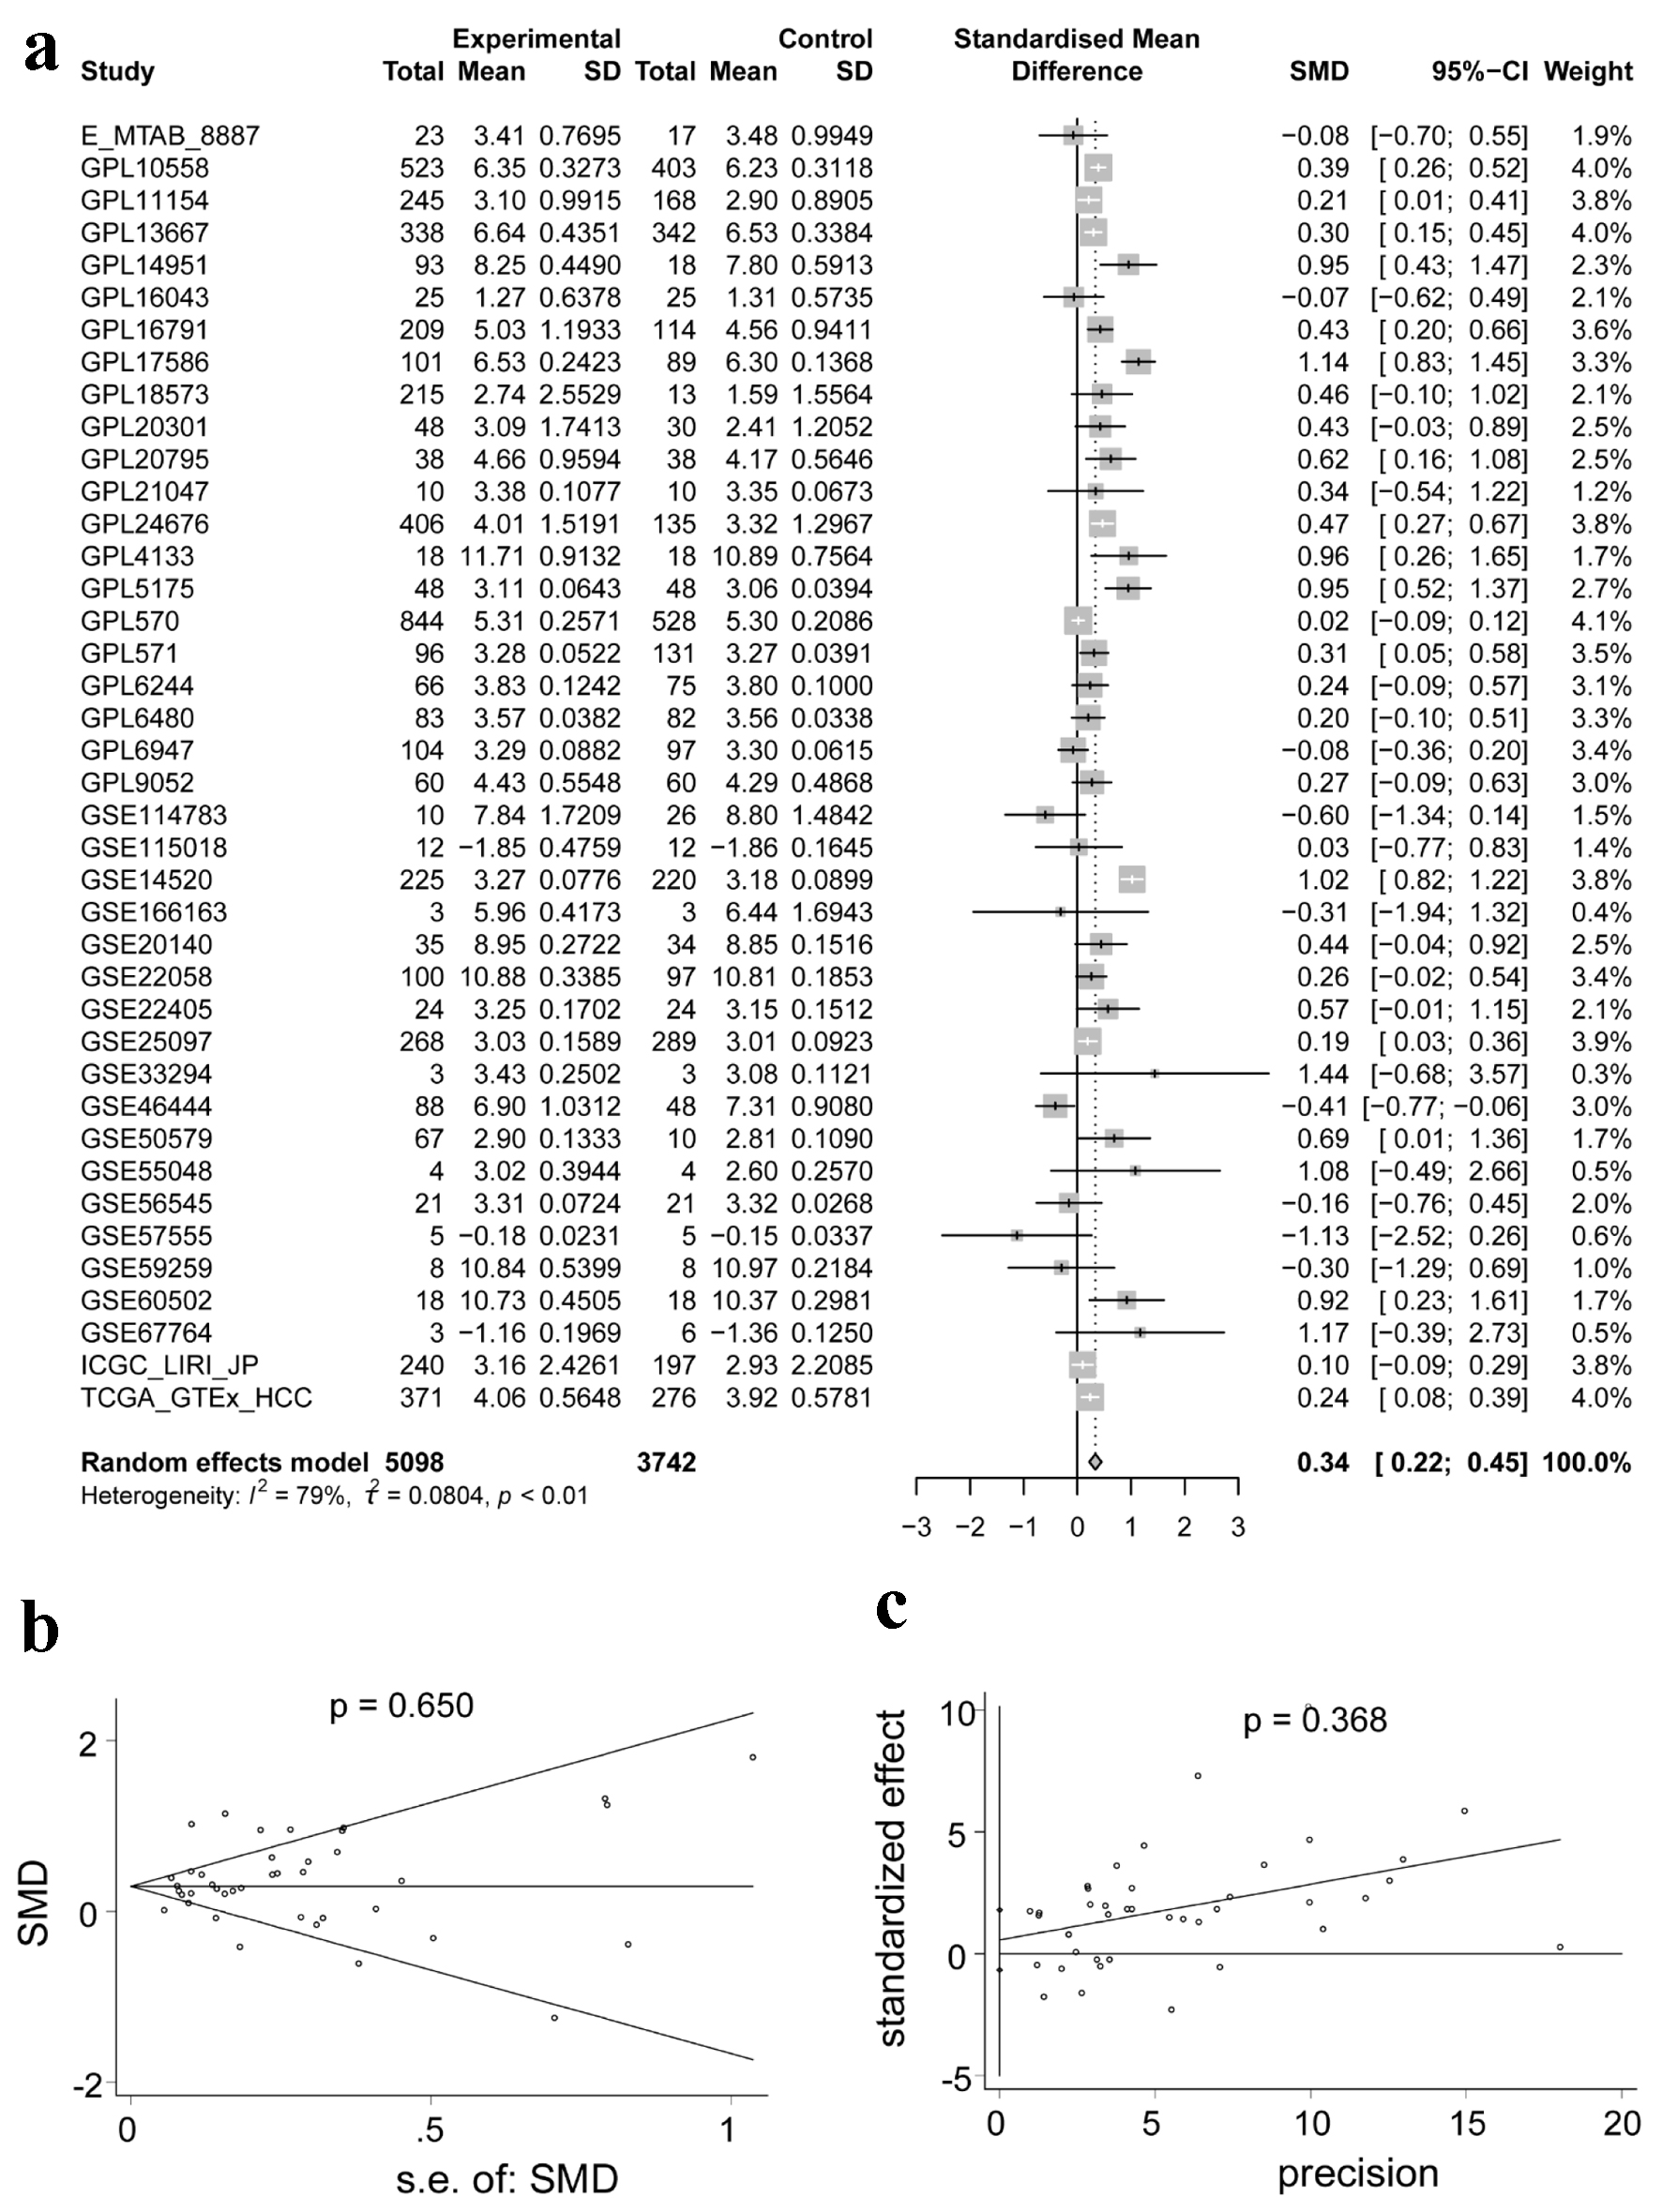
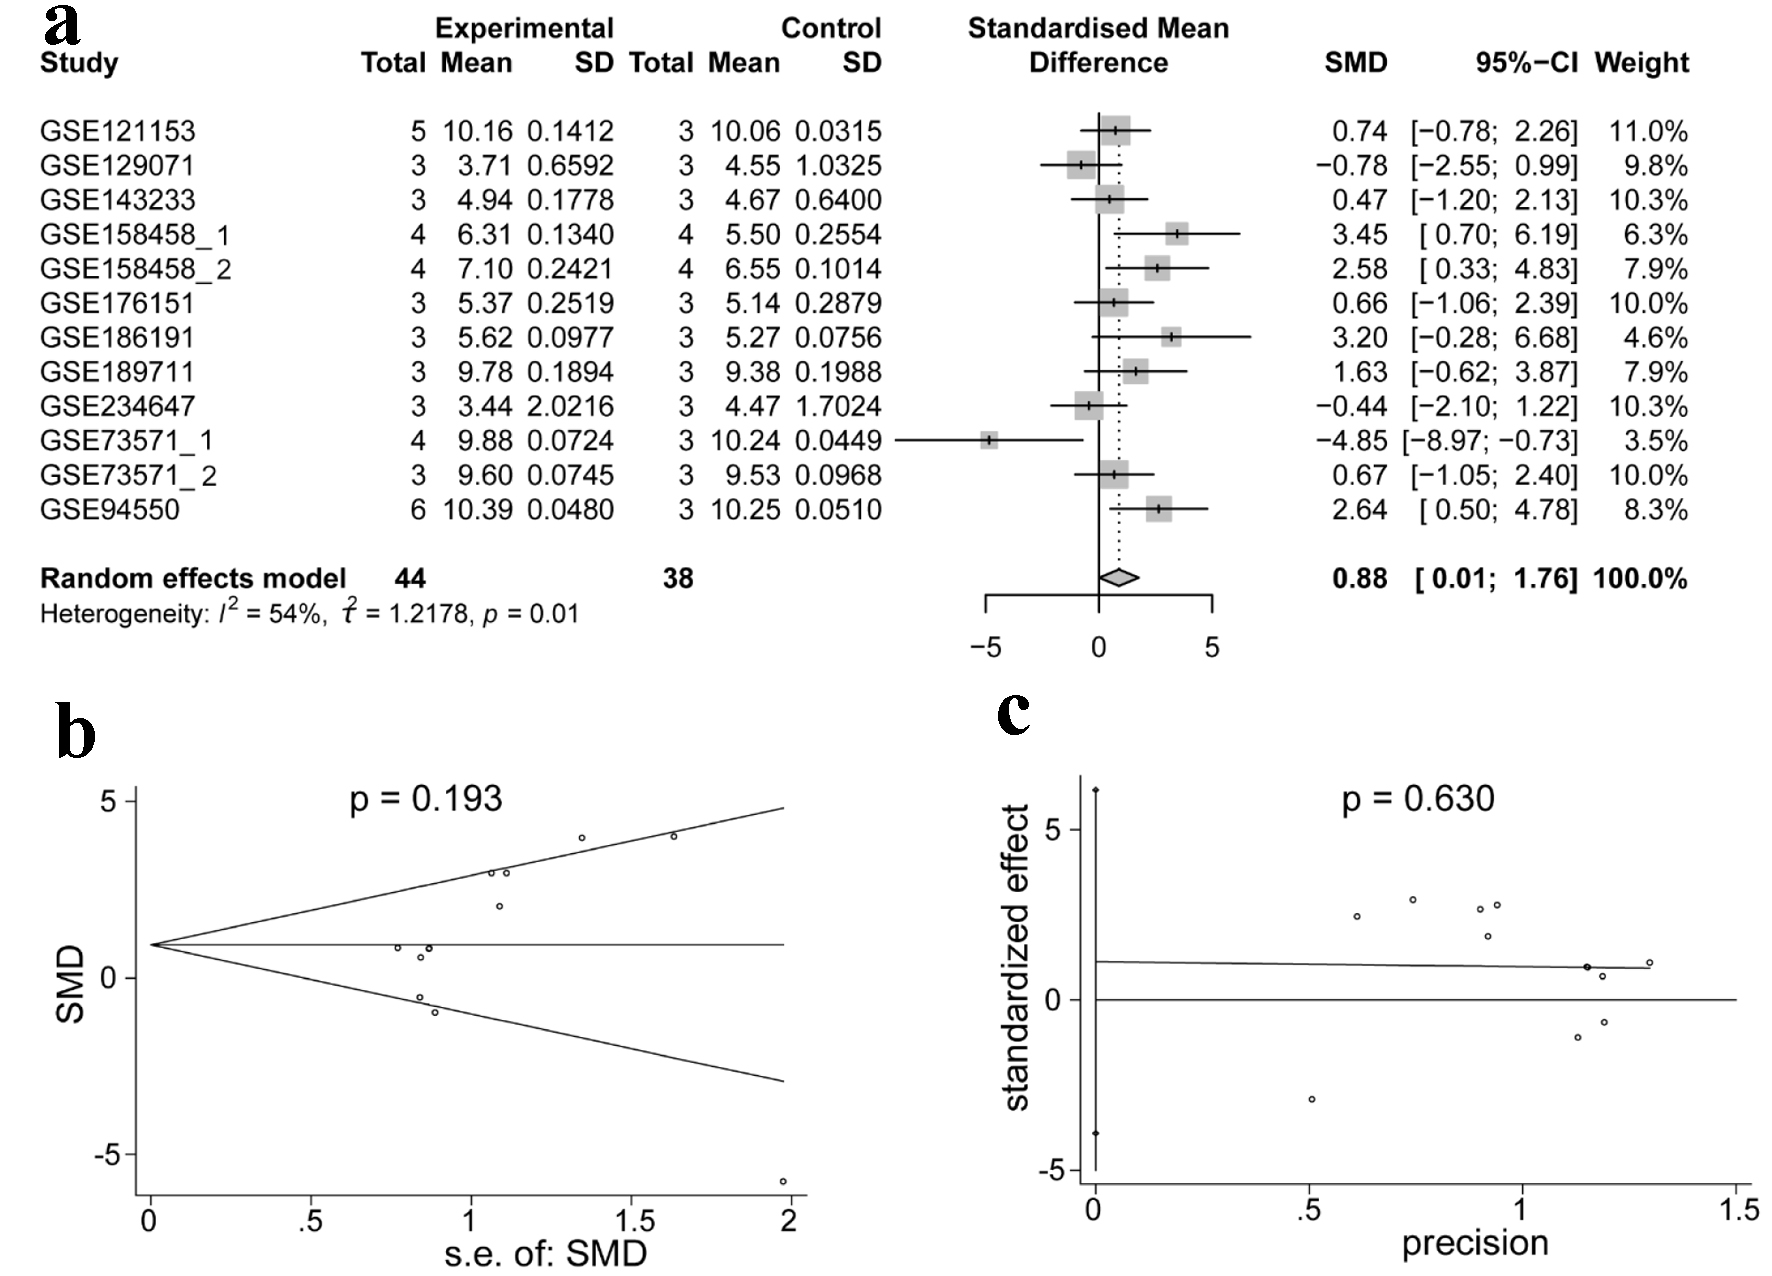
↓ Figure 2. Integrated analysis of the expression
of ACTR10 in HCC. (a) Forest plot showing the high expression of ACTR10 in HCC tissues
compared to non-HCC liver tissues. (b, c) Plots showing the results of Egger’s and Begg’s
tests, which showed that there was no publication bias. HCC: hepatocellular carcinoma; SMD: standardized
mean difference.
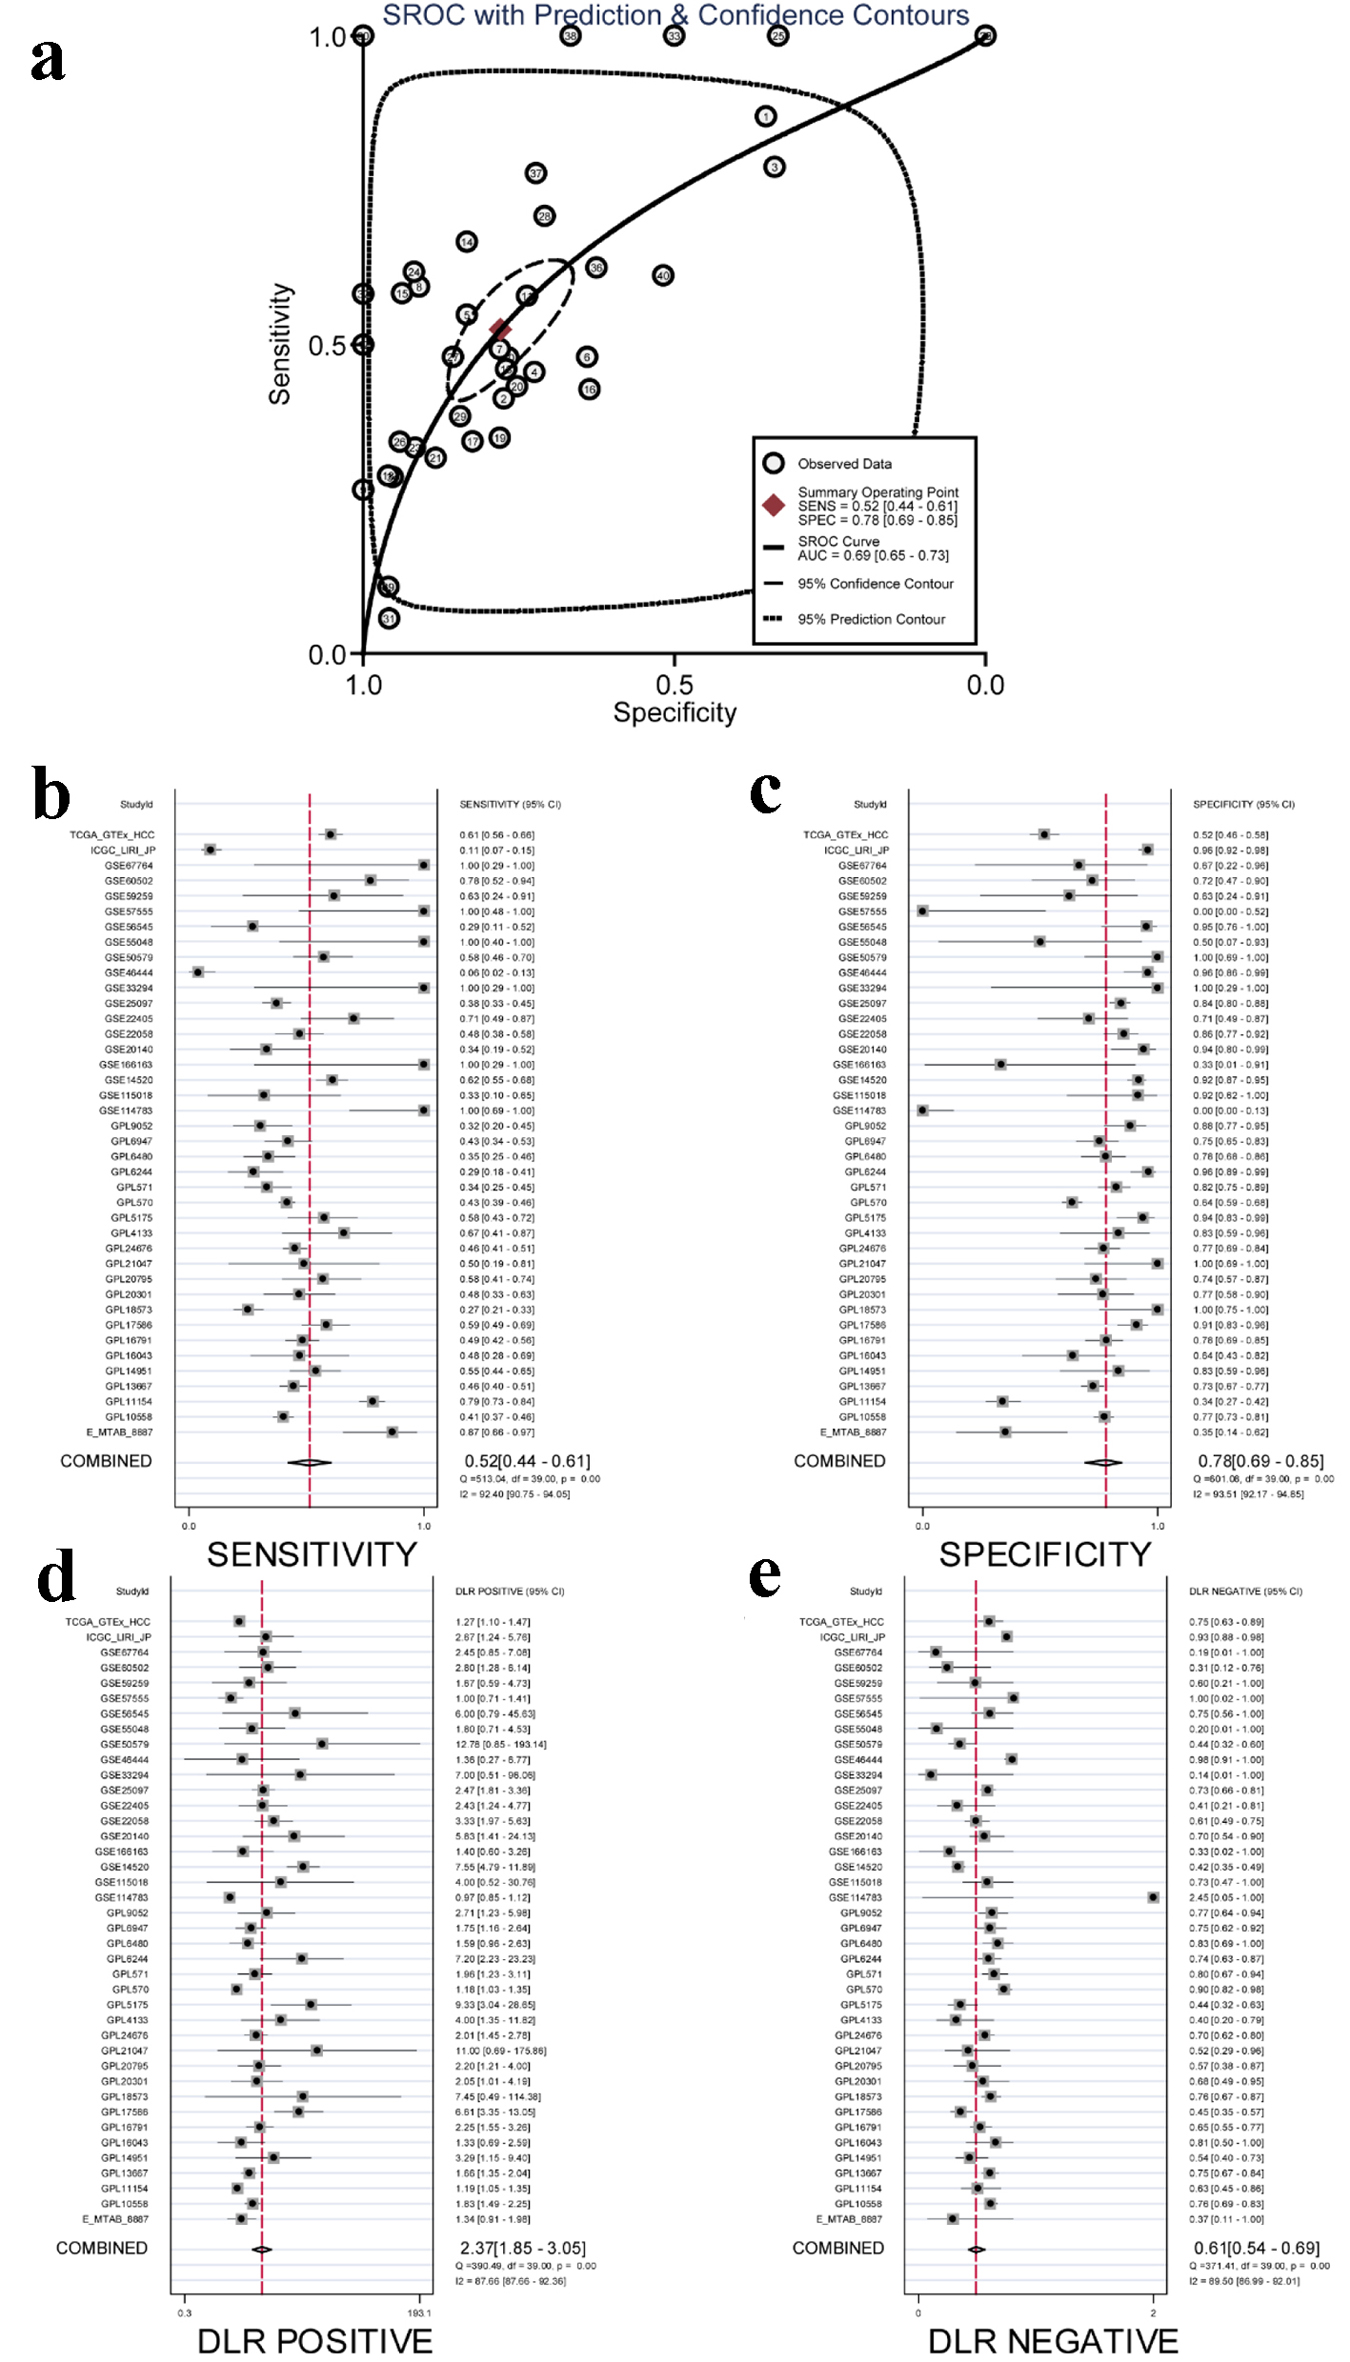
↓ Figure 3. Integrated analysis of the diagnostic
performance of ACTR10 in HCC. (a) The AUC of the sROC curve was 0.69 (95% CI: 0.65 - 0.73), with
a sensitivity of 0.52 (95% CI: 0.44 - 0.61) and a specificity of 0.78 (95% CI: 0.69 - 0.85). (b) The
combined sensitivity was 0.52 (95% CI: 0.44 - 0.61). (c) The combined specificity was 0.78 (95% CI: 0.69
- 0.85). (d) The combined positive DLR was 2.37 (95% CI: 1.85 - 3.05). (e) The combined negative DLR was
0.61 (95% CI: 0.54 - 0.69). AUC: area under the curve; CI: confidence interval; DLR: diagnostic
likelihood ratio; HCC: hepatocellular carcinoma; sROC: summary receiver operating characteristic.
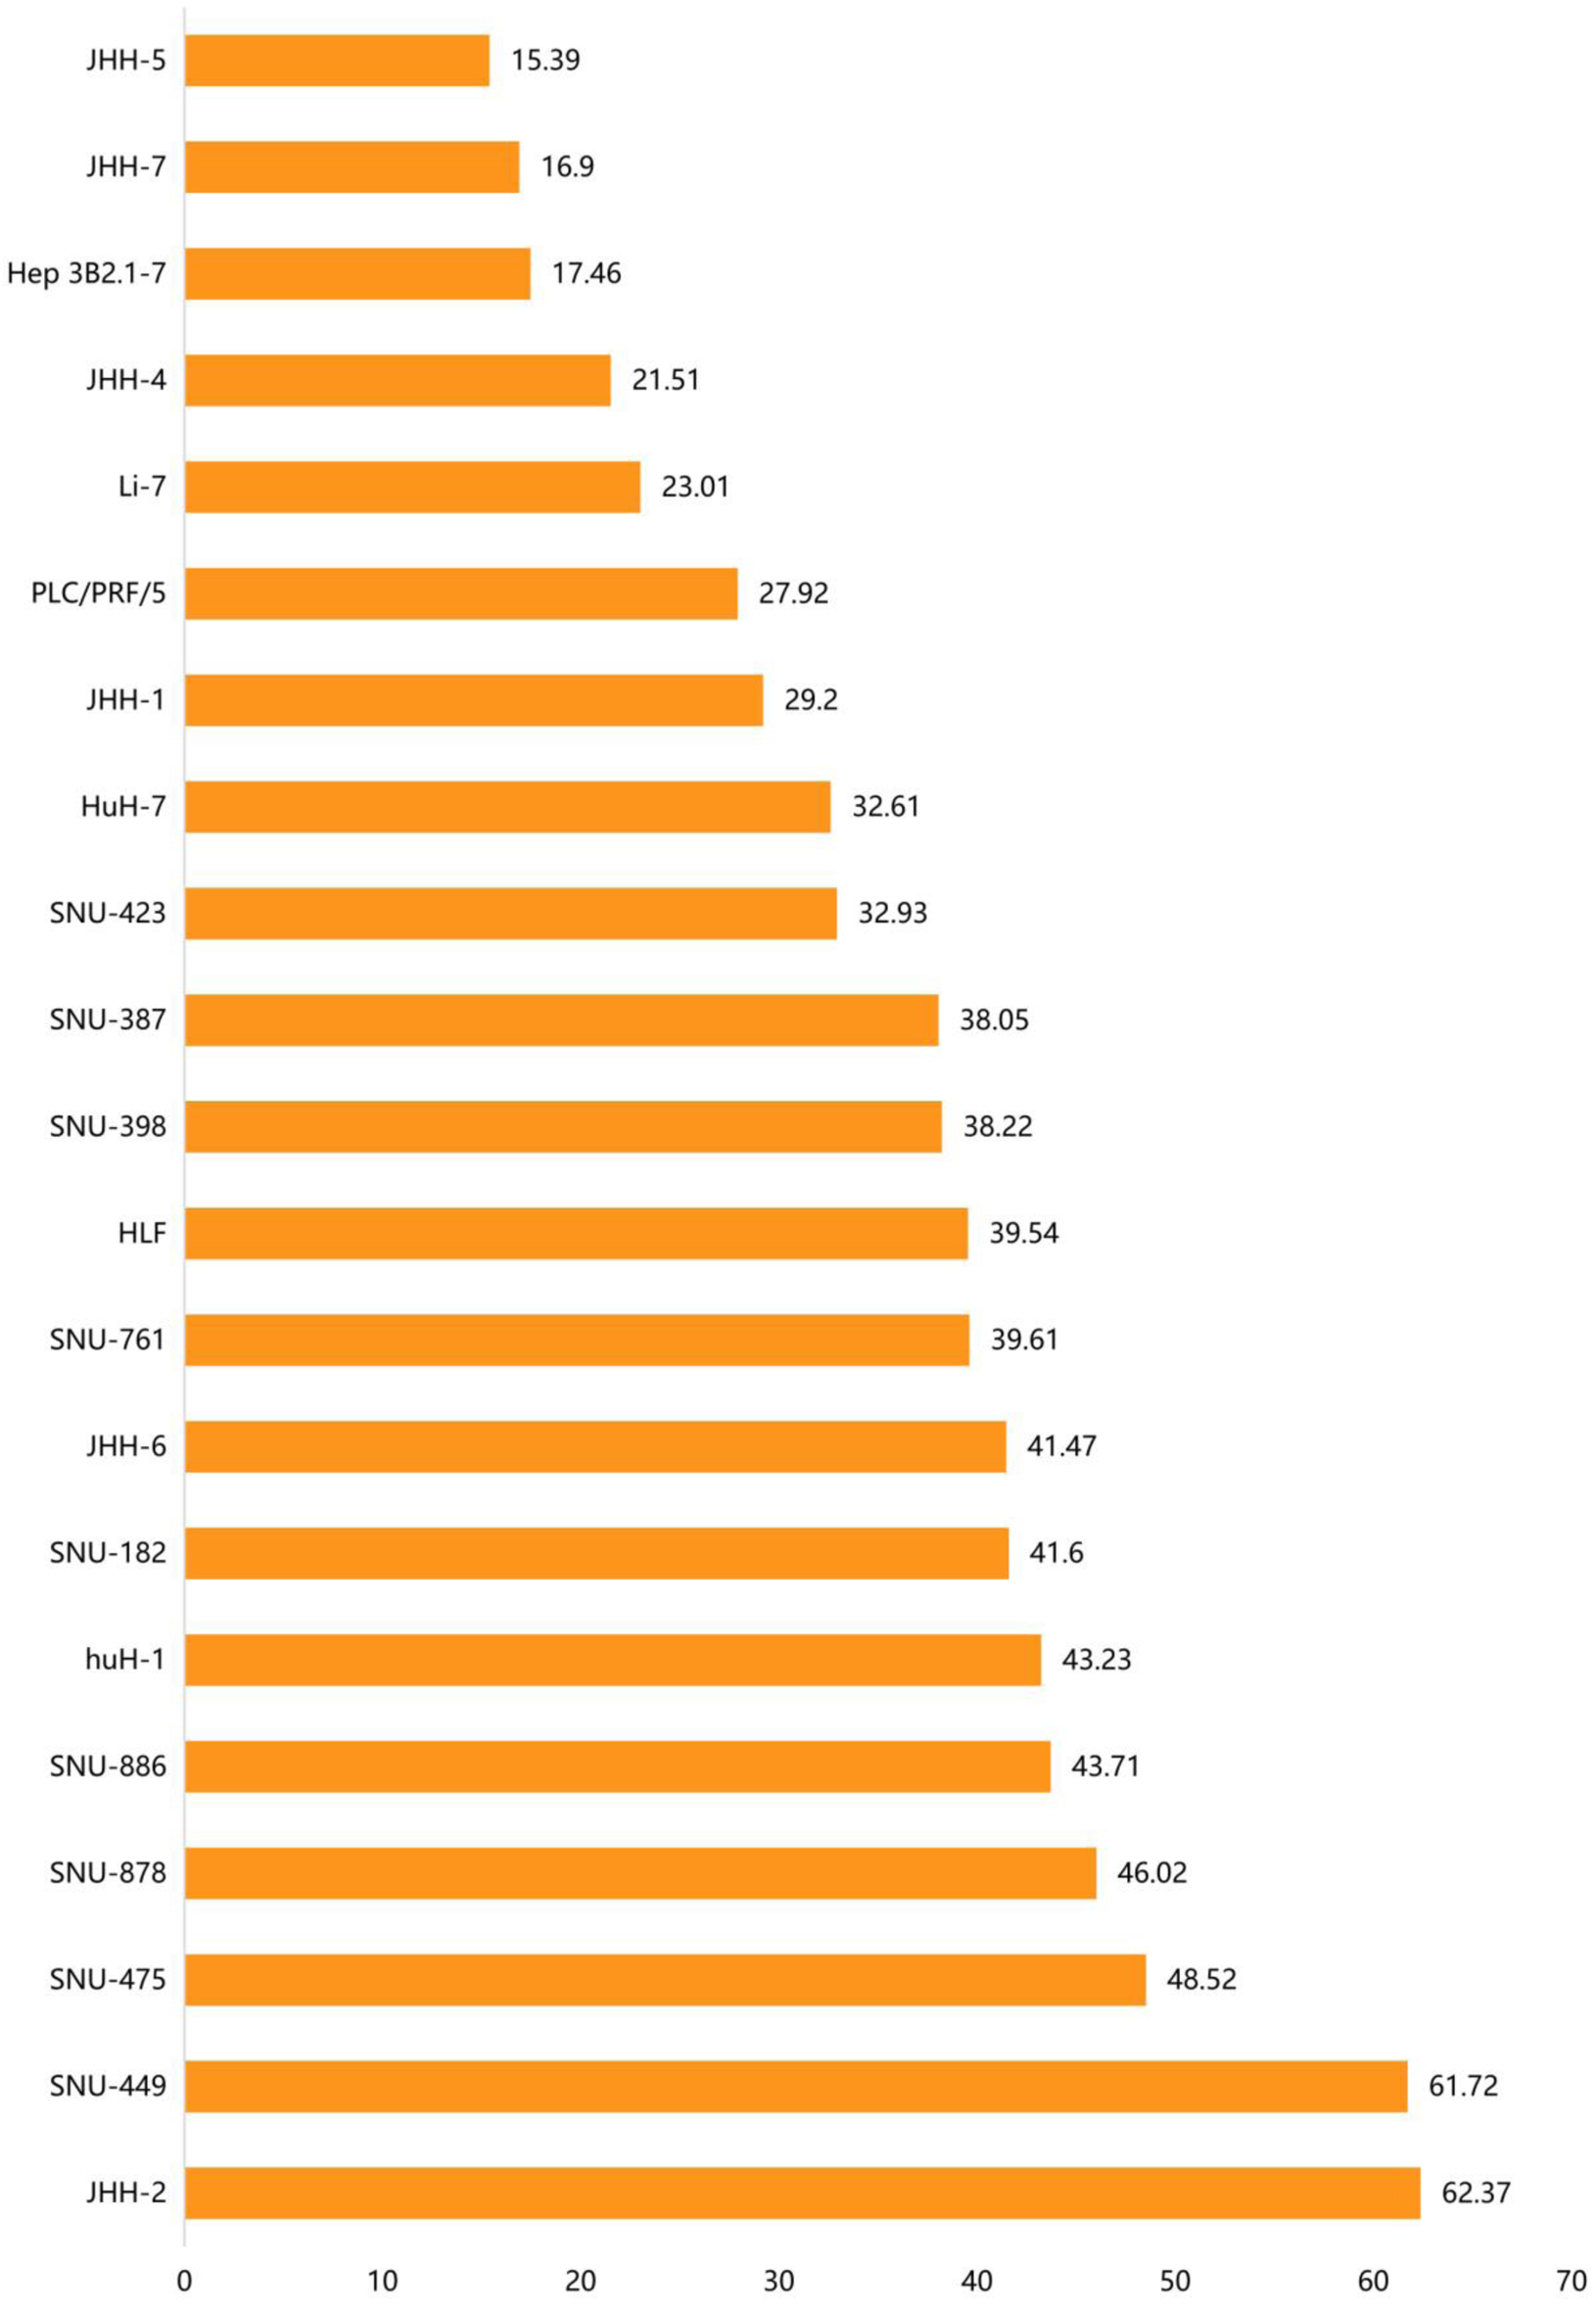
↓ Figure 4. The distribution of ACTR10
mRNA expression in different HCC cell lines. The abscissa represents the distribution of ACTR10
mRNA expression (TPM) and the ordinate represents the different HCC cell lines. HCC: hepatocellular
carcinoma.
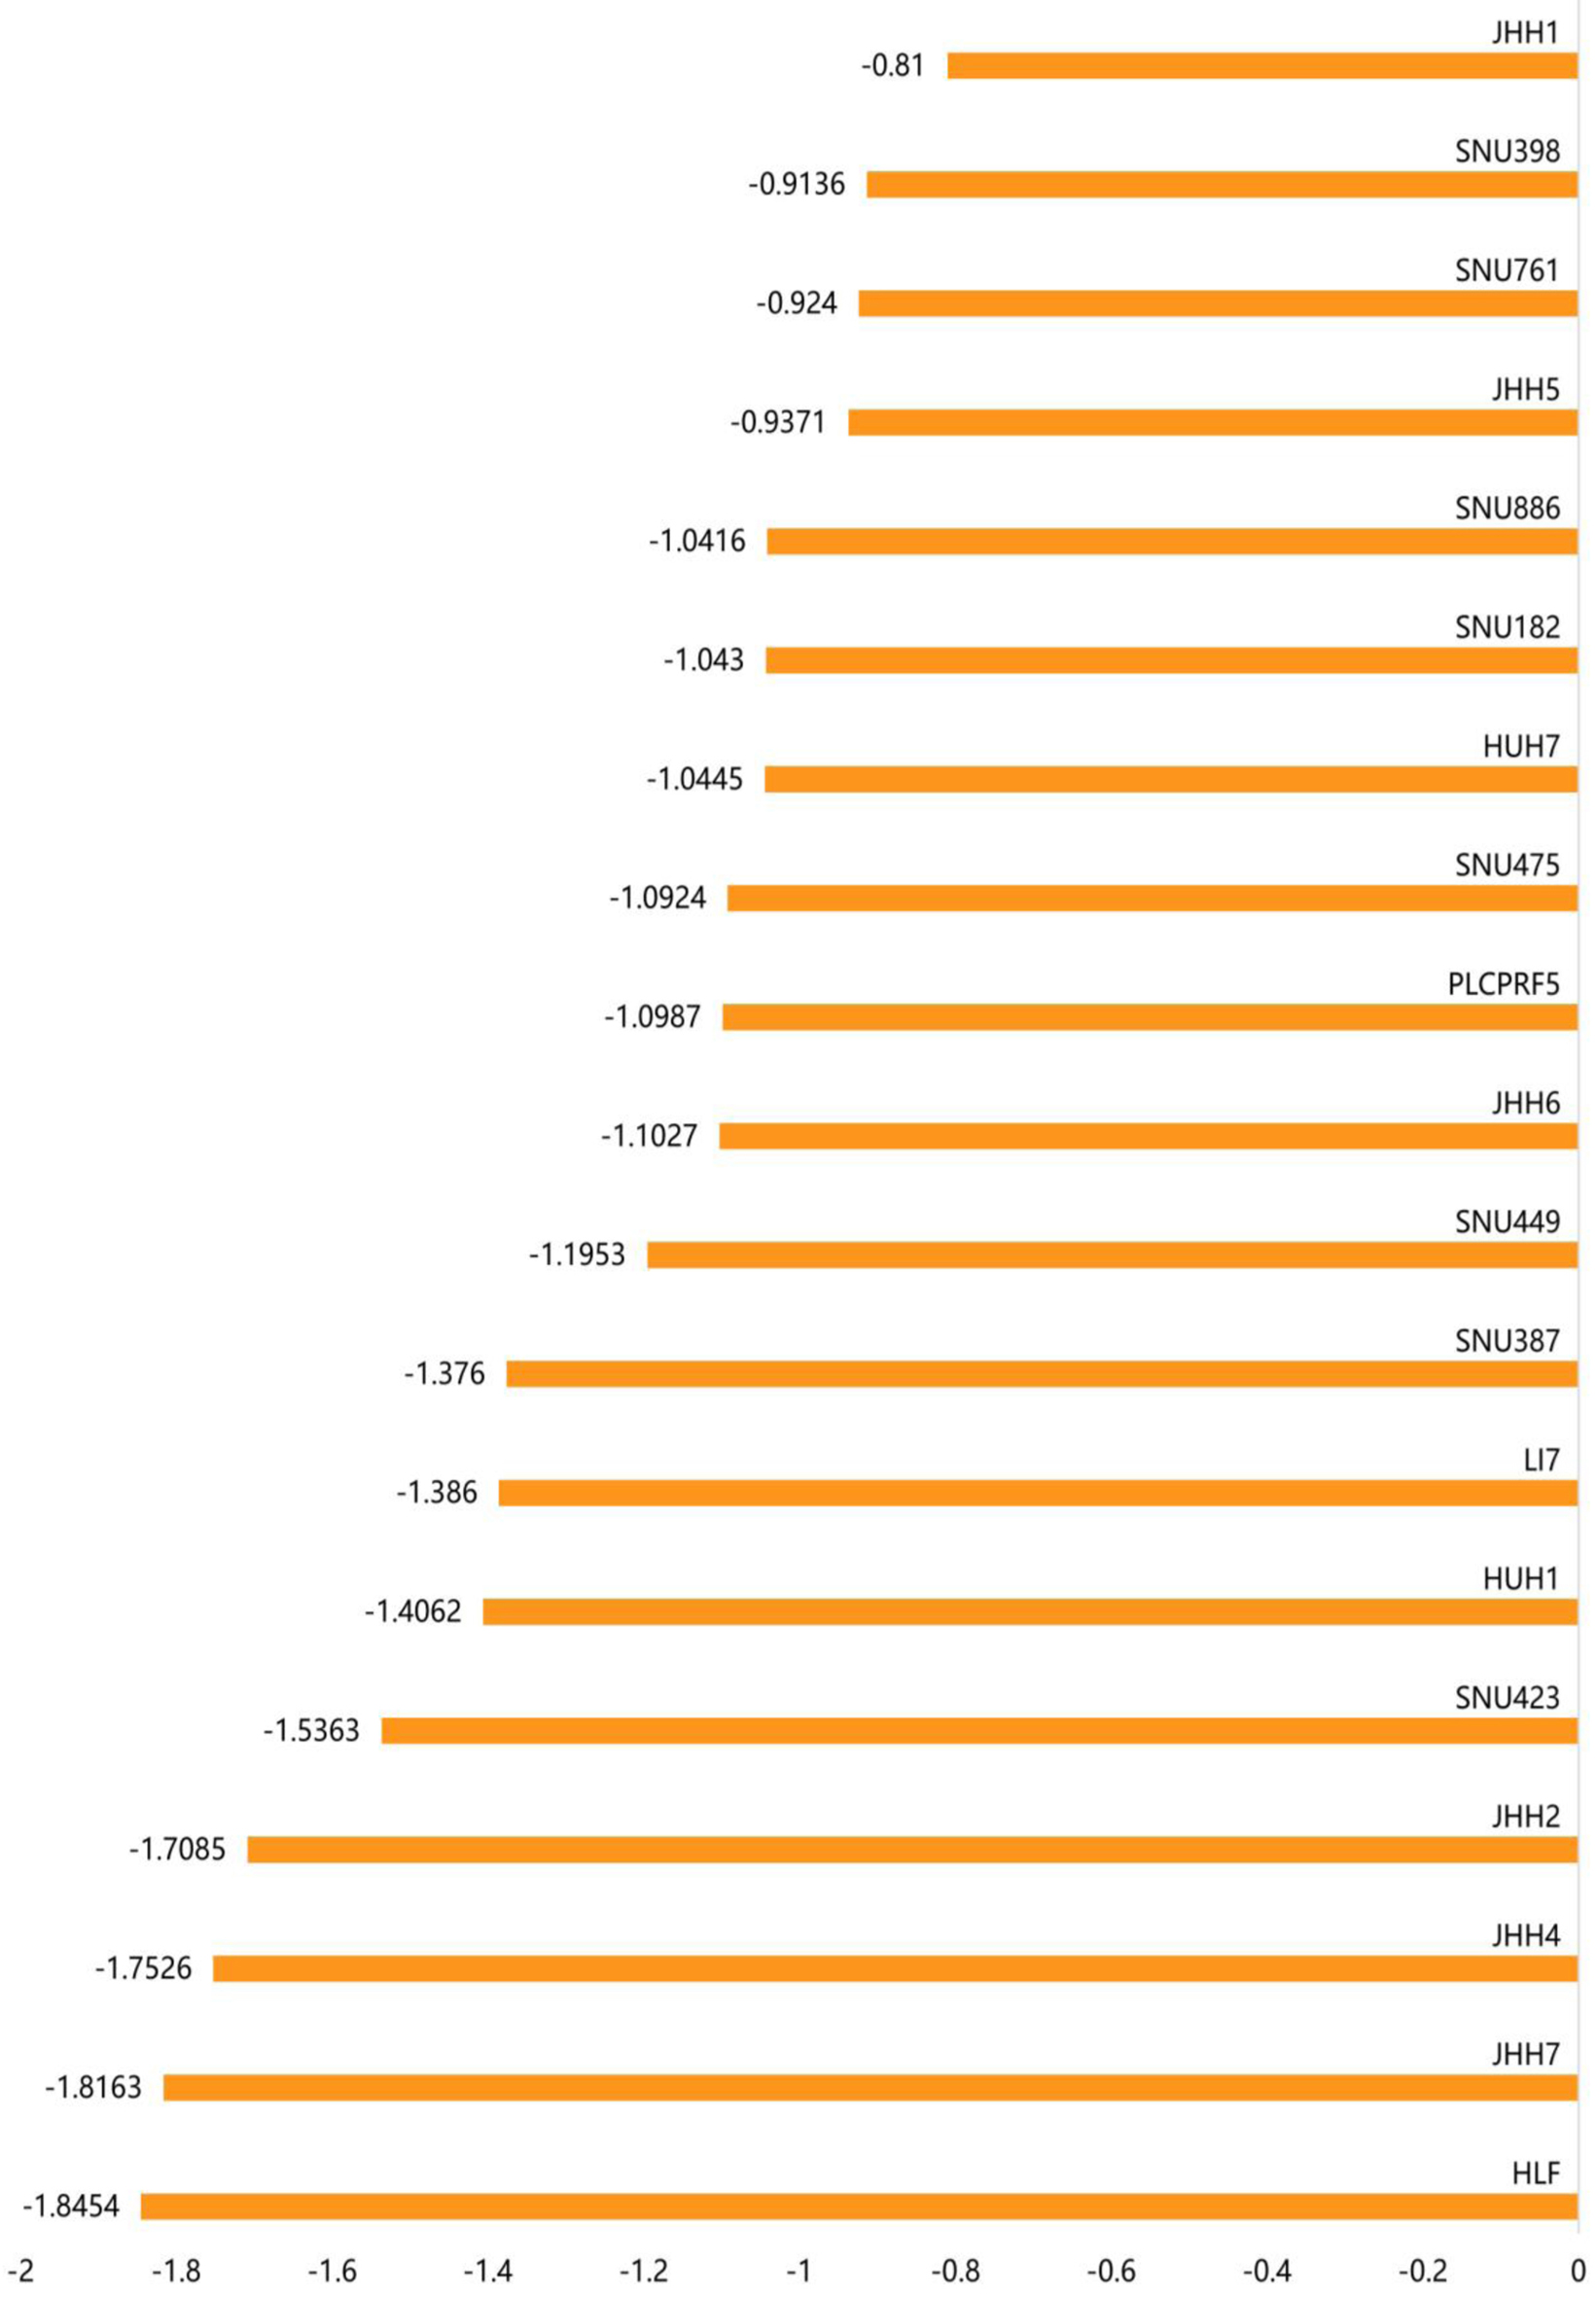
↓ Figure 5. The gene effect scores for the
ACTR10 gene in the 19 HCC cell lines. The abscissa represents the gene effect score of
ACTR10 in each HCC cell line and the ordinate represents the 19 HCC cell lines. HCC:
hepatocellular carcinoma.
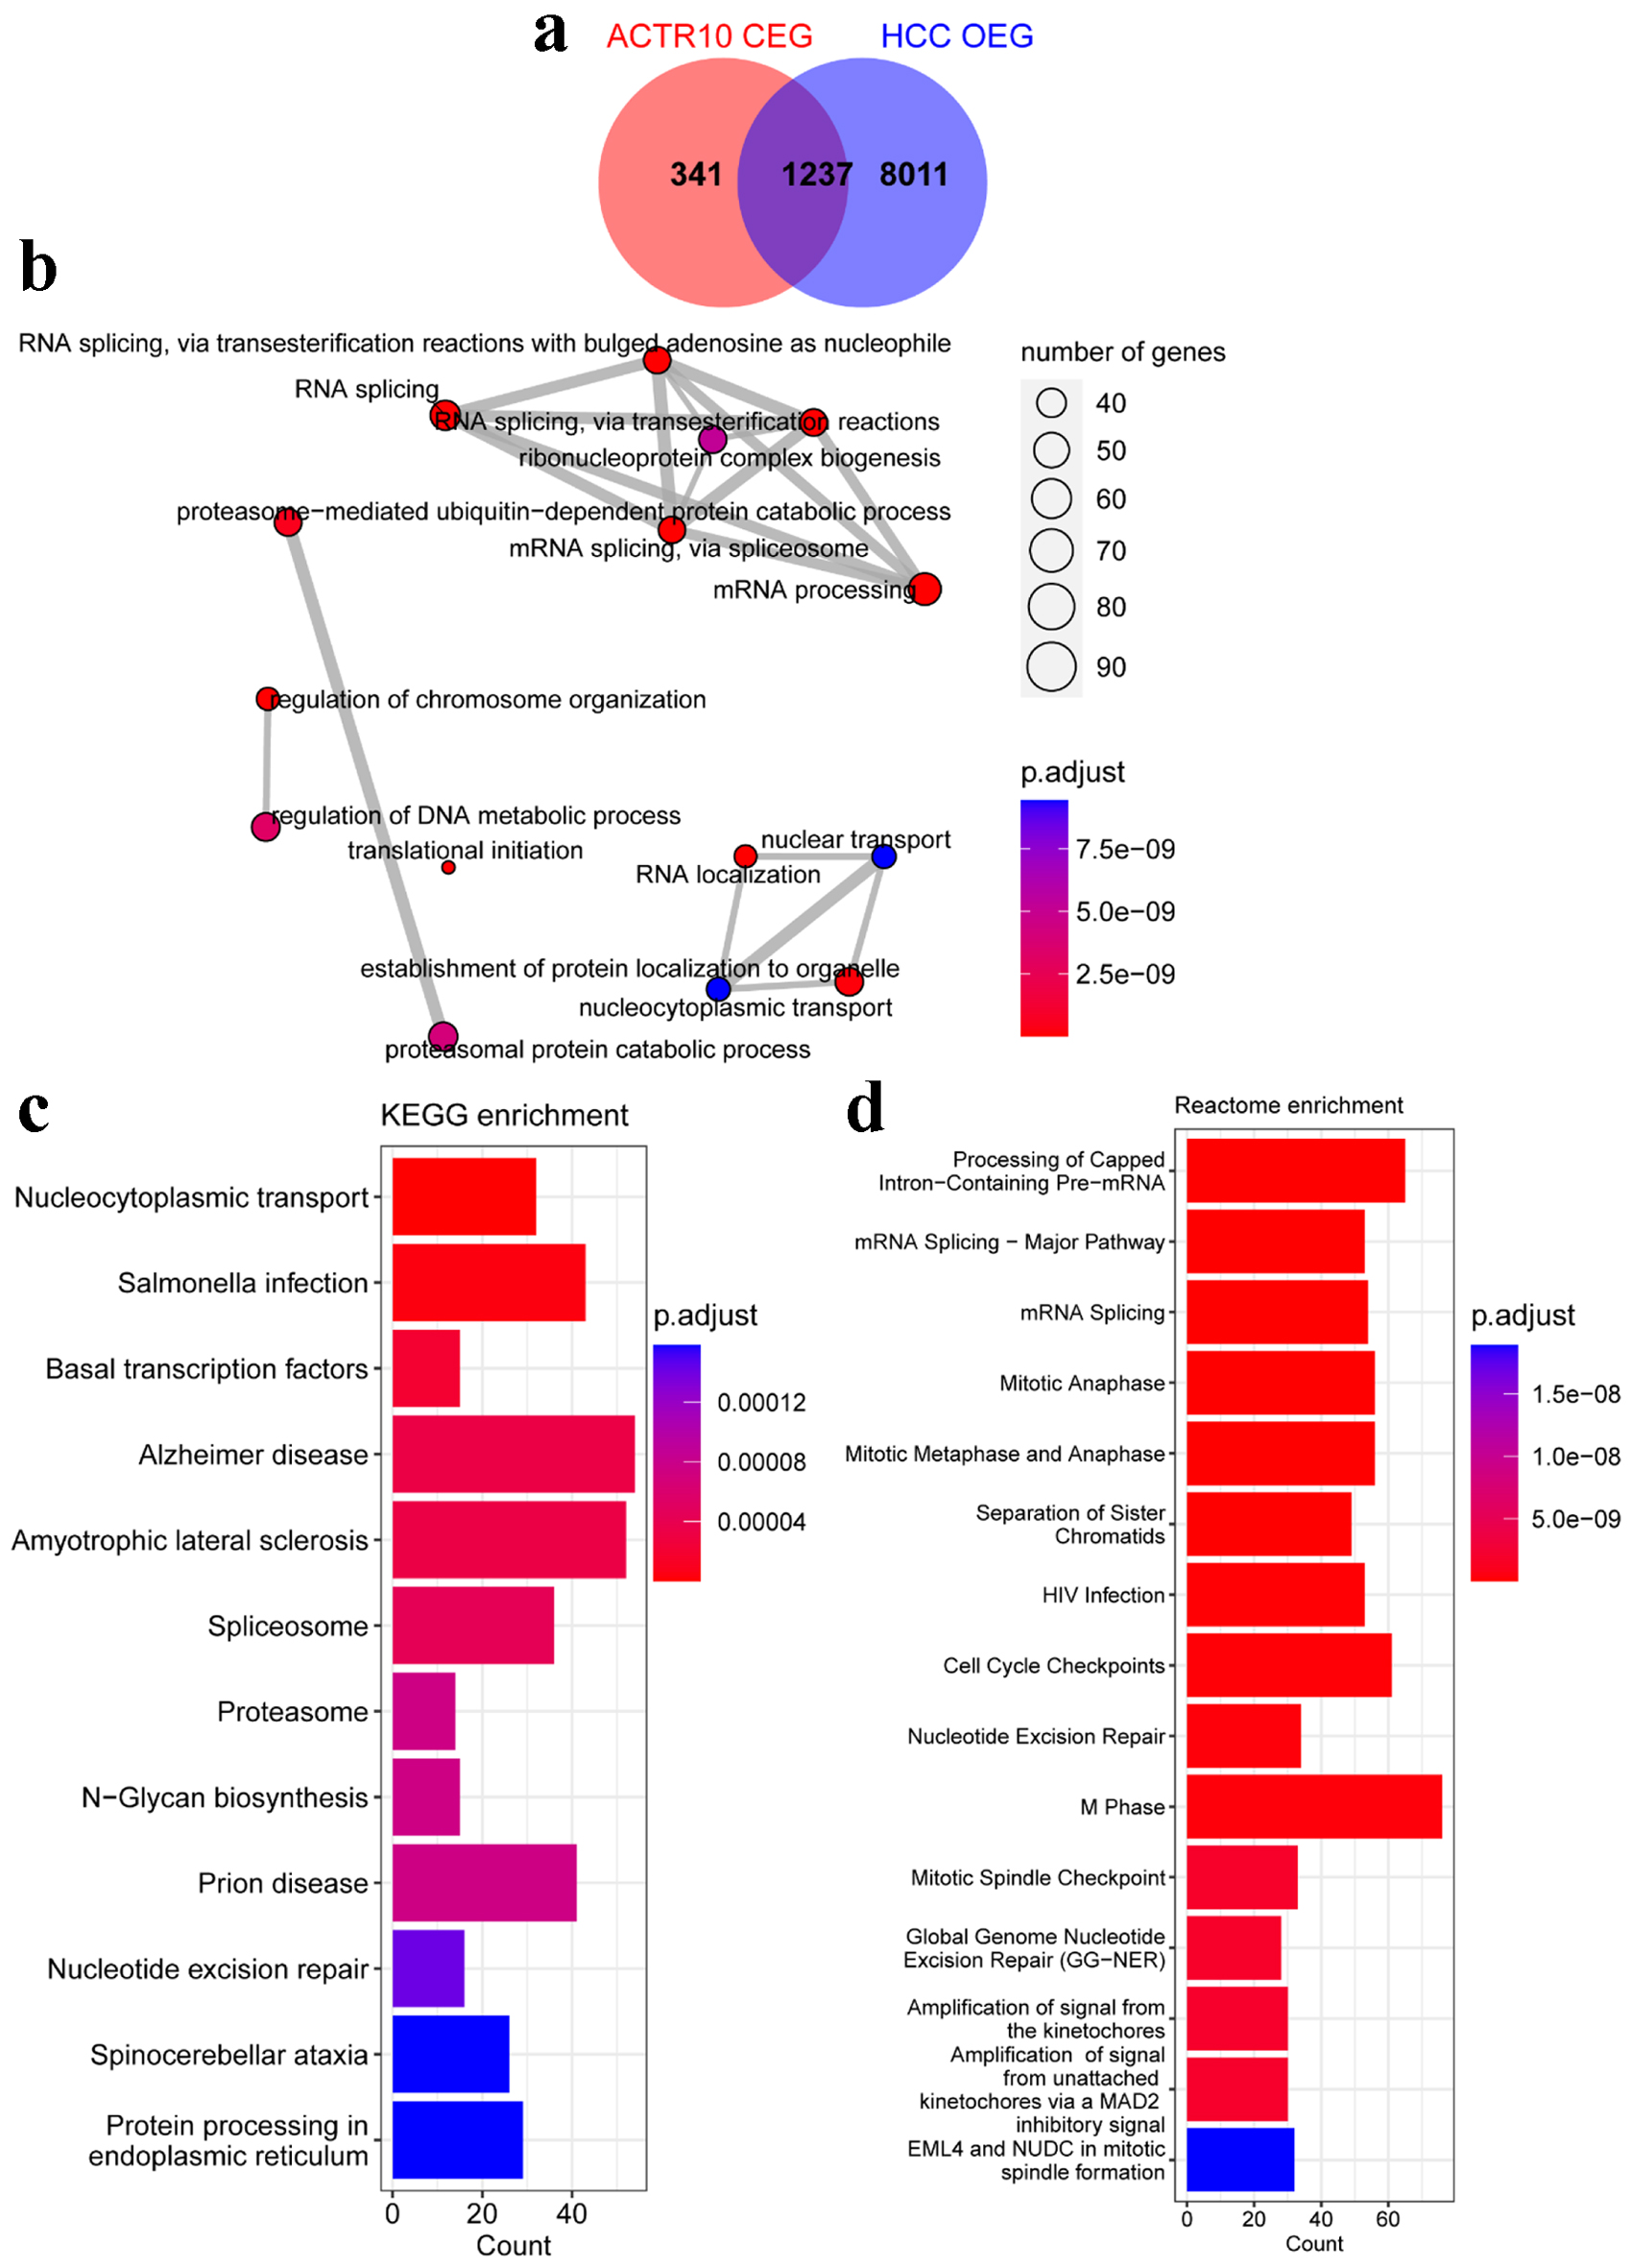
↓ Figure 6. Analyses of the potential pathogenic
molecular mechanisms of ACTR10 in HCC. (a) Intersecting genes were identified by overlapping the
HCC OEGs and ACTR10 CEGs. (b) The intersecting genes were subjected to GO functional enrichment.
(c) The intersecting genes were subjected to KEGG signal pathway analysis. (d) The intersecting genes
were subjected to Reactome signal pathway analysis. CEGs: co-expressed genes; GO: Gene Ontology; HCC:
hepatocellular carcinoma; KEGG: Kyoto Encyclopedia of Genes and Genomes; OEGs: overexpressed genes.
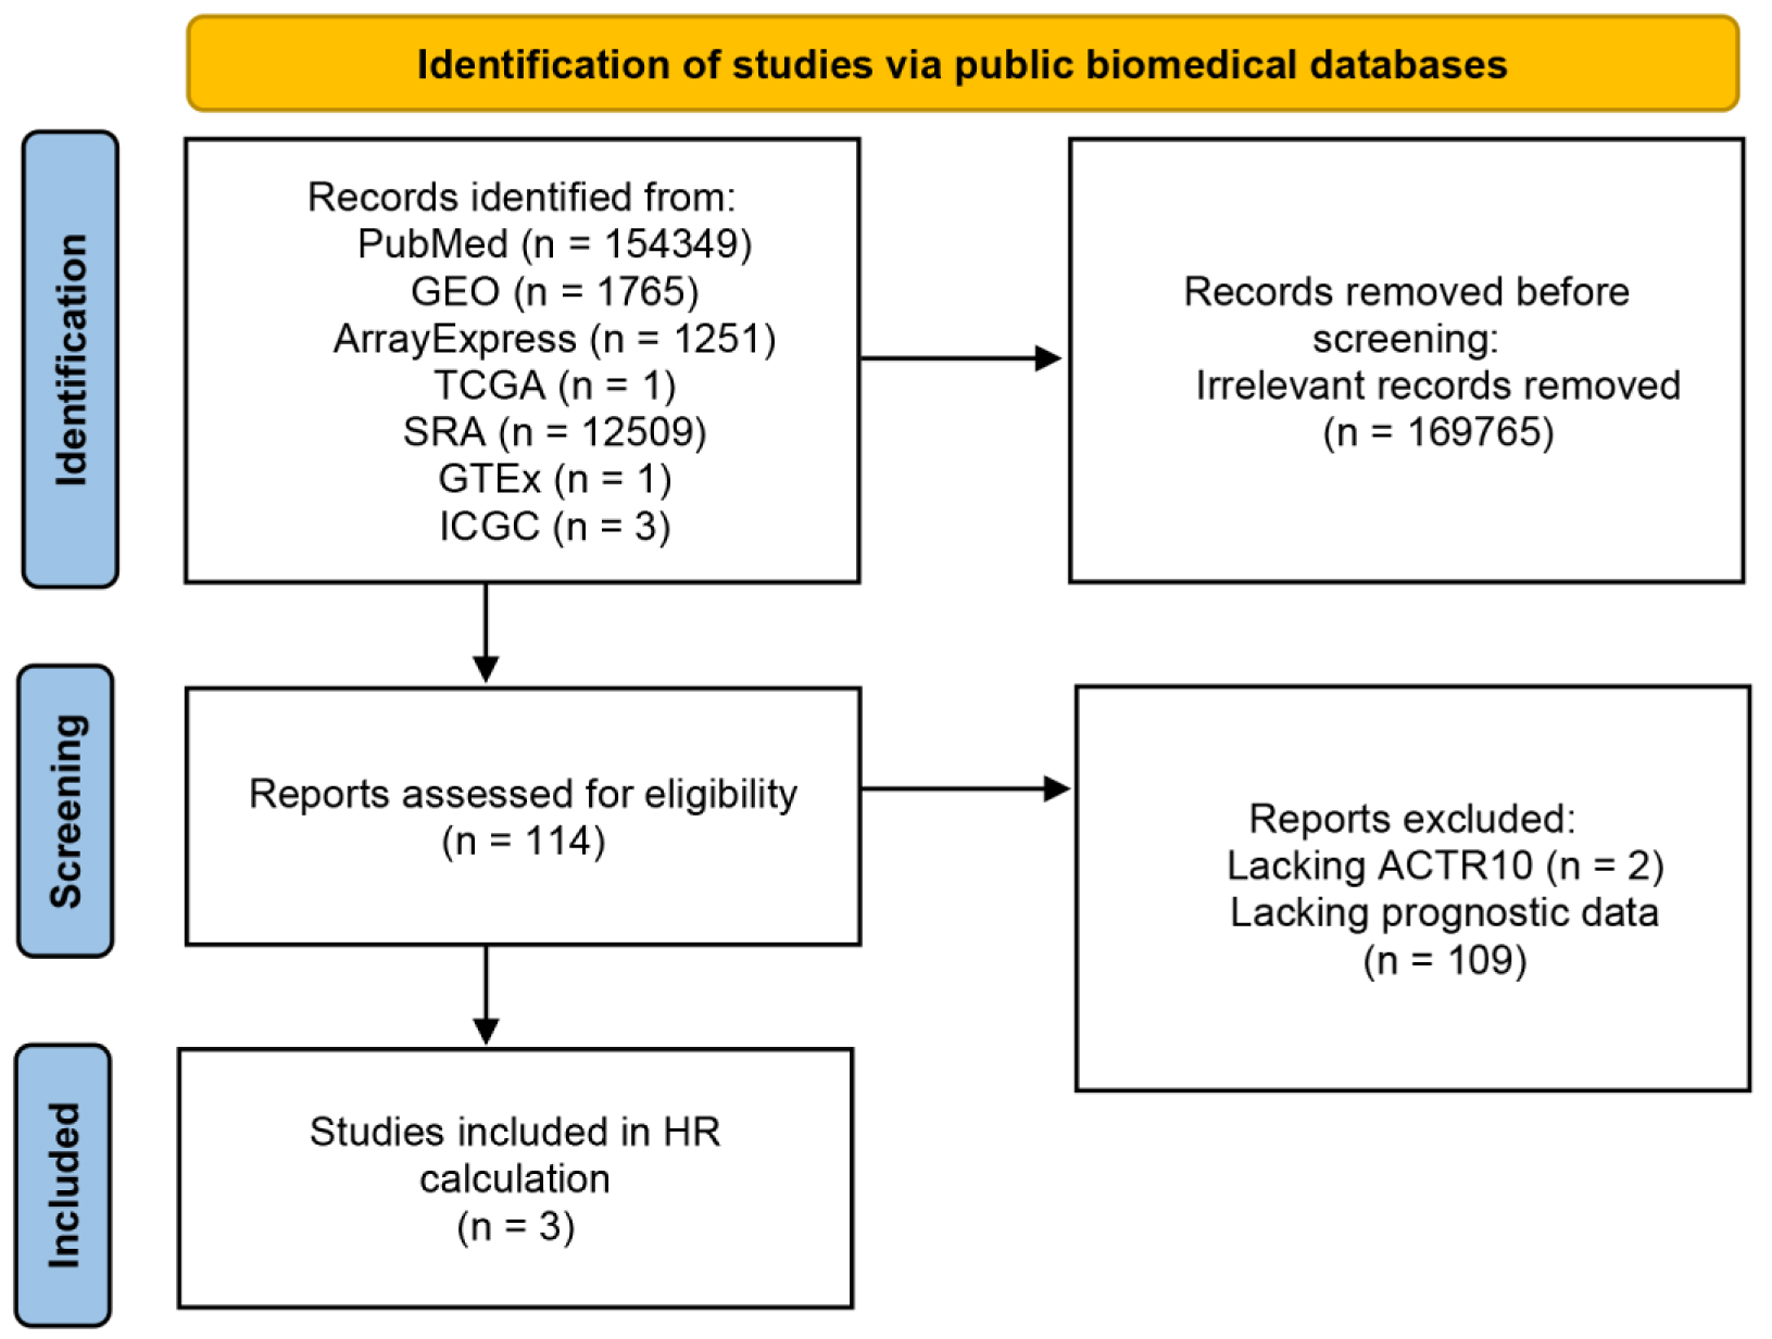
↓ Figure 7. Flow chart showing the process used
to screen and select the datasets for the survival analysis. GEO: Gene Expression Omnibus; GTEx:
Genotype-Tissue Expression; ICGC: International Cancer Genome Consortium; SRA: Sequence Read Archive;
TCGA: The Cancer Genome Atlas.
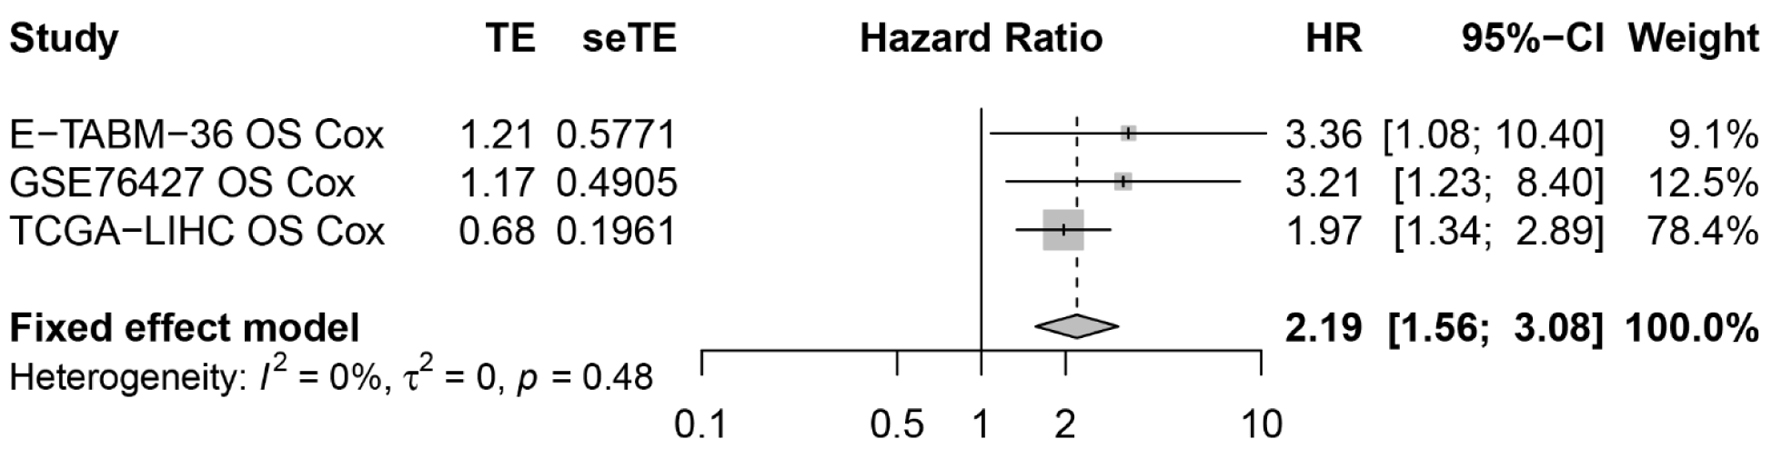
↓ Figure 8. The resultant forest plot showed that
ACTR10 was a risk factor for HCC patients. HCC: hepatocellular carcinoma; HR: hazard ratio.
↓ Figure 9. Flow chart showing the process used
to screen and select the datasets for the transcriptome-level TKI-resistance analysis. GEO: Gene
Expression Omnibus; GTEx: Genotype-Tissue Expression; ICGC: International Cancer Genome Consortium; SRA:
Sequence Read Archive; TCGA: The Cancer Genome Atlas; TKI: tyrosine kinase inhibitor.
↓ Figure 10. Integrated analysis of the
expression of ACTR10 in TKI-resistant HCC. (a) Forest plot showing the high expression of
ACTR10 in TKI-resistant HCC samples compared to TKI-sensitive samples. (b, c) The results of
Egger’s and Begg’s tests showed that there was no publication bias. HCC: hepatocellular
carcinoma; TKI: tyrosine kinase inhibitor.
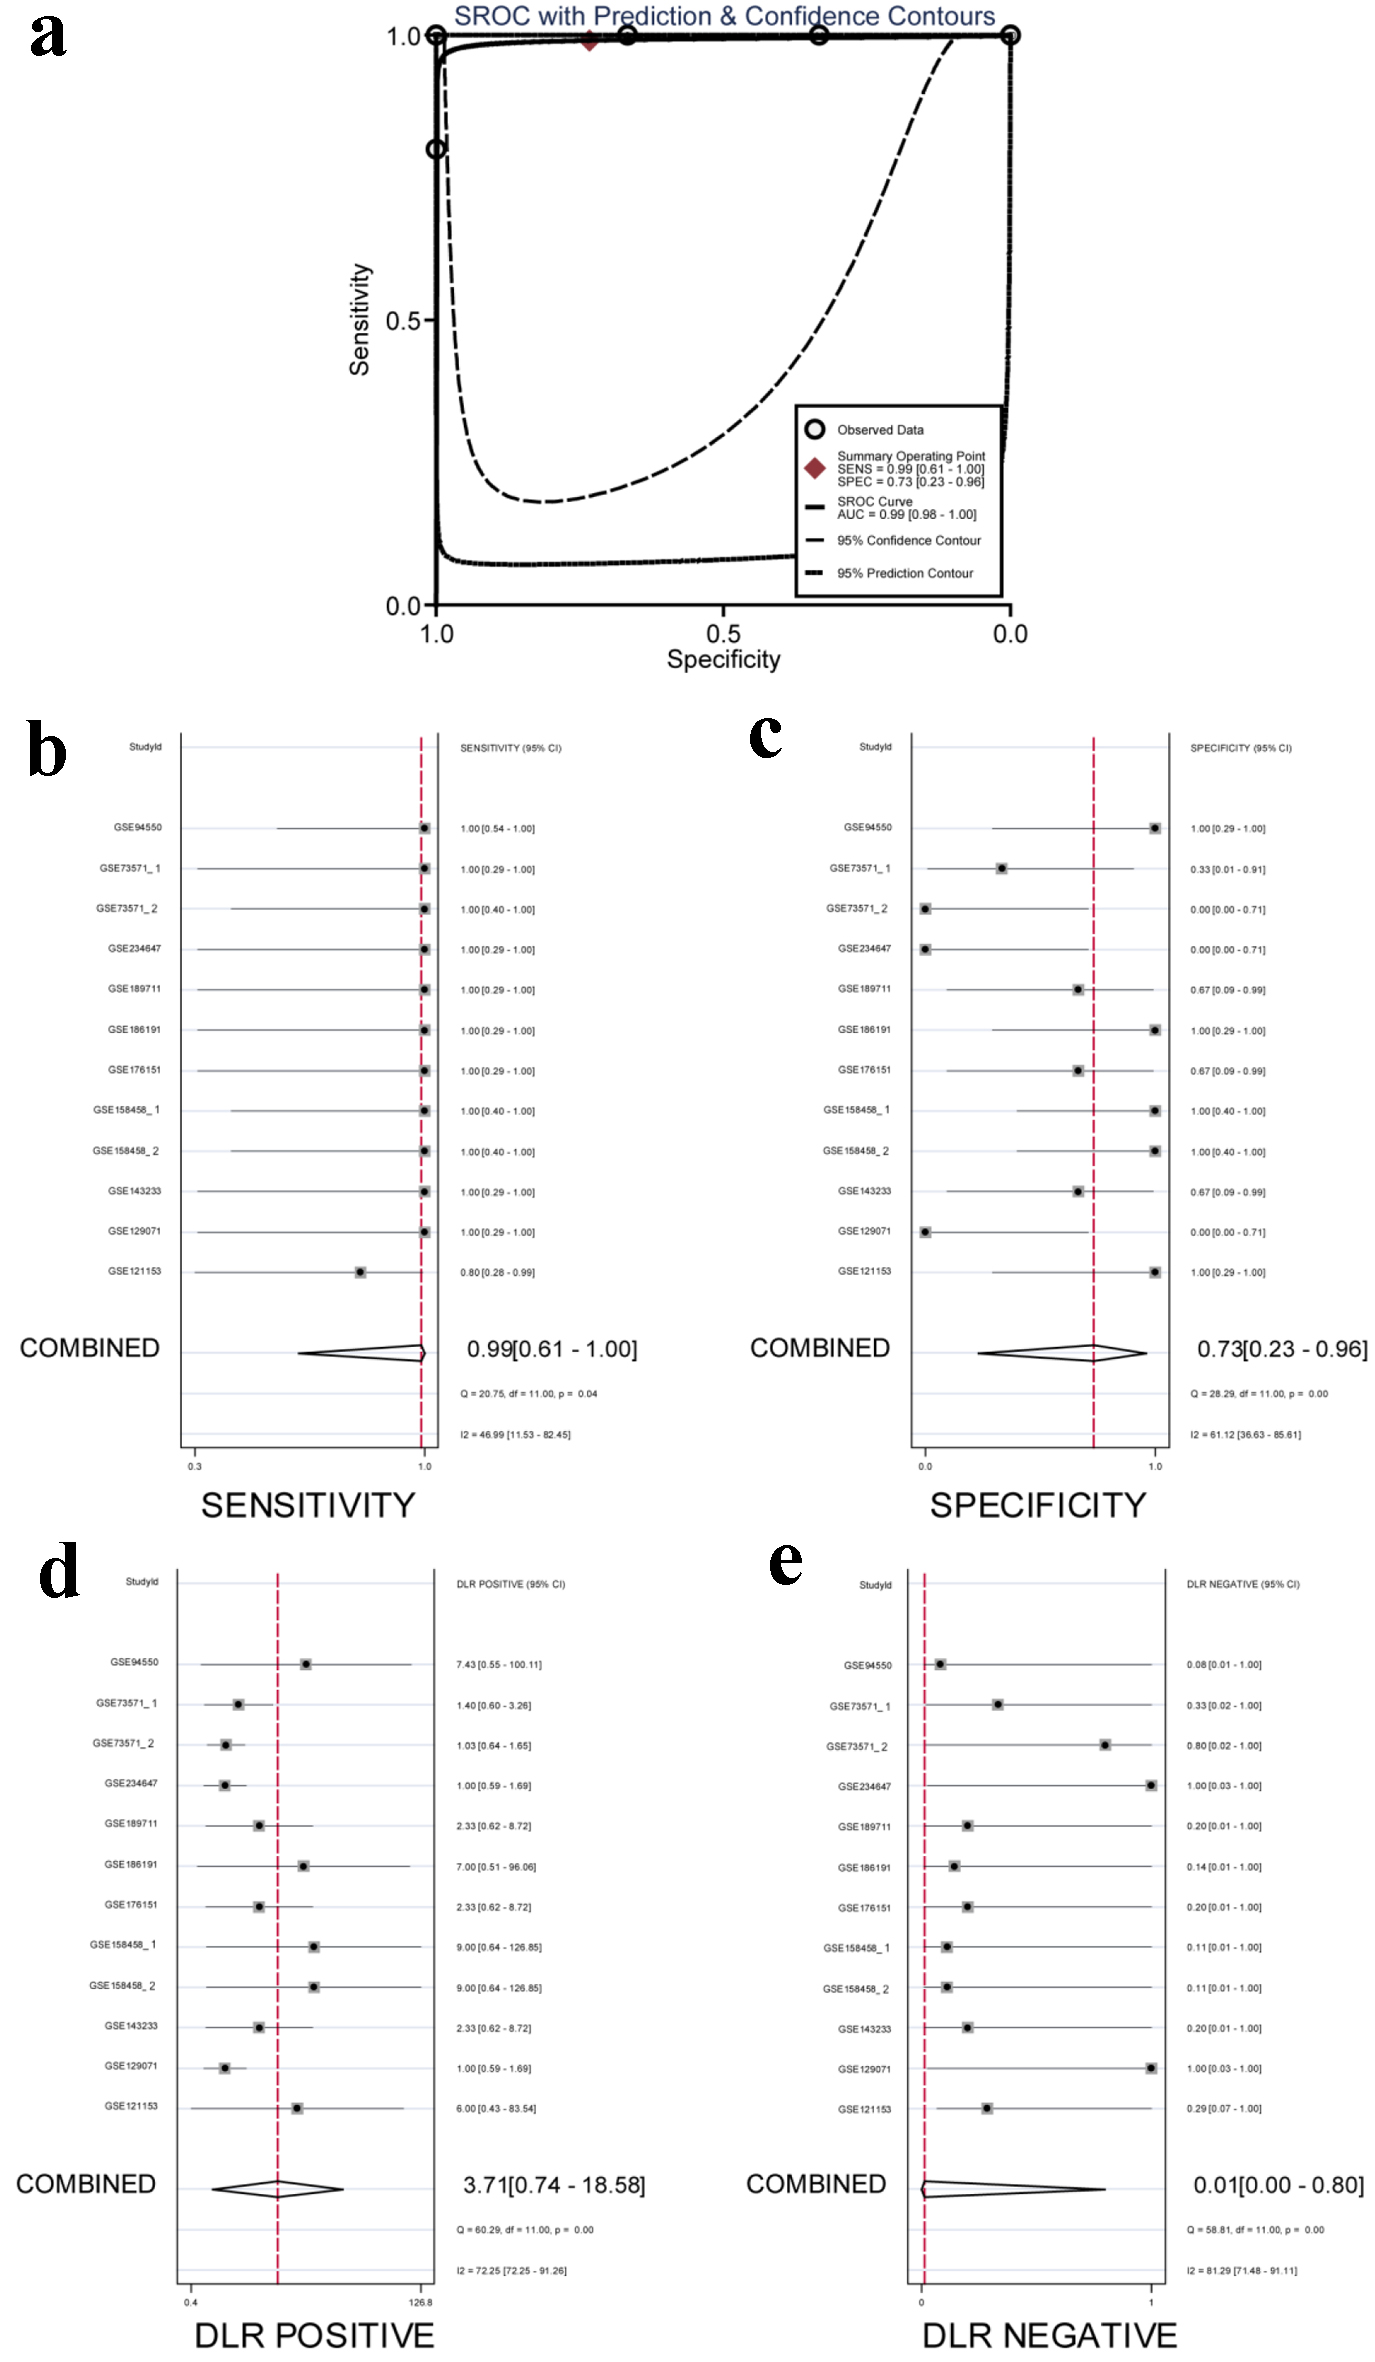
↓ Figure 11. Integrated analysis of the
diagnostic performance of ACTR10 in TKI-resistant HCC. (a) The AUC of the sROC curve was 0.99
(95% CI: 0.98 - 1.00), with a sensitivity of 0.99 (95% CI: 0.61 - 1.00) and a specificity of 0.73 (95%
CI: 0.23 - 0.96). (b) The combined sensitivity was 0.99 (95% CI: 0.61 - 1.00). (c) The combined
specificity was 0.73 (95% CI: 0.23 - 0.96). (d) The combined positive DLR was 3.71 (95% CI: 0.74 -
18.58). (e) The combined negative DLR was 0.01 (95% CI: 0.00 - 0.80). AUC: area under the curve; CI:
confidence interval; DLR: diagnostic likelihood ratio; HCC: hepatocellular carcinoma; sROC: summary
receiver operating characteristic; TKI: tyrosine kinase inhibitor.
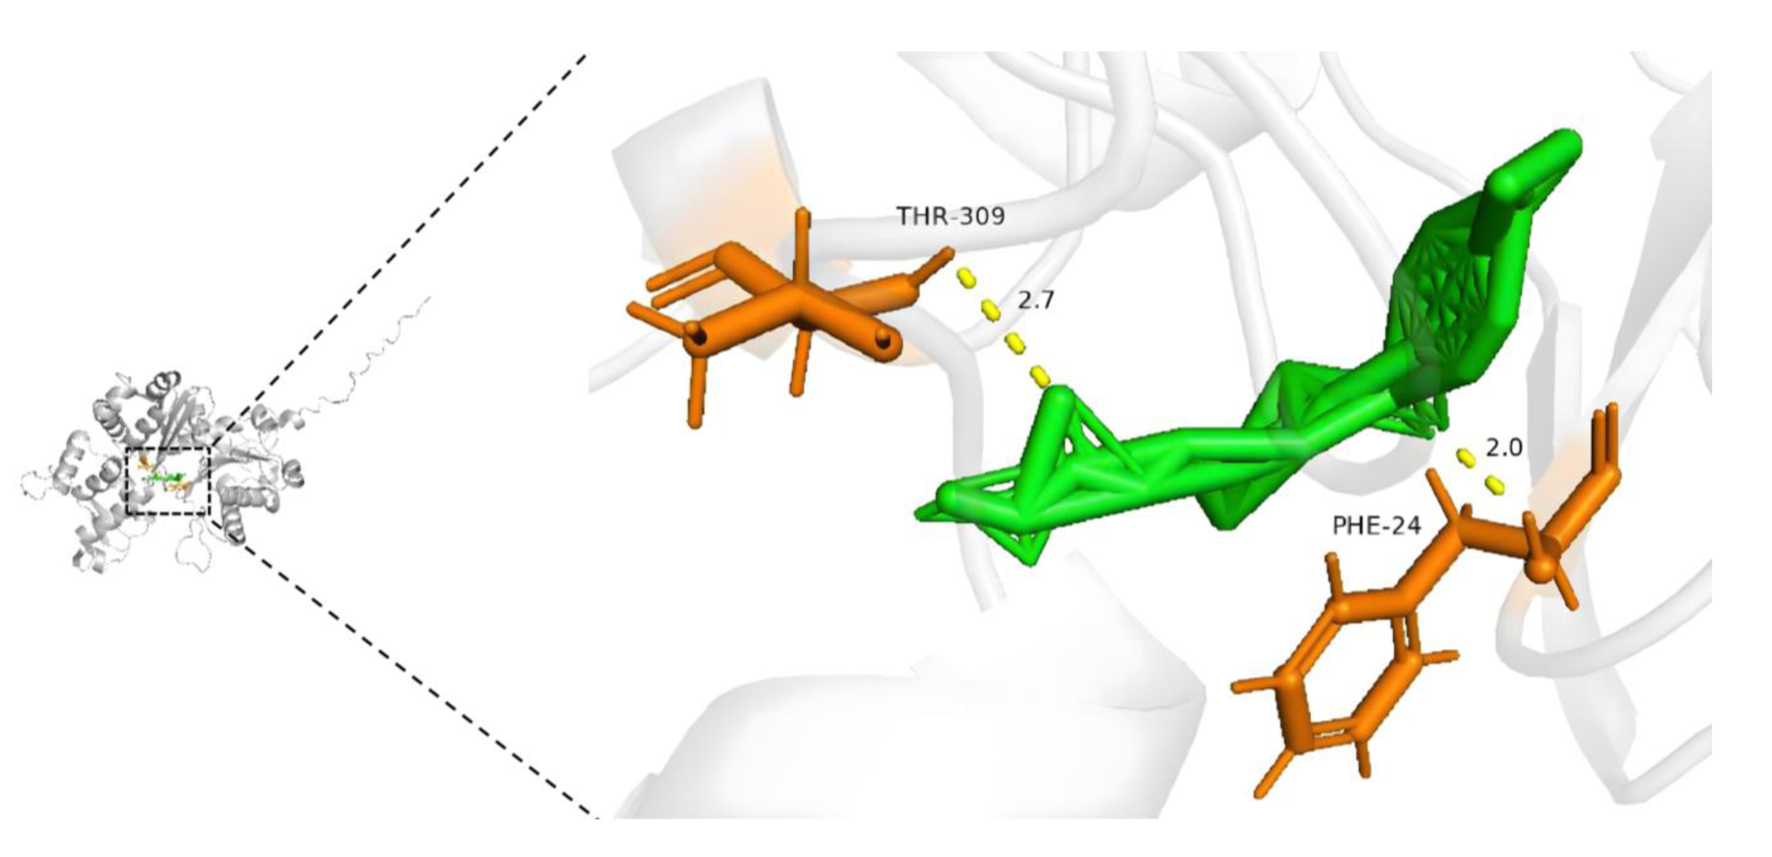
↓ Figure 12. Molecular docking model of
trichostatin A and ACTR10 (affinity energy = -8.1 kcal/mol).
Tables
↓ Table 1. Information on the ACTR10 mRNA Datasets
|
Study |
NHCC |
MHCC |
SDHCC |
Nnon-HCC liver |
Mnon-HCC liver |
SDnon-HCC liver |
| NHCC: the number of HCC samples; MHCC: the mean expression level
of ACTR10 in HCC samples; SDHCC: the standard deviation of ACTR10
expression in HCC samples; Nnon-HCC liver: the number of non-HCC liver samples;
Mnon-HCC liver: the mean expression level of ACTR10 in non-HCC liver samples;
SDnon-HCC liver: the standard deviation of ACTR10 expression in non-HCC liver
samples; HCC: hepatocellular carcinoma. |
| E_MTAB_8887 |
23 |
3.41 |
0.77 |
17 |
3.48 |
0.99 |
| GPL10558 |
523 |
6.35 |
0.33 |
403 |
6.23 |
0.31 |
| GPL11154 |
245 |
3.10 |
0.99 |
168 |
2.90 |
0.89 |
| GPL13667 |
338 |
6.64 |
0.44 |
342 |
6.53 |
0.34 |
| GPL14951 |
93 |
8.25 |
0.45 |
18 |
7.80 |
0.59 |
| GPL16043 |
25 |
1.27 |
0.64 |
25 |
1.31 |
0.57 |
| GPL16791 |
209 |
5.03 |
1.19 |
114 |
4.56 |
0.94 |
| GPL17586 |
101 |
6.53 |
0.24 |
89 |
6.30 |
0.14 |
| GPL18573 |
215 |
2.74 |
2.55 |
13 |
1.59 |
1.56 |
| GPL20301 |
48 |
3.09 |
1.74 |
30 |
2.41 |
1.21 |
| GPL20795 |
38 |
4.66 |
0.96 |
38 |
4.17 |
0.56 |
| GPL21047 |
10 |
3.38 |
0.11 |
10 |
3.35 |
0.07 |
| GPL24676 |
406 |
4.01 |
1.52 |
135 |
3.32 |
1.30 |
| GPL4133 |
18 |
11.71 |
0.91 |
18 |
10.89 |
0.76 |
| GPL5175 |
48 |
3.11 |
0.06 |
48 |
3.06 |
0.04 |
| GPL570 |
844 |
5.31 |
0.26 |
528 |
5.30 |
0.21 |
| GPL571 |
96 |
3.28 |
0.05 |
131 |
3.27 |
0.04 |
| GPL6244 |
66 |
3.83 |
0.12 |
75 |
3.80 |
0.10 |
| GPL6480 |
83 |
3.57 |
0.04 |
82 |
3.56 |
0.03 |
| GPL6947 |
104 |
3.29 |
0.09 |
97 |
3.30 |
0.06 |
| GPL9052 |
60 |
4.43 |
0.55 |
60 |
4.29 |
0.49 |
| GSE114783 |
10 |
7.84 |
1.72 |
26 |
8.80 |
1.48 |
| GSE115018 |
12 |
-1.85 |
0.48 |
12 |
-1.86 |
0.16 |
| GSE14520 |
225 |
3.27 |
0.08 |
220 |
3.18 |
0.09 |
| GSE166163 |
3 |
5.96 |
0.42 |
3 |
6.44 |
1.69 |
| GSE20140 |
35 |
8.95 |
0.27 |
34 |
8.85 |
0.15 |
| GSE22058 |
100 |
10.88 |
0.34 |
97 |
10.81 |
0.19 |
| GSE22405 |
24 |
3.25 |
0.17 |
24 |
3.15 |
0.15 |
| GSE25097 |
268 |
3.03 |
0.16 |
289 |
3.01 |
0.09 |
| GSE33294 |
3 |
3.43 |
0.25 |
3 |
3.08 |
0.11 |
| GSE46444 |
88 |
6.90 |
1.03 |
48 |
7.31 |
0.91 |
| GSE50579 |
67 |
2.90 |
0.13 |
10 |
2.81 |
0.11 |
| GSE55048 |
4 |
3.02 |
0.39 |
4 |
2.60 |
0.26 |
| GSE56545 |
21 |
3.31 |
0.07 |
21 |
3.32 |
0.03 |
| GSE57555 |
5 |
-0.18 |
0.02 |
5 |
-0.15 |
0.03 |
| GSE59259 |
8 |
10.84 |
0.54 |
8 |
10.97 |
0.22 |
| GSE60502 |
18 |
10.73 |
0.45 |
18 |
10.37 |
0.30 |
| GSE67764 |
3 |
-1.16 |
0.20 |
6 |
-1.36 |
0.12 |
| ICGC_LIRI_JP |
240 |
3.16 |
2.43 |
197 |
2.93 |
2.21 |
| TCGA_GTEx_HCC |
371 |
4.06 |
0.56 |
276 |
3.92 |
0.58 |
↓ Table 2. Information on the Datasets Used for the Survival
Analysis
|
Study |
HCC
|
Platform |
| HCC: hepatocellular carcinoma. |
| E-TABM-36 |
41 |
Affymetrix HG-U133A GeneChips arrays |
| GSE76427 |
90 |
GPL10558 |
| TCGA-LIHC |
321 |
RNA-seq |
↓ Table 3. Information on the Datasets Used in the Transcriptome-Level
TKI-Resistance Analysis
|
Study |
NTKI-S |
MTKI-S |
SDTKI-S |
NTKI-R |
MTKI-R |
SDTKI-R |
| TKI: tyrosine kinase inhibitor; TKI-S: TKI-sensitive; TKI-R: TKI-resistant. |
| GSE121153 |
5 |
10.16 |
0.14 |
3 |
10.06 |
0.03 |
| GSE129071 |
3 |
3.71 |
0.66 |
3 |
4.55 |
1.03 |
| GSE143233 |
3 |
4.94 |
0.18 |
3 |
4.67 |
0.64 |
| GSE158458_1 |
4 |
6.31 |
0.13 |
4 |
5.50 |
0.26 |
| GSE158458_2 |
4 |
7.10 |
0.24 |
4 |
6.55 |
0.10 |
| GSE176151 |
3 |
5.37 |
0.25 |
3 |
5.14 |
0.29 |
| GSE186191 |
3 |
5.62 |
0.10 |
3 |
5.27 |
0.08 |
| GSE189711 |
3 |
9.78 |
0.19 |
3 |
9.38 |
0.20 |
| GSE234647 |
3 |
3.44 |
2.02 |
3 |
4.47 |
1.70 |
| GSE73571_1 |
4 |
9.88 |
0.07 |
3 |
10.24 |
0.04 |
| GSE73571_2 |
3 |
9.60 |
0.07 |
3 |
9.53 |
0.10 |
| GSE94550 |
6 |
10.39 |
0.05 |
3 |
10.25 |
0.05 |
↓ Table 4. Potential Drugs Targeting ACTR10 in DGB
Database
|
|
Cell
line |
Time
|
Dose
|
P-value |
q-value |
logFoldChange |
Specificity |
| DGB: Drug Gene Budger. |
| Trichostatin A |
MCF7 |
6 h |
0.1 µM |
0 |
0 |
-1.35095 |
0.000249563 |
| Trichostatin A |
HL60 |
6 h |
0.1 µM |
5.33468 × 10-38 |
5.22588×10-36 |
-1.07017 |
0.000342466 |
| Trichostatin A |
HL60 |
6 h |
1.0 µM |
1.35366 × 10⁻¹³ |
1.00243×10⁻¹¹ |
-1.74451 |
0.000390778 |