| World Journal of Oncology, ISSN 1920-4531 print, 1920-454X online, Open Access |
| Article copyright, the authors; Journal compilation copyright, World J Oncol and Elmer Press Inc |
| Journal website https://wjon.elmerpub.com |
Original Article
Volume 17, Number 4, August 2026, pages 494-508

Integrated Transcriptomic Analysis Identifies Potential Biomarkers in Castration-Resistant Prostate Cancer
Abdulghani A. Naeema, b, c, f, Saud A. Abdulsamada, b, c, Ateequllah Hayatd, Ayesha Naeemd, Nada Alhazmia, b, Ghaith Fallataa, b, Anas Bokharia, b, Abdulmajeed H. Alharbia, b, Kinani A. Alkinania, b, Abdullah M. Alshehria, b, Khadijah M. Aldabbaghb, e
aDepartment of Basic Sciences, College of Science and Health Professions, King Saud bin Abdulaziz University for Health Sciences, King Abdulaziz Medical City, Jeddah 21423, Saudi Arabia
bKing Abdullah International Medical Research Center (KAIMRC), Jeddah 21423, Saudi Arabia
cDepartment of Molecular and Clinical Cancer Medicine, University of Liverpool, Liverpool L69 3PX, UK
dDepartment of Molecular and Biomedical Sciences, City St George’s, University of London, London, UK
eCollege of Medicine, King Saud bin Abdulaziz University for Health Sciences, Ministry of National Guard–Health Affairs, Jeddah 21423, Saudi Arabia
fCorresponding Author: Abdulghani A. Naeem, Department of Basic Sciences, College of Science and Health Professions, King Saud bin Abdulaziz University for Health Sciences, King Abdulaziz Medical City, Jeddah 21423, Saudi Arabia
Manuscript submitted March 20, 2026, accepted May 21, 2026, published online June 25, 2026
Short title: Transcriptomic Profiling of CRPC
doi: https://doi.org/10.14740/wjon2772
| Abstract | ▴Top |
Background: Castration-resistant prostate cancer (CRPC) represents an aggressive stage of prostate cancer that develops following resistance to androgen deprivation therapy. Although androgen receptor (AR) signaling remains a central driver of disease progression, additional adaptive molecular mechanisms contribute to therapeutic resistance. Understanding the transcriptional programs underlying CRPC may facilitate the identification of novel biomarkers and therapeutic targets.
Methods: RNA sequencing–based transcriptomic profiling was performed to compare a non-malignant prostate epithelial model (PNT2) with a CRPC model retaining AR expression (22Rv1). Differential gene expression analysis was conducted using DESeq2. Functional enrichment analyses were performed using Gene Ontology (GO) and Kyoto Encyclopedia of Genes and Genomes (KEGG) pathway analyses. Gene co-expression network analysis was applied to identify coordinated regulatory interactions. Clinical validation of candidate genes was performed using Gene Expression Profiling Interactive Analysis 2 (GEPIA2), integrating datasets from The Cancer Genome Atlas (TCGA) and the Genotype-Tissue Expression (GTEx) project.
Results: Transcriptomic comparison revealed extensive transcriptional remodeling associated with the castration-resistant phenotype. Several genes, including MALAT1, FASN, PARP1, SET, ENSG00000214719, and IGF1, were significantly dysregulated. Functional enrichment analyses demonstrated activation of metabolic processes, ribosome-associated pathways, nucleic acid binding functions, and PI3K–Akt signaling. Gene co-expression network analysis identified an AR-centered regulatory module involving PARP1, KDM6B, BAZ2A, RANGAP1, NFAT5, and MAP4. Clinical validation confirmed elevated expression of FASN, PARP1, SET, and ENSG00000214719 in prostate adenocarcinoma samples.
Conclusions: Integrated transcriptomic and network analyses reveal coordinated metabolic, epigenetic, and DNA damage response pathways contributing to CRPC progression and identify potential combinatorial therapeutic vulnerabilities in advanced prostate cancer.
Keywords: Prostate cancer; Castration-resistant prostate cancer; RNA sequencing; Gene expression; Biomarkers; Bioinformatics
| Introduction | ▴Top |
Prostate cancer (PCa) is a biologically heterogeneous disease that develops in the prostate gland, causing hyperplasia and malignancy in the prostatic tissues. PCa remains a major global health concern as it ranks as the most common diagnosed cancer in men worldwide [1, 2]. It is estimated that 67 per 100,000 people die from PCa every year in North America and Northern Europe [1]. The prevalence of PCa in Middle East has increased over the past 20 years by 125%, and the prevalence was 27 per 100,000 [3]. PCa is a multifactorial disease whose onset is influenced by several environmental and molecular factors including age, family history, race, genetic makeup, and immune system [2, 4]. The nuclear androgen receptor (AR) and its ligands play a central role in the initiation and progression of PCa, particularly during the early stages of the disease [5, 6]. Because PCa is largely androgen-dependent, first-line treatment typically involves androgen deprivation therapy (ADT) using anti-androgen agents such as bicalutamide, enzalutamide, or abiraterone acetate, with or without surgical castration [6–8]. Although ADT initially suppresses tumor growth, PCa frequently progresses to castration-resistant prostate cancer (CRPC), a lethal stage characterized by tumor adaptation and continued proliferation despite androgen-depleted conditions [6, 9, 10]. The progression of CRPC is driven by heterogeneous molecular mechanisms, including AR amplification, the emergence of constitutively active splice variants such as AR-V7, and de novo intratumoral androgen synthesis [10, 11]. Beyond AR signaling, progression is furthered by alternative oncogenic pathways, including PI3K/AKT and MAPK signaling, alongside neuroendocrine differentiation. Notably, metabolic deregulation has emerged as a crucial survival strategy [10, 12]. Recent research highlights the significance of fatty acid-binding protein 5 (FABP5) in CRPC, demonstrating that this lipid chaperone enhances tumor aggressiveness and facilitates a bypass of androgen dependence by activating the PPAR gamma and VEGF signaling axes [13]. Furthermore, FABP5 and related metabolic regulators contribute significantly to resistance against taxanes and next-generation anti-androgens [14]. Consequently, targeting the interplay between lipid metabolism and oncogenic signaling warrants further investigation to overcome therapeutic resistance in advanced PCa. To address these challenges, we performed RNA sequencing–based transcriptomic profiling to compare a non-malignant prostate epithelial model (PNT2) with a CRPC model retaining AR expression (22Rv1). Differential gene expression analysis was conducted using DESeq2, followed by Gene Ontology (GO) and Kyoto Encyclopedia of Genes and Genomes (KEGG) enrichment analyses to identify biological pathways associated with CRPC progression. To further explore regulatory relationships among dysregulated genes, a gene co-expression network analysis was performed to characterize network-level transcriptional coordination. Finally, the clinical relevance of candidate genes was evaluated using Gene Expression Profiling Interactive Analysis 2 (GEPIA2), integrating transcriptomic datasets from The Cancer Genome Atlas (TCGA) and the Genotype-Tissue Expression (GTEx) project. Identifying reliable molecular biomarkers and regulatory networks is essential for improving the diagnosis and management of CRPC and may support improved prognosis assessment and therapeutic targeting in advanced disease [15].
| Materials and Methods | ▴Top |
Cell lines and culture conditions
This study used two human prostate epithelial cell lines representing distinct biological states along the PCa continuum. PNT2 is a non-malignant prostate epithelial cell line derived from normal prostate tissue and immortalized using simian virus 40 (SV40) large T antigen, commonly used as a reference model for non-tumorigenic prostate epithelium [16]. 22Rv1 is a CRPC cell line established from a CWR22 xenograft that relapsed following androgen deprivation and is characterized by persistent AR expression, including both full-length AR and constitutively active splice variants, making it a widely used model of androgen-independent disease [16].
Both cell lines were obtained from the American Type Culture Collection (ATCC) and maintained under standardized culture conditions. Cells were grown as adherent monolayers in RPMI-1640 medium supplemented with 10% fetal bovine serum, L-glutamine, penicillin, and streptomycin, and incubated at 37 °C in a humidified atmosphere containing 5% CO2. To ensure experimental consistency and reduce technical variability, all experiments were conducted using three independent biological replicates, with cell lines maintained at comparable passage numbers and cultured using identical media formulations and seeding conditions [14].
RNA extraction and library preparation
Total RNA was isolated from cryopreserved cell pellets using the RNeasy Mini Kit in accordance with the manufacturer’s instructions. RNA concentration and integrity were assessed using the Agilent TapeStation 4200, and only samples with an RNA integrity number (RIN) ≥ 8 were advanced for sequencing. To reduce ribosomal RNA content, samples underwent rRNA depletion using the Qiagen FastSelect rRNA HMR Kit prior to library construction. Sequencing libraries were then prepared using the NEBNext Ultra II RNA Library Prep Kit for Illumina. Library quantity was measured with a Qubit 2.0 Fluorometer, and library quality was further confirmed by quantitative polymerase chain reaction. High-throughput sequencing was carried out on the Illumina NovaSeq 6000 platform using a paired-end 2 × 150 bp read configuration (v1.5) to achieve an average depth of approximately 30 million paired-end reads per sample. Raw base call files were converted to FASTQ format and demultiplexed according to unique index sequences using bcl2fastq [11].
Quality control and preprocessing
Sequencing read quality was assessed before and after preprocessing using FastQC; summary reports were generated through MultiQC. Adapter contamination and low-quality bases were removed using Trimmomatic by applying a sliding window filter (4 bp, Phred score ≥ 20), enforcing a minimum read length of 36 bp; and enabling adapter trimming. Only reads meeting quality thresholds following preprocessing were retained for downstream analyses [14].
Transcriptomic data analysis
Filtered high-quality reads were aligned to the human reference genome (GRCh38) using the STAR aligner (version 2.7). Gene-level read counts were generated, and differential expression analysis was performed using the DESeq2 package (version 1.38) within the R statistical environment (version 4.2). Statistical significance was determined using the Benjamini–Hochberg false discovery rate (FDR) correction. Genes with an absolute log2 fold change ≥ 1 and an adjusted P value < 0.05 were considered significantly differentially expressed [13].
To interpret the functional relevance of the transcriptional changes, GO and KEGG enrichment analyses were performed to identify perturbed biological processes and signaling pathways. Enrichment analyses were conducted using an FDR-based adjustment method, and P-value and q-value cutoffs were set at 0.05. Enriched terms were derived from gene sets containing sufficient differentially expressed gene (DEG) representation, and results were reported using readable gene annotations. Functional enrichment analyses were performed using the clusterProfiler package in R, and significantly enriched pathways were identified using an FDR-adjusted P-value threshold of 0.05.
Clinical validation using GEPIA2
Candidate genes emerging from differential expression and co-expression network analyses were further examined for clinical relevance using GEPIA2, a web-based resource integrating transcriptomic data from The Cancer Genome Atlas–Prostate Adenocarcinoma (TCGA-PRAD) and the GTEx project. Expression patterns of selected genes were assessed across tumor and normal prostate tissues to evaluate their association with PCa biology and to support the translational relevance of the identified gene signatures [15].
Statistical analysis
Statistical evaluation of experimental data was performed using GraphPad Prism version 9. Depending on the experimental design, significance was determined using either two-tailed paired Student’s t-tests or one-way analysis of variance (ANOVA) followed by appropriate post hoc comparisons. All experiments were conducted with three independent biological replicates, and quantitative results are presented as mean ± standard deviation (SD) unless stated otherwise.
Ethics approval
This study does not involve human participants or animal experiments; therefore, Institutional Review Board (IRB) approval was not required.
Ethical compliance
This study was conducted in accordance with applicable institutional and international ethical standards.
| Results | ▴Top |
Differential transcriptomic landscape distinguishes PNT2 and 22Rv1 cells
Figure 1 presents the global differential gene expression profile between PNT2 and 22Rv1 cells. The volcano plot (Fig. 1a) illustrates transcripts distributed according to log2 fold change and statistical significance, revealing extensive transcriptional remodeling associated with the castration-resistant phenotype. Differential expression analysis identified a substantial number of significantly altered transcripts between the two cellular states under the defined statistical thresholds. The most significantly DEGs are summarized in Table 1, including MALAT1, FASN, PARP1, SET, ENSG00000214719, and IGF1, which showed marked transcriptional differences between PNT2 and 22Rv1 cells. Heatmap visualization of these transcripts (Fig. 1b) demonstrates distinct expression patterns between PNT2 and 22Rv1, with coherent groups of genes exhibiting reciprocal expression across the two models. A focused view of representative genes (Fig. 1c) further highlights this divergence, where MALAT1, FASN, PARP1, SET, and ENSG00000214719 display increased expression in 22Rv1, whereas IGF1 shows comparatively higher expression in PNT2. Together, these results demonstrate distinct transcriptional differences between PNT2 and 22Rv1 cells and provide a foundation for subsequent enrichment and network analyses.
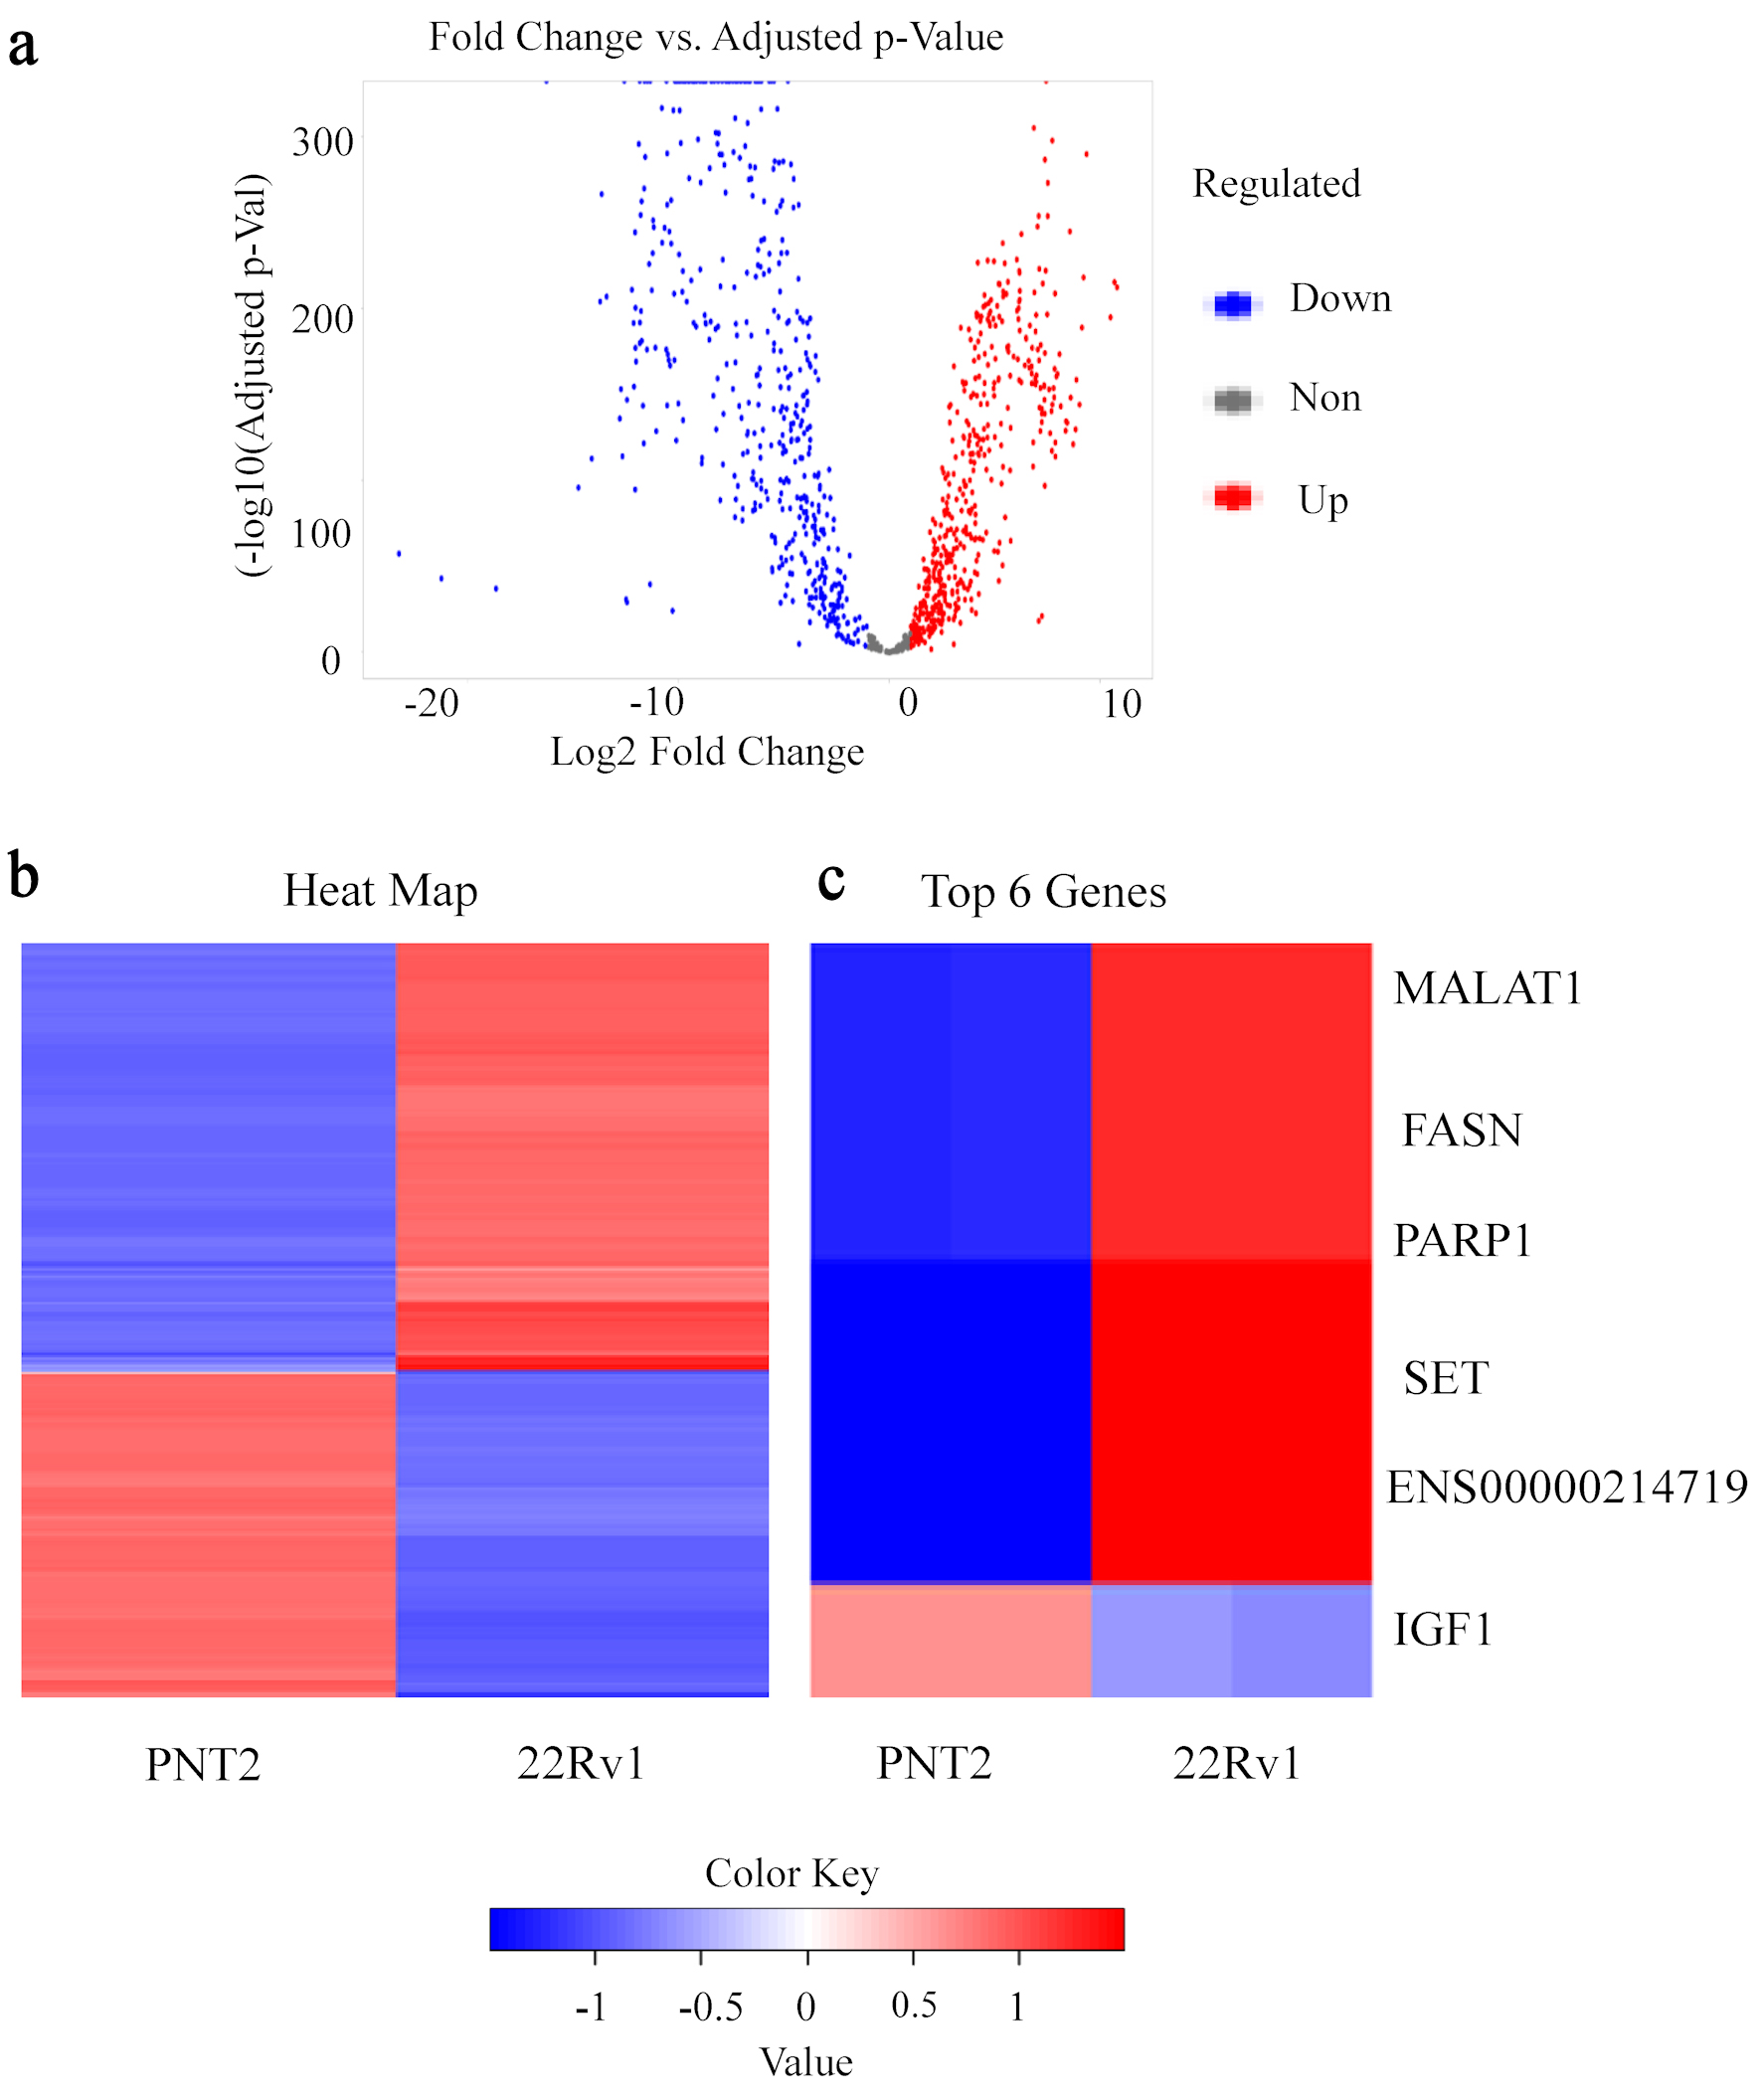 Click for large image | Figure 1. Differential transcriptomic landscape distinguishing PNT2 and 22Rv1 cells. (a) Volcano plot illustrating global differential gene expression between the non-malignant prostate epithelial cell line PNT2 and the castration-resistant prostate cancer cell line 22Rv1. Each point represents an individual gene distributed according to log2 fold change (x-axis) and statistical significance expressed as −log10 (adjusted P value) (y-axis). Genes significantly upregulated in 22Rv1 are highlighted in red, whereas genes downregulated relative to PNT2 are shown in blue. (b) Heatmap of the most significantly DEGs between PNT2 and 22Rv1 cells based on normalized transcript abundance. Hierarchical clustering reveals distinct gene expression patterns separating the non-malignant and castration-resistant cellular states. Red indicates relatively higher expression, whereas blue indicates lower expression. (c) Focused heatmap of representative genes identified among the top DEGs, including MALAT1, FASN, PARP1, SET, ENSG00000214719, and IGF1, illustrating clear transcriptional divergence between the two cellular models. DEGs: differentially expressed genes. |
 Click to view | Table 1. Top Differentially Expressed Genes Identified Between PNT2 and 22Rv1 Cells |
Biological process and cellular component enrichment analyses in PNT2 and 22Rv1 cells
Figure 2 summarizes GO enrichment analysis of DEGs identified between PNT2 and 22Rv1 cells. A detailed list of the most enriched biological process terms is provided in Table 2.
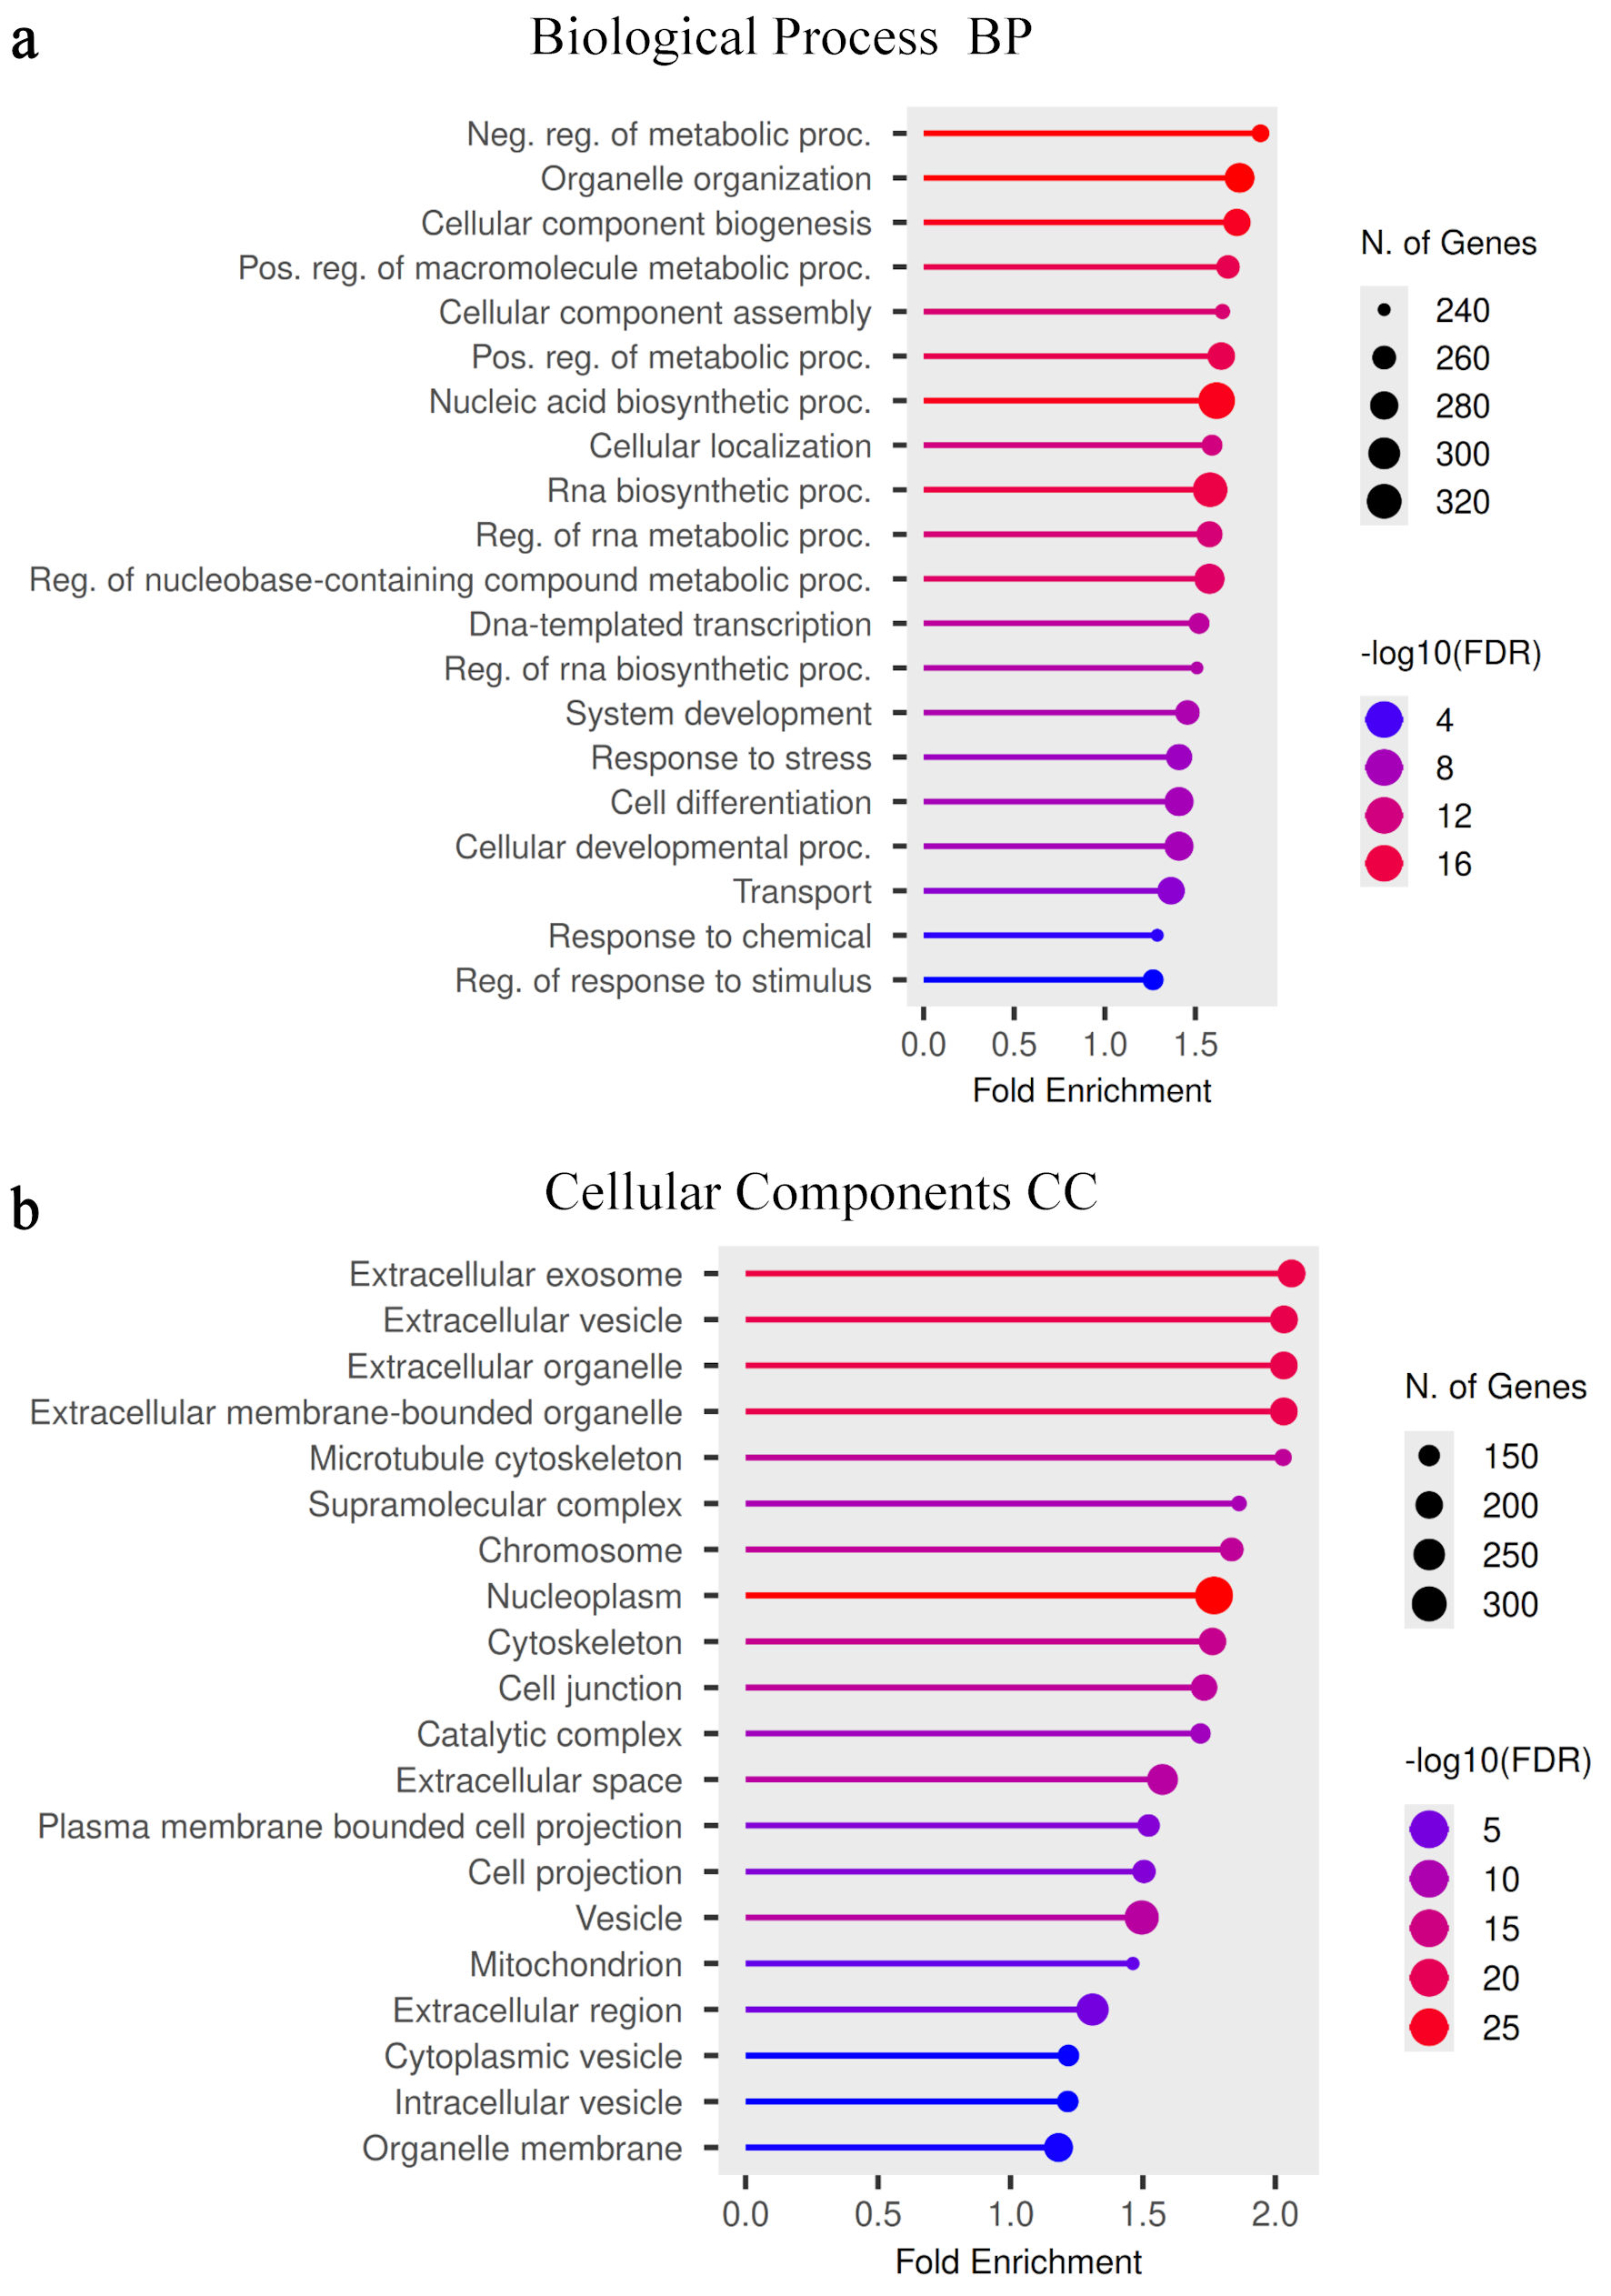 Click for large image | Figure 2. Gene Ontology (GO) enrichment analysis of differentially expressed genes. (a) GO biological process enrichment analysis of DEGs identified between PNT2 and 22Rv1 cells. The bubble plot displays significantly enriched biological processes associated with transcriptional remodeling in the castration-resistant state. The x-axis represents fold enrichment of each GO term. Bubble size indicates the number of genes contributing to each biological process, and color intensity represents statistical significance expressed as −log10(FDR). (b) GO cellular component enrichment analysis highlighting the subcellular compartments associated with the identified DEGs. Enriched categories include extracellular vesicle–related structures, cytoskeletal components, chromosomal elements, and mitochondrial-associated compartments. Bubble size reflects gene count, and color intensity represents −log10(FDR). FDR: false discovery rate; DEGs: differentially expressed genes. BP: biological process; CC: cellular component. |
Click to view | Table 2. Gene Ontology (GO) Biological Process Enrichment Analysis of Differentially Expressed Genes Between PNT2 and 22Rv1 Cells |
GO biological process enrichment (Fig. 2a) revealed significant overrepresentation of terms associated with regulation of metabolic processes, organelle organization, cellular component biogenesis, nucleic acid biosynthesis, RNA metabolic processes, and responses to cellular stimuli. These enriched categories reflect transcriptional changes related to metabolic regulation and macromolecular synthesis in 22Rv1 cells.
GO Cellular Component analysis (Fig. 2b) demonstrated significant enrichment in extracellular vesicle-related compartments, membrane-bounded organelles, microtubule cytoskeleton, chromosomes, cell junctions, and mitochondrial-associated structures. These enrichments reflect alterations in subcellular architecture and intercellular communication pathways associated with malignant transformation. The complete list of enriched cellular component categories is presented in Table 3.
Click to view | Table 3. Gene Ontology (GO) Cellular Component Enrichment Analysis of Differentially Expressed Genes Between PNT2 and 22Rv1 Cells |
Together, these enrichment patterns indicate coordinated changes in metabolic regulation and structural organization that characterize the transcriptomic landscape of 22Rv1 cells relative to PNT2.
Molecular function and KEGG enrichment analyses in PNT2 and 22Rv1 cells
Figure 3 illustrates the GO molecular function and KEGG pathway enrichment analyses of DEGs identified between PNT2 and 22Rv1 cells.
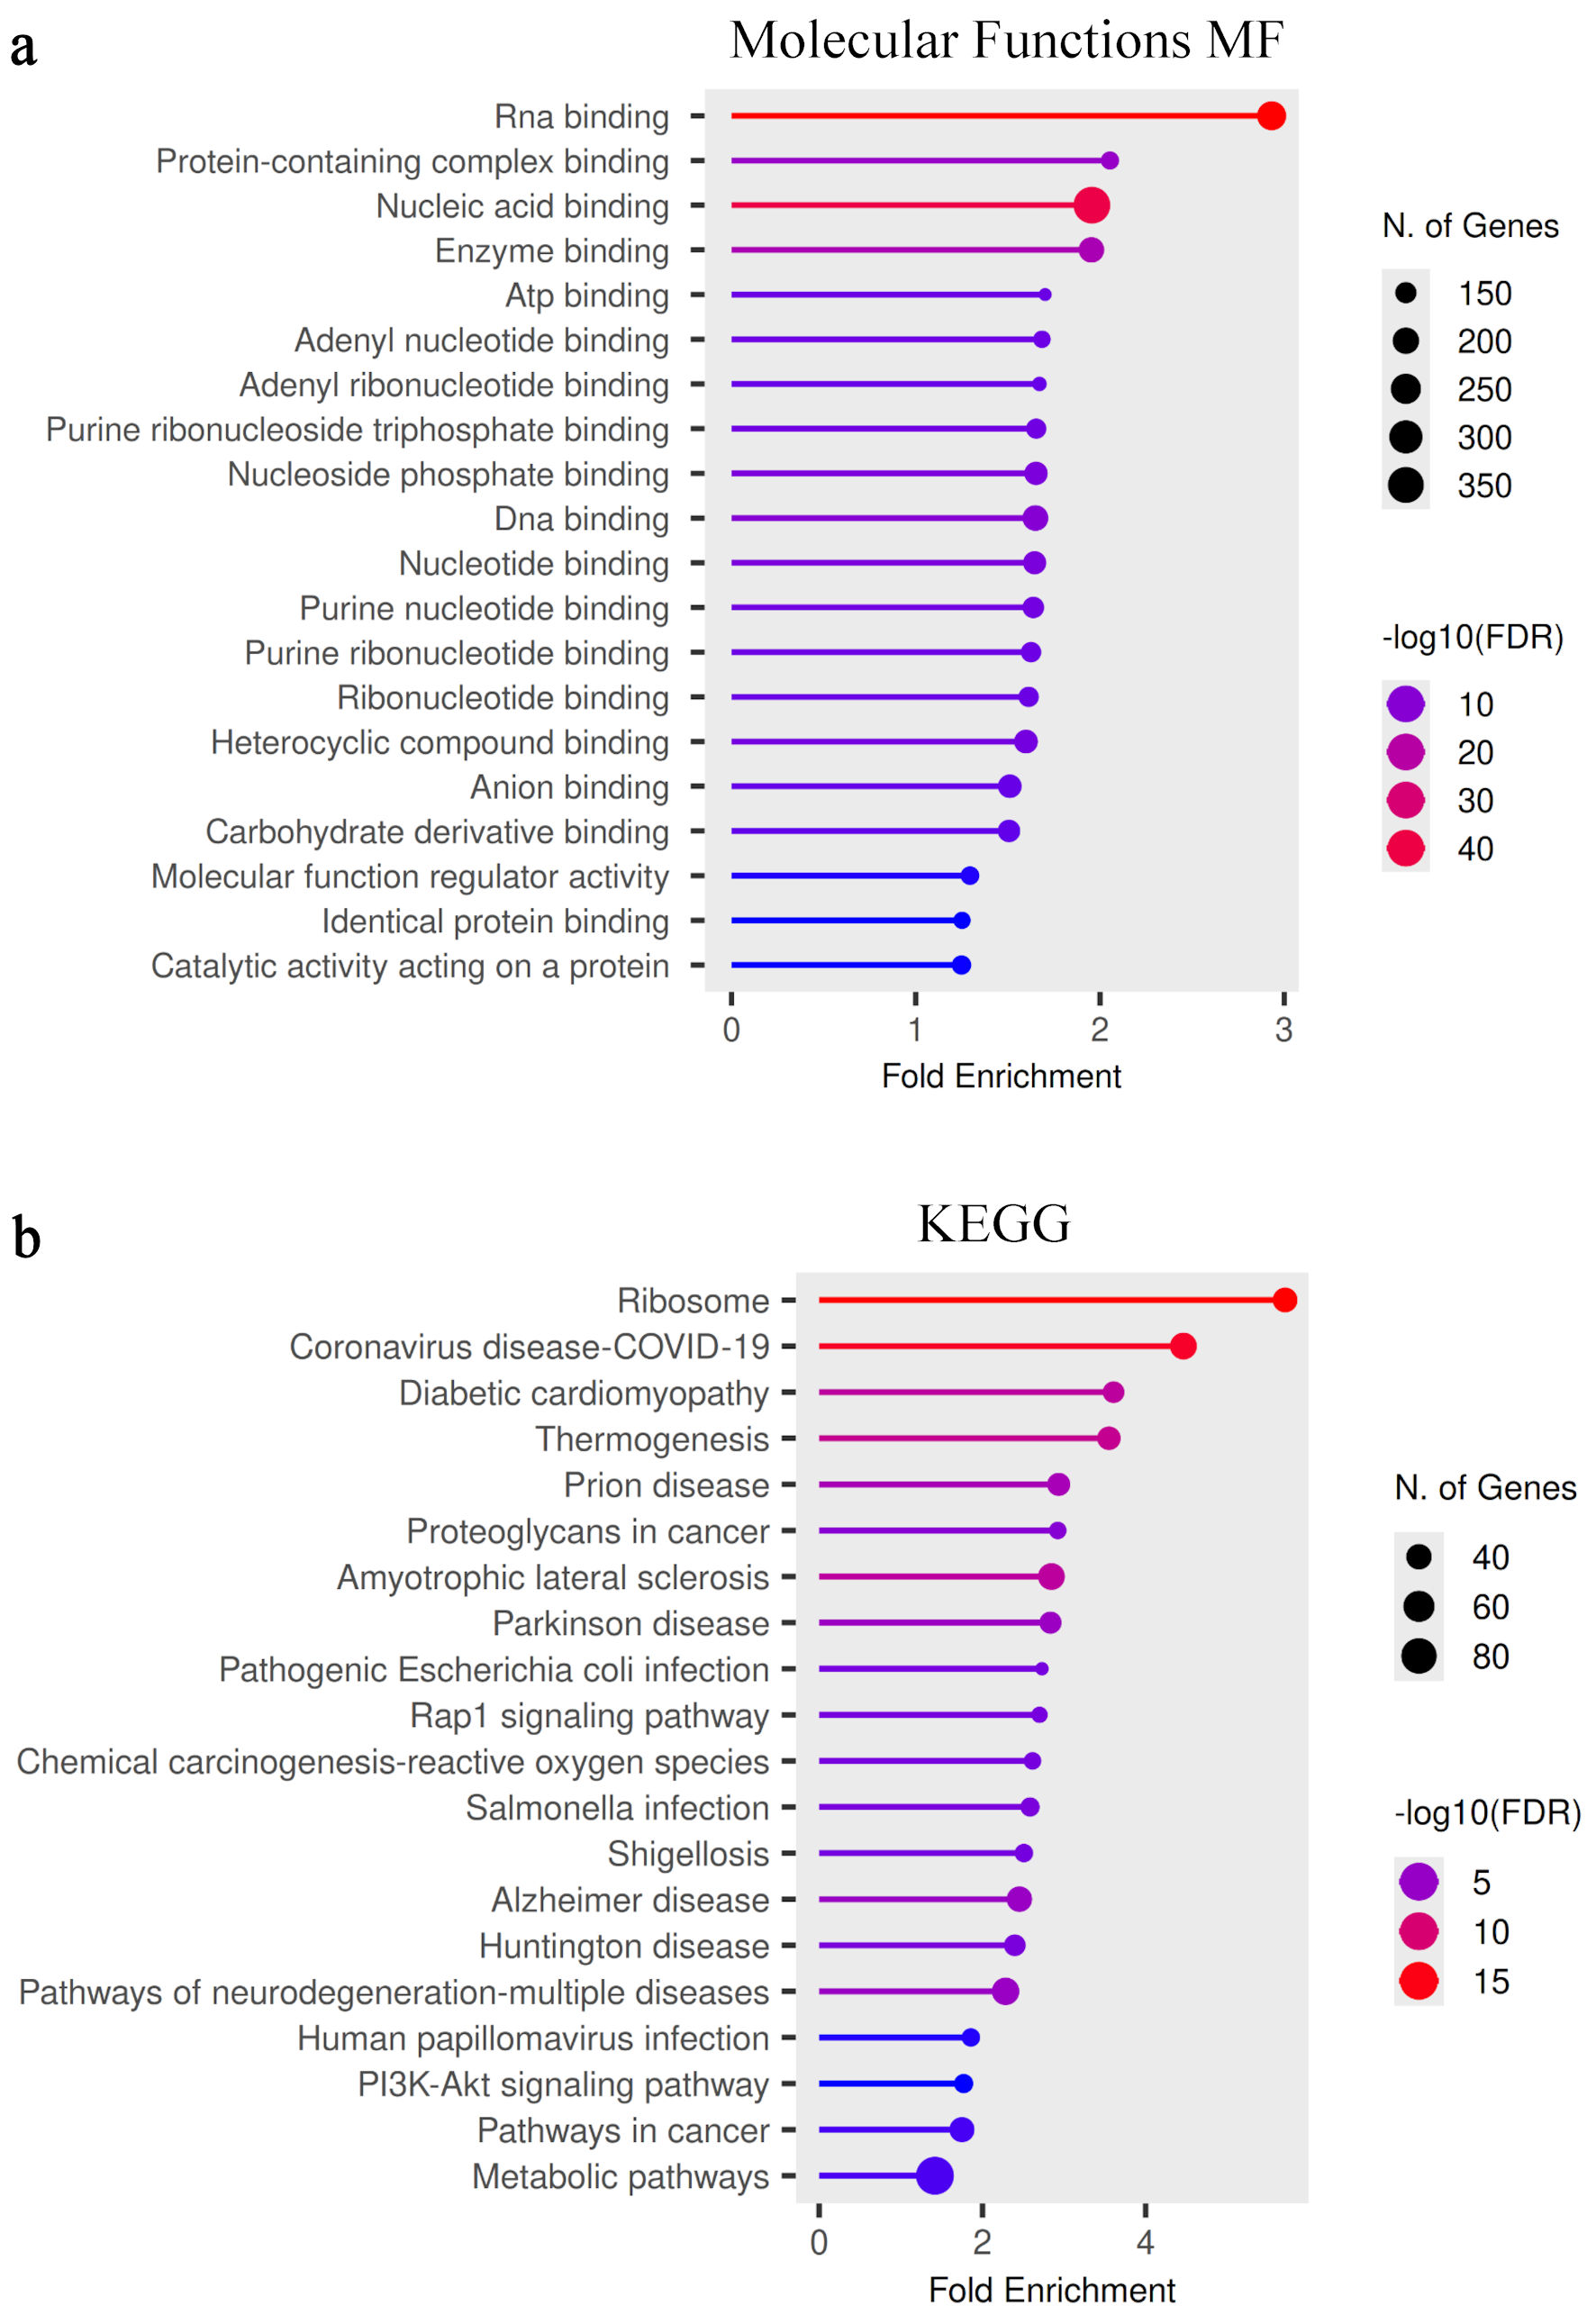 Click for large image | Figure 3. Functional enrichment analysis of molecular functions and signaling pathways. (a) Gene Ontology (GO) molecular function enrichment analysis of DEGs between PNT2 and 22Rv1 cells. Significantly enriched functions include nucleic acid binding, RNA binding, enzyme binding, and catalytic activity acting on proteins. These enrichments indicate increased activity of regulatory complexes and transcriptional control mechanisms in the castration-resistant phenotype. (b) KEGG pathway enrichment analysis identifying signaling pathways associated with the observed transcriptional changes. Significantly enriched pathways include ribosome-associated pathways, metabolic pathways, and PI3K–Akt signaling. Bubble size indicates the number of genes associated with each pathway, and color intensity represents statistical significance (−log10(FDR)). FDR: false discovery rate; DEGs: differentially expressed genes; MF: molecular function; KEGG: Kyoto Encyclopedia of Genes and Genomes. |
GO molecular function analysis (Fig. 3a) demonstrated significant enrichment in RNA binding, protein-containing complex binding, nucleic acid binding, enzyme binding, and catalytic activity acting on proteins. A comprehensive list of enriched molecular functions is summarized in Table 4. Enrichment of nucleotide and ribonucleotide binding functions further indicates extensive modulation of transcriptional regulation and post-transcriptional processing in the castration-resistant model. These findings suggest increased activity of macromolecular interaction networks and regulatory complexes that may contribute to altered gene expression control in 22Rv1 cells.
Click to view | Table 4. Gene Ontology (GO) Molecular Function Enrichment Analysis of Differentially Expressed Genes Between PNT2 and 22Rv1 Cells |
KEGG pathway analysis (Fig. 3b) revealed significant enrichment in ribosome-associated pathways, metabolic pathways, and PI3K–Akt signaling. The full list of enriched pathways is provided in Table 5. Ribosome-associated pathways were among the most significantly enriched pathways identified in the analysis, while enrichment of metabolic and cancer-related pathways reflects reprogramming of cellular metabolism and survival signaling mechanisms. Additional enrichment in stress-related and infection-associated pathways likely reflects broader activation of adaptive cellular responses. Collectively, these data indicate coordinated alterations in protein synthesis, signaling cascades, and metabolic regulation in 22Rv1 cells compared with PNT2.
Click to view | Table 5. KEGG Pathway Enrichment Analysis of Differentially Expressed Genes Between PNT2 and 22Rv1 Cells |
Gene co-expression network analysis in PNT2 and 22Rv1 cells
Figure 4 illustrates the gene co-expression network constructed from significantly DEGs identified between PNT2 and 22Rv1 cells. The network was generated based on significant pairwise expression correlations among the identified DEGs. The resulting architecture exhibits a densely interconnected structure, indicating coordinated expression patterns among genes deregulated in the castration-resistant 22Rv1 model relative to non-malignant PNT2 cells.
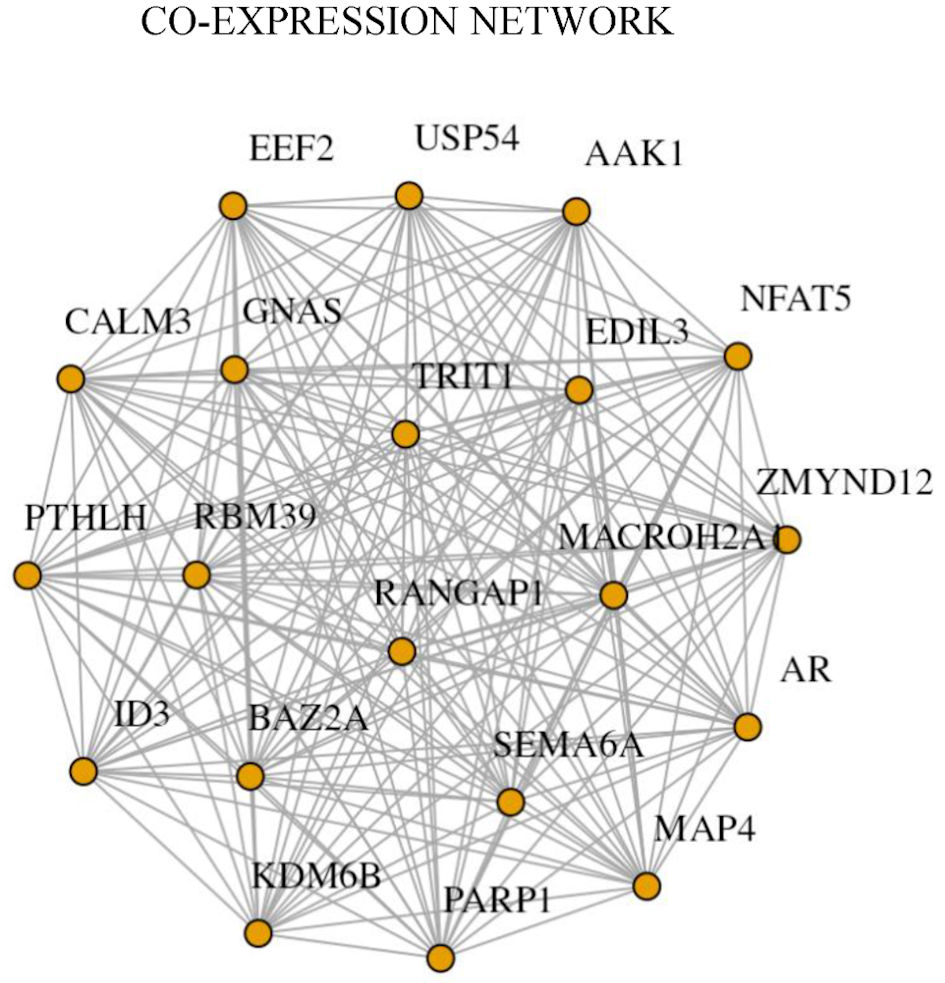 Click for large image | Figure 4. Gene co-expression network analysis of differentially expressed genes. The co-expression network was constructed from significantly differentially expressed genes identified in the transcriptomic comparison between PNT2 and 22Rv1 cells. Each node represents an individual gene, and edges represent significant correlation-based co-expression relationships. The network reveals a central regulatory module composed of AR, PARP1, KDM6B, BAZ2A, RANGAP1, NFAT5, and MAP4, which display multiple interaction links and high connectivity. The presence of this densely interconnected module highlights coordinated transcriptional regulation associated with the castration-resistant phenotype. |
Within this network, a prominent core module comprising AR, PARP1, KDM6B, BAZ2A, RANGAP1, NFAT5, and MAP4 emerged as highly connected nodes. These genes demonstrated multiple interaction links, suggesting coordinated transcriptional behavior in 22Rv1 cells. In contrast, such tightly interconnected relationships were less evident in the non-malignant context.
The AR occupied a central position within the network and displayed strong co-expression associations with several neighboring genes, including PARP1, which also exhibited a high degree of connectivity. Epigenetic regulators KDM6B and BAZ2A were closely linked to central nodes, while RANGAP1, NFAT5, and MAP4 further contributed to the overall network structure. These genes formed a highly interconnected module within the co-expression network of DEGs.
Collectively, the co-expression network analysis reveals a structured transcriptional module that distinguishes 22Rv1 cells from PNT2 cells at the network level, complementing the differential expression and enrichment findings presented in previous figures.
Clinical validation of selected candidate genes in prostate adenocarcinoma cohorts
Figure 5 presents the clinical validation of selected DEGs using patient-derived prostate adenocarcinoma datasets from TCGA. Comparative analysis between tumor and normal prostate tissues demonstrated consistent alterations in gene expression patterns. FASN, PARP1, ENSG00000214719, and SET exhibited significantly higher expression levels in prostate adenocarcinoma samples relative to normal prostate tissues (Fig. 5a–d). In contrast, MALAT1 and IGF1 displayed reduced expression in tumor tissues compared with normal controls (Fig. 5e, f). These expression trends were consistent across the analyzed cohort and reached statistical significance. These findings support the potential clinical relevance of the identified genes as biomarkers in PCa.
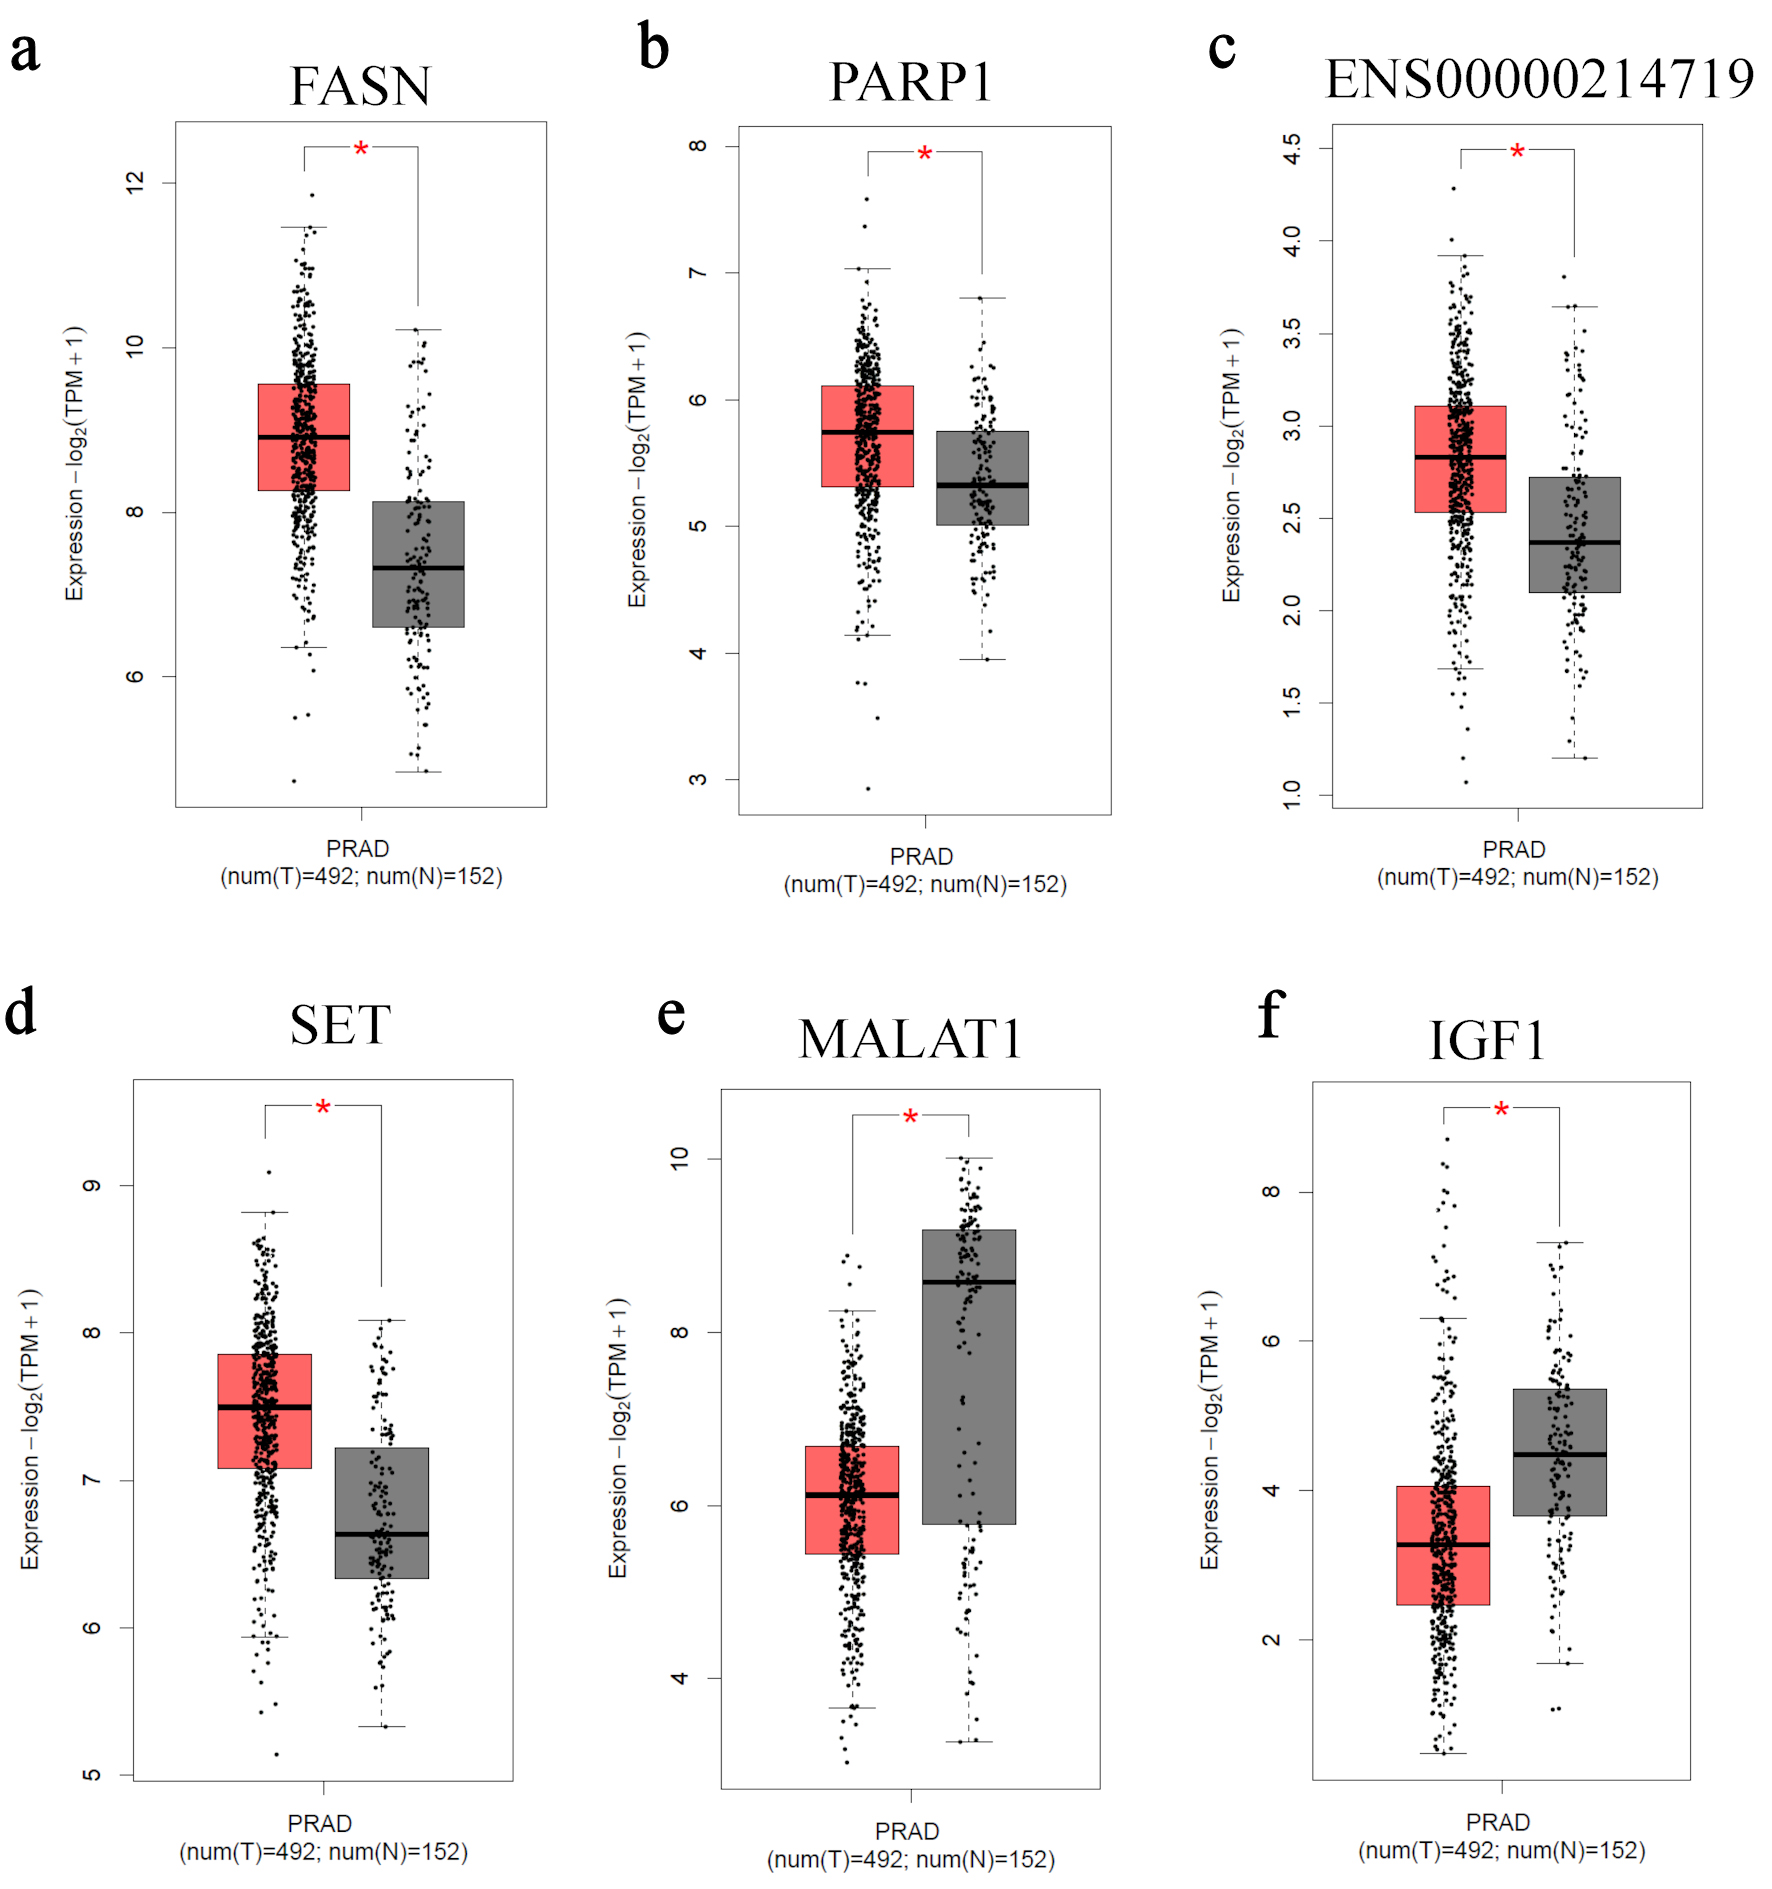 Click for large image | Figure 5. Clinical validation of candidate genes in prostate adenocarcinoma datasets. Boxplots showing the expression levels of (a) FASN, (b) PARP1, (c) ENSG00000214719, (d) SET, (e) MALAT1, and (f) IGF1 in prostate adenocarcinoma (PRAD) tumors (n = 492) and normal prostate tissues (n = 152) obtained from The Cancer Genome Atlas (TCGA) and Genotype-Tissue Expression (GTEx) datasets via the Gene Expression Profiling Interactive Analysis 2 (GEPIA2) platform. Expression values are presented as log2(TPM + 1). The central line represents the median, the box indicates the interquartile range, and whiskers represent the data distribution. TPM: transcripts per million. |
| Discussion | ▴Top |
Metabolic reprogramming and translational adaptation in CRPC
Functional enrichment analyses revealed significant overrepresentation of metabolic processes and ribosome-associated pathways in 22Rv1 cells (Figs. 2, 3). The enrichment of ribosomal and RNA-binding molecular functions suggests enhanced translational capacity in the castration-resistant state [17]. Increased ribosome biogenesis and protein synthesis are well-recognized features of aggressive tumors [18], enabling rapid cellular proliferation and adaptation to therapeutic stress. In this context, activation of translational machinery may facilitate the production of proteins required for survival under androgen-deprived conditions [19]. Metabolic rewiring was further supported by the upregulation of fatty acid synthase (FASN), which was consistently elevated in 22Rv1 cells and was validated in clinical prostate adenocarcinoma samples (Fig. 5). FASN is a key enzyme responsible for de novo fatty acid synthesis and has been strongly associated with PCa progression [20]. Enhanced lipogenesis supports membrane biosynthesis and stabilizes signaling complexes that contribute to tumor growth and metabolic adaptation [21, 22]. The observed enrichment of PI3K–Akt signaling pathways further supports this model of metabolic–signaling integration [23]. PI3K–Akt activation has been widely implicated in resistance to ADT and often acts as a compensatory survival pathway when AR signaling is therapeutically suppressed [24, 25].
Epigenetic regulation and chromatin remodeling in CRPC
Beyond metabolic and signaling adaptation, our network analysis revealed prominent involvement of chromatin-associated regulators within the transcriptional architecture of 22Rv1 cells. In the co-expression network (Fig. 4), KDM6B and BAZ2A emerged as highly connected nodes integrated within the AR-centered module, suggesting coordinated regulation of chromatin dynamics in the castration-resistant state [26, 27].
KDM6B (also known as JMJD3) is a histone demethylase that removes repressive H3K27me3 marks, thereby facilitating transcriptional activation. In PCa, epigenetic remodeling is increasingly recognized as a driver of lineage plasticity and therapeutic resistance. The integration of KDM6B within the core network identified in our study suggests that histone modification–mediated transcriptional reprogramming may contribute to the maintenance of AR-independent or AR-variant–driven gene expression programs in 22Rv1 cells. Similarly, BAZ2A is a chromatin remodeling factor implicated in transcriptional regulation and nucleolar organization [27]. Recent studies have associated BAZ2A with aggressive PCa phenotypes and epigenetic silencing of tumor suppressor pathways. Its strong co-expression with AR and other central nodes in our network supports the concept that chromatin accessibility and transcriptional plasticity are tightly coordinated with AR-associated signaling in CRPC [28].The enrichment of nucleic acid binding and RNA-related molecular functions observed in our GO analysis (Fig. 3a) further reinforces the role of epigenetic and transcriptional regulators in shaping the castration-resistant transcriptome. Together, these findings suggest that chromatin remodeling contributes to transcriptional plasticity that supports castration-resistant tumor adaptation [29].
DNA damage response (DDR) adaptation and PARP1–AR crosstalk in CRPC
Our analysis identified PARP1 as a prominently upregulated gene in 22Rv1 cells (Fig. 1) and as a highly connected node within the co-expression network (Fig. 4). Clinical validation further confirmed elevated PARP1 expression in prostate adenocarcinoma samples relative to normal tissue (Fig. 5). These findings suggest that DDR adaptation is a central feature of the castration-resistant transcriptional program [30].
PARP1 plays a critical role in base excision repair and replication fork stabilization, enabling tumor cells to survive genotoxic stress [31]. In addition to its canonical DNA repair function, PARP1 has been shown to regulate AR transcriptional activity [32]. Prior studies have demonstrated that PARP1 interacts with AR and enhances AR-dependent gene expression, thereby linking DNA repair mechanisms to hormone-driven transcriptional regulation [33]. In AR-variant–expressing CRPC models such as 22Rv1, this functional coupling may allow tumor cells to sustain transcriptional output despite androgen deprivation [34]. PARP1 therefore appears to function at the intersection of DNA repair and AR–associated transcriptional regulation in CRPC [30].
Adaptive activation of the DDR has been associated with resistance to both AR pathway inhibitors and PARP inhibitors [35]. Restoration of homologous recombination, replication fork protection, and reduced PARP1 trapping are recognized mechanisms of therapeutic escape in advanced PCa. The elevated expression and central network positioning of PARP1 in our dataset suggest that DDR reinforcement may represent a compensatory mechanism contributing to the resilience of 22Rv1 cells [35].
Growth factor–mediated bypass signaling and adaptive pathway compensation
Although IGF1 expression was reduced in tumor tissues relative to normal prostate samples in the TCGA cohort (Fig. 5), the broader signaling context suggests a more complex role for IGF-mediated pathways in CRPC progression [36].
The enrichment of PI3K–Akt signaling pathways observed in our KEGG analysis (Fig. 3b) indicates activation of survival signaling networks in 22Rv1 cells. The insulin-like growth factor 1 receptor (IGF-1R) is a well-established upstream activator of PI3K–Akt and MAPK pathways, both of which contribute to proliferation, metabolic adaptation, and resistance to apoptosis [37]. Crosstalk between AR and IGF-1R signaling has been reported in PCa, where growth factor activation can partially compensate for reduced androgen signaling and sustain downstream oncogenic programs [38].
In castration-resistant models, bypass signaling through receptor tyrosine kinases and downstream kinase cascades may serve as an alternative mechanism to maintain survival when AR signaling is pharmacologically suppressed [39]. The coordinated enrichment of PI3K–Akt pathways, combined with metabolic rewiring and SET-mediated phosphatase inhibition discussed earlier, suggests that kinase-driven signaling reinforcement is a recurring feature of the CRPC transcriptomic landscape [40].The observed reduction in IGF1 transcript levels may reflect feedback regulation or altered ligand–receptor dynamics in advanced disease, rather than diminished pathway activity. In many hormone-driven cancers, receptor activation and downstream signaling intensity do not necessarily correlate directly with ligand transcript abundance, particularly in the context of tumor microenvironment-derived growth factors [41].
Novel identification of ENSG00000214719 across distinct CRPC phenotypes
Among the DEGs identified in this study, ENSG00000214719 emerged as a consistently upregulated transcript in 22Rv1 cells and in prostate adenocarcinoma patient samples (Figs. 1, 5). Notably, in a separate ongoing investigation within our group, this long noncoding RNA (lncRNA) was also found to be highly expressed in DU145 cells, a CRPC model characterized by AR–negative status and glucocorticoid receptor–mediated signaling. The detection of ENSG00000214719 in both AR-positive (22Rv1) and AR-negative (DU145) castration-resistant models suggests that its expression may not be restricted to a single AR-dependent pathway. Instead, this lncRNA may represent a broader regulatory element associated with advanced, therapy-resistant PCa phenotypes. The presence of ENSG00000214719 across mechanistically distinct CRPC subtypes raises the possibility that it functions downstream of convergent resistance pathways or contributes to shared adaptive transcriptional programs. LncRNAs are increasingly recognized as regulators of chromatin remodeling, transcriptional control, and signaling pathway modulation [42, 43]. Given its recurrent upregulation in both AR-variant–expressing and AR-independent contexts, ENSG00000214719 may represent a previously underappreciated mediator of transcriptional plasticity in CRPC [34]. Its integration within the differential expression landscape identified in this study warrants further functional investigation to determine its role in drug resistance, lineage plasticity, or survival signaling. The consistent expression of ENSG00000214719 across distinct CRPC models represents a potentially novel observation, suggesting that this lncRNA may contribute to transcriptional plasticity associated with therapy-resistant PCa. The convergence of metabolic reprogramming, DDR activation, and chromatin remodeling highlights potential combinatorial therapeutic vulnerabilities beyond single-pathway targeting strategies.
Integrated mechanistic signaling adaptation and therapeutic vulnerabilities in CRPC
The integrated transcriptomic, enrichment, co-expression, and clinical validation analyses collectively support a coordinated adaptive circuitry driving CRPC progression in 22Rv1 cells. Our results suggest that metabolic rewiring, kinase signaling activation, DDR adaptation, and AR-centered transcriptional regulation converge within an interconnected regulatory network driving CRPC progression (Figs. 2, 4). The consistent upregulation of FASN in both the experimental model and patient-derived tumors (Figs. 1, 5) implicates enhanced de novo lipogenesis as a structural and bioenergetic foundation of the resistant phenotype [44]. Increased fatty acid synthesis may stabilize membrane microdomains, facilitate receptor clustering, and potentiate downstream PI3K–Akt and MAPK signaling pathways, both enriched in our KEGG analysis (Fig. 3) [44]. In parallel, enrichment of ribosomal and mitochondrial-associated components (Figs. 2, 3) suggests heightened translational demand and metabolic flexibility, potentially supported by lipid-derived substrates fueling oxidative phosphorylation and adenosine triphosphate (ATP) generation [45]. Concurrently, elevated PARP1 expression and its central positioning within the co-expression network (Fig. 4), together with tumor-associated upregulation (Fig. 5), indicate reinforcement of DNA repair capacity integrated with transcriptional regulation [46]. PARP1 is known to modulate AR-driven gene expression, and in AR-variant–expressing systems such as 22Rv1, it may enhance ligand-independent transcriptional programs, thereby contributing to resistance against AR pathway inhibitors [47]. The enrichment of kinase signaling pathways despite reduced IGF1 transcript levels (Figs. 3, 5) further suggests network-level compensation mechanisms, potentially amplified by SET-mediated inhibition of PP2A and sustained downstream phosphorylation cascades [48]. Collectively, these findings support a coordinated regulatory network in which metabolic remodeling, kinase signaling activation, DDR adaptation, and epigenetic plasticity cooperate to sustain CRPC progression (Fig. 4) [34, 49]. This integrated circuitry provides a mechanistic explanation for persistent tumor growth under androgen deprivation. Importantly, the convergence of these adaptive axes highlights potential therapeutic vulnerabilities. Targeting lipogenic activation may disrupt signaling reinforcement at the membrane level, while inhibition of PARP1 could impair both DNA repair capacity and AR-associated transcriptional persistence. Modulation of chromatin remodeling enzymes may reduce transcriptional flexibility, and restoration of PP2A activity could attenuate hyperactive kinase signaling. The concordance between in vitro transcriptomic signatures and patient tumor expression profiles (Fig. 5) underscores the translational relevance of this network-based framework and supports the rationale for combination therapeutic strategies designed to disrupt multiple adaptive nodes simultaneously rather than targeting a single pathway in isolation.
Study limitations
This study is based on in vitro transcriptomic profiling of established PCa cell lines with computational validation using publicly available clinical datasets. While 22Rv1 cells represent a well-characterized AR-variant–expressing CRPC model, they do not encompass the full molecular heterogeneity of advanced PCa. In addition, co-expression network analysis identifies coordinated transcriptional relationships but does not establish direct mechanistic causality. Functional validation in patient-derived models and in vivo systems will be required to confirm the regulatory roles of the identified candidate genes and to determine their contribution to therapeutic resistance.
Conclusions
In conclusion, this study identifies key DEGs and transcriptomic alterations associated with CRPC. The integration of RNA sequencing and clinical validation data highlights several potential biomarkers, including FASN, PARP1, SET, and MALAT1, which may contribute to disease progression. These findings provide a basis for future functional studies and may support the development of diagnostic and therapeutic strategies in advanced PCa.
Acknowledgments
None to declare.
Financial Disclosure
No funding was received for this study.
Conflict of Interest
The authors declare that they have no conflict of interest.
Informed Consent
This study does not involve human participants or identifiable data; therefore, informed consent was not required.
Author Contributions
AAN conceived and designed the study, performed data analysis, and drafted the manuscript. SA and AH contributed to data interpretation and manuscript revision. All authors contributed to data analysis, critically reviewed the manuscript, approved the final version, and agreed to be accountable for all aspects of the work.
Data Availability
The datasets generated and/or analyzed during the current study are available from the corresponding author upon reasonable request.
Use of Artificial Intelligence Tools
Artificial intelligence tools were used solely for language refinement. All scientific content, interpretation, and conclusions were developed and verified by the authors.
Abbreviations
CRPC: castration-resistant prostate cancer; AR: androgen receptor; DEGs: differentially expressed genes; GO: Gene Ontology; KEGG: Kyoto Encyclopedia of Genes and Genomes; TCGA: The Cancer Genome Atlas; GTEx: Genotype-Tissue Expression; FDR: false discovery rate
| References | ▴Top |
- Schafer EJ, Laversanne M, Sung H, Soerjomataram I, Briganti A, Dahut W, Bray F, et al. Recent Patterns and Trends in Global Prostate Cancer Incidence and Mortality: An Update. Eur Urol. 2025;87(3):302-313.
doi pubmed - MU S, MM A, TM A, SM A, IM A, RH A, et al. Bridging knowledge gaps in prostate cancer screening among Northern Saudi males: implications for improving screening adherence and early detection. SHILAP Rev Lepidopterol. 2025.
- Safiri S, Shamekh A, Hassanzadeh K, Fazlollahi A, Sullman MJM, Raeisi M, Kolahi AA. The burden of prostate cancer in the North Africa and Middle East Region from 1990 to 2021. Sci Rep. 2025;15(1):1853.
doi pubmed - Hlousek S, Argalacsova S, Soukupova J, Zalesky M, Jurok M, Vocka M. Genetic and Non-Genetic Risk Factors in Prostate Cancer: Towards a Precision Medicine Approach. Folia Biol (Praha). 2025;71(3):95-108.
doi pubmed - Li C, Cheng D, Li P. Androgen receptor dynamics in prostate cancer: from disease progression to treatment resistance. Front Oncol. 2025;15:1542811.
doi pubmed - Quistini A, Chierigo F, Fallara G, Depalma M, Tozzi M, Maggi M, Jannello LMI, et al. Androgen Receptor Signalling in Prostate Cancer: Mechanisms of Resistance to Endocrine Therapies. Res Rep Urol. 2025;17:211-223.
doi pubmed - Bernard-Tessier A, Naoun N, Barraud S, Flippot R, Pobel C, Rey M, Baldini C, et al. The future of androgen receptor targeting in prostate cancer: third-generation inhibitors and beyond. Ther Adv Med Oncol. 2025;17:17588359251379416.
doi pubmed - Reiss AB, Gulkarov S, Pinkhasov A, Sheehan KM, Srivastava A, De Leon J, Katz AE. Androgen deprivation therapy for prostate cancer: focus on cognitive function and mood. Medicina (Kaunas). 2023;60(1):77.
doi pubmed - Wang Z, Xiao H, Zheng C, Chen J, Chen Q, Chen Z, Zhang D, et al. Rapid and sustainable deep testosterone reduction predicts effective androgen deprivation therapy for metastatic hormone-sensitive prostate cancer. Sci Rep. 2025;15(1):28497.
doi pubmed - Chandrasekar T, Yang JC, Gao AC, Evans CP. Mechanisms of resistance in castration-resistant prostate cancer (CRPC). Transl Androl Urol. 2015;4(3):365-380.
doi pubmed - Naeem AA, Abdulsamad SA. Molecular Mechanisms of Castration-Resistant Prostate Cancer Progression. Cureus. 2025;17(5):e83813.
doi pubmed - Zhang J, He G, Jin X, Alenezi BT, Naeem AA, Abdulsamad SA, Ke Y. Molecular mechanisms on how FABP5 inhibitors promote apoptosis-induction sensitivity of prostate cancer cells. Cell Biol Int. 2023;47(5):929-942.
doi pubmed - Abdulsamad SA, Naeem AA, Zeng H, He G, Jin X, Alenezi BA, Ai J, et al. Experimental treatment efficacy of dmrFABP5 on prostate cancer singly or in combination with drugs in use. Am J Cancer Res. 2024;14(1):300-323.
doi pubmed - Naeem AA, Abdulsamad SA, Zeng H, He G, Jin X, Zhang J, Alenezi BT, et al. FABP5 can substitute for androgen receptor in malignant progression of prostate cancer cells. Int J Oncol. 2024;64(2).
doi pubmed - Shi X, Gekas C, Verduzco D, Petiwala S, Jeffries C, Lu C, Murphy E, et al. Building a translational cancer dependency map for The Cancer Genome Atlas. Nat Cancer. 2024;5(8):1176-1194.
doi pubmed - Naeem AA, Abdulsamad SA, Al Bayati A, Zhang J, Malki MI, Ma H, et al. Prostate cell lines. 2022.
- Ye J, Cai S, Feng Y, Li J, Cai Z, Deng Y, Liu R, et al. Metformin escape in prostate cancer by activating the PTGR1 transcriptional program through a novel super-enhancer. Signal Transduct Target Ther. 2023;8(1):303.
doi pubmed - Dai X, Shi X, Luo M, Li P, Gao Y. Integrative analysis of transcriptomic and metabolomic profiles reveals enhanced arginine metabolism in androgen-independent prostate cancer cells. BMC Cancer. 2023;23(1):1241.
doi pubmed - Chatterjee SS, Linares JF, Cid-Diaz T, Duran A, Khan MIK, Osrodek M, Brady NJ, et al. Increased translation driven by non-canonical EZH2 creates a synthetic vulnerability in enzalutamide-resistant prostate cancer. Nat Commun. 2024;15(1):9755.
doi pubmed - Scaglia N, Frontini-Lopez YR, Zadra G. Prostate Cancer Progression: as a Matter of Fats. Front Oncol. 2021;11:719865.
doi pubmed - Dairo O, DePaula Oliveira L, Schaffer E, Vidotto T, Mendes AA, Lu J, Huynh SV, et al. FASN Gene Methylation is Associated with Fatty Acid Synthase Expression and Clinical-genomic Features of Prostate Cancer. Cancer Res Commun. 2024;4(1):152-163.
doi pubmed - Steggall J, Rajeeve V, Al-Subaie N, Naeem A, Ikram A, Naeem A, Hayat A. Integrative proteo-genomic profiling uncovers key biomarkers of lapatinib resistance in HER2-positive breast cancer. Br J Cancer. 2025;133(10):1471-1482.
doi pubmed - Pungsrinont T, Kallenbach J, Baniahmad A. Role of PI3K-AKT-mTOR pathway as a pro-survival signaling and resistance-mediating mechanism to therapy of prostate cancer. Int J Mol Sci. 2021;22(20):11088.
doi pubmed - Natkin R, Pennanen P, Syvala H, Blauer M, Kesseli J, Tammela TLJ, Nykter M, et al. Adaptive and non-adaptive gene expression responses in prostate cancer during androgen deprivation. PLoS One. 2023;18(2):e0281645.
doi pubmed - Chukhu M, Dahiya UR, Heemers HV. Evolving roles for the androgen receptor and its protein interactome in castration-resistant prostate cancer. Oncogene. 2025;44(41):3883-3894.
doi pubmed - Siddappa M, Hussain S, Wani SA, White J, Tang H, Gray JS, Jafari H, et al. African American Prostate Cancer Displays Quantitatively Distinct Vitamin D Receptor Cistrome-transcriptome Relationships Regulated by BAZ1A. Cancer Res Commun. 2023;3(4):621-639.
doi pubmed - Chen X, Augello MA, Liu D, Lin K, Hakansson A, Sjostrom M, Khani F, et al. Canonical androgen response element motifs are tumor suppressive regulatory elements in the prostate. Nat Commun. 2024;15(1):10675.
doi pubmed - Jeon HY, Khadka S, Pornour M, Ryu H, Chen H, Hussain A, Lam HM, et al. BPTF regulates androgen receptor activity by enhancing chromatin accessibility and stabilizing the AR-FOXA1 interaction. Nat Commun. 2025;17(1):670.
doi pubmed - Zhu X, Farsh T, Vis D, Yu I, Li H, Liu T, Sjostrom M, et al. Genomic and transcriptomic features of androgen receptor signaling inhibitor resistance in metastatic castration-resistant prostate cancer. J Clin Invest. 2024;134(19).
doi pubmed - Ganguly S, Lone Z, Muskara A, Imamura J, Hardaway A, Patel M, Berk M, et al. Intratumoral androgen biosynthesis associated with 3beta-hydroxysteroid dehydrogenase 1 promotes resistance to radiotherapy in prostate cancer. J Clin Invest. 2023;133(22).
doi pubmed - Reber JM, Bozic-Petkovic J, Lippmann M, Mazzardo M, Dilger A, Warmers R, Burkle A, et al. PARP1 and XRCC1 exhibit a reciprocal relationship in genotoxic stress response. Cell Biol Toxicol. 2023;39(1):345-364.
doi pubmed - Lu Y, Fu W, Xing W, Wu H, Zhang C, Xu D. Transcriptional regulation mechanism of PARP1 and its application in disease treatment. Epigenetics Chromatin. 2024;17(1):26.
doi pubmed - Luo J, Jin J, Yang F, Sun Z, Zhang W, Shi Y, Xu J, et al. The Correlation Between PARP1 and BRCA1 in AR Positive Triple-negative Breast Cancer. Int J Biol Sci. 2016;12(12):1500-1510.
doi pubmed - Khadka S, Jeon HY, Hussain A, Qi J. Regulation of androgen receptor expression by enhancer elements in prostate cancer. Exp Mol Med. 2026;58(1):94-98.
doi pubmed - Pappas K, Ferrari M, Smith P, Nandakumar S, Khan Z, Young SB, LaClair J, et al. BRCA2 reversion mutation-independent resistance to PARP inhibition through impaired DNA prereplication complex function. Proc Natl Acad Sci U S A. 2025;122(23):e2426743122.
doi pubmed - Nandakumar AM, Barberis A, Kim J, Lang CR, Mills JV, Rieunier G, Doultsinos D, et al. IGF-1 regulates cancer cell immune evasion in prostate cancer. Sci Rep. 2025;15(1):38422.
doi pubmed - Fonseca-Alves CE, Leis-Filho AF, Lacerda ZA, de Faria Lainetti P, Amorim RL, Rogatto SR. Lapatinib antitumor effect is associated with PI3K and MAPK pathway: An analysis in human and canine prostate cancer cells. PLoS One. 2024;19(4):e0297043.
doi pubmed - Adzavon YM, Culig Z, Sun Z. Interactions between androgen and IGF1 axes in prostate tumorigenesis. Nat Rev Urol. 2025;22(5):268-275.
doi pubmed - Feng K, Liu C, Wang W, Kong P, Tao Z, Liu W. Emerging proteins involved in castration-resistant prostate cancer via the AR-dependent and AR-independent pathways (Review). Int J Oncol. 2023;63(5).
doi pubmed - Ma F, Chen S, Cecchi L, Ersoy-Fazlioglu B, Russo JW, Arai S, Awad S, et al. Androgen deprivation-mediated activation of AKT is enhanced in prostate cancer with TMPRSS2:ERG fusion. J Clin Invest. 2025;135(23).
doi pubmed - Ramezani S, Azad FS. Mechanisms of endocrine resistance in hormone receptor-positive breast cancer: an integrated genomic and translational review. Cancer Rev. 2025;1:56.
- Nadhan R, Isidoro C, Song YS, Dhanasekaran DN. Signaling by LncRNAs: Structure, Cellular Homeostasis, and Disease Pathology. Cells. 2022;11(16):2517.
doi pubmed - Arunkumar G. LncRNAs: the good, the bad, and the unknown. Biochem Cell Biol. 2024;102(1):9-27.
doi pubmed - Ward AV, Riley D, Cosper KE, Finlay-Schultz J, Brechbuhl HM, Libby AE, Hill KB, et al. Lipid metabolic reprogramming drives triglyceride storage and variable sensitivity to FASN inhibition in endocrine-resistant breast cancer cells. Breast Cancer Res. 2025;27(1):32.
doi pubmed - Labbe K, LeBon L, King B, Vu N, Stoops EH, Ly N, Lefebvre A, et al. Specific activation of the integrated stress response uncovers regulation of central carbon metabolism and lipid droplet biogenesis. Nat Commun. 2024;15(1):8301.
doi pubmed - Rodriguez-Vargas JM, Diaz-Perez JA, Fernandez V, Zamudio-Martinez E, Sola F, Oliva F, et al. PARP inhibition modulates mitochondrial morphology and metabolism under hypoxic stress in cancer cells. Res Sq. 2025.
doi - Giesen A, Baekelandt L, Devlies W, Devos G, Dumez H, Everaerts W, Claessens F, et al. Double trouble for prostate cancer: synergistic action of AR blockade and PARPi in non-HRR mutated patients. Front Oncol. 2023;13:1265812.
doi pubmed - Li J, Hilimire TA, Liu Y, Wang L, Liang J, Gyorffy B, Sikirzhytski V, et al. Mediator kinase inhibition reverses castration resistance of advanced prostate cancer. J Clin Invest. 2024;134(10).
doi pubmed - Schmidt A, Pfeiffer M, Sdelci S. Hallmarks of nuclear metabolism: implications for genome integrity, nuclear signaling, and therapeutic targeting. NPJ Metab Health Dis. 2026;4(1):6.
doi pubmed
This article is distributed under the terms of the Creative Commons Attribution 4.0 International License (CC BY 4.0), which permits unrestricted use, distribution, and reproduction in any medium, including commercial use, provided the original work is properly cited.
World Journal of Oncology is published by Elmer Press Inc.