Figures
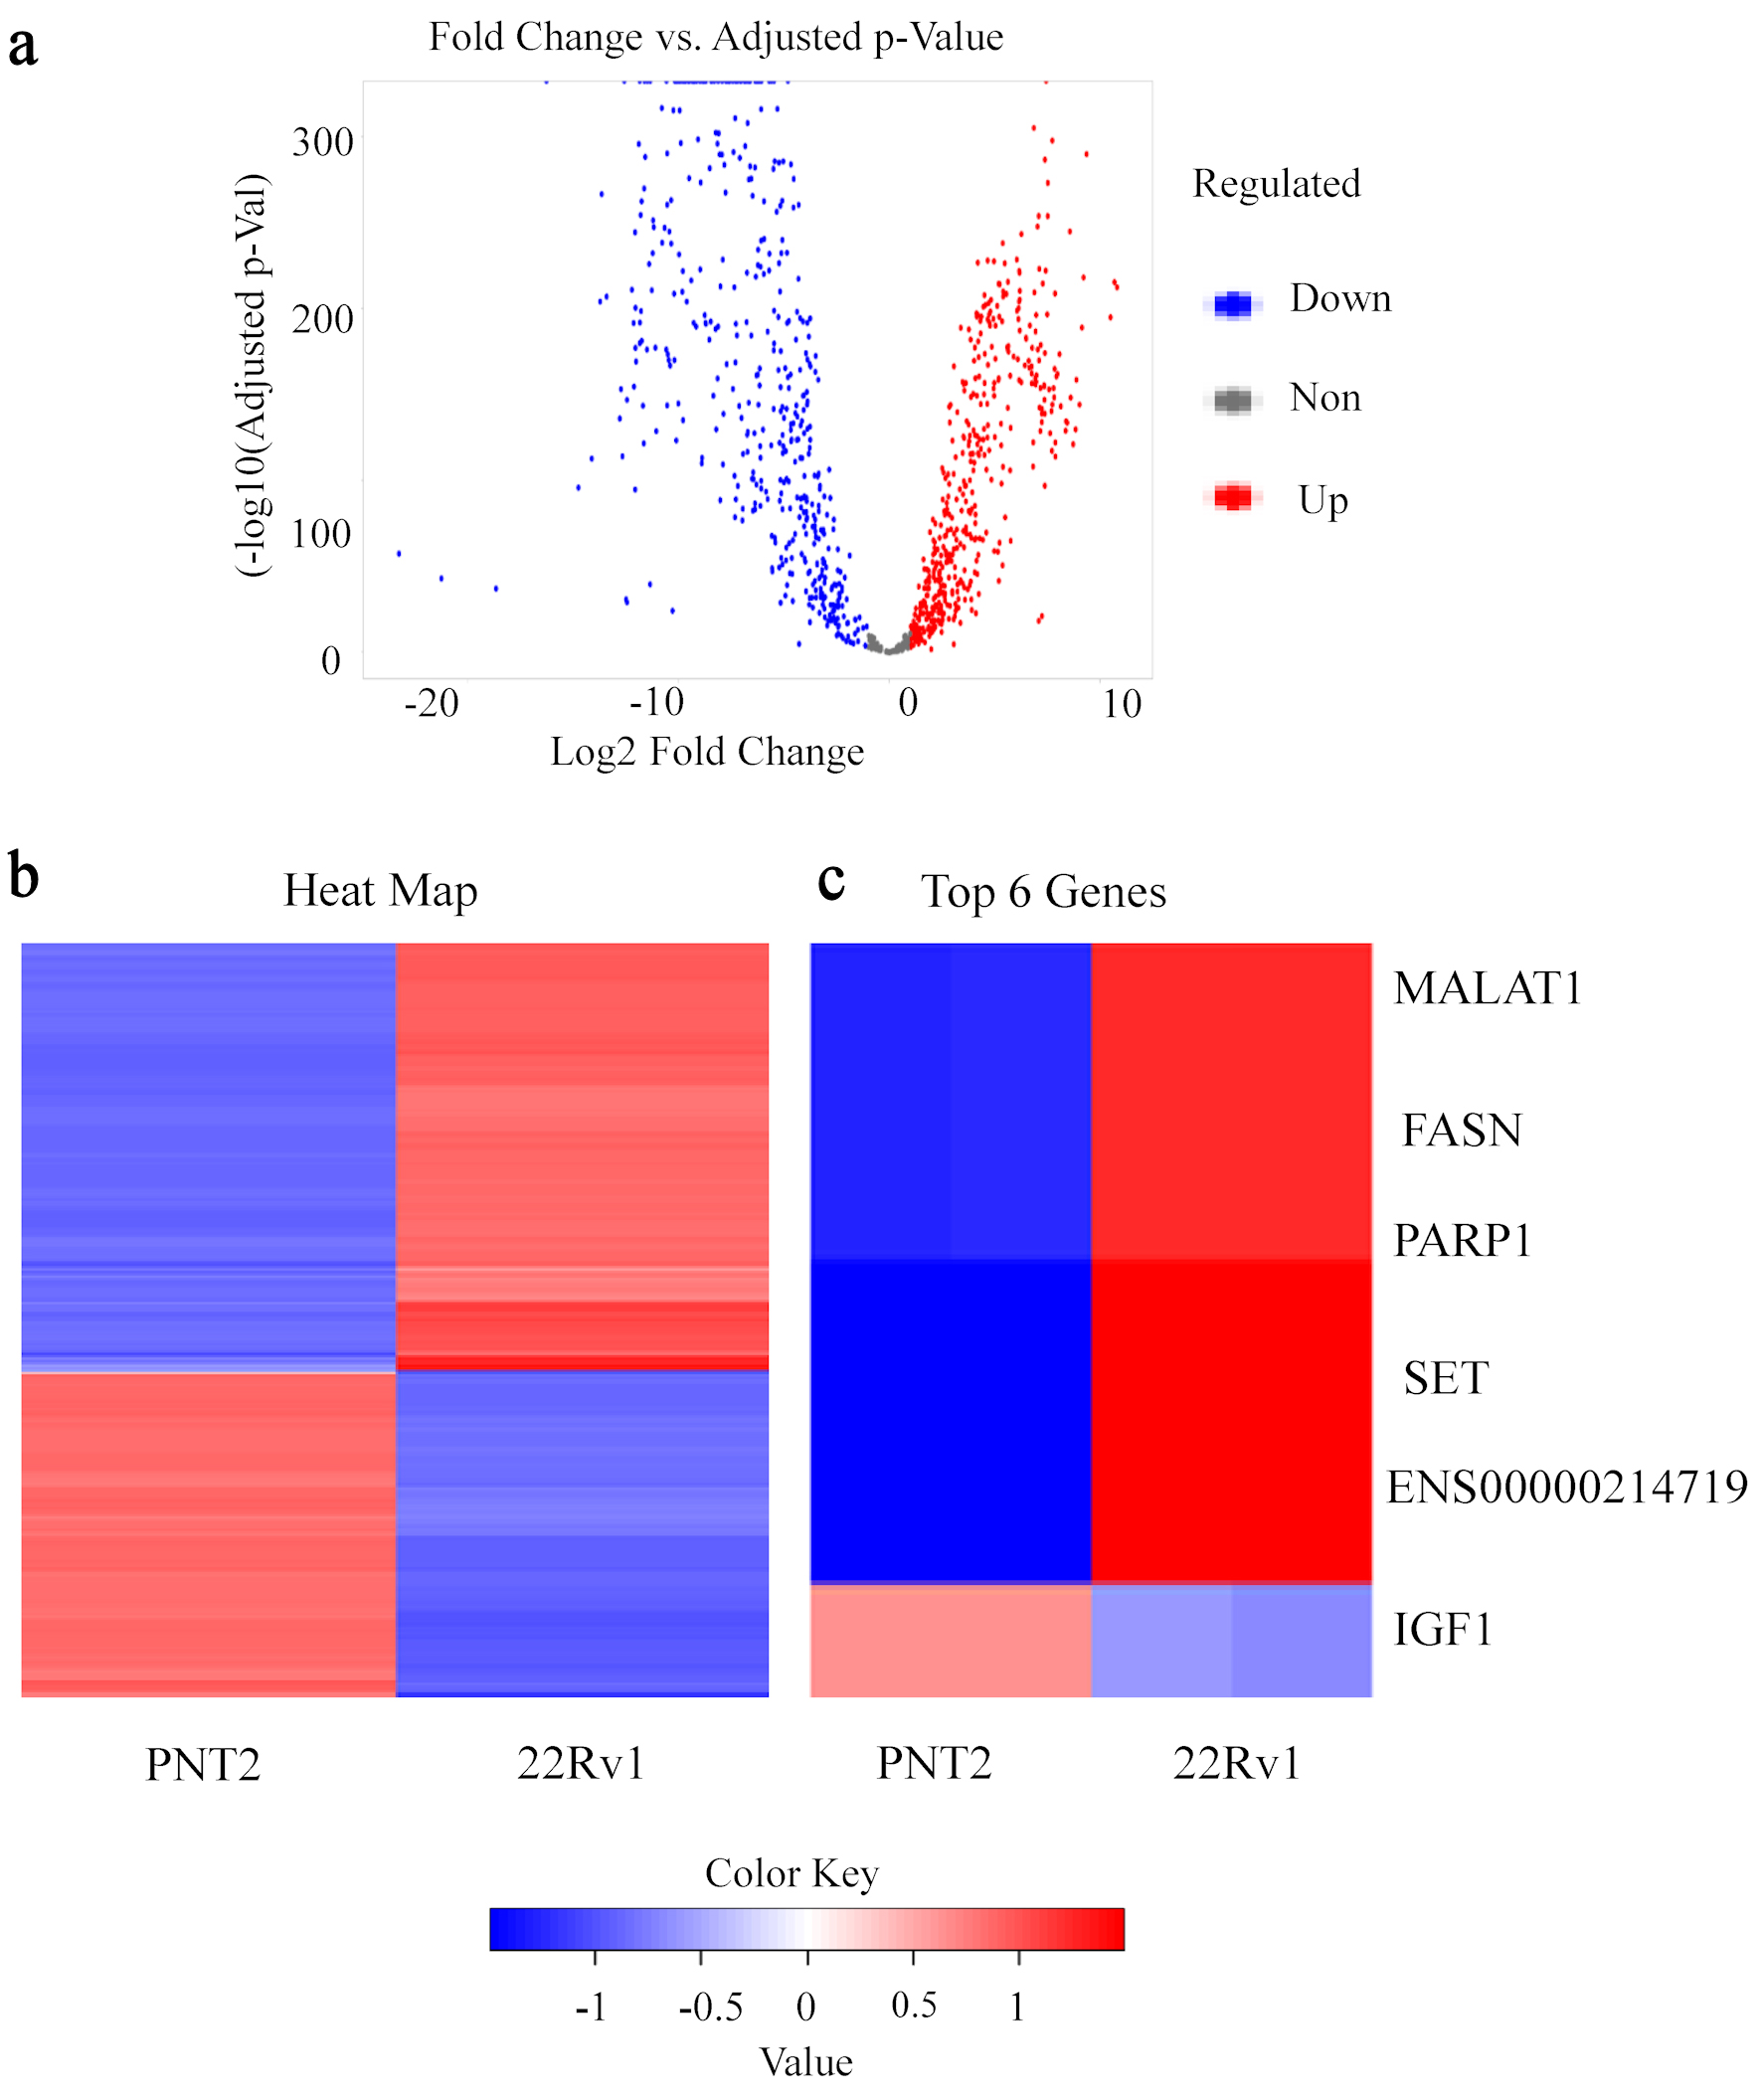
↓ Figure 1. Differential transcriptomic landscape distinguishing PNT2 and 22Rv1 cells. (a) Volcano plot illustrating global differential gene expression between the non-malignant prostate epithelial cell line PNT2 and the castration-resistant prostate cancer cell line 22Rv1. Each point represents an individual gene distributed according to log2 fold change (x-axis) and statistical significance expressed as −log10 (adjusted P value) (y-axis). Genes significantly upregulated in 22Rv1 are highlighted in red, whereas genes downregulated relative to PNT2 are shown in blue. (b) Heatmap of the most significantly DEGs between PNT2 and 22Rv1 cells based on normalized transcript abundance. Hierarchical clustering reveals distinct gene expression patterns separating the non-malignant and castration-resistant cellular states. Red indicates relatively higher expression, whereas blue indicates lower expression. (c) Focused heatmap of representative genes identified among the top DEGs, including MALAT1, FASN, PARP1, SET, ENSG00000214719, and IGF1, illustrating clear transcriptional divergence between the two cellular models. DEGs: differentially expressed genes.
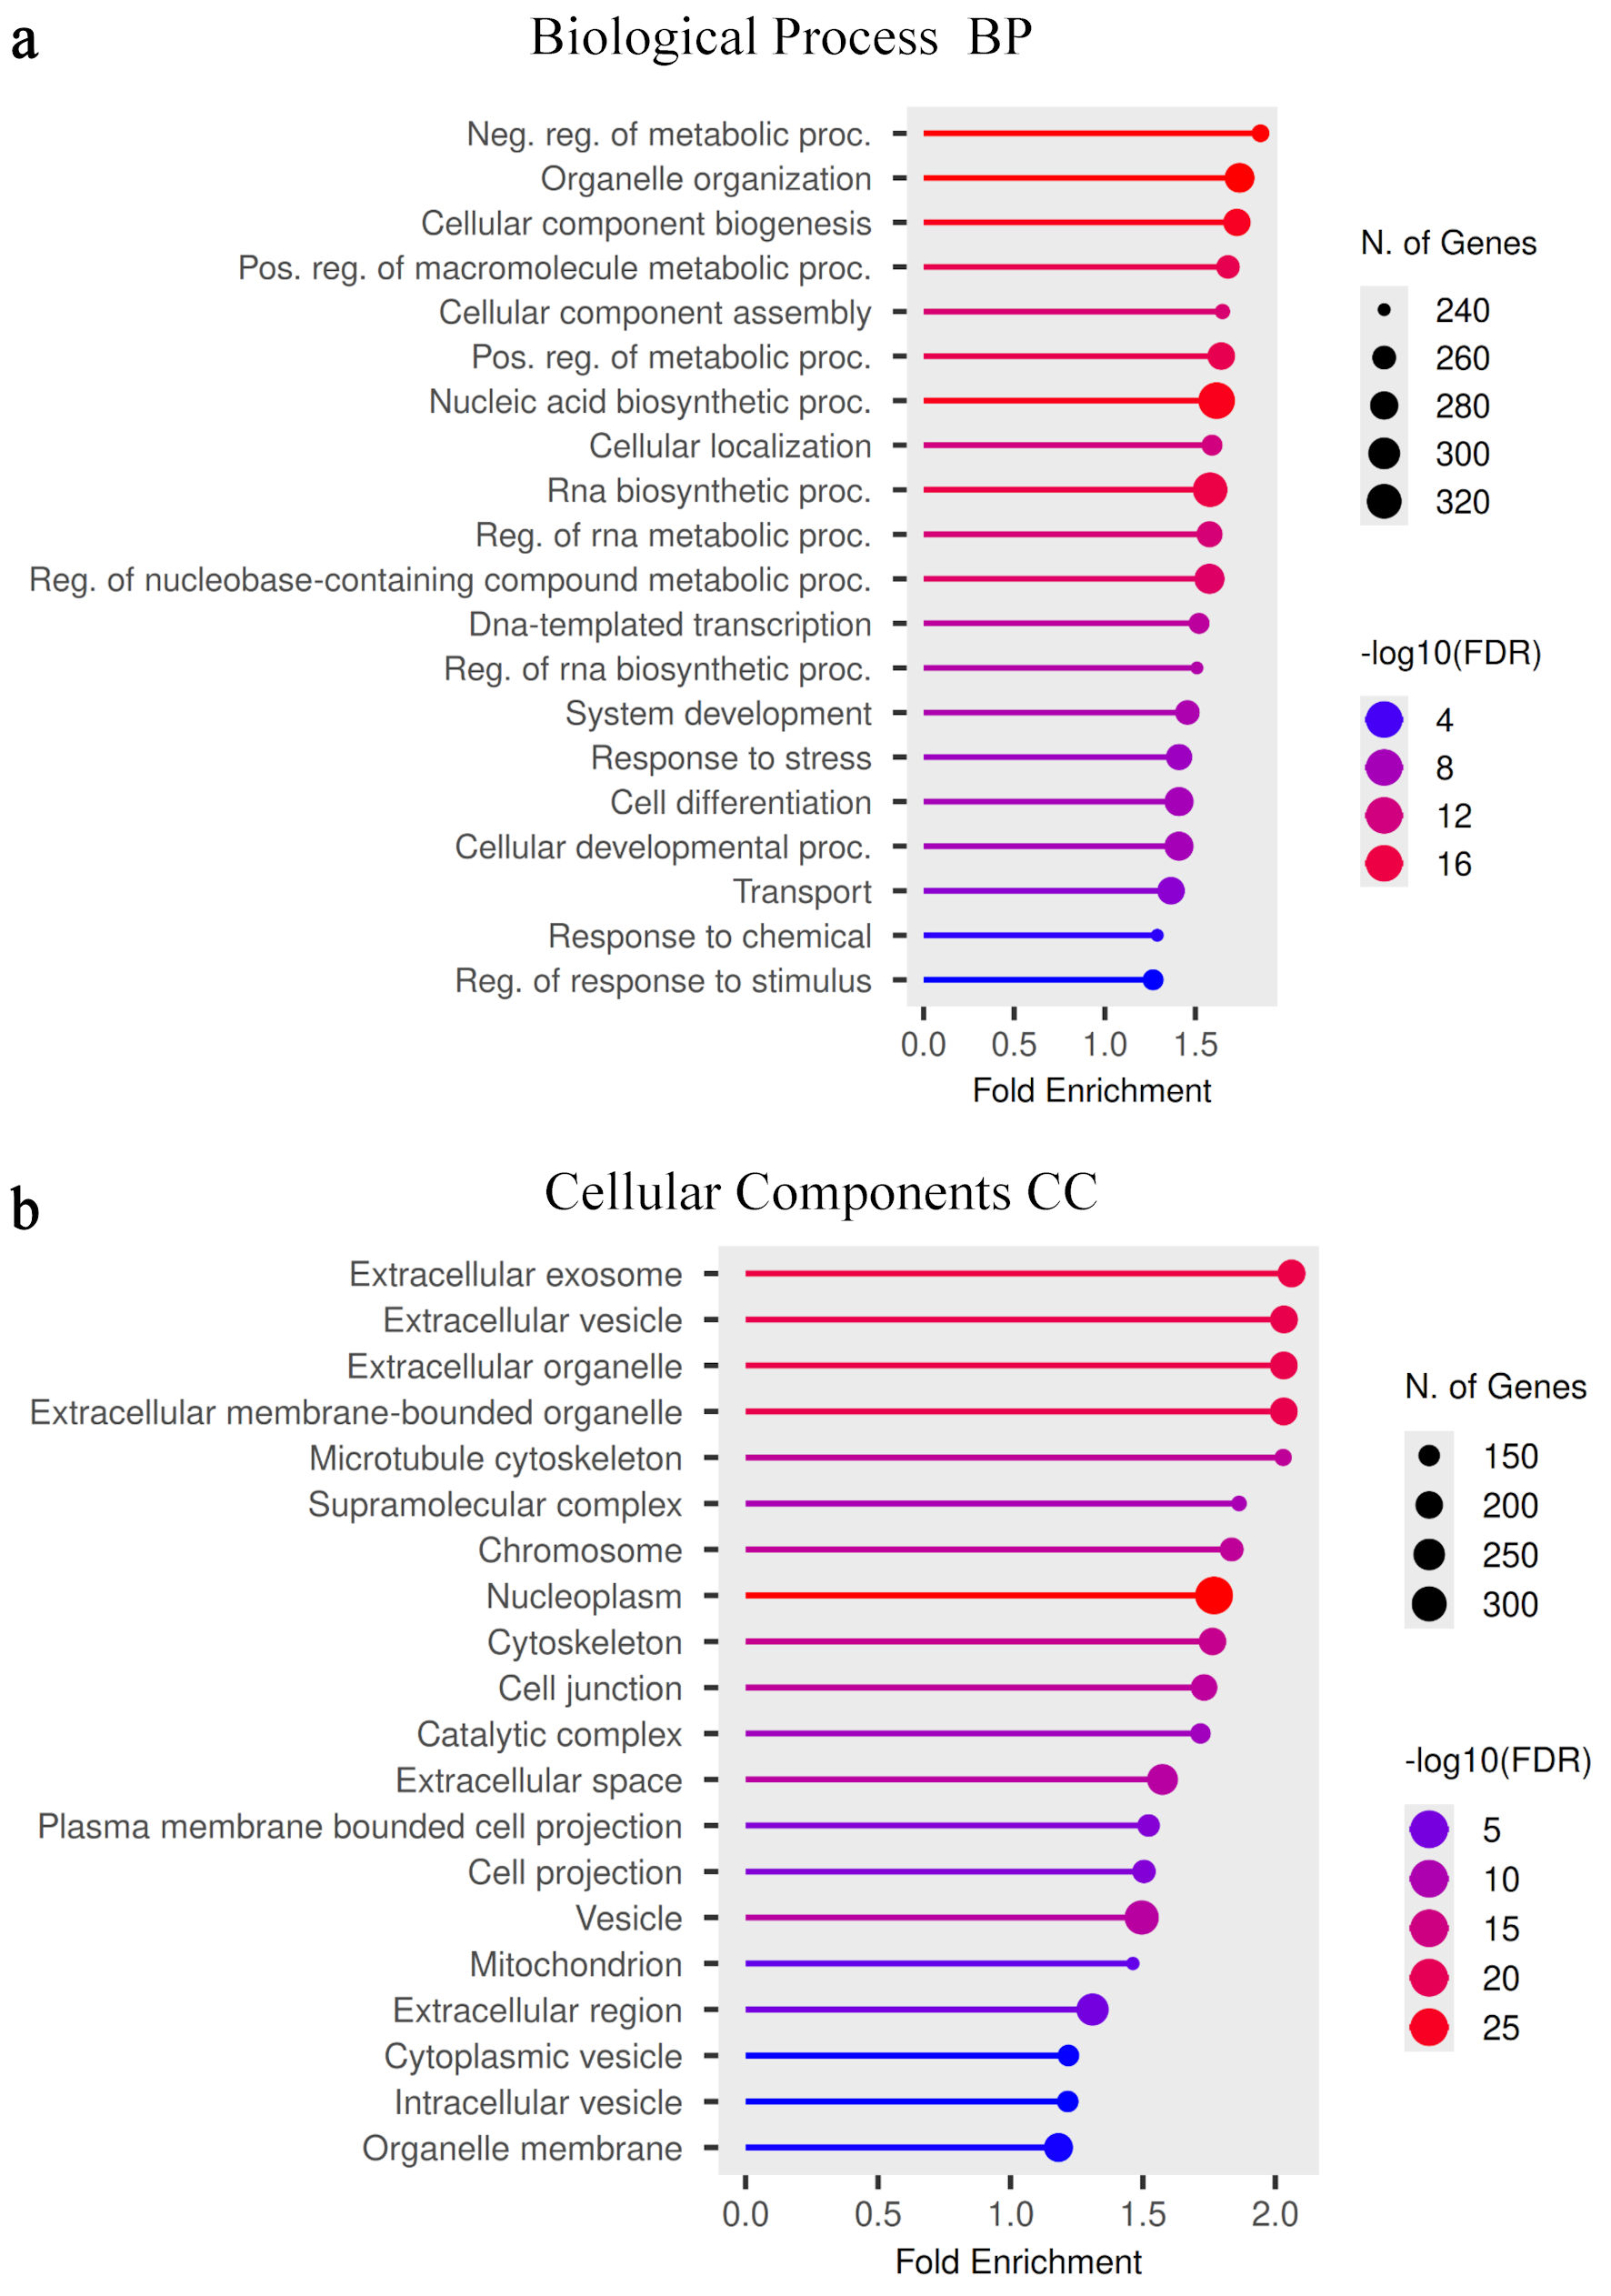
↓ Figure 2. Gene Ontology (GO) enrichment analysis of differentially expressed genes. (a) GO biological process enrichment analysis of DEGs identified between PNT2 and 22Rv1 cells. The bubble plot displays significantly enriched biological processes associated with transcriptional remodeling in the castration-resistant state. The x-axis represents fold enrichment of each GO term. Bubble size indicates the number of genes contributing to each biological process, and color intensity represents statistical significance expressed as −log10(FDR). (b) GO cellular component enrichment analysis highlighting the subcellular compartments associated with the identified DEGs. Enriched categories include extracellular vesicle–related structures, cytoskeletal components, chromosomal elements, and mitochondrial-associated compartments. Bubble size reflects gene count, and color intensity represents −log10(FDR). FDR: false discovery rate; DEGs: differentially expressed genes. BP: biological process; CC: cellular component.
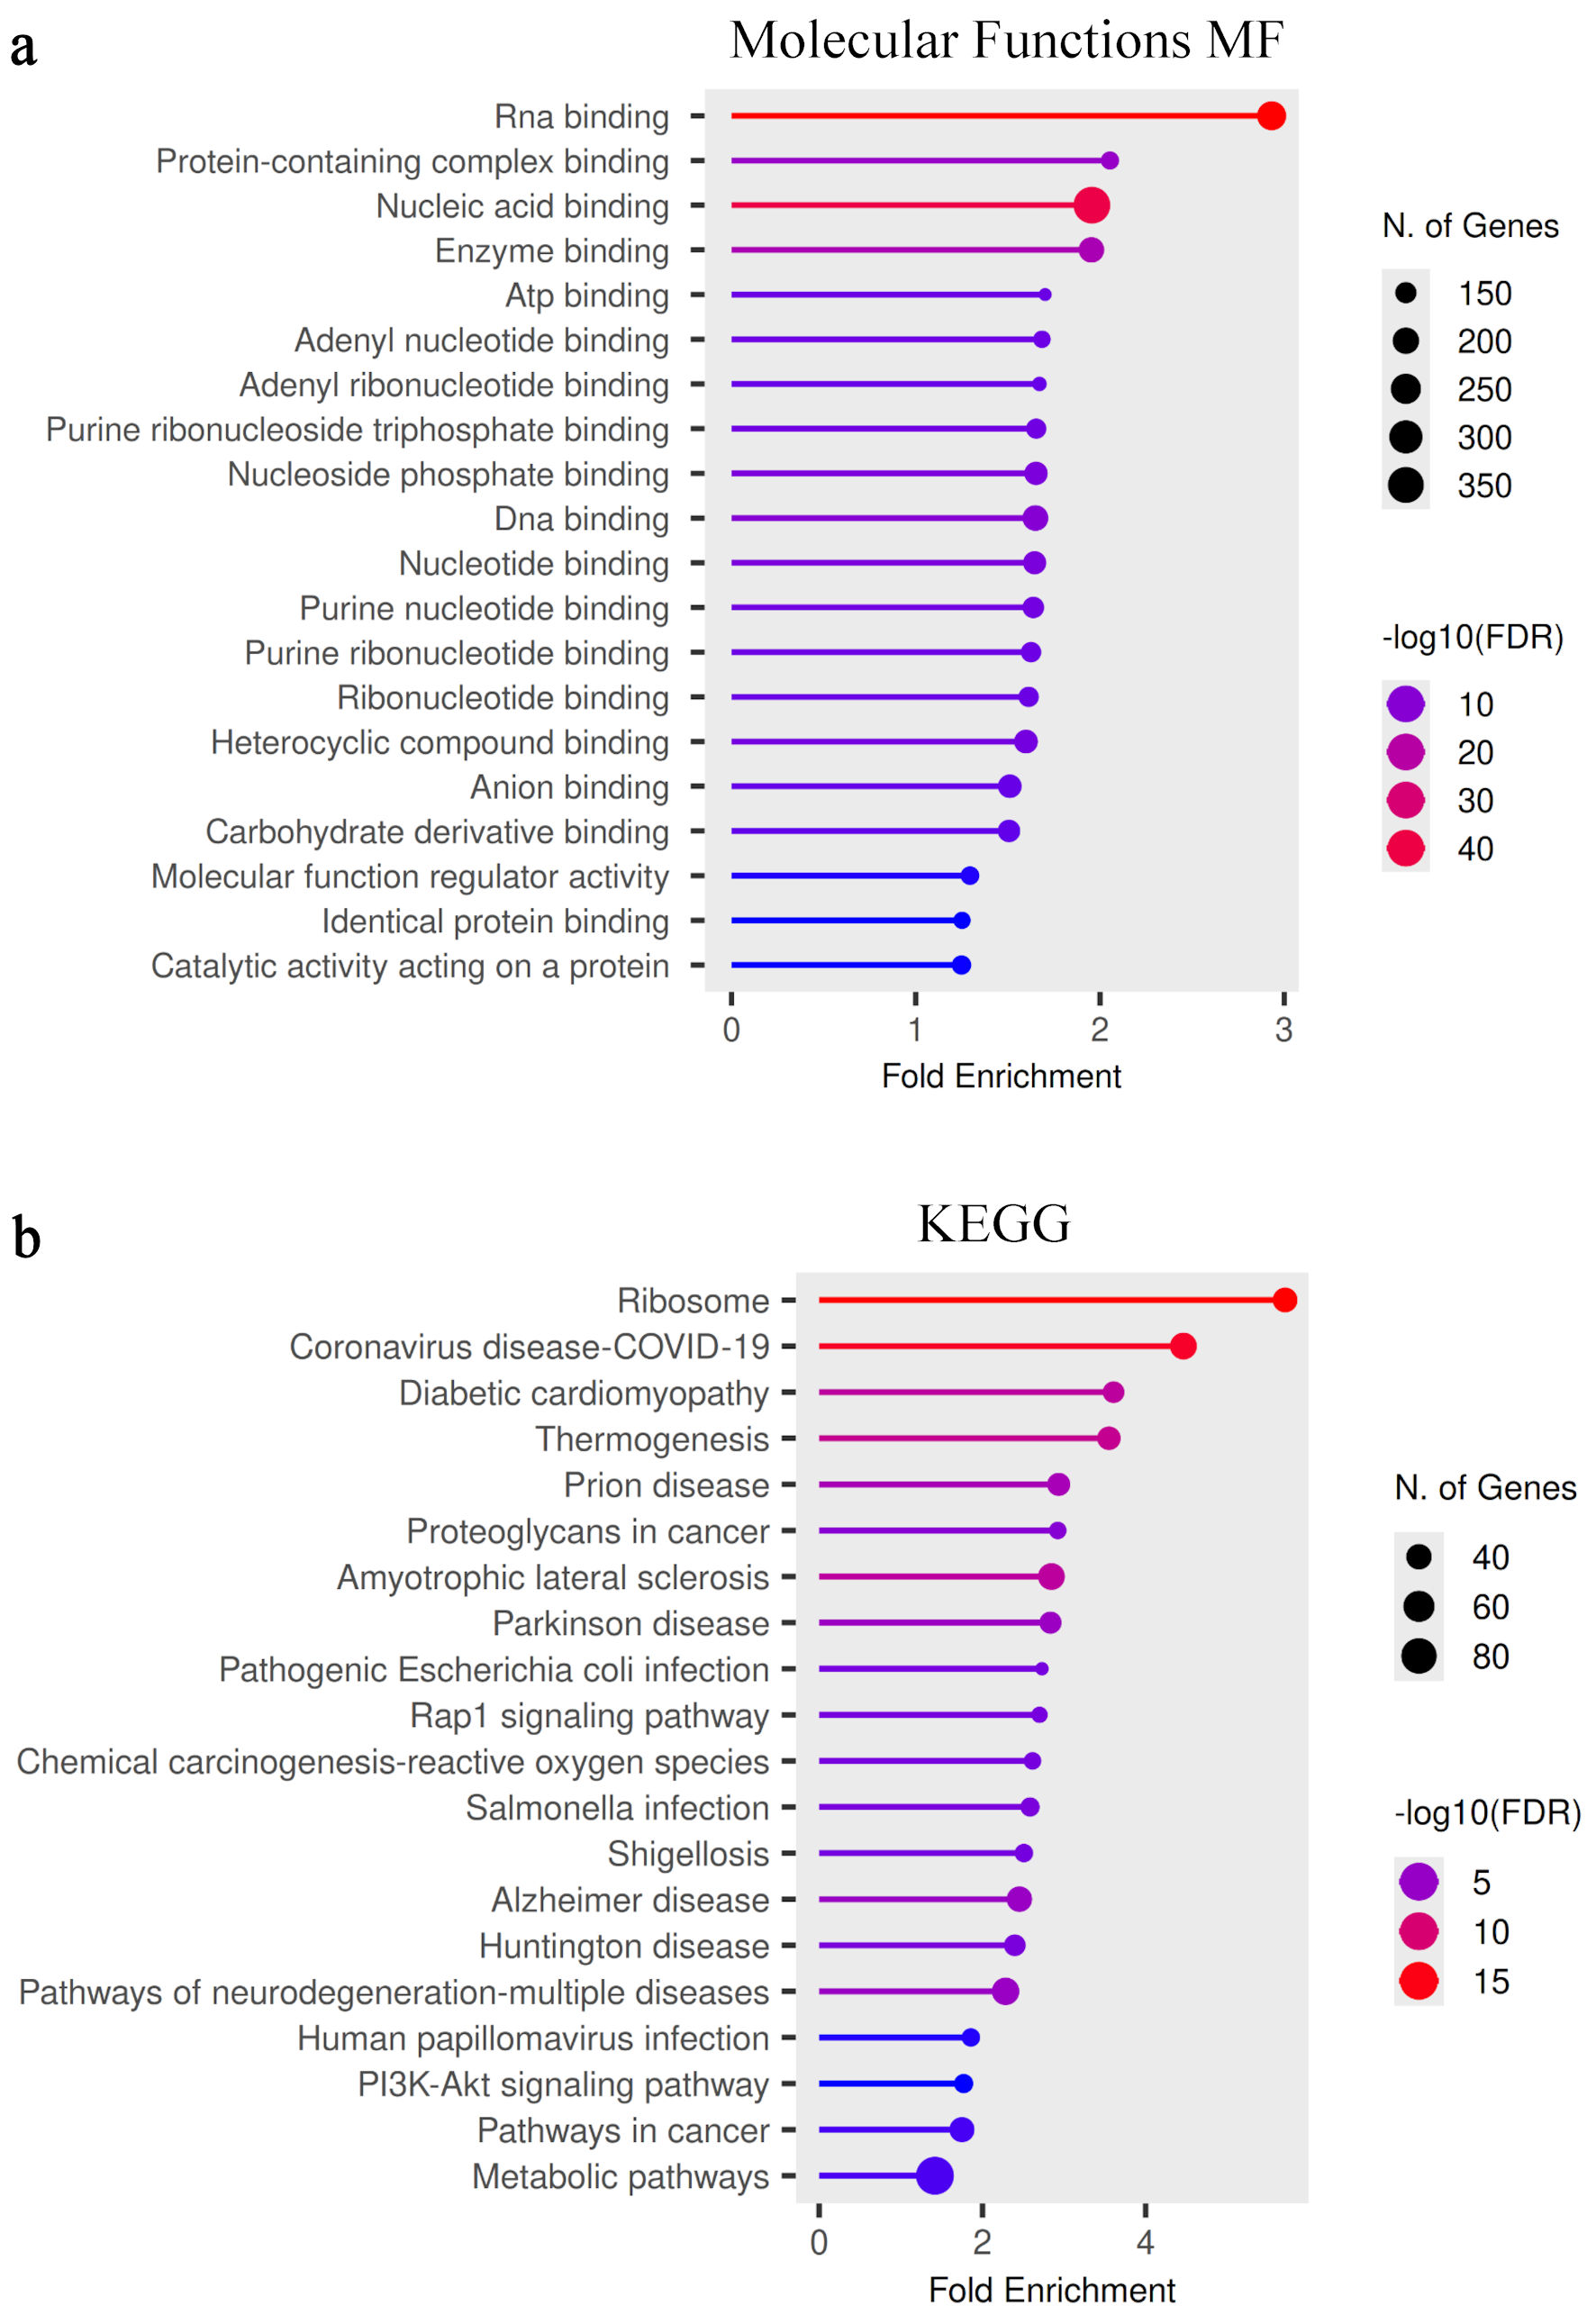
↓ Figure 3. Functional enrichment analysis of molecular functions and signaling pathways. (a) Gene Ontology (GO) molecular function enrichment analysis of DEGs between PNT2 and 22Rv1 cells. Significantly enriched functions include nucleic acid binding, RNA binding, enzyme binding, and catalytic activity acting on proteins. These enrichments indicate increased activity of regulatory complexes and transcriptional control mechanisms in the castration-resistant phenotype. (b) KEGG pathway enrichment analysis identifying signaling pathways associated with the observed transcriptional changes. Significantly enriched pathways include ribosome-associated pathways, metabolic pathways, and PI3K–Akt signaling. Bubble size indicates the number of genes associated with each pathway, and color intensity represents statistical significance (−log10(FDR)). FDR: false discovery rate; DEGs: differentially expressed genes; MF: molecular function; KEGG: Kyoto Encyclopedia of Genes and Genomes.
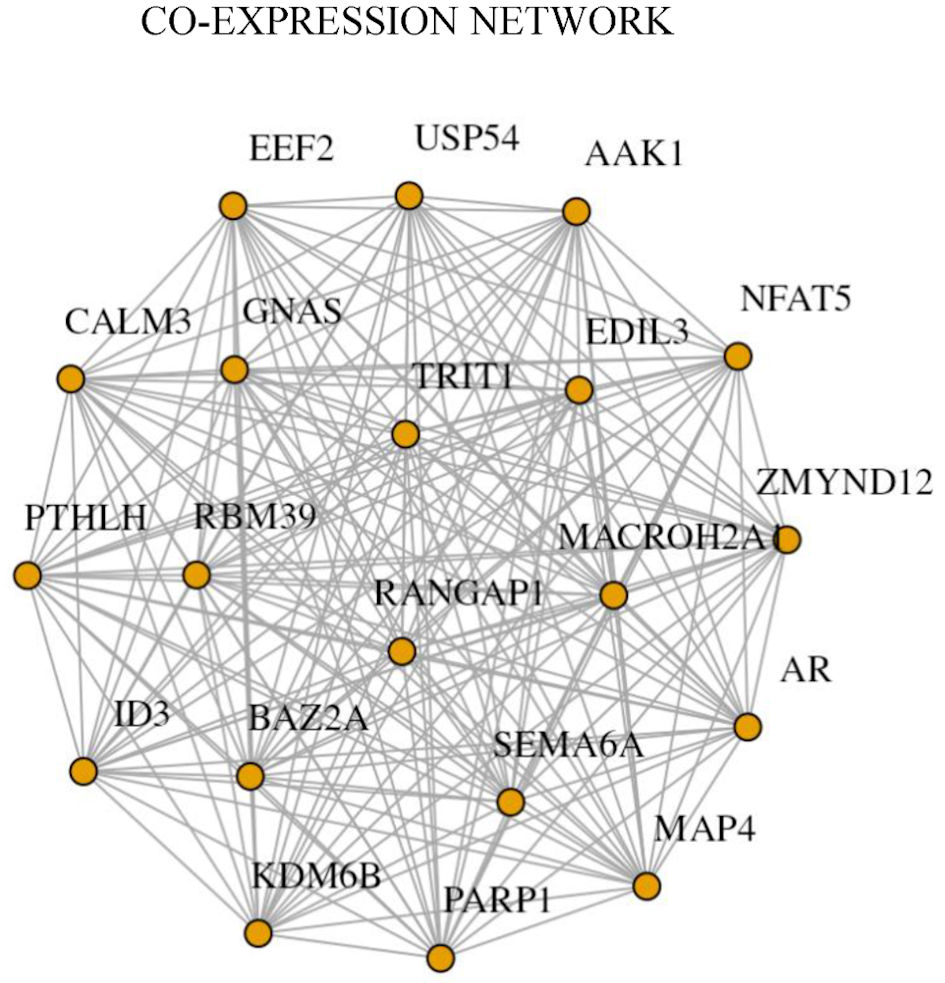
↓ Figure 4. Gene co-expression network analysis of differentially expressed genes. The co-expression network was constructed from significantly differentially expressed genes identified in the transcriptomic comparison between PNT2 and 22Rv1 cells. Each node represents an individual gene, and edges represent significant correlation-based co-expression relationships. The network reveals a central regulatory module composed of AR, PARP1, KDM6B, BAZ2A, RANGAP1, NFAT5, and MAP4, which display multiple interaction links and high connectivity. The presence of this densely interconnected module highlights coordinated transcriptional regulation associated with the castration-resistant phenotype.
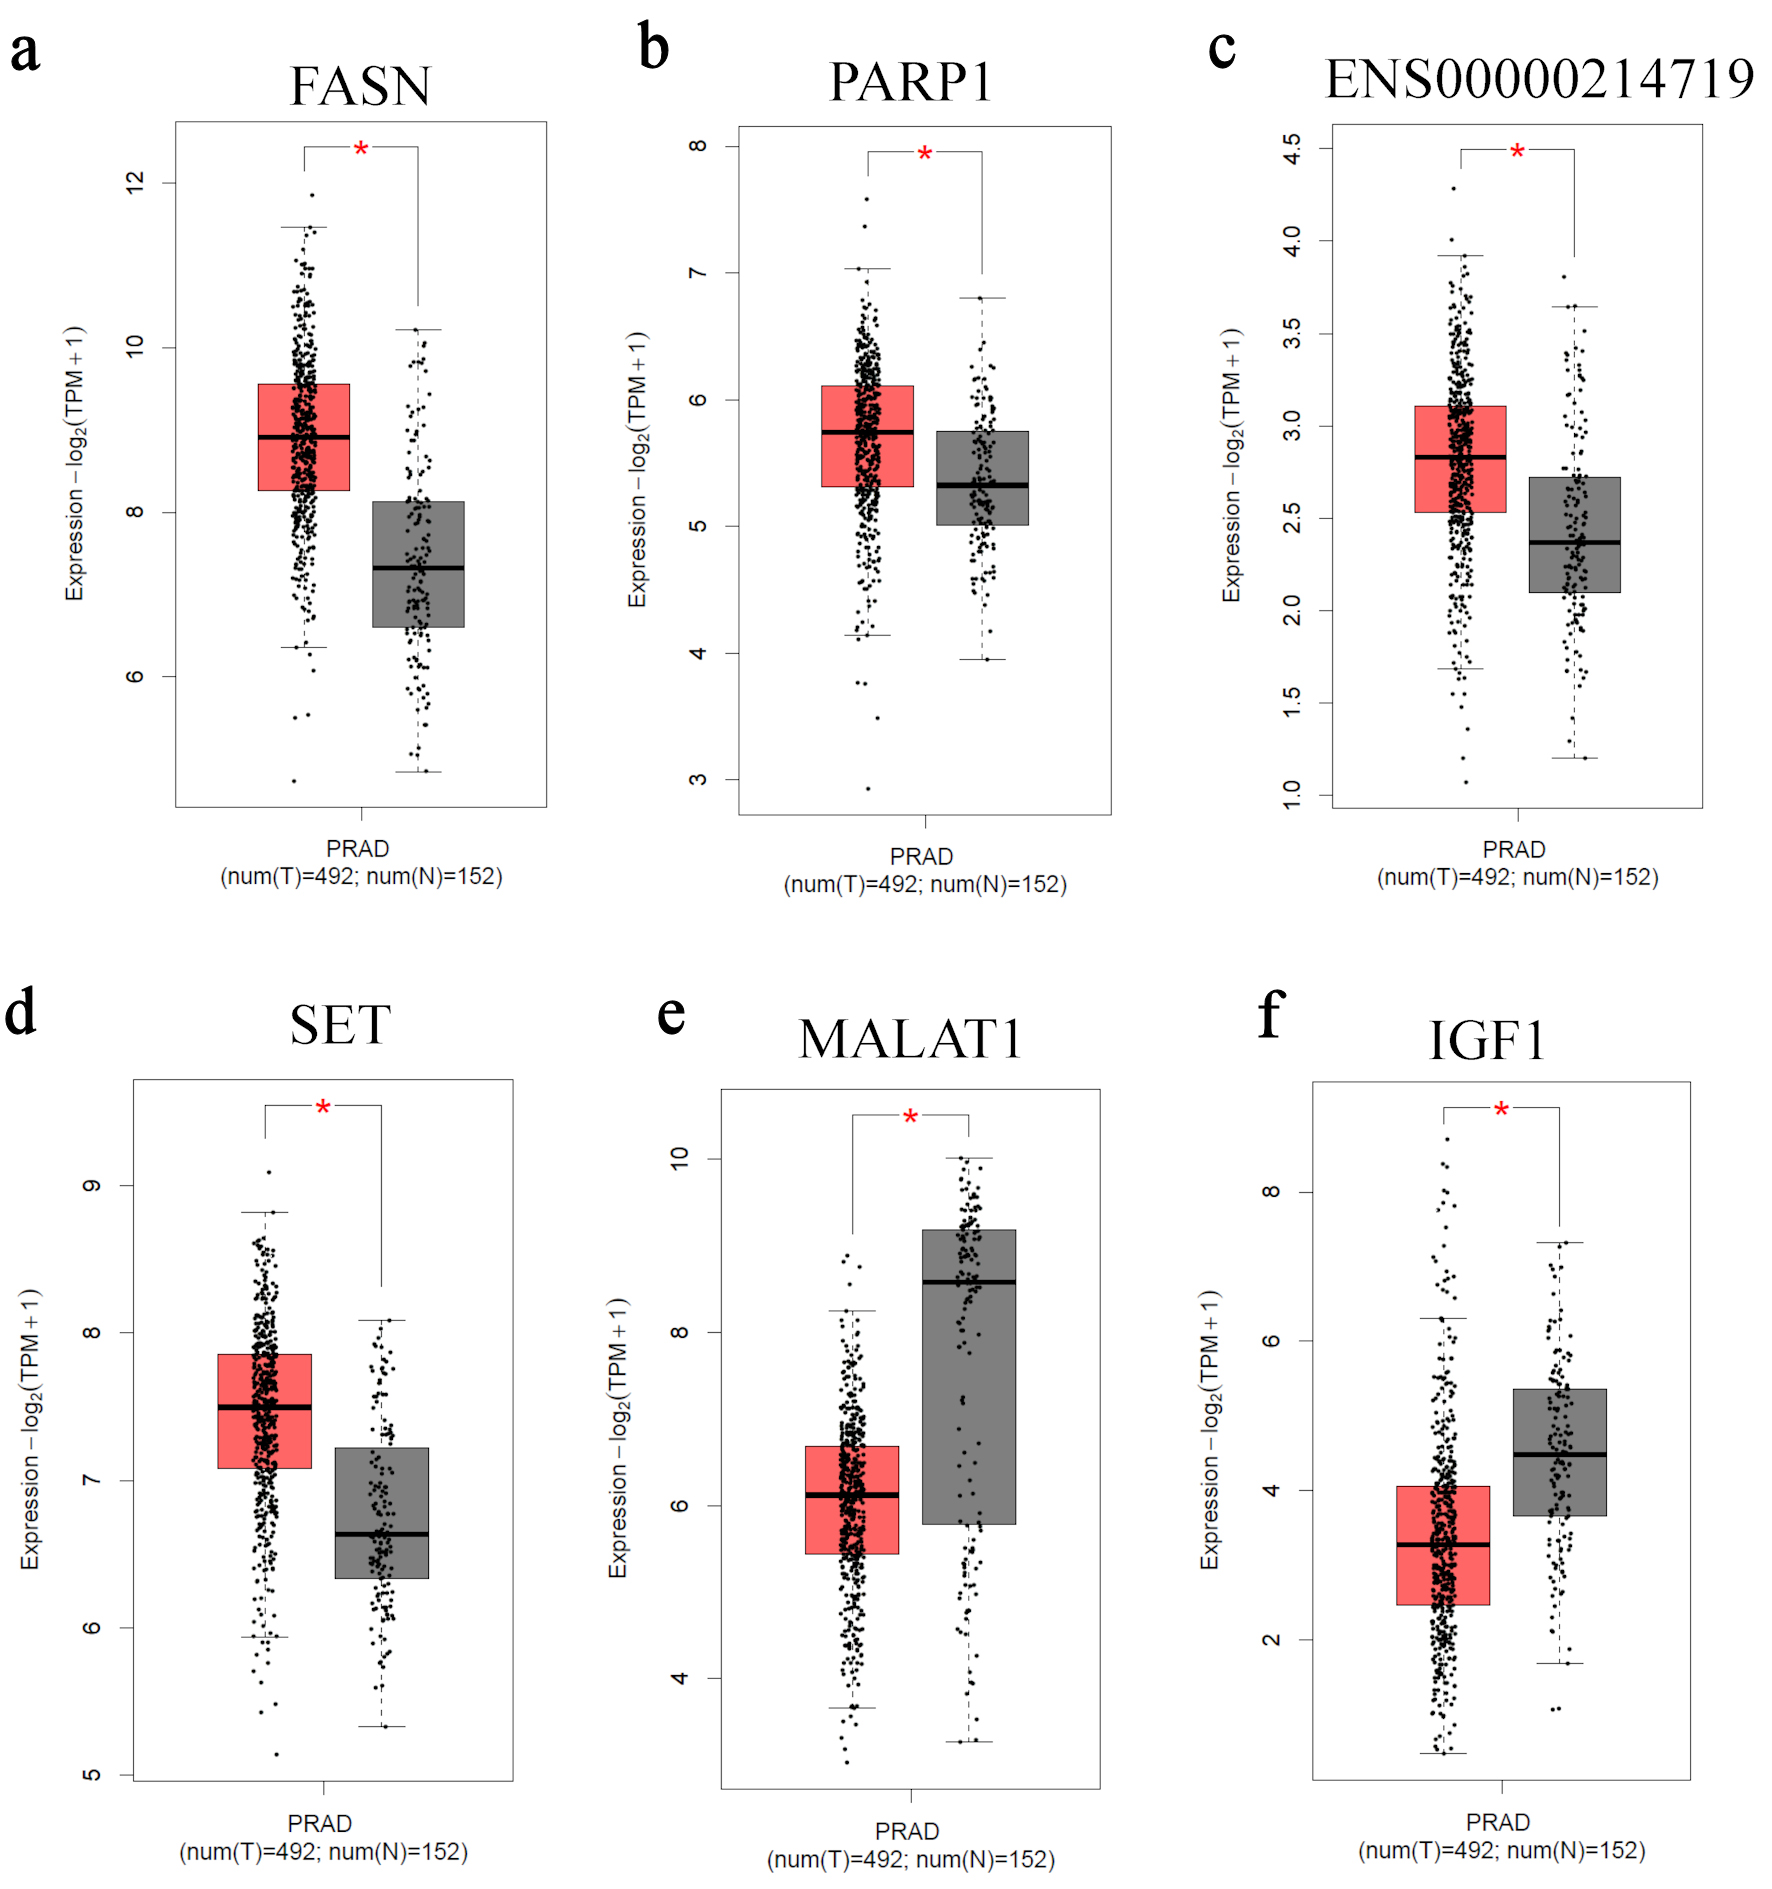
↓ Figure 5. Clinical validation of candidate genes in prostate adenocarcinoma datasets. Boxplots showing the expression levels of (a) FASN, (b) PARP1, (c) ENSG00000214719, (d) SET, (e) MALAT1, and (f) IGF1 in prostate adenocarcinoma (PRAD) tumors (n = 492) and normal prostate tissues (n = 152) obtained from The Cancer Genome Atlas (TCGA) and Genotype-Tissue Expression (GTEx) datasets via the Gene Expression Profiling Interactive Analysis 2 (GEPIA2) platform. Expression values are presented as log2(TPM + 1). The central line represents the median, the box indicates the interquartile range, and whiskers represent the data distribution. TPM: transcripts per million.
Tables
↓ Table 1. Top Differentially Expressed Genes Identified Between PNT2 and 22Rv1 Cells
| Ensembl ID | Gene symbol | Log2 fold change | Adjusted P value (FDR) | Chromosomal location | Gene type |
|---|
| ID: identifier; FDR: false discovery rate; lncRNA: long noncoding RNA. |
| ENSG00000251562 | MALAT1 | 17.60 | 1.34 × 10⁻¹⁷ | 11q13.1 | lncRNA |
| ENSG00000169710 | FASN | 14.80 | 5.36 × 10⁻¹⁷ | 17q25.3 | Protein-coding |
| ENSG00000143799 | PARP1 | 11.24 | 9.67 × 10⁻¹⁶ | 1q42.12 | Protein-coding |
| ENSG00000119335 | SET | 10.91 | 1.03 × 10⁻¹⁵ | 9q34.11 | Protein-coding |
| ENSG00000214719 | Unknown/lncRNA ENSG00000214719 | 10.23 | 1.88 × 10⁻¹⁵ | 17q11.2 | lncRNA |
| ENSG00000174227 | IGF1 | −7.59 | 5.31 × 10⁻¹⁴ | 12q23.2 | Protein-coding |
↓ Table 2. Gene Ontology (GO) Biological Process Enrichment Analysis of Differentially Expressed Genes Between PNT2 and 22Rv1 Cells
| GO term | Biological process | FDR | Gene count | Pathway gene count | Fold enrichment |
|---|
| FDR: false discovery rate. |
| GO:0141187 | Nucleic acid biosynthetic process | 4.43 × 10⁻¹⁹ | 334 | 4,902 | 1.62 |
| GO:0032774 | RNA biosynthetic process | 1.37 × 10⁻¹⁶ | 319 | 4,788 | 1.58 |
| GO:0019219 | Regulation of nucleobase-containing compound metabolic process | 1.39 × 10⁻¹⁴ | 290 | 4,363 | 1.58 |
| GO:0006996 | Organelle organization | 5.98 × 10⁻²⁰ | 288 | 3,920 | 1.74 |
| GO:0030154 | Cell differentiation | 1.03 × 10⁻⁸ | 284 | 4,782 | 1.41 |
| GO:0048869 | Cellular developmental process | 1.03 × 10⁻⁸ | 284 | 4,783 | 1.41 |
| GO:0009893 | Positive regulation of metabolic process | 6.42 × 10⁻¹⁶ | 276 | 3,988 | 1.64 |
| GO:0006810 | Transport | 3.90 × 10⁻⁷ | 276 | 4,797 | 1.37 |
| GO:0044085 | Cellular component biogenesis | 9.95 × 10⁻¹⁹ | 275 | 3,775 | 1.73 |
| GO:0006950 | Response to stress | 3.21 × 10⁻⁸ | 270 | 4,545 | 1.41 |
| GO:0051252 | Regulation of RNA metabolic process | 2.33 × 10⁻¹³ | 269 | 4,046 | 1.58 |
| GO:0048731 | System development | 2.54 × 10⁻⁹ | 263 | 4,287 | 1.46 |
| GO:0010604 | Positive regulation of macromolecule metabolic process | 6.42 × 10⁻¹⁶ | 259 | 3,659 | 1.68 |
| GO:0051641 | Cellular localization | 1.10 × 10⁻¹² | 251 | 3,743 | 1.59 |
| GO:0006351 | DNA-templated transcription | 1.32 × 10⁻¹⁰ | 251 | 3,919 | 1.52 |
| GO:0048583 | Regulation of response to stimulus | 4.67 × 10⁻⁴ | 251 | 4,704 | 1.27 |
| GO:0009892 | Negative regulation of metabolic process | 7.50 × 10⁻²⁰ | 244 | 3,115 | 1.86 |
| GO:0022607 | Cellular component assembly | 9.49 × 10⁻¹⁴ | 241 | 3,468 | 1.65 |
| GO:2001141 | Regulation of RNA biosynthetic process | 9.16 × 10⁻¹⁰ | 240 | 3,776 | 1.51 |
| GO:0042221 | Response to chemical | 2.38 × 10⁻⁴ | 240 | 4,417 | 1.29 |
↓ Table 3. Gene Ontology (GO) Cellular Component Enrichment Analysis of Differentially Expressed Genes Between PNT2 and 22Rv1 Cells
| GO term | Cellular component | FDR | Gene count | Pathway gene count | Fold enrichment |
|---|
| FDR: false discovery rate. |
| GO:0005654 | Nucleoplasm | 9.19 × 10⁻²⁸ | 348 | 4,670 | 1.77 |
| GO:0031982 | Vesicle | 2.70 × 10⁻¹² | 288 | 4,571 | 1.50 |
| GO:0005576 | Extracellular region | 1.74 × 10⁻⁵ | 258 | 4,675 | 1.31 |
| GO:0005615 | Extracellular space | 3.67 × 10⁻¹² | 240 | 3,619 | 1.57 |
| GO:0031090 | Organelle membrane | 2.25 × 10⁻² | 216 | 4,340 | 1.18 |
| GO:0070062 | Extracellular exosome | 3.18 × 10⁻²² | 204 | 2,349 | 2.06 |
| GO:0043230 | Extracellular organelle | 1.19 × 10⁻²¹ | 204 | 2,383 | 2.03 |
| GO:0065010 | Extracellular membrane-bounded organelle | 1.19 × 10⁻²¹ | 204 | 2,383 | 2.03 |
| GO:1903561 | Extracellular vesicle | 1.19 × 10⁻²¹ | 204 | 2,382 | 2.03 |
| GO:0005856 | Cytoskeleton | 2.19 × 10⁻¹⁴ | 200 | 2,693 | 1.76 |
| GO:0030054 | Cell junction | 6.39 × 10⁻¹³ | 190 | 2,605 | 1.73 |
| GO:0005694 | Chromosome | 2.54 × 10⁻¹³ | 167 | 2,160 | 1.83 |
| GO:0042995 | Cell projection | 1.36 × 10⁻⁶ | 163 | 2,572 | 1.50 |
| GO:0120025 | Plasma membrane bounded cell projection | 1.30 × 10⁻⁶ | 157 | 2,449 | 1.52 |
| GO:0031410 | Cytoplasmic vesicle | 2.79 × 10⁻² | 151 | 2,941 | 1.22 |
| GO:0097708 | Intracellular vesicle | 2.95 × 10⁻² | 151 | 2,947 | 1.22 |
| GO:1902494 | Catalytic complex | 2.74 × 10⁻⁹ | 144 | 1,990 | 1.72 |
| GO:0015630 | Microtubule cytoskeleton | 2.53 × 10⁻¹³ | 131 | 1,532 | 2.03 |
| GO:0099080 | Supramolecular complex | 2.29 × 10⁻¹⁰ | 127 | 1,618 | 1.86 |
| GO:0005739 | Mitochondrion | 1.38 × 10⁻⁴ | 125 | 2,029 | 1.46 |
↓ Table 4. Gene Ontology (GO) Molecular Function Enrichment Analysis of Differentially Expressed Genes Between PNT2 and 22Rv1 Cells
| GO term | Molecular function | FDR | Gene count | Pathway gene count | Fold enrichment |
|---|
| FDR: false discovery rate; ATP: adenosine triphosphate. |
| GO:0003676 | Nucleic acid binding | 4.87 × 10–40 | 368 | 4,465 | 1.96 |
| GO:0003723 | RNA binding | 2.53 × 10–50 | 233 | 1,886 | 2.93 |
| GO:0003677 | DNA binding | 1.08 × 10⁻¹⁰ | 191 | 2,748 | 1.65 |
| GO:0019899 | Enzyme binding | 2.01 × 10⁻¹⁷ | 189 | 2,296 | 1.95 |
| GO:1901363 | Heterocyclic compound binding | 2.10 × 10⁻⁸ | 171 | 2,539 | 1.60 |
| GO:0043168 | Anion binding | 8.33 × 10⁻⁷ | 170 | 2,671 | 1.51 |
| GO:1901265 | Nucleoside phosphate binding | 3.28 × 10⁻⁹ | 167 | 2,398 | 1.65 |
| GO:0000166 | Nucleotide binding | 5.51 × 10⁻⁹ | 165 | 2,380 | 1.65 |
| GO:0097367 | Carbohydrate derivative binding | 2.75 × 10⁻⁶ | 160 | 2,521 | 1.51 |
| GO:0017076 | Purine nucleotide binding | 4.43 × 10⁻⁸ | 152 | 2,202 | 1.64 |
| GO:0032555 | Purine ribonucleotide binding | 1.78 × 10⁻⁷ | 144 | 2,102 | 1.63 |
| GO:0032553 | Ribonucleotide binding | 2.56 × 10⁻⁷ | 144 | 2,119 | 1.61 |
| GO:0035639 | Purine ribonucleoside triphosphate binding | 7.77 × 10⁻⁸ | 143 | 2,052 | 1.65 |
| GO:0140096 | Catalytic activity acting on a protein | 3.40 × 10⁻² | 138 | 2,624 | 1.25 |
| GO:0098772 | Molecular function regulator activity | 1.31 × 10⁻² | 134 | 2,457 | 1.29 |
| GO:0044877 | Protein-containing complex binding | 2.66 × 10⁻¹³ | 132 | 1,525 | 2.05 |
| GO:0030554 | Adenyl nucleotide binding | 1.66 × 10⁻⁷ | 129 | 1,817 | 1.68 |
| GO:0042802 | Identical protein binding | 4.24 × 10⁻² | 128 | 2,428 | 1.25 |
| GO:0032559 | Adenyl ribonucleotide binding | 6.43 × 10⁻⁷ | 121 | 1,718 | 1.67 |
| GO:0005524 | ATP binding | 2.82 × 10⁻⁷ | 120 | 1,673 | 1.70 |
↓ Table 5. KEGG Pathway Enrichment Analysis of Differentially Expressed Genes Between PNT2 and 22Rv1 Cells
| KEGG pathway ID | Pathway name | FDR | Gene count | Pathway gene count | Fold enrichment |
|---|
| KEGG: Kyoto Encyclopedia of Genes and Genomes; ID: identifier; FDR: false discovery rate. |
| hsa01100 | Metabolic pathways | 3.13 × 10⁻³ | 93 | 1,556 | 1.42 |
| hsa05022 | Pathways of neurodegeneration–multiple diseases | 6.50 × 10⁻⁶ | 46 | 478 | 2.28 |
| hsa05171 | Coronavirus disease 2019 (COVID-19) | 7.96 × 10⁻¹⁵ | 44 | 234 | 4.46 |
| hsa05014 | Amyotrophic lateral sclerosis | 3.77 × 10⁻⁸ | 44 | 367 | 2.85 |
| hsa05010 | Alzheimer disease | 6.50 × 10⁻⁶ | 40 | 387 | 2.45 |
| hsa05200 | Pathways in cancer | 3.98 × 10⁻³ | 39 | 529 | 1.75 |
| hsa03010 | Ribosome | 3.63 × 10⁻¹⁶ | 38 | 158 | 5.71 |
| hsa04714 | Thermogenesis | 7.77 × 10⁻⁹ | 35 | 234 | 3.55 |
| hsa05020 | Prion disease | 1.10 × 10⁻⁶ | 34 | 275 | 2.93 |
| hsa05012 | Parkinson disease | 5.53 × 10⁻⁶ | 32 | 268 | 2.83 |
| hsa05415 | Diabetic cardiomyopathy | 3.79 × 10⁻⁸ | 31 | 204 | 3.61 |
| hsa05016 | Huntington disease | 1.69 × 10⁻⁴ | 31 | 307 | 2.40 |
| hsa05132 | Salmonella infection | 1.69 × 10⁻⁴ | 27 | 248 | 2.58 |
| hsa04151 | PI3K-Akt signaling pathway | 1.59 × 10⁻² | 27 | 362 | 1.77 |
| hsa05131 | Shigellosis | 2.69 × 10⁻⁴ | 26 | 246 | 2.51 |
| hsa05165 | Human papillomavirus infection | 1.07 × 10⁻³ | 26 | 332 | 1.86 |
| hsa05205 | Proteoglycans in cancer | 5.16 × 10⁻⁵ | 25 | 203 | 2.92 |
| hsa05208 | Chemical carcinogenesis–reactive oxygen species | 2.25 × 10⁻⁴ | 25 | 227 | 2.61 |
| hsa04015 | Rap1 signaling pathway | 2.20 × 10⁻⁴ | 24 | 211 | 2.70 |
| hsa05130 | Pathogenic Escherichia coli infection | 2.32 × 10⁻⁴ | 23 | 200 | 2.73 |