| World Journal of Oncology, ISSN 1920-4531 print, 1920-454X online, Open Access |
| Article copyright, the authors; Journal compilation copyright, World J Oncol and Elmer Press Inc |
| Journal website https://wjon.elmerpub.com |
Original Article
Volume 17, Number 2, April 2026, pages 143-156

TP53 Loss Fuels mTORC1 Activation and Autophagy Suppression to Drive Immune-Cold Colorectal Cancer
Eunseuk Leea, b, c ![]() , Dana Al-Assia, b
, Dana Al-Assia, b ![]() , Randy Rivera-Ruedaa, b
, Randy Rivera-Ruedaa, b ![]() , Sharon Susan Paula, b, Aksa Joya, b
, Sharon Susan Paula, b, Aksa Joya, b
aRutgers Health Community Medical Center, Toms River, NJ, USA
bThe State University of New Jersey Rutgers, New Brunswick, NJ, USA
cCorresponding Author: Eunseuk Lee, Department of Internal Medicine, Rutgers Health Community Medical Center, Toms River, NJ 08755, USA
Manuscript submitted October 28, 2025, accepted January 15, 2026, published online March 5, 2026
Short title: TP53-mTORC1 Axis in Immune-Cold CRC
doi: https://doi.org/10.14740/wjon2695
| Abstract | ▴Top |
Background: Microsatellite-stable colorectal cancer (MSS CRC) is typically resistant to immune checkpoint blockade and remains an “immune-cold” disease. Wild-type p53 is known to restrain mTOR signaling and support autophagy, yet how TP53 loss integrates metabolic rewiring with immune suppression in MSS CRC—especially with protein- and phosphosite-level validation—remains incompletely defined. We tested whether p53 deficiency is associated with coordinated mTORC1 activation, autophagy attenuation, and immune-cold remodeling across multi-omics datasets.
Methods: We analyzed GSE146009 (paired tumor-normal RNA-seq pairs), TCGA-COAD/READ (n = 647, mutation annotated), GSE108989 (11,138 tumor-infiltrating T cells), and CPTAC colon proteome/phosphoproteome cohorts. Pathway activities were quantified by single-sample gene set enrichment analysis (ssGSEA) and Seurat module scoring. Group differences were tested by Kruskal–Wallis and Wilcoxon analyses with false-discovery-rate correction. CPTAC phosphosite-to-protein ratios were compared between TP53-mutant or p53-low versus wild-type or p53-high tumors.
Results: Across bulk transcriptomes, TP53-mutant tumors showed higher mTORC1 signaling, lower autophagy scores, higher FOXP3, and reduced CD8A/FOXP3 ratios consistent with a regulatory T-cell-skewed immune-cold state. Single-cell analysis confirmed subset-specific immunometabolic programs, highlighting metabolically active regulatory/exhausted states with relatively blunted inflammatory output. Proteomic/phosphoproteomic data supported post-translational mTOR pathway activation in p53-deficient tumors, including increased phosphorylation of canonical mTOR substrates (EIF4EBP2 S65; RPS6KB1 T421/S424) and reduced phosphorylation at inhibitory RPTOR sites (S705/T725/S726), consistent with sustained mTORC1 activity.
Conclusions: In MSS CRC, p53 deficiency is consistently associated with immunometabolic remodeling marked by persistent mTOR pathway activation, relative autophagy attenuation, and FOXP3-dominant immune-cold features across transcriptomic, single-cell, and proteomic layers. These findings add protein- and phosphosite-level evidence linking TP53 loss to an immune-suppressive metabolic state and support biomarker-guided evaluation of mTOR kinase (TORC1/2) inhibition, which more fully suppresses 4E-BP/S6K phosphorylation, combined with PD-1/PD-L1 (± CTLA-4) blockade in TP53-deficient MSS CRC.
Keywords: TP53; mTORC1; Autophagy; Colorectal cancer; Immunometabolism; Proteomics; Immune evasion; Regulatory T cells
| Introduction | ▴Top |
Colorectal cancer (CRC) remains one of the leading causes of cancer-related deaths worldwide, and most cases are microsatellite-stable (MSS) rather than microsatellite instability-high (MSI-H) [1–5]. In contrast to MSI-H tumors, which frequently respond to immune checkpoint inhibitors (ICIs), MSS CRC is largely refractory to immunotherapy. This resistance reflects an immunologically “cold” tumor microenvironment (TME) characterized by limited cytotoxic T-cell infiltration, low neoantigen-driven immunogenicity, and dominant immunosuppressive signaling networks. Understanding the molecular mechanisms that maintain this immune-cold state remains a major unmet need in CRC [4–8].
Among the genetic alterations shaping the MSS phenotype, loss of TP53 function is one of the most common and biologically consequential events, occurring in nearly half of all CRCs [9–14]. Beyond its canonical role in genomic surveillance, wild-type p53 serves as a central regulator of cellular metabolism by restraining growth-promoting pathways and promoting energy homeostasis. A key downstream consequence of TP53 loss is dysregulation of the PI3K–AKT–mTOR axis, resulting in sustained anabolic signaling, enhanced proliferation, and therapeutic resistance [15–22]. Under physiologic conditions, p53 suppresses mTORC1 activity through AMPK- and ULK-dependent mechanisms and promotes autophagy to buffer metabolic stress [23]. When p53 function is lost, this regulatory balance is disrupted, allowing unchecked mTORC1 activation and suppression of autophagic programs [3, 24–31].
Autophagy impairment itself has important consequences for both progression and immune regulation. In CRC, reduced autophagic flux has been linked to diminished antigen presentation, impaired cytotoxic T-cell priming, and resistance to immunotherapy [32–35]. Expression of autophagy-related genes such as ATG16L1 has been associated with poor response to PD-1/PD-L1 blockade in MSS disease, underscoring the clinical relevance of this pathway in immune-refractory CRC. At the same time, hyperactive mTORC1 signaling reshapes the TME by increasing nutrient competition and metabolic stress, thereby favoring immunosuppressive cell populations and weakening effector T-cell function [29, 30, 36–45].
Collectively, these findings suggest that TP53 loss may couple metabolic hyperactivation with immune suppression in MSS CRC through coordinated dysregulation of the mTOR1-autophagy axis. While prior studies have independently linked p53 loss to mTOR activation and mTORC1 signaling to immunosuppressive TME, how these processes integrate across molecular layers in MSS CRC remains incompletely defined [20, 22, 24, 46–49]. In particular, protein- and phosphosite-level validation of TP53-associated mTORC1 activity in relation to immune contexture has been limited. We therefore aimed to determine whether TP53 loss is associated with coordinated immunometabolic reprogramming through the mTORC1–autophagy axis in MSS CRC. Using integrated analyses of bulk transcriptomics, single-cell RNA sequencing of tumor-infiltrating T cells, and CPTAC proteomic and phosphoproteomic datasets, we tested the hypothesis that p53 deficiency is linked to persistent mTORC1 activation, relative autophagy suppression, and development of a FOXP3-dominant, immune-cold TME. By combining multiple omics layers across independent cohorts, this study seeks to provide mechanistic and post-translational context to the role of TP53 loss in shaping immune resistance in MSS CRC [50–62].
| Materials and Methods | ▴Top |
Study design and data sources
This study was designed as a multi-cohort, multi-omics analysis of how TP53 dysfunction is associated with metabolic and immune pathways remodeling in CRC, with a focus on MSS disease. All analyses were conducted using publicly available human datasets: 1) GSE146009 (discovery cohort): Bulk RNA-seq from 24 paired colorectal tumor and adjacent normal tissues generated on the Illumina HiSeq platform. 2) TCGA-COAD/READ (validation cohort): RNA-seq and mutation annotation data from 647 primary colorectal adenocarcinomas obtained through the Genomic Data Commons (GDC) portal. Tumors were categorized as TP53-wild type, missense, or null (loss-of-function) based on variant classification. 3) GSE108989 (single-cell cohort): Single-cell RNA sequencing of 11,138 tumor-infiltrating T cells isolated from 12 CRC patients. 4) CPTAC colon proteome/phosphoproteome datasets (PDC000111, PDC000116-117): Quantitative proteomic and phosphosite profiles generated by the Clinical Proteomic Tumor Analysis Consortium.
Bulk RNA-seq processing and pathway analysis
For bulk transcriptomic data (GSE146009 and TCGA-COAD/READ), normalized expression values were analyzed as log2(FPKM + 1) or log2(counts-per-million + 1), depending on dataset availability. Pathway activities were quantified using single-sample gene set enrichment analysis (ssGSEA) implemented in the GSVA R package. We prioritized MSigDM Hallmark pathways for their robustness and reduced redundancy across platforms, complemented by Reactome pathways to capture mechanistic detail for autophagy-related processes. Pathways of interest included mTORC1 signaling, p53 signaling, autophagy, TNF-α/NF-κB signaling, and interferon-γ response.
To estimate immune effector-regulatory balance, a CD8A/FOXP3 ratio was calculated for each sample using the formula:
This ratio was used as a continuous index of cytotoxic versus regulatory T-cell predominance.
Single-cell RNA-seq analysis
The GSE108989 dataset was processed using Seurat v4.4. Cells with fewer than 200 detected genes or more than 15% mitochondrial transcripts were excluded. Expression data were log-normalized and scaled; variable genes were identified with FindVariableFeatures(). Module scores for mTORC1, autophagy, and IFNG gene sets were calculated using AddModuleScore() and z-scaled to enable comparison across T-cell subsets. T-cell populations were annotated based on established marker expression: CD8_eff (CD8A+ GZMB+), CD8_exh (CD8A+ PDCD1+ or HAVCR2+), TH1_CXCL13 (CXCL13+ BHLHE40+), Treg (FOXP3+ IL2RA+), and Other_T (unclassified or naive cells). Subset labels were stored in the Seurat metadata for downstream analyses.
Proteomic and phosphoproteomic analyses
CPTAC proteomic and phosphoproteomic data were downloaded from the Proteomic Data Commons (PDC). Raw peptide intensities were log2-transformed and normalized to total protein abundance. TCGA barcodes were used to align samples across genomic and proteomic datasets when applicable.
Tumors were stratified either by TP53 mutation status (mutant vs. wild type) or by TP53 protein abundance, dichotomized at the cohort-wide median into p53-low and p53-high groups. Median-based stratification was chosen to avoid arbitrary thresholds, preserve statistical power, and ensure reproducibility across cohorts lacking established clinical cutpoints for p53 protein expression. Phosphosites-level differences were assessed using the Wilcoxon rank-sum test, with P-values adjusted using the Benjamini-Hochberg false-discovery rate (FDR). Phosphosites were considered biologically relevant based on consistent directionality, effect size (log2fold-change > 0.5), and nominal statistical significance.
Statistical and correlation analyses
All analyses were performed in R version 4.5.1 using tidyverse, ggpubr, ComplexHeatmap, and igraph.
Correlations analyses
Pearson’s correlation was used for linear relationships with Spearman’s rank correlation applied for robustness where appropriate. Fisher’s r-to-z transformation was used to compare correlation coefficients across TP53 classes or T-cell subsets.
Group comparisons
Differences across multiple groups were evaluated using the Kruskal–Wallis test, followed by pairwise Wilcoxon rank-sum tests for post-hoc comparisons.
Confounders assessment
Exploratory multivariable linear models including age, sex, and tumor stage were used to ensure observed associations were not driven by clinical covariates.
Significance threshold
Two-sided FDR-adjusted P < 0.05 was considered statistically significant.
Principal component and derived index analyses
Principal component analysis (PCA) was performed on scaled pathway scores for mTORC1, autophagy, IFNG to identify major axes of immunometabolic variation. The first component (PC1) captured overall metabolic intensity, while the second component (PC2) reflected immune–metabolic divergence. A Metabolic-Immune Index, defined as (mTORC1–autophagy), was plotted against IFNG activity to visualize metabolic-immune polarization across tumor-infiltrating T-cell subsets.
Figures were created in BioRender and RStudio using ggplot2 v3.5.0 for statistical plots, ComplexHeatmap for correlation matrices, and patchwork for multi-panel layouts.
Institutional Review Board (IRB) approval
This study analyzed de-identified, publicly accessible human data from TCGA, CPTAC, and GEO repositories and was therefore exempt from institutional review board approval.
Ethical compliance with human study
This study was conducted in compliance with the ethical standards of the Declaration of Helsinki and all relevant national and institutional guidelines for research using human data.
| Results | ▴Top |
Transcriptomic profiling reveals mTORC1–autophagy antagonism in colorectal tumors
Analysis of the discovery cohort (GSE146009) demonstrated consistent transcriptional differences between paired colorectal tumors and adjacent normal tissues. Correlation analysis across five hallmark pathways—mTORC1 signaling, autophagy, interferon-γ response, TNF-α/NF-κB signaling, and p53 signaling—showed that mTORC1 activity was positively correlated with TNF-α/NF-κB (r = 0.35) and inversely correlated with autophagy (r = −0.37) (Fig. 1a), suggesting reciprocal regulation between anabolic and catabolic programs in tumor tissue.
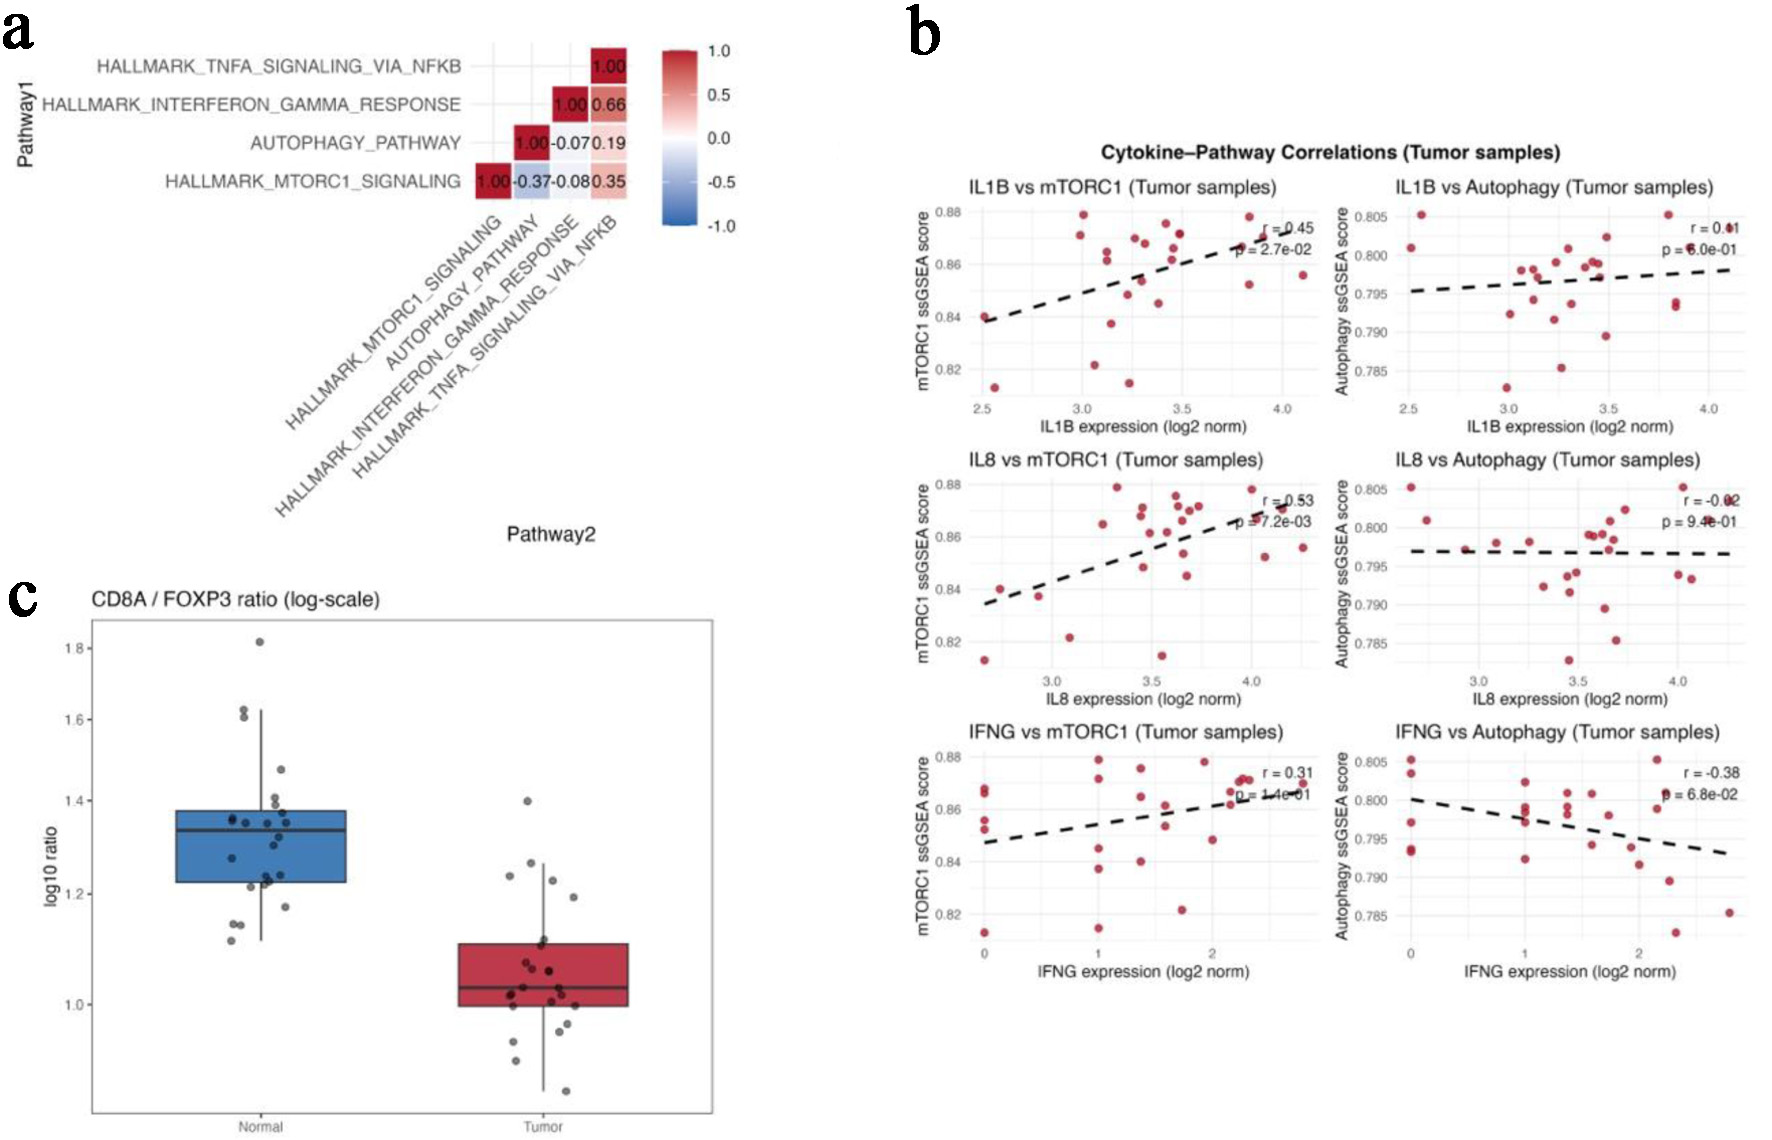 Click for large image | Figure 1. Transcriptomic profiling reveals mTORC1-autophagy antagonism in colorectal tumors (GSE146009). (a) Correlation matrix showing pairwise relationships among mTORC1 signaling, autophagy, interferon-γ response, TNF-α/NF-κB signaling, and p53 pathway scores in paired tumor and normal tissues. (b) Scatterplots showing positive correlations between mTORC1 and IL1B/IL8 expression and an inverse correlation between autophagy and IFNG. (c) Boxplot comparing the CD8A/FOXP3 ratio between paired normal and tumor tissues. Gene-level expression differences for FOXP3, CTLA4, CD274 (PD-L1), and CD8A are summarized in Table 1. |
At the cytokine level, mTORC1 pathway scores correlated positively with IL1B (r = 0.45, P = 0.027) and IL8 (r = 0.53, P = 0.007), whereas autophagy scores showed inverse relationship with IFNG expression (r = −0.38, P = 0.068) (Fig. 1b). These associations are consistent with an inflammatory but immunoregulatory transcriptional state.
Gene-level comparisons demonstrated higher expression of FOXP3, CTLA4, and CD274 (PD-L1) in tumor tissue compared with matched normal samples, while CD8A expression remained unchanged (Table 1). Accordingly, the CD8A/FOXP3 ratio was significantly lower in tumors than in normal tissue (1.06 ± 0.12 vs. 1.34 ± 0.17; Kruskal-Wallis P < 0.01) (Fig. 1c), indicating a relative shift toward regulatory immune features.
 Click to view | Table 1. Differential Expression of Immune-Related Genes Between Normal and Tumor Tissues (GSE146009) |
TP53 mutation class is associated with differential metabolic-immune pathway coupling
In the TCGA-COAD/READ cohort (n = 647), tumors were classified as TP53-wild type (n = 258), missense (n = 287), and null (loss-of-function) (n = 102). Across these groups, coupling between p53 pathway activity and mTORC1 signaling progressively weakened. Strong positive correlation was observed in TP53-wild type tumors (r = 0.50; 95% CI 0.41–0.57), which declined in missense tumors (r = 0.43; 95% CI 0.35–0.50) and was lost in TP53-null tumors (r = −0.05; 95% CI −0.25 to 0.15) (Fig. 2a).
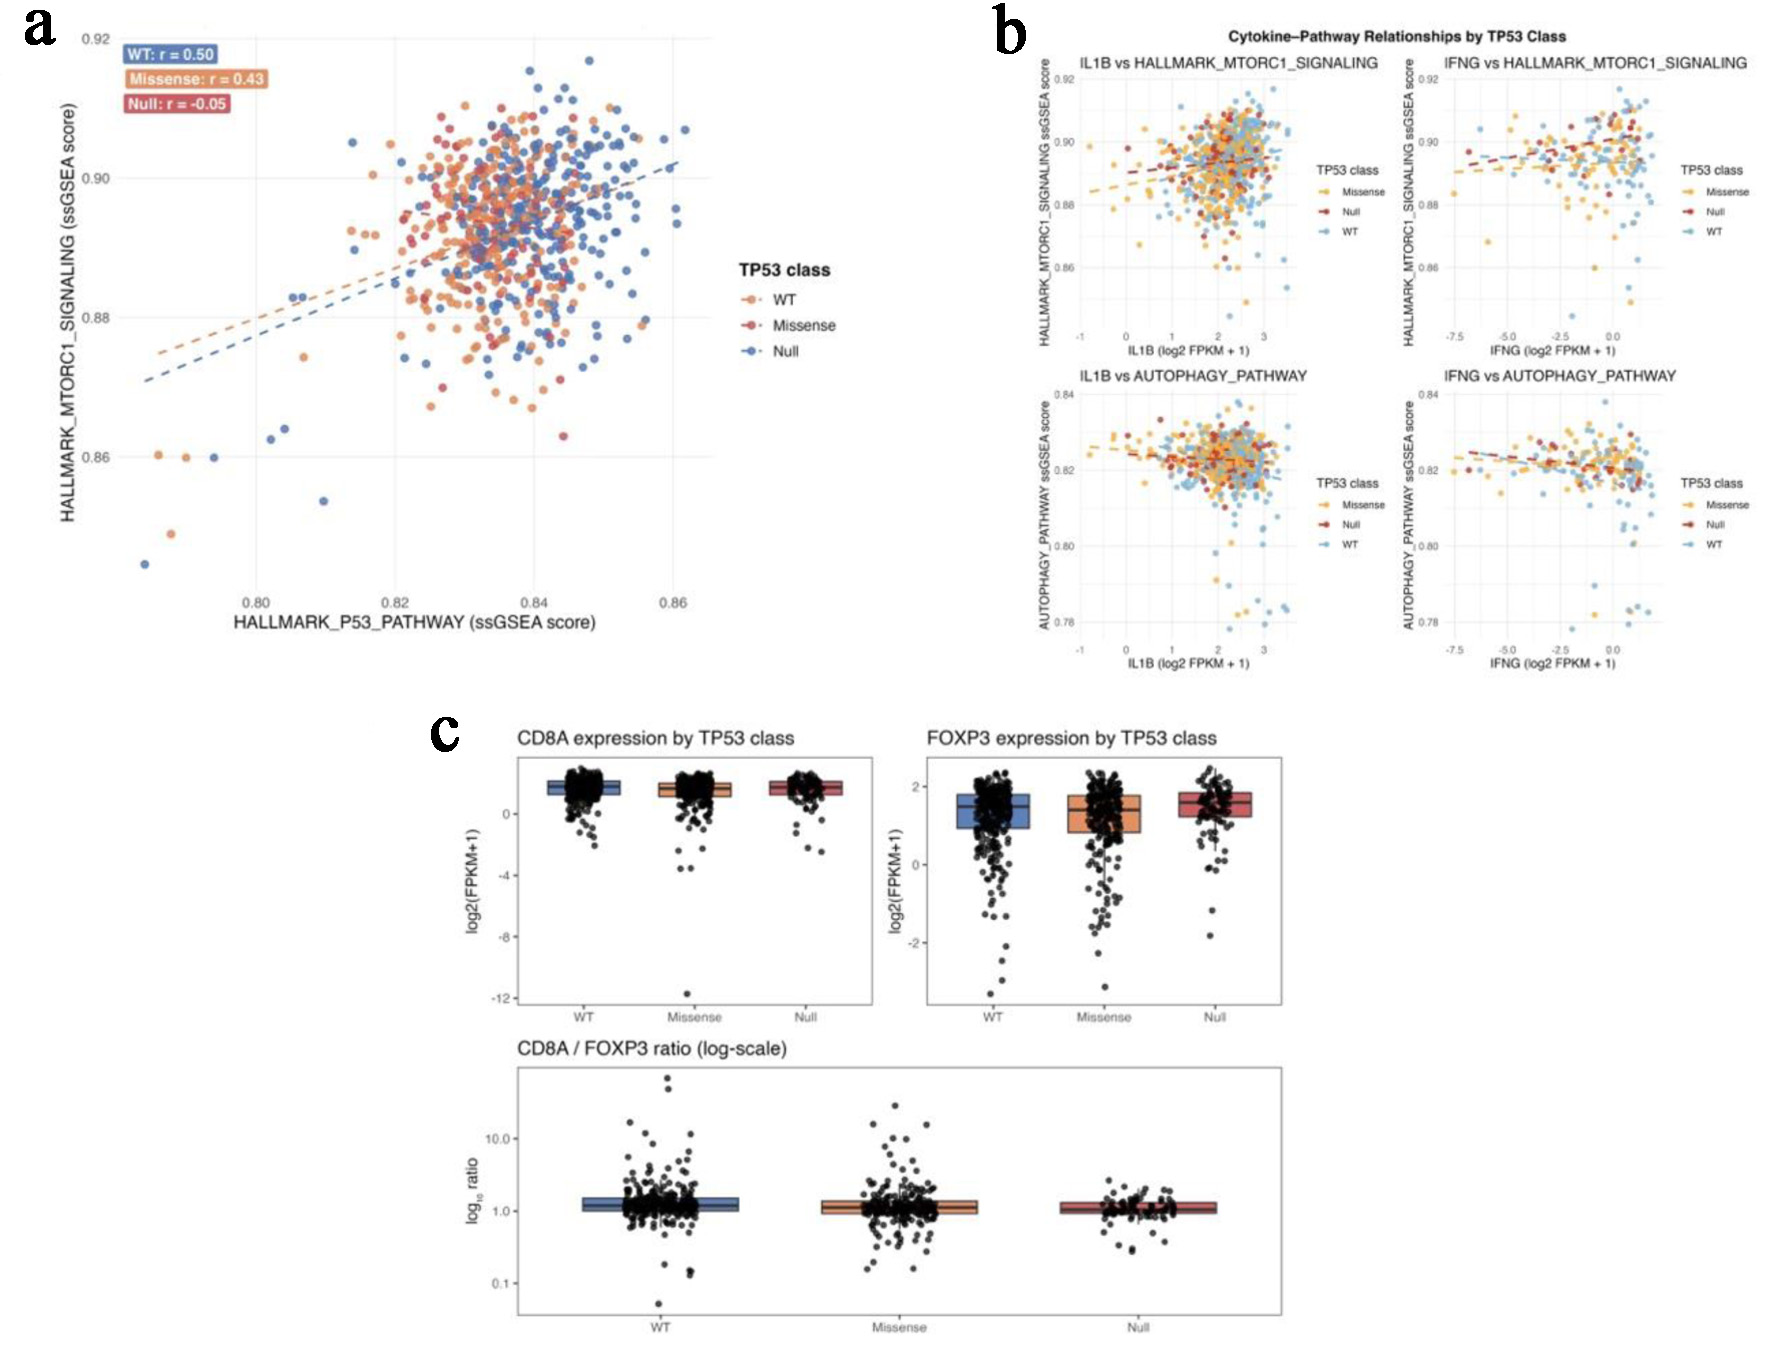 Click for large image | Figure 2. TP53 mutation class predicts metabolic and immune pathway decoupling in TCGA-COAD/READ. (a) Scatterplots of P53-pathway and mTORC1-signaling ssGSEA scores across TP53-wild-type, missense, and null tumors. (b) Correlation plots showing negative autophagy-cytokine coupling in wild-type tumors and positive mTORC1-IFNG coupling in TP53-null tumors. (c) Boxplots of FOXP3 expression and CD8A/FOXP3 ratios across TP53 functional classes. |
Within TP53-wild type tumors, autophagy scores showed modest inverse correlations with IL1B (r = −0.20) and IFNG (r = −0.20), whereas mTORC1 and IFNG were not significantly associated. In contrast, TP53-null tumors demonstrated a positive correlation between mTORC1 and IFNG expression (r = 0.28, P = 0.0045), accompanied by loss of autophagy-cytokine coupling (Fig. 2b).
Expression of FOXP3 increased stepwise from wild-type to missense to null TP53 classes (Kruskal–Wallis P = 0.005), while CD8A expression remained stable across groups. As a result, the CD8A/FOXP3 ratio declined progressively with increasing TP53 dysfunction (wild type > missense > null; P = 4.7 × 10⁻⁵) (Fig. 2c; Table 2), indicating a TP53-associated shift toward regulatory immune dominance.
Click to view | Table 2. TP53 Mutation Class and Immune Gene Expression Summary (TCGA-COAD/READ) |
Single-cell RNA sequencing confirms subset-specific immunometabolic heterogeneity
After quality control of the GSE108989 dataset, 11,138 tumor-infiltrating T cells were retained for analysis. Uniform manifold approximation and projection (UMAP) projection identified five major T-cell populations: CD8_eff, CD8_exh, TH1_CXCL13, Treg, and Other_T (Fig. 3a).
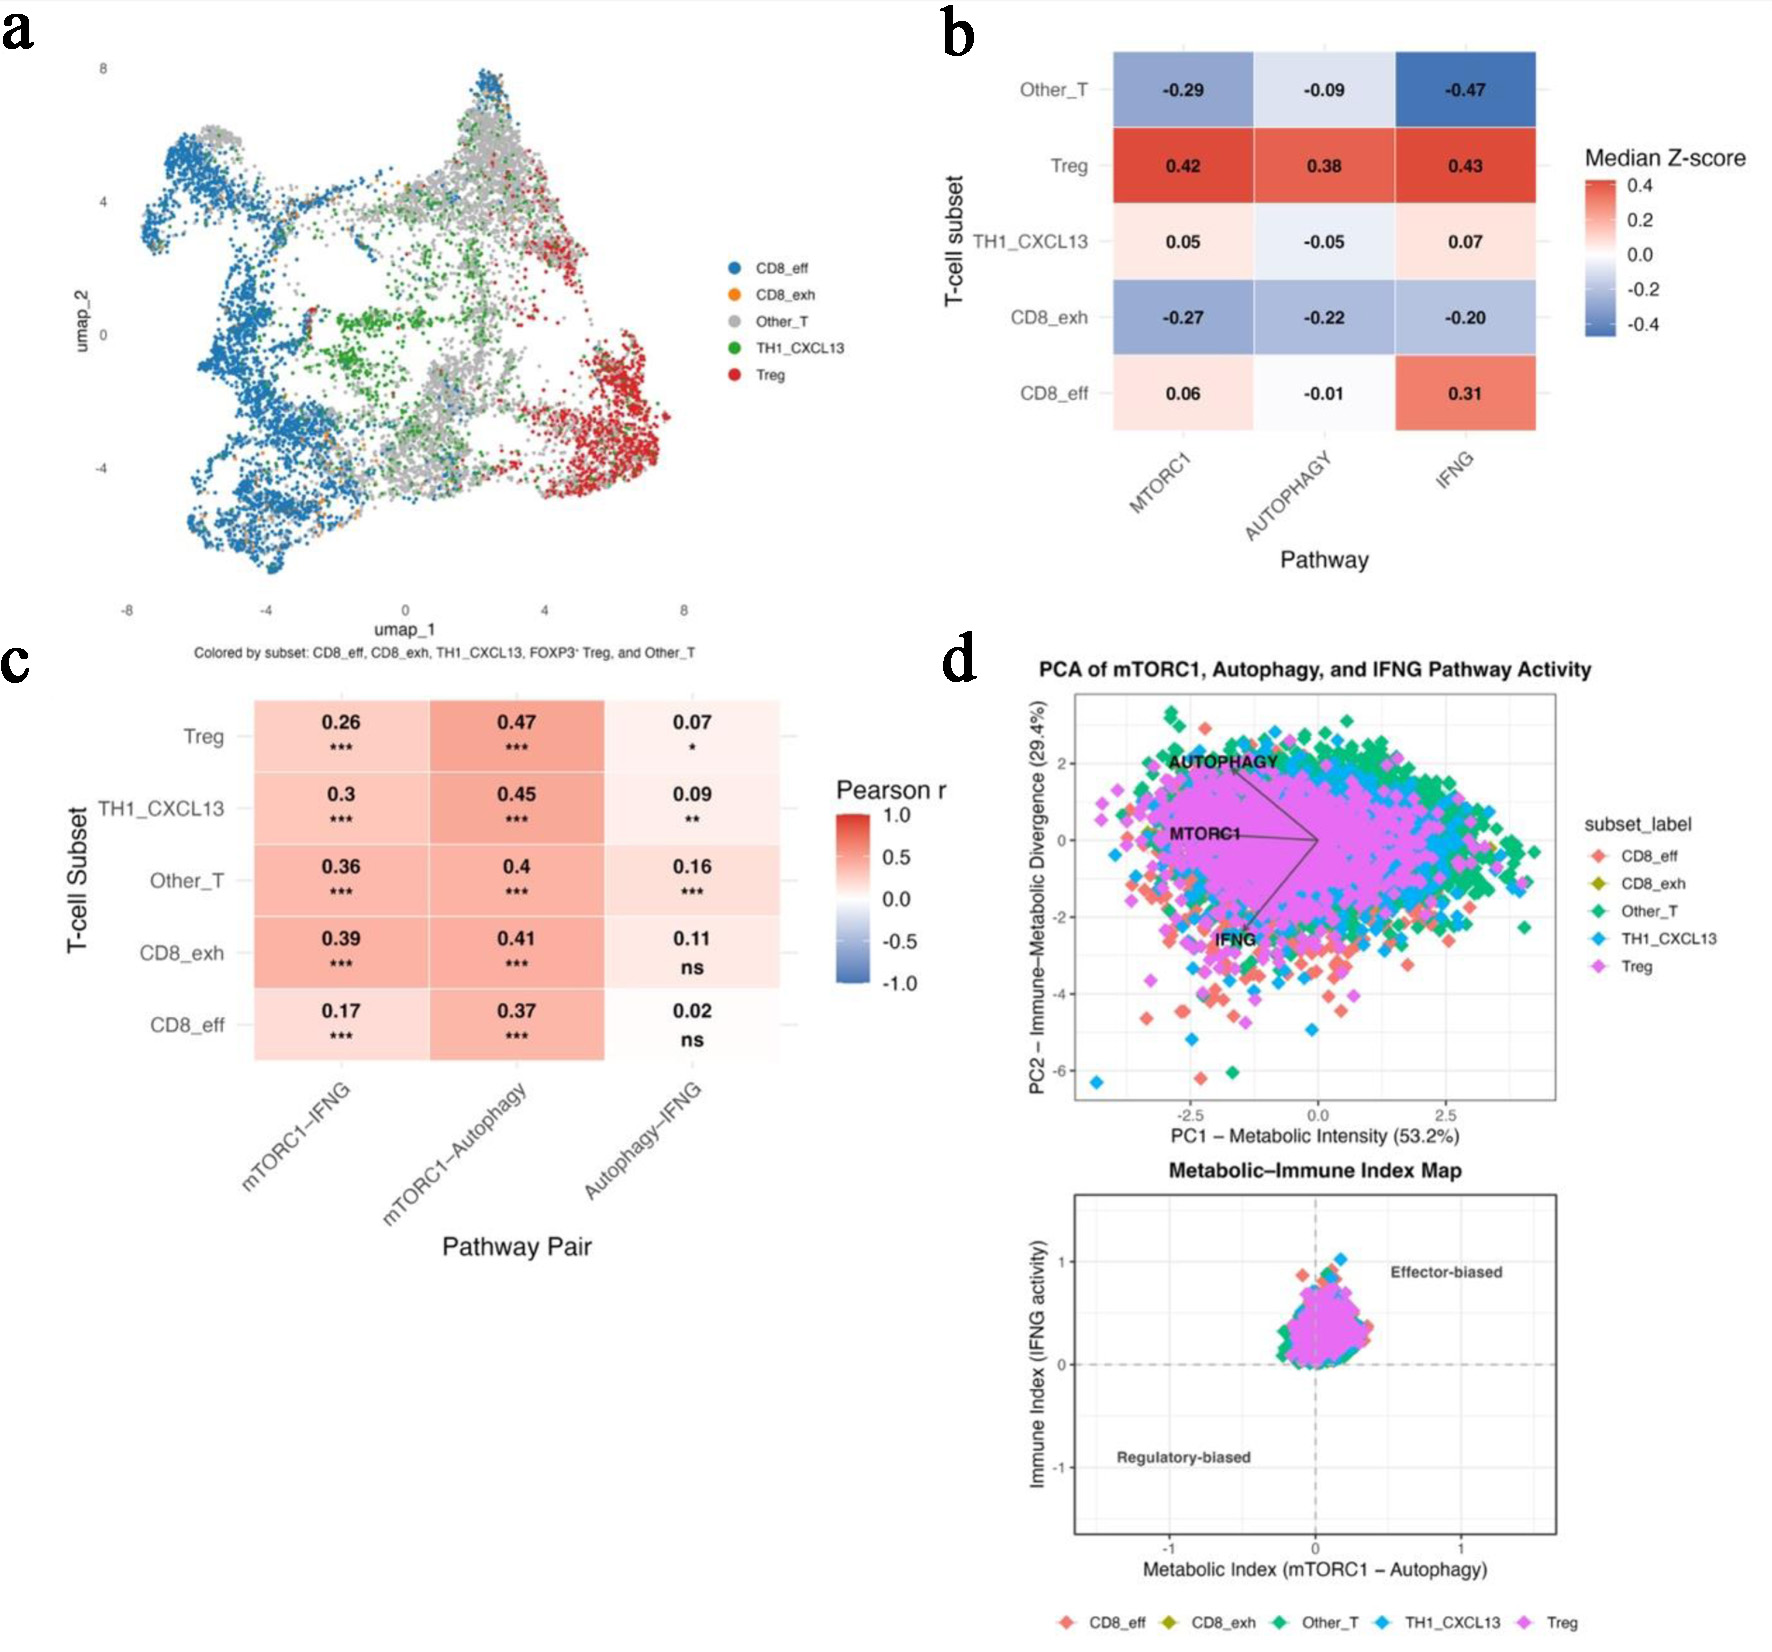 Click for large image | Figure 3. Single-cell RNA-seq analysis confirms subset-specific metabolic heterogeneity (GSE108989). (a) UMAP projection identifying five major T-cell subsets: CD8_eff, CD8_exh, TH1_CXCL13, Treg, and Other_T. (b) Heatmap of median z-scores for mTORC1, autophagy, and IFNG pathway activity across T-cell subsets, illustrating metabolic polarization. (c) Heatmap showing pairwise correlation strengths among mTORC1-autophagy, mTORC1-IFNG, and autophagy-IFNG within each subset. (d) Principal-component analysis illustrating PC1 (metabolic intensity) and PC2 (immune-metabolic divergence) with the derived Metabolic-Immune Index map separating effector and regulatory T-cell states. |
Analysis of z-scored module scores demonstrated marked immunometabolic heterogeneity across subsets (Fig. 3b). Tregs exhibited the highest combined activity of mTORC1, autophagy, and IFN-γ-response pathways, consistent with a metabolically active regulatory phenotype. CD8_eff cells showed moderate mTORC1 and IFN-γ activity with near-basal autophagy, whereas CD8_exh cells displayed uniformly low pathway activity, consistent with metabolic exhaustion. TH1_CXCL13 cells demonstrated intermediate activity, and Other_T cells remained largely quiescent.
Pairwise correlation analysis within each subset showed that mTORC1–autophagy coupling was consistently the strongest relationship (mean r ≈ 0.42 ± 0.04), followed by weaker associations between mTORC1 and IFN-γ (r ≈ 0.30 ± 0.09) and minimal coupling between autophagy and IFN-γ (r ≈ 0.09 ± 0.05) (Fig. 3c). Principal component analysis integrating all three pathways revealed two dominant r axes of variation, separating metabolically intense states from immune-dominant effector states (Fig. 3d, Table 3). Together, these findings indicate that tumor-infiltrating T cells occupy distinct immunometabolic states that parallel the bulk-tumor associations observed with TP53 dysfunction.
Click to view | Table 3. Summary of Principal Component and Metabolic-Immune Index Analyses Across T-Cell Subsets (Fig. 3D) |
Proteomic and phosphoproteomic integration validate post-translational mTORC1 activation under p53 deficiency
To determine whether transcriptomic associations extended to the protein level, CPTAC CRC proteomic and phosphoproteomic datasets were analyzed. In the CPTAC–TCGA matched proteome (PDC000111, n = 95), TP-mutant tumors showed increased abundance of EIF4EBP2 (log2 fold-change = +5.98; FDR = 0.07) and modest increase in RPS6 (log2 fold-change = +0.34; FDR = 0.42), alongside reduced SQSTM1/p62 (log2 fold-change = 23.07; FDR = 0.30) with minimal change in MAP1S (Fig. 4a; Table 4). Although not all differences reached statistical significance after FDR correction, the directionality of changes was consistent with increased mTOR pathway activity and reduced autophagy-related protein accumulation.
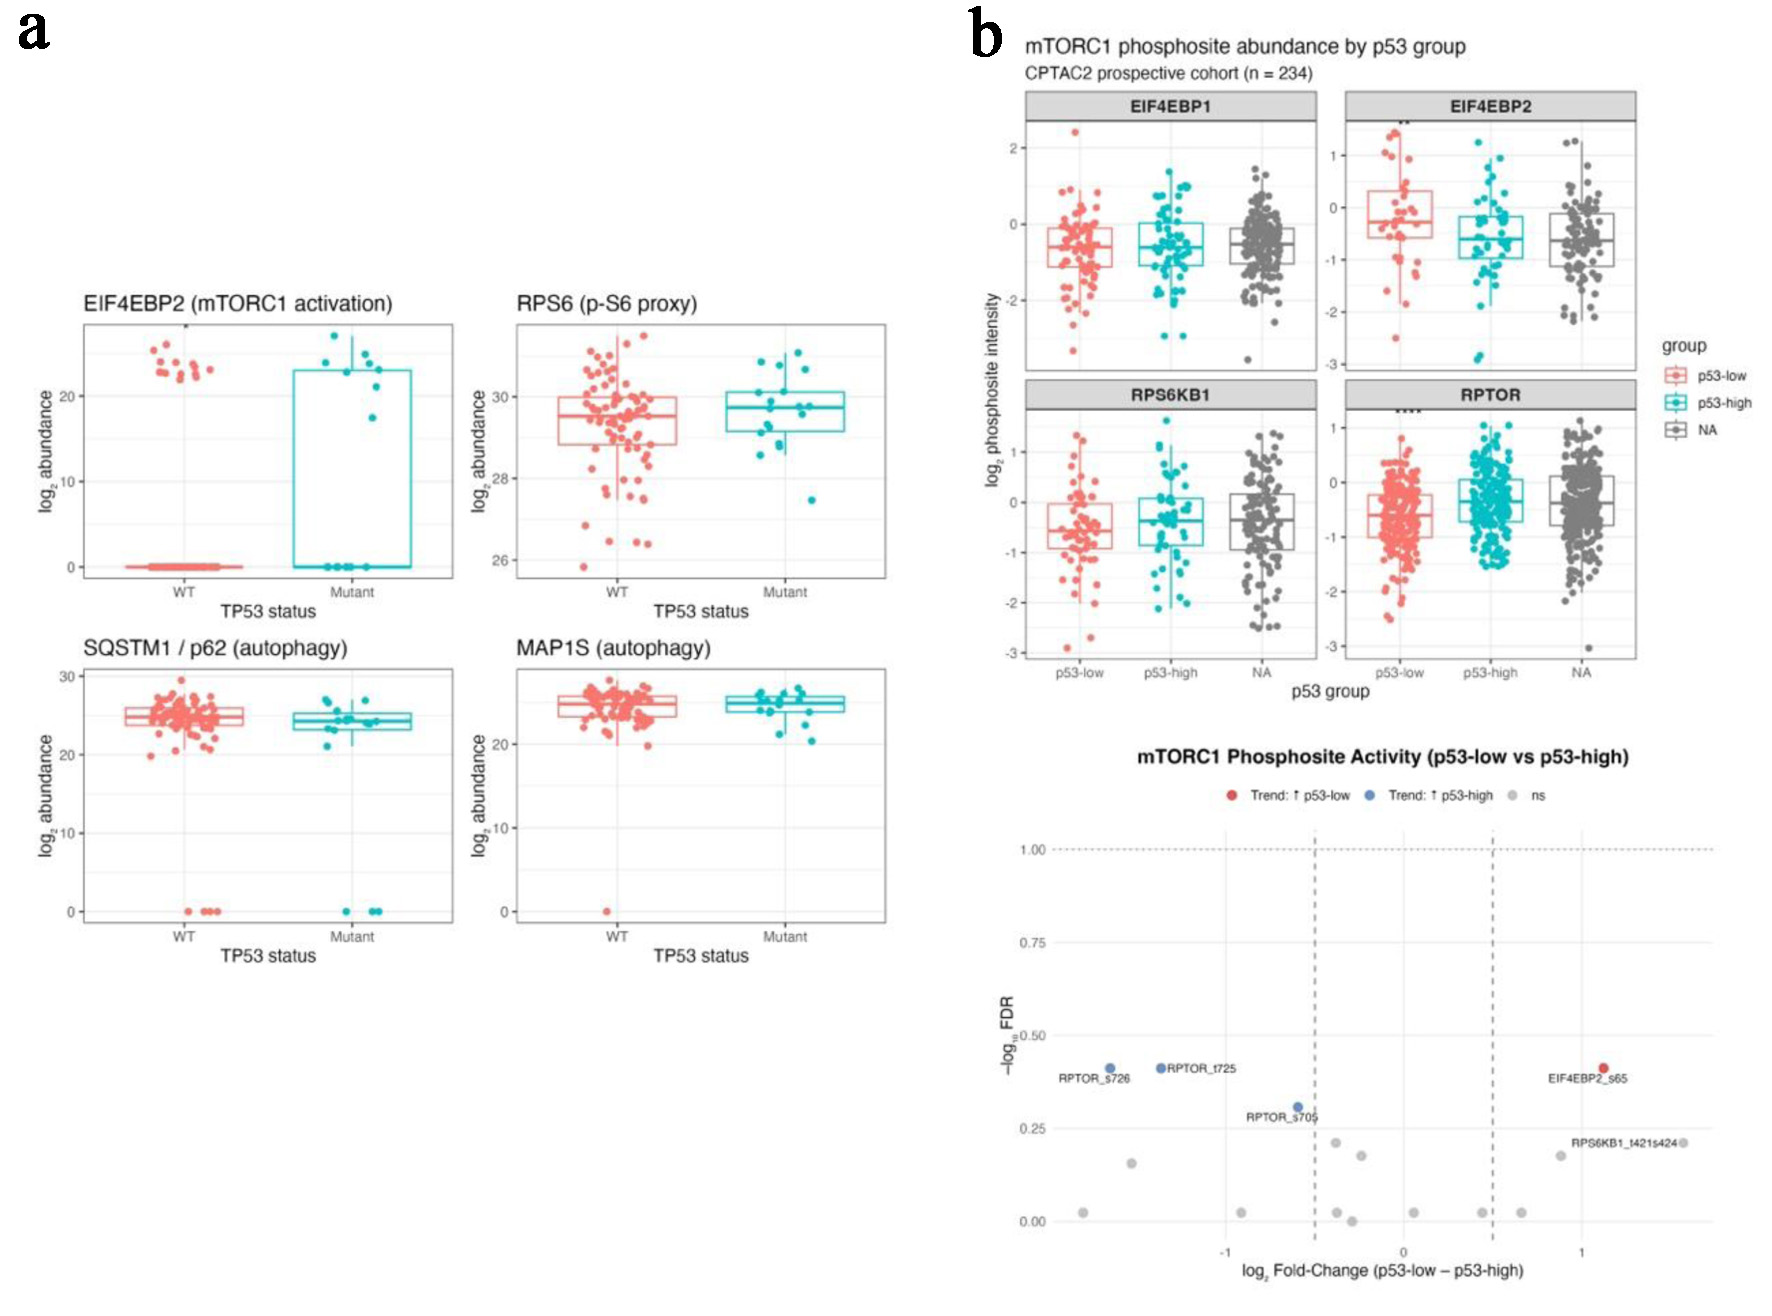 Click for large image | Figure 4. Proteomic and phosphoproteomic integration validates post-translational mTORC1 activation under p53 deficiency (CPTAC colon cohorts). (a) Boxplots comparing protein abundance of EIF4EBP2, RPS6, SQSTM1 (p62), and MAP1S between TP53-mutant and wild-type tumors in the CPTAC-TCGA matched proteome. (b) Bar (upper) and volcano (lower) plots from the CPTAC2 phosphoproteome showing increased phosphorylation of EIF4EBP2 S65 and RPS6KB1 T421/S424 and decreased phosphorylation of inhibitory RPTOR sites (S705, T725, S726) in p53-low tumors. |
Click to view | Table 4. Protein-Level Differences by TP53 Mutation Status (CPTAC–TCGA PDC000111) |
In the CPTAC2 phosphoproteomic cohort (PDC000116-000117, n = 234), tumors with low p53 protein abundance demonstrated increased phosphorylation of canonical mTOR output sites, including EIF4EBP2 S65 and RPS6KB1 T421/S424 (log2 fold-change = +1.1 to +1.6). In contrast, phosphorylation of RPTOR sites (S705/T725/S726) was reduced in p53-low tumors and enriched in p53-high tumors (log2 fold-change = −0.6 to −1.6) (Fig. 4b; Table 5). These phosphosite patterns are consistent with sustained mTOR pathway output in the setting of reduced p53 protein levels.
Click to view | Table 5. Differential Phosphosite Abundance by p53 Protein Level (CPTAC2 PDC000117–000116) |
Integrated multi-omics summary
Integration of bulk transcriptomic, single-cell, and proteomic analyses revealed a consistent association between TP53 dysfunction and coordinated immunometabolic remodeling in CRC. Across independent cohorts, TP-53 mutant or p53-low tumors were characterized by increased mTOR pathway activity, relative attenuation of autophagy-related programs, and immune features indicative of a regulatory-dominant immune-cold TME.
At the transcriptomic level, TP53-altered tumors showed higher mTORC1 signaling scores and lower CD8A/FOXP3 ratios, reflecting a shift toward FOXP3-associated immunoregulation. Single-cell analysis of tumor-infiltrating T cells demonstrated parallel immunometabolic states, with regulatory and exhausted T-cell subsets occupying metabolically active but functionally constrained niches. Proteomic and phosphoproteomic data provided post-translational context to these associations, showing increased phosphorylation of canonical mTOR output sites and reduced phosphorylation of inhibitory regulatory sites in p53-deficient tumors.
Taken together, these convergent observations across molecular layers support a unified model in which TP53 loss is associated with sustained mTOR pathway output, altered autophagy-related signaling, and immune-cold remodeling in CRC. This integrated view provides a mechanistic framework for interpreting TP53-associated immune resistance in MSS disease and informs the therapeutic rationale discussed below.
| Discussion | ▴Top |
This study provides an integrated multi-omics view of how TP53 dysfunction is associated with immunometabolic remodeling in MSS CRC. By combining bulk transcriptomic profiling, single-cell analysis of tumor-infiltrating T cells, and CPTAC proteomic and phosphoproteomic data, we identified a consistent pattern characterized by increased mTOR pathway activity, relative attenuation of autophagy-related programs, and immune-cold features marked by FOXP3 enrichment and reduced CD8A/FOXP3 ratios. Rather than relying on a single molecular layer, our approach emphasizes convergent evidence across independent datasets and platforms, strengthening the biological plausibility of these associations [63–71].
At the transcriptomic level, TP53-mutant tumors exhibited higher mTORC1 signaling scores and lower autophagy activity compared with TP53-wild type tumors. These metabolic alterations were accompanied by increased expression of immunoregulatory genes, including FOXP3, CTLA4, and CD274, and by a progressive reduction in the CD8A/FOXP3 ratio. These observations align with the established role of wild-type p53 in restraining mTORC1 activity and promoting autophagy under conditions of metabolic stress. Loss of this regulatory function is known to permit sustained anabolic signaling, and our data suggest that, in MSS CRC, this metabolic shift is accompanied by immune remodeling toward a more suppressive TME [1, 22, 30, 66–70, 72–74].
Single-cell RNA sequencing extended these associations to the immune compartment. Tumor-infiltrating T cells displayed distinct immunometabolic programs linked to functional state. Regulatory T cells (Tregs) and exhausted CD8+ T cells occupied metabolically active yet cytokine-constrained states, whereas cytotoxic CD8+ effector and TH1-like T cells demonstrated stronger IFNG signaling with more balanced metabolic activity. Although TP53 mutation status was not available at the single-cell level, these subset-specific patterns parallel the bulk-tumor associations observed in TP53-deficient cancers and are consistent with prior work linking mTORC1 signaling to T-cell exhaustion and Treg expansion. Together, these findings suggest that tumor-intrinsic metabolic rewiring associated with TP53 loss may indirectly shape immune-cell function within the TME [30, 31, 75–81].
A key strength of this study is the incorporation of proteomic and phosphoproteomic data, which provide post-translational context to the transcriptomic and cellular findings. In CPTAC cohorts, p53-deficient or p53-low tumors demonstrated increased phosphorylation of canonical mTOR pathway output nodes, including EIF4EBP2 and RPS6KB1, alongside reduced phosphorylation of inhibitory RPTOR sites targeted by AMPK and ULK1 [66–70]. Although not all phosphosite differences reached stringent false-discovery thresholds, the consistent directionality across multiple regulatory nodes supports sustained mTOR pathway output in the setting of reduced p53 activity. This protein-level validation adds mechanistic depth beyond expression-based analyses and addresses a major limitation of prior single-omics studies.
From a clinical perspective, these findings are particularly relevant in MSS CRC, a disease subtype that remains largely resistant to immune checkpoint blockade despite frequent immune-cell infiltration. Current evidence suggests that immune resistance in MSS CRC is not driven solely by low neoantigen burden but is also shaped by metabolic constraints within the TME [4–6, 8, 44, 82]. Our data support this concept by linking TP53-associated mTOR pathway activation to immune-cold features providing a framework for understanding why immune checkpoint inhibitors have limited efficacy in this setting.
Importantly, this study builds on prior work describing p53–mTOR crosstalk and mTOR-driven immunosuppression by integrating genomic, transcriptomic, single-cell, and post-translational proteomic layers within MSS CRC specifically. While earlier studies have demonstrated that TP53 loss can activate mTOR signaling and that high mTORC1 activity correlates with immunosuppressive TME, our findings extend this literature by providing phosphosite-level evidence linking TP53 dysfunction to sustained mTOR pathway output in association with FOXP3-dominant immune remodeling [22, 24, 30, 46, 83]. This integrative approach represents a key contribution beyond mutation-centric or transcriptomics-only analysis (Fig. 5).
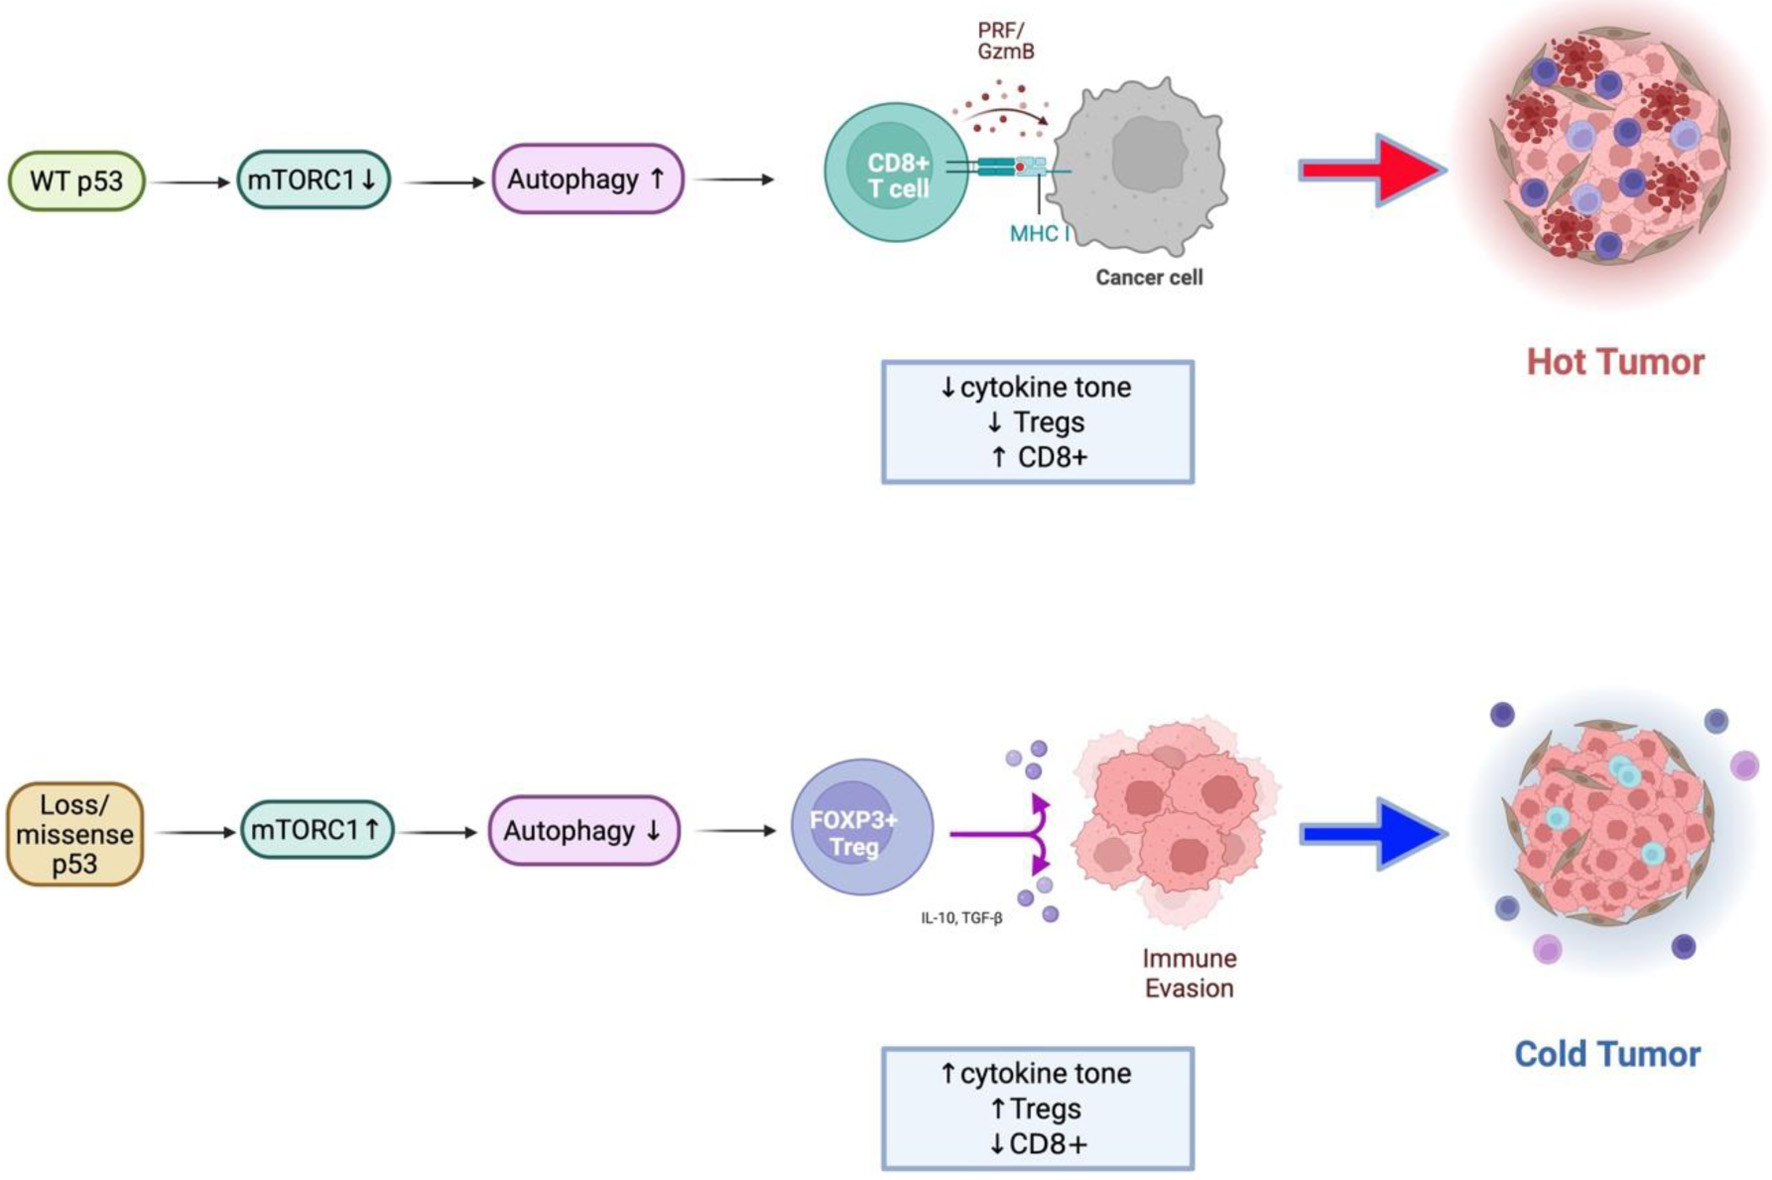 Click for large image | Figure 5. Conceptual model of the TP53–mTORC1–autophagy–immune axis in colorectal cancer. Schematic illustration summarizing the proposed mechanism derived from integrated transcriptomic, single-cell, and proteomic analyses. Upper: In wild-type p53 tumors, p53 restrains mTORC1 activity through AMPK/ULK1-mediated phosphorylation of RPTOR and promotes autophagy, maintaining metabolic balance and supporting effective antitumor immune function. Lower: In TP53-mutant or null tumors, loss of p53 control leads to constitutive mTORC1 activation and suppression of autophagy. These changes drive increased cytokine signaling (IL1B, IFNG), metabolic stress adaptation, and enrichment of FOXP3+ regulatory T cells, resulting in an immune-cold, immunosuppressive tumor microenvironment. |
These observations have potential implications for therapeutic strategy. The phosphoproteomic signatures observed in p53-deficient tumors implicate downstream mTOR output nodes, suggesting that mTOR kinase inhibition (targeting both TORC1 and TORC2) may be more effective than selective TORC1 inhibition alone. In this context, combining mTOR pathway inhibition with immune checkpoint blockade may help restore metabolic balance and improve antitumor immune function in TP53-mutant MSS CRC, as supported by emerging preclinical and early clinical data [63, 64, 84–87]. TP53 status, together with markers of mTOR pathway activity and immune balance, may therefore serve as useful biomarkers for patient stratification in future trials.
Several limitations should be acknowledged. This study is retrospective and hypothesis-generating, and the associations described do not establish causality. Functional validation in experimental models will be required to directly test whether TP53 loss drives mTOR-dependent autophagy suppression and immune remodeling. In addition, other components of the TME, including stromal, myeloid, and microbiome-related factors, may further influence immunometabolic states beyond TP53 status alone [4, 8, 88]. Nonetheless, the consistency of findings across multiple omics layers and independent cohorts supports the robustness of the observed associations.
In summary, this study identifies a reproducible, multi-omics signature linking TP53 dysfunction with sustained mTOR pathway activity, altered autophagy-related signaling, and immune-cold remodeling in CRC. By integrating transcriptomic, single-cell, and proteomic data, these findings provide mechanistic context for immune resistance in MSS CRC and support rational, biomarker-informed strategies targeting the TP53–mTOR–autophagy axis to overcome therapeutic resistance.
Acknowledgments
The authors thank the Clinical Proteomic Tumor Analysis Consortium (CPTAC), The Cancer Genome Atlas (TCGA), and the NCBI Gene Expression Omnibus (GEO) for providing open-access genomic and proteomic datasets that made this research possible. The authors are also grateful to colleagues at Rutgers Health Community Medical Center for their feedback and discussion during manuscript preparation.
Financial Disclosure
This research received no external funding. The article processing charge (APC) was supported by Rutgers Health Community Medical Center, Toms River, New Jersey, USA.
Conflict of Interest
The authors declare no conflicts of interest relevant to this study. The funders had no role in the design of the study, data collection, analysis, interpretation, manuscript writing, or decision to publish the results.
Informed Consent
Not applicable. The study used only publicly available, de-identified datasets (TCGA, CPTAC, GEO) with no direct involvement of human participants.
Author Contributions
Conceptualization and methodology: Eunseuk Lee; data analysis and visualization: Eunseuk Lee; validation and interpretation: Eunseuk Lee, Dana Al-Assi, Randy Rivera-Rueda; writing – original draft preparation: Eunseuk Lee; writing – review and editing: Dana Al-Assi, Randy Rivera-Rueda; literature verification and reference management: Sharon Susan Paul, Aksa Joy; supervision and project administration: Eunseuk Lee. All authors have read and approved the final version of the manuscript.
Data Availability
Bulk and single-cell transcriptomic datasets are available through the NCBI Gene Expression Omnibus (GSE146009, GSE108989). TCGA-COAD/READ datasets can be accessed through the Genomic Data Commons, and proteomic datasets (PDC000111, PDC000116-117) through the Proteomic Data Commons. Custom R scripts used for preprocessing, ssGSEA scoring, and single-cell module analysis are available from the corresponding author upon reasonable request.
Abbreviations
AMPK: AMP-activated protein kinase; APC: antigen-presenting cell; ATR: ataxia telangiectasia and Rad3-related protein; ATG16L1: autophagy-related gene 16-like 1; BRAF: v-Raf murine sarcoma viral oncogene homolog B1; CD274 (PD-L1): programmed death-ligand 1; CD8A: cluster of differentiation 8 alpha; CRC: colorectal cancer; CPTAC: Clinical Proteomic Tumor Analysis Consortium; CTLA4: cytotoxic T-lymphocyte-associated protein 4; DRAM: damage-regulated autophagy modulator; EIF4EBP1/2: eukaryotic translation initiation factor 4E-binding protein 1/2; FDR: false discovery rate; FOXP3: forkhead box protein P3; FPKM: fragments per kilobase of transcript per million mapped reads; GDC: Genomic Data Commons; GEO: Gene Expression Omnibus; GOF: Gain of Function; GSVA: Gene Set Variation Analysis; IFNG: interferon gamma; ICI: immune checkpoint inhibitor; IL1B: interleukin 1 beta; IL2RA: interleukin 2 receptor alpha; IL8: interleukin 8; IRB: Institutional Review Board; KRAS: Kirsten rat sarcoma viral oncogene homolog; LC3B: microtubule-associated protein 1 light chain 3 beta; MAF: mutation annotation format; MAP1S: microtubule-associated protein 1S; mTORC1: mechanistic target of rapamycin complex 1; MSS: microsatellite stable; MSI-H: microsatellite instability-high; NCCN: National Comprehensive Cancer Network; NK: natural killer; OXPHOS: oxidative phosphorylation; p62 (SQSTM1): sequestosome 1; PCA: principal component analysis; PC1/PC2: principal component 1/principal component 2; PD-1: programmed cell death protein 1; PD-L1: programmed death-ligand 1; PDC: Proteomic Data Commons; PDTX: patient-derived tumor xenograft; PI3K: phosphatidylinositol 3-kinase; PKM2: pyruvate kinase M2 isoform; PLK1: Polo-like kinase 1; RPS6: ribosomal protein S6; RPTOR: regulatory associated protein of mTOR; RNA-seq: RNA sequencing; ROS: reactive oxygen species; ssGSEA: single-sample gene set enrichment analysis; TCA: tricarboxylic acid; TCGA: The Cancer Genome Atlas; TCR: T-cell receptor; Tfh: T follicular helper cell; TH1_CXCL13: T helper 1-like CXCL13-positive subset; TME: tumor microenvironment; TNFA: tumor necrosis factor alpha; TP53: tumor protein p53 gene; Treg: regulatory T cell; ULK1: Unc-51-like autophagy activating kinase 1; UMAP: uniform manifold approximation and projection; WT: wild type
| References | ▴Top |
- Michel M, Kaps L, Maderer A, Galle PR, Moehler M. The role of p53 dysfunction in colorectal cancer and its implication for therapy. Cancers (Basel). 2021;13(10).
doi pubmed - Leiphrakpam PD, Are C. PI3K/Akt/mTOR signaling pathway as a target for colorectal cancer treatment. Int J Mol Sci. 2024;25(6).
doi pubmed - Hu W, Chen S, Thorne RF, Wu M. TP53, TP53 Target genes (DRAM, TIGAR), and autophagy. Adv Exp Med Biol. 2019;1206:127-149.
doi pubmed - Chen E, Zhou W. Immunotherapy in microsatellite-stable colorectal cancer: Strategies to overcome resistance. Crit Rev Oncol Hematol. 2025;212:104775.
doi pubmed - Yousefi M, Amirabadi DG, Javan MR, Khosrojerdi A. Immune escape in colorectal cancer: Mechanisms and challenges of immune checkpoint inhibitor resistance. Int Immunopharmacol. 2026;169:115986.
doi pubmed - Kim CW, Chon HJ, Kim C. Combination immunotherapies to overcome intrinsic resistance to checkpoint blockade in microsatellite stable colorectal cancer. Cancers (Basel). 2021;13(19).
doi pubmed - Yang Q, Huang G, Li L, Li E, Xu L. Potential mechanism of immune evasion associated with the master regulator ASCL2 in microsatellite stability in colorectal cancer. J Immunol Res. 2021;2021:5964752.
doi pubmed - Fumet JD, Latour C, Nuttin L, Derangere V, Ilie A, Russo P, Hampe L, et al. Tumor-associated macrophages produce PGE2 to promote CD8+ T cell exhaustion and drive resistance to PD-L1 blockade in microsatellite stable colorectal cancer. Cancer Res. 2025.
doi pubmed - Pan M, Tse P, et al. Association of TP53 mutation with decreased prevalence of MSI-H, RAS, and PIK3CA mutations in metastatic colorectal cancer. J Clin Oncol. 2021.
- Hassin O, Nataraj NB, Shreberk-Shaked M, Aylon Y, Yaeger R, Fontemaggi G, Mukherjee S, et al. Different hotspot p53 mutants exert distinct phenotypes and predict outcome of colorectal cancer patients. Nat Commun. 2022;13(1):2800.
doi pubmed - Li J, Pan Y, Guo F, Wang C, Liang L, Li P, Liang W, et al. Patterns in genomic mutations among patients with early-onset colorectal cancer: an international, multicohort, observational study. Lancet Oncol. 2025;26(8):1055-1066.
doi pubmed - Liebl MC, Hofmann TG. The role of p53 signaling in colorectal cancer. Cancers (Basel). 2021;13(9).
doi pubmed - Bond CE, Umapathy A, Ramsnes I, Greco SA, Zhen Zhao Z, Mallitt KA, Buttenshaw RL, et al. p53 mutation is common in microsatellite stable, BRAF mutant colorectal cancers. Int J Cancer. 2012;130(7):1567-1576.
doi pubmed - Nakayama M, Oshima M. Mutant p53 in colon cancer. J Mol Cell Biol. 2019;11(4):267-276.
doi pubmed - Afzal O, Altamimi ASA, Mubeen B, Alzarea SI, Almalki WH, Al-Qahtani SD, Atiya EM, et al. mTOR as a potential target for the treatment of microbial infections, inflammatory bowel diseases, and colorectal cancer. Int J Mol Sci. 2022;23(20).
doi pubmed - Rajendran D, Oon CE. Navigating therapeutic prospects by modulating autophagy in colorectal cancer. Life Sci. 2024;358:123121.
doi pubmed - Li L, Jiang D, Liu H, Guo C, Zhang Q, Li X, Chen X, et al. Comprehensive proteogenomic profiling reveals the molecular characteristics of colorectal cancer at distinct stages of progression. Cancer Res. 2024;84(17):2888-2910.
doi pubmed - Coronel L, Hackes D, Schwab K, Riege K, Hoffmann S, Fischer M. p53-mediated AKT and mTOR inhibition requires RFX7 and DDIT4 and depends on nutrient abundance. Oncogene. 2022;41(7):1063-1069.
doi pubmed - Feng Z, Hu W, de Stanchina E, Teresky AK, Jin S, Lowe S, Levine AJ. The regulation of AMPK beta1, TSC2, and PTEN expression by p53: stress, cell and tissue specificity, and the role of these gene products in modulating the IGF-1-AKT-mTOR pathways. Cancer Res. 2007;67(7):3043-3053.
doi pubmed - Feng Z, Zhang H, Levine AJ, Jin S. The coordinate regulation of the p53 and mTOR pathways in cells. Proc Natl Acad Sci U S A. 2005;102(23):8204-8209.
doi pubmed - Feng Z. p53 regulation of the IGF-1/AKT/mTOR pathways and the endosomal compartment. Cold Spring Harb Perspect Biol. 2010;2(2):a001057.
doi pubmed - Agarwal S, Bell CM, Taylor SM, Moran RG. p53 deletion or hotspot mutations enhance mTORC1 activity by altering lysosomal dynamics of TSC2 and Rheb. Mol Cancer Res. 2016;14(1):66-77.
doi pubmed - Cui D, Qu R, Liu D, Xiong X, Liang T, Zhao Y. The cross talk between p53 and mTOR pathways in response to physiological and genotoxic stresses. Front Cell Dev Biol. 2021;9:775507.
doi pubmed - Cordani M, Oppici E, Dando I, Butturini E, Dalla Pozza E, Nadal-Serrano M, Oliver J, et al. Mutant p53 proteins counteract autophagic mechanism sensitizing cancer cells to mTOR inhibition. Mol Oncol. 2016;10(7):1008-1029.
doi pubmed - Kennel KB, Greten FR. The immune microenvironment of colorectal cancer. Nat Rev Cancer. 2025;25(12):945-964.
doi pubmed - Gandini A, Puglisi S, Pirrone C, Martelli V, Catalano F, Nardin S, Seeber A, et al. The role of immunotherapy in microsatellites stable metastatic colorectal cancer: state of the art and future perspectives. Front Oncol. 2023;13:1161048.
doi pubmed - Budanov AV, Karin M. p53 target genes sestrin1 and sestrin2 connect genotoxic stress and mTOR signaling. Cell. 2008;134(3):451-460.
doi pubmed - Gulow K, Tumen D, Kunst C. The Important Role of Protein Kinases in the p53 Sestrin Signaling Pathway. Cancers (Basel). 2023;15(22).
doi pubmed - Patel CH, Powell JD. More TOR: The expanding role of mTOR in regulating immune responses. Immunity. 2025;58(7):1629-1645.
doi pubmed - Mafi S, Mansoori B, Taeb S, Sadeghi H, Abbasi R, Cho WC, Rostamzadeh D. mTOR-mediated regulation of immune responses in cancer and tumor microenvironment. Front Immunol. 2021;12:774103.
doi pubmed - Braun C, Weichhart T. mTOR-dependent immunometabolism as Achilles' heel of anticancer therapy. Eur J Immunol. 2021;51(12):3161-3175.
doi pubmed - Gestal-Mato U, Herhaus L. Autophagy-dependent regulation of MHC-I molecule presentation. J Cell Biochem. 2024;125(11):e30416.
doi pubmed - Koustas E, Trifylli EM, Sarantis P, Papadopoulos N, Papanikolopoulos K, Aloizos G, Damaskos C, et al. Exploiting autophagy-dependent neoantigen presentation in tumor microenvironment. Genes (Basel). 2023;14(2).
doi pubmed - Munz C. Canonical and non-canonical functions of the autophagy machinery in MHC restricted antigen presentation. Front Immunol. 2022;13:868888.
doi pubmed - Ding K, Mou P, Wang Z, Liu S, Liu J, Lu H, Yu G. The next bastion to be conquered in immunotherapy: microsatellite stable colorectal cancer. Front Immunol. 2023;14:1298524.
doi pubmed - Yang K, Chi H. mTOR and metabolic pathways in T cell quiescence and functional activation. Semin Immunol. 2012;24(6):421-428.
doi pubmed - Linke M, Fritsch SD, Sukhbaatar N, Hengstschlager M, Weichhart T. mTORC1 and mTORC2 as regulators of cell metabolism in immunity. FEBS Lett. 2017;591(19):3089-3103.
doi pubmed - Huang H, Long L, Zhou P, Chapman NM, Chi H. mTOR signaling at the crossroads of environmental signals and T-cell fate decisions. Immunol Rev. 2020;295(1):15-38.
doi pubmed - Deng L, Qian G, Zhang S, Zheng H, Fan S, Lesinski GB, Owonikoko TK, et al. Inhibition of mTOR complex 1/p70 S6 kinase signaling elevates PD-L1 levels in human cancer cells through enhancing protein stabilization accompanied with enhanced beta-TrCP degradation. Oncogene. 2019;38(35):6270-6282.
doi pubmed - Liu HJ, Du H, Khabibullin D, Zarei M, Wei K, Freeman GJ, Kwiatkowski DJ, et al. mTORC1 upregulates B7-H3/CD276 to inhibit antitumor T cells and drive tumor immune evasion. Nat Commun. 2023;14(1):1214.
doi pubmed - Liu X, Xu X, Wu Z, Shan Q, Wang Z, Wu Z, Ding X, et al. Integrated single-cell RNA-seq analysis identifies immune heterogeneity associated with KRAS/TP53 mutation status and tumor-sideness in colorectal cancers. Front Immunol. 2022;13:961350.
doi pubmed - Nicolini A, Ferrari P. Involvement of tumor immune microenvironment metabolic reprogramming in colorectal cancer progression, immune escape, and response to immunotherapy. Front Immunol. 2024;15:1353787.
doi pubmed - Wang J, Xiu J, Farrell A, Baca Y, Arai H, Battaglin F, Kawanishi N, et al. Mutational analysis of microsatellite-stable gastrointestinal cancer with high tumour mutational burden: a retrospective cohort study. Lancet Oncol. 2023;24(2):151-161.
doi pubmed - Wang Q, Yu M, Zhang S. The characteristics of the tumor immune microenvironment in colorectal cancer with different MSI status and current therapeutic strategies. Front Immunol. 2024;15:1440830.
doi pubmed - Chen E, Mo Y, Yi J, Liu J, Luo T, Li Z, Lin Z, et al. A novel hepatocellular carcinoma-specific mTORC1-related signature for anticipating prognosis and immunotherapy. Aging (Albany NY). 2023;15(16):7933-7955.
doi pubmed - Romeo MA, Gilardini Montani MS, Benedetti R, Arena A, D'Orazi G, Cirone M. p53-R273H sustains ROS, pro-inflammatory cytokine release and mTOR activation while reducing autophagy, mitophagy and UCP2 expression, effects prevented by wtp53. Biomolecules. 2021;11(3).
doi pubmed - Akeno N, Miller AL, Ma X, Wikenheiser-Brokamp KA. p53 suppresses carcinoma progression by inhibiting mTOR pathway activation. Oncogene. 2015;34(5):589-599.
doi pubmed - He Z, Hu X, Liu W, Dorrance A, Garzon R, Houghton PJ, Shen C. P53 suppresses ribonucleotide reductase via inhibiting mTORC1. Oncotarget. 2017;8(25):41422-41431.
doi pubmed - Garcia-Garcia C, Rivas MA, Ibrahim YH, Calvo MT, Gris-Oliver A, Rodriguez O, Grueso J, et al. MEK plus PI3K/mTORC1/2 therapeutic efficacy is impacted by TP53 mutation in preclinical models of colorectal cancer. Clin Cancer Res. 2015;21(24):5499-5510.
doi pubmed - Moschetta M, Reale A, Marasco C, Vacca A, Carratu MR. Therapeutic targeting of the mTOR-signalling pathway in cancer: benefits and limitations. Br J Pharmacol. 2014;171(16):3801-3813.
doi pubmed - Mir SA, Dar A, Alshehri SA, Wahab S, Hamid L, Almoyad MAA, Ali T, et al. Exploring the mTOR signalling pathway and its inhibitory scope in cancer. Pharmaceuticals (Basel). 2023;16(7).
doi pubmed - Populo H, Lopes JM, Soares P. The mTOR signalling pathway in human cancer. Int J Mol Sci. 2012;13(2):1886-1918.
doi pubmed - Cargnello M, Tcherkezian J, Roux PP. The expanding role of mTOR in cancer cell growth and proliferation. Mutagenesis. 2015;30(2):169-176.
doi pubmed - Hua H, Kong Q, Zhang H, Wang J, Luo T, Jiang Y. Targeting mTOR for cancer therapy. J Hematol Oncol. 2019;12(1):71.
doi pubmed - Lu Q, Wang J, Yu G, Guo T, Hu C, Ren P. Expression and clinical significance of mammalian target of rapamycin/P70 ribosomal protein S6 kinase signaling pathway in human colorectal carcinoma tissue. Oncol Lett. 2015;10(1):277-282.
doi pubmed - Johnson SM, Gulhati P, Rampy BA, Han Y, Rychahou PG, Doan HQ, Weiss HL, et al. Novel expression patterns of PI3K/Akt/mTOR signaling pathway components in colorectal cancer. J Am Coll Surg. 2010;210(5):767-776.
doi pubmed - Acosta-Jaquez HA, Keller JA, Foster KG, Ekim B, Soliman GA, Feener EP, Ballif BA, et al. Site-specific mTOR phosphorylation promotes mTORC1-mediated signaling and cell growth. Mol Cell Biol. 2009;29(15):4308-4324.
doi pubmed - Wang D, Chen J, Guo F, Chen H, Duan Z, Wei MY, Xu QM, et al. Clinical significance of mTOR and p-mTOR protein expression in human colorectal carcinomas. Asian Pac J Cancer Prev. 2011;12(10):2581-2584.
pubmed - Huang Z, Mandelkow T, Debatin NF, Lurati MCJ, Ebner J, Raedler JB, Bady E, et al. A Tc1- and Th1-T-lymphocyte-rich tumor microenvironment is a hallmark of MSI colorectal cancer. J Pathol. 2025;266(2):192-203.
doi pubmed - Huang X, Feng D, Mitra S, Andretta ES, Hooshdaran NB, Ghelani AP, Wang EY, et al. Opposing functions of distinct regulatory T cell subsets in colorectal cancer. Immunity. 2026;59(1):145-160.e149.
doi pubmed - Frei AL, McGuigan A, Sinha R, Jabbar F, Gneo L, Tomasevic T, Harkin A, et al. Multiplex analysis of intratumoural immune infiltrate and prognosis in patients with stage II-III colorectal cancer from the SCOT and QUASAR 2 trials: a retrospective analysis. Lancet Oncol. 2024;25(2):198-211.
doi pubmed - Taraborrelli L, Senbabaoglu Y, Wang L, Lim J, Blake K, Kljavin N, Gierke S, et al. Tumor-intrinsic expression of the autophagy gene Atg16l1 suppresses anti-tumor immunity in colorectal cancer. Nat Commun. 2023;14(1):5945.
doi pubmed - El Hage A, Dormond O. Combining mTOR inhibitors and T Cell-based immunotherapies in cancer treatment. Cancers (Basel). 2021;13(6).
doi pubmed - Langdon S, Hughes A, Taylor MA, Kuczynski EA, Mele DA, Delpuech O, Jarvis L, et al. Combination of dual mTORC1/2 inhibition and immune-checkpoint blockade potentiates anti-tumour immunity. Oncoimmunology. 2018;7(8):e1458810.
doi pubmed - Mandic M, Misirkic Marjanovic M, Janjetovic K, Bosnjak M, Harhaji-Trajkovic L, Trajkovic V, Vucicevic L. Multifaceted role of AMPK in autophagy: more than a simple trigger? Am J Physiol Cell Physiol. 2025;329(5):C1380-C1397.
doi pubmed - Holczer M, Hajdu B, Lorincz T, Szarka A, Banhegyi G, Kapuy O. A double negative feedback loop between mTORC1 and AMPK kinases guarantees precise autophagy induction upon cellular stress. Int J Mol Sci. 2019;20(22).
doi pubmed - Holczer M, Hajdu B, Lorincz T, Szarka A, Banhegyi G, Kapuy O. Fine-tuning of AMPK-ULK1-mTORC1 regulatory triangle is crucial for autophagy oscillation. Sci Rep. 2020;10(1):17803.
doi pubmed - Lee JW, Park S, Takahashi Y, Wang HG. The association of AMPK with ULK1 regulates autophagy. PLoS One. 2010;5(11):e15394.
doi pubmed - Smiles WJ, Ovens AJ, Kemp BE, Galic S, Petersen J, Oakhill JS. New developments in AMPK and mTORC1 cross-talk. Essays Biochem. 2024;68(3):321-336.
doi pubmed - Kim J, Kundu M, Viollet B, Guan KL. AMPK and mTOR regulate autophagy through direct phosphorylation of Ulk1. Nat Cell Biol. 2011;13(2):132-141.
doi pubmed - Yan S, Zhan F, He Y, Zhu Y, Ma Z. p53 in colorectal cancer: from a master player to a privileged therapy target. J Transl Med. 2025;23(1):684.
doi pubmed - Dando I, Cordani M, Donadelli M. Mutant p53 and mTOR/PKM2 regulation in cancer cells. IUBMB Life. 2016;68(9):722-726.
doi pubmed - Motlagh AV, Mahdevar M, Mirzaei S, Entezari M, Hashemi M, Hushmandi K, Peymani M. Introduction of mutant TP53 related genes in metabolic pathways and evaluation their correlation with immune cells, drug resistance and sensitivity. Life Sci. 2022;303:120650.
doi pubmed - Liu N, Jiang X, Guo L, Zhang C, Jiang M, Sun Z, Zhang Y, et al. Mutant p53 achieved Gain-of-Function by promoting tumor growth and immune escape through PHLPP2/AKT/PD-L1 pathway. Int J Biol Sci. 2022;18(6):2419-2438.
doi pubmed - Ando S, Perkins CM, Sajiki Y, Chastain C, Valanparambil RM, Wieland A, Hudson WH, et al. mTOR regulates T cell exhaustion and PD-1-targeted immunotherapy response during chronic viral infection. J Clin Invest. 2023;133(2).
doi pubmed - Sun IH, Oh MH, Zhao L, Patel CH, Arwood ML, Xu W, Tam AJ, et al. mTOR complex 1 signaling regulates the generation and function of central and effector Foxp3(+) regulatory T cells. J Immunol. 2018;201(2):481-492.
doi pubmed - Do MH, Wang X, Zhang X, Chou C, Nixon BG, Capistrano KJ, Peng M, et al. Nutrient mTORC1 signaling underpins regulatory T cell control of immune tolerance. J Exp Med. 2020;217(1).
doi pubmed - Zeng H, Yang K, Cloer C, Neale G, Vogel P, Chi H. mTORC1 couples immune signals and metabolic programming to establish T(reg)-cell function. Nature. 2013;499(7459):485-490.
doi pubmed - Panwar V, Singh A, Bhatt M, Tonk RK, Azizov S, Raza AS, Sengupta S, et al. Multifaceted role of mTOR (mammalian target of rapamycin) signaling pathway in human health and disease. Signal Transduct Target Ther. 2023;8(1):375.
doi pubmed - Jones RG, Pearce EJ. MenTORing immunity: mTOR signaling in the development and function of tissue-resident immune cells. Immunity. 2017;46(5):730-742.
doi pubmed - Li D, Liu J, Yu L, Luo X, Wu X, Chen R. Integrated single-cell RNA-Seq reveals immunosuppressive mechanisms of treg cell differentiation and tumor microenvironment interactions in colorectal cancer. Cancer Med. 2025;14(17):e71202.
doi pubmed - Wang Q, Shen X, Chen G, Du J. How to overcome resistance to immune checkpoint inhibitors in colorectal cancer: From mechanisms to translation. Int J Cancer. 2023;153(4):709-722.
doi pubmed - Conciatori F, Bazzichetto C, Falcone I, Pilotto S, Bria E, Cognetti F, Milella M, et al. Role of mTOR signaling in tumor microenvironment: an overview. Int J Mol Sci. 2018;19(8).
doi pubmed - Bai X, Wang X, Ma G, Song J, Liu X, Wu X, Zhao Y, et al. Improvement of PD-1 blockade efficacy and elimination of immune-related gastrointestinal adverse effect by mTOR inhibitor. Front Immunol. 2021;12:793831.
doi pubmed - Fakih M, Sandhu J, Lim D, Li X, Li S, Wang C. Regorafenib, ipilimumab, and nivolumab for patients with microsatellite stable colorectal cancer and disease progression with prior chemotherapy: a phase 1 nonrandomized clinical trial. JAMA Oncol. 2023;9(5):627-634.
doi pubmed - Hecht JR, Park YS, Tabernero J, Lee MA, Lee S, Virgili AC, Van den Eynde M, et al. Zanzalintinib plus atezolizumab versus regorafenib in refractory colorectal cancer (STELLAR-303): a randomised, open-label, phase 3 trial. Lancet. 2025;406(10517):2360-2370.
doi pubmed - Shu P, Li X, Zhou Q, Li G, Zhang K, Yuan L, Liu Y, et al. Multicenter phase 1/2 study of onatasertib, a dual TORC1/2 inhibitor, combined with the PD-1 antibody toripalimab in advanced solid tumors. Signal Transduct Target Ther. 2025;10(1):198.
doi pubmed - Zhang X, Ye X, Jin H. Oxidized low-density lipoprotein as a potential target for enhancing immune checkpoint inhibitor therapy in microsatellite-stable colorectal cancer. Antioxidants (Basel). 2025;14(6).
doi pubmed
This article is distributed under the terms of the Creative Commons Attribution 4.0 International License (CC BY 4.0), which permits unrestricted use, distribution, and reproduction in any medium, including commercial use, provided the original work is properly cited.
World Journal of Oncology is published by Elmer Press Inc.