Figures
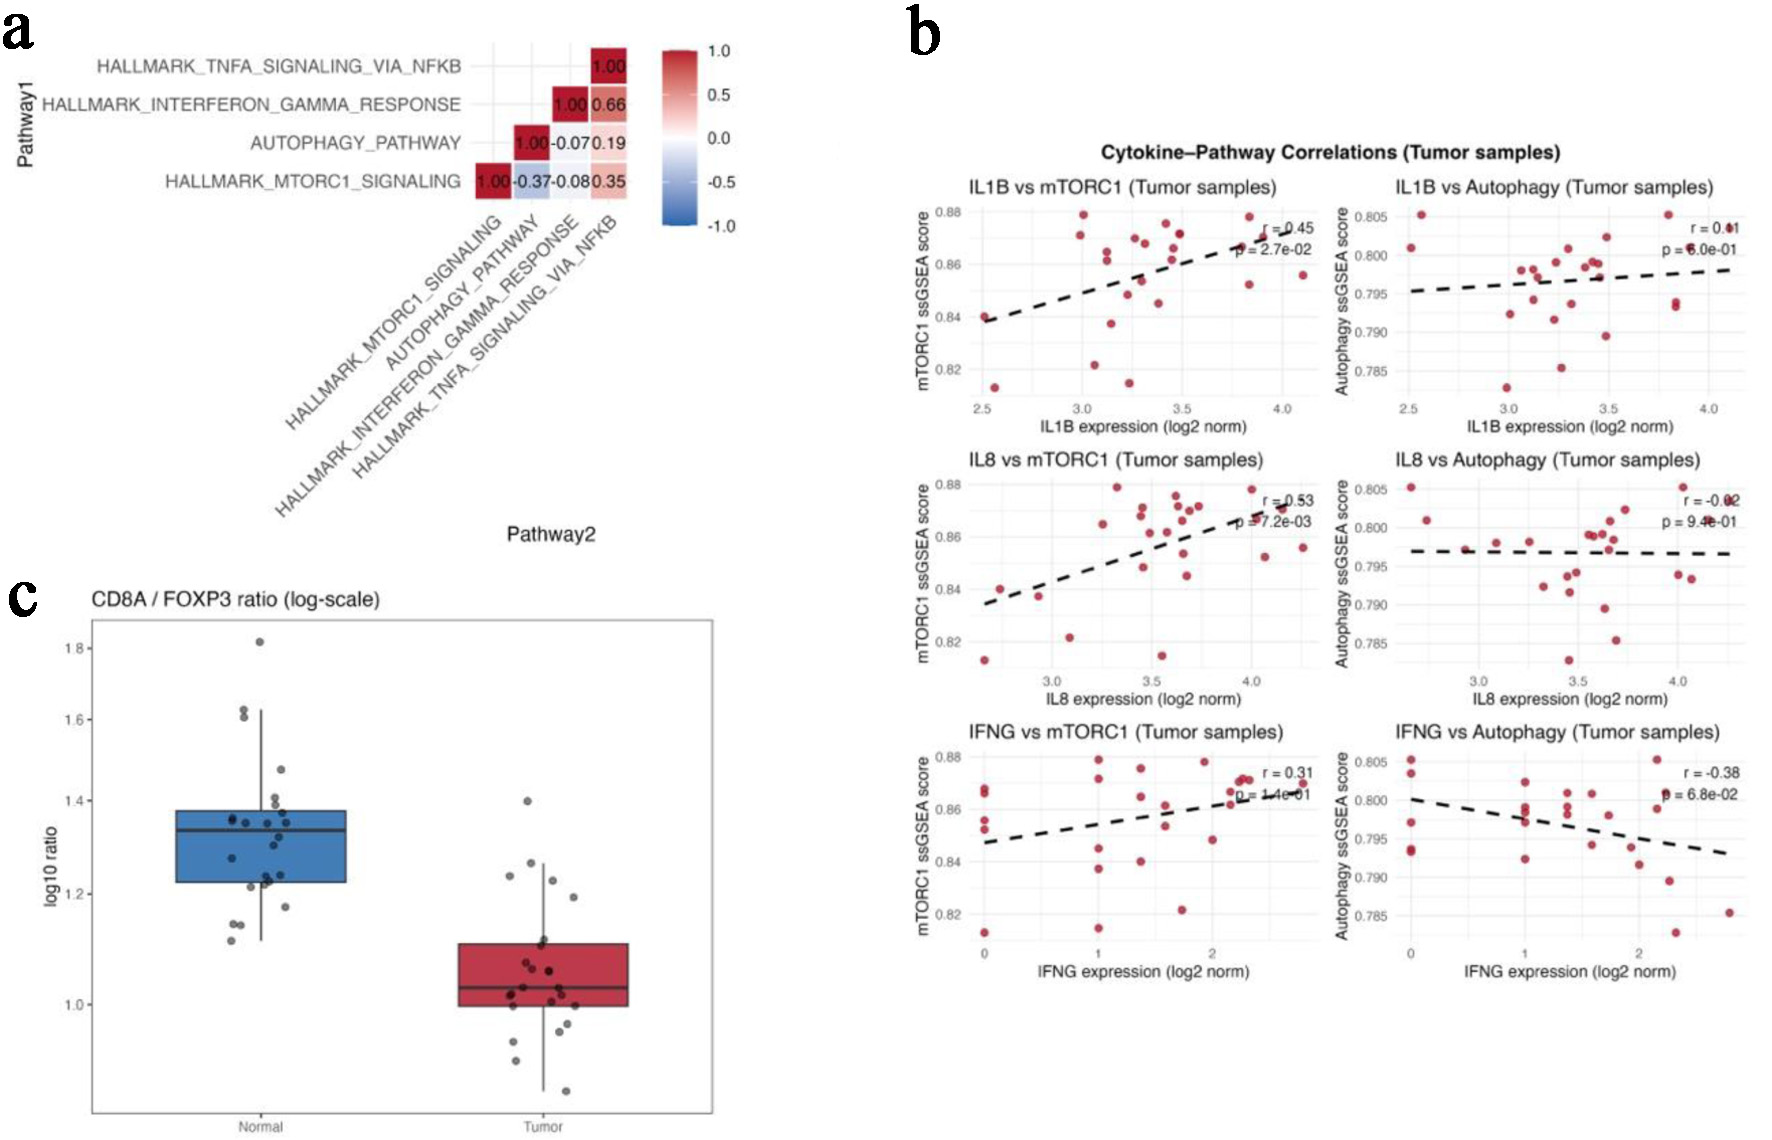
↓ Figure 1. Transcriptomic profiling reveals
mTORC1-autophagy antagonism in colorectal tumors (GSE146009). (a) Correlation matrix showing pairwise
relationships among mTORC1 signaling, autophagy, interferon-γ response,
TNF-α/NF-κB signaling, and p53 pathway scores in paired tumor and
normal tissues. (b) Scatterplots showing positive correlations between mTORC1 and
IL1B/IL8 expression and an inverse correlation between autophagy and IFNG. (c)
Boxplot comparing the CD8A/FOXP3 ratio between paired normal and tumor tissues. Gene-level expression
differences for FOXP3, CTLA4, CD274 (PD-L1), and CD8A are summarized in Table 1.
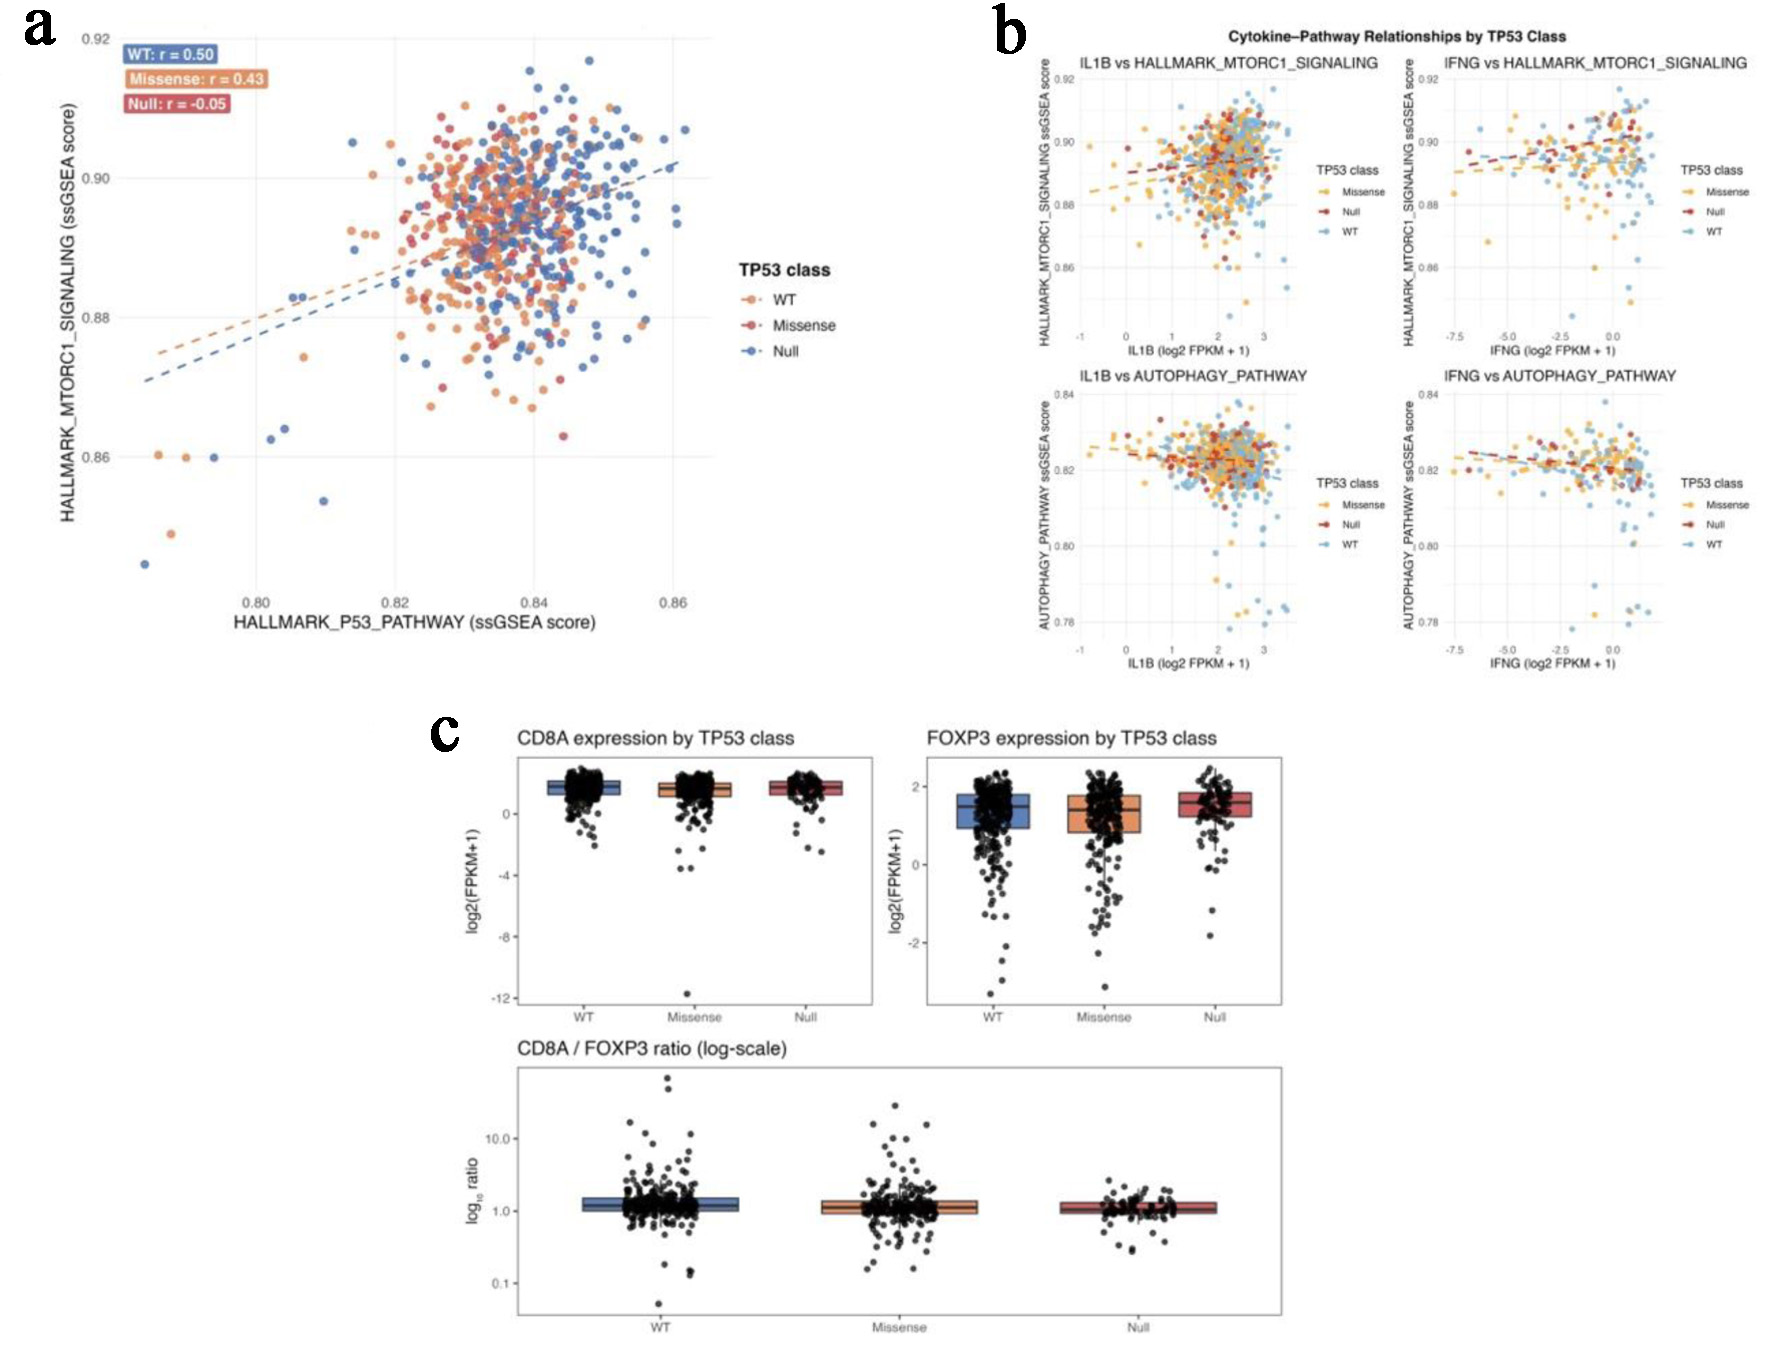
↓ Figure 2. TP53 mutation class predicts
metabolic and immune pathway decoupling in TCGA-COAD/READ. (a) Scatterplots of P53-pathway and
mTORC1-signaling ssGSEA scores across TP53-wild-type, missense, and null tumors. (b) Correlation
plots showing negative autophagy-cytokine coupling in wild-type tumors and positive
mTORC1-IFNG coupling in TP53-null tumors. (c) Boxplots of FOXP3 expression and CD8A/FOXP3
ratios across TP53 functional classes.
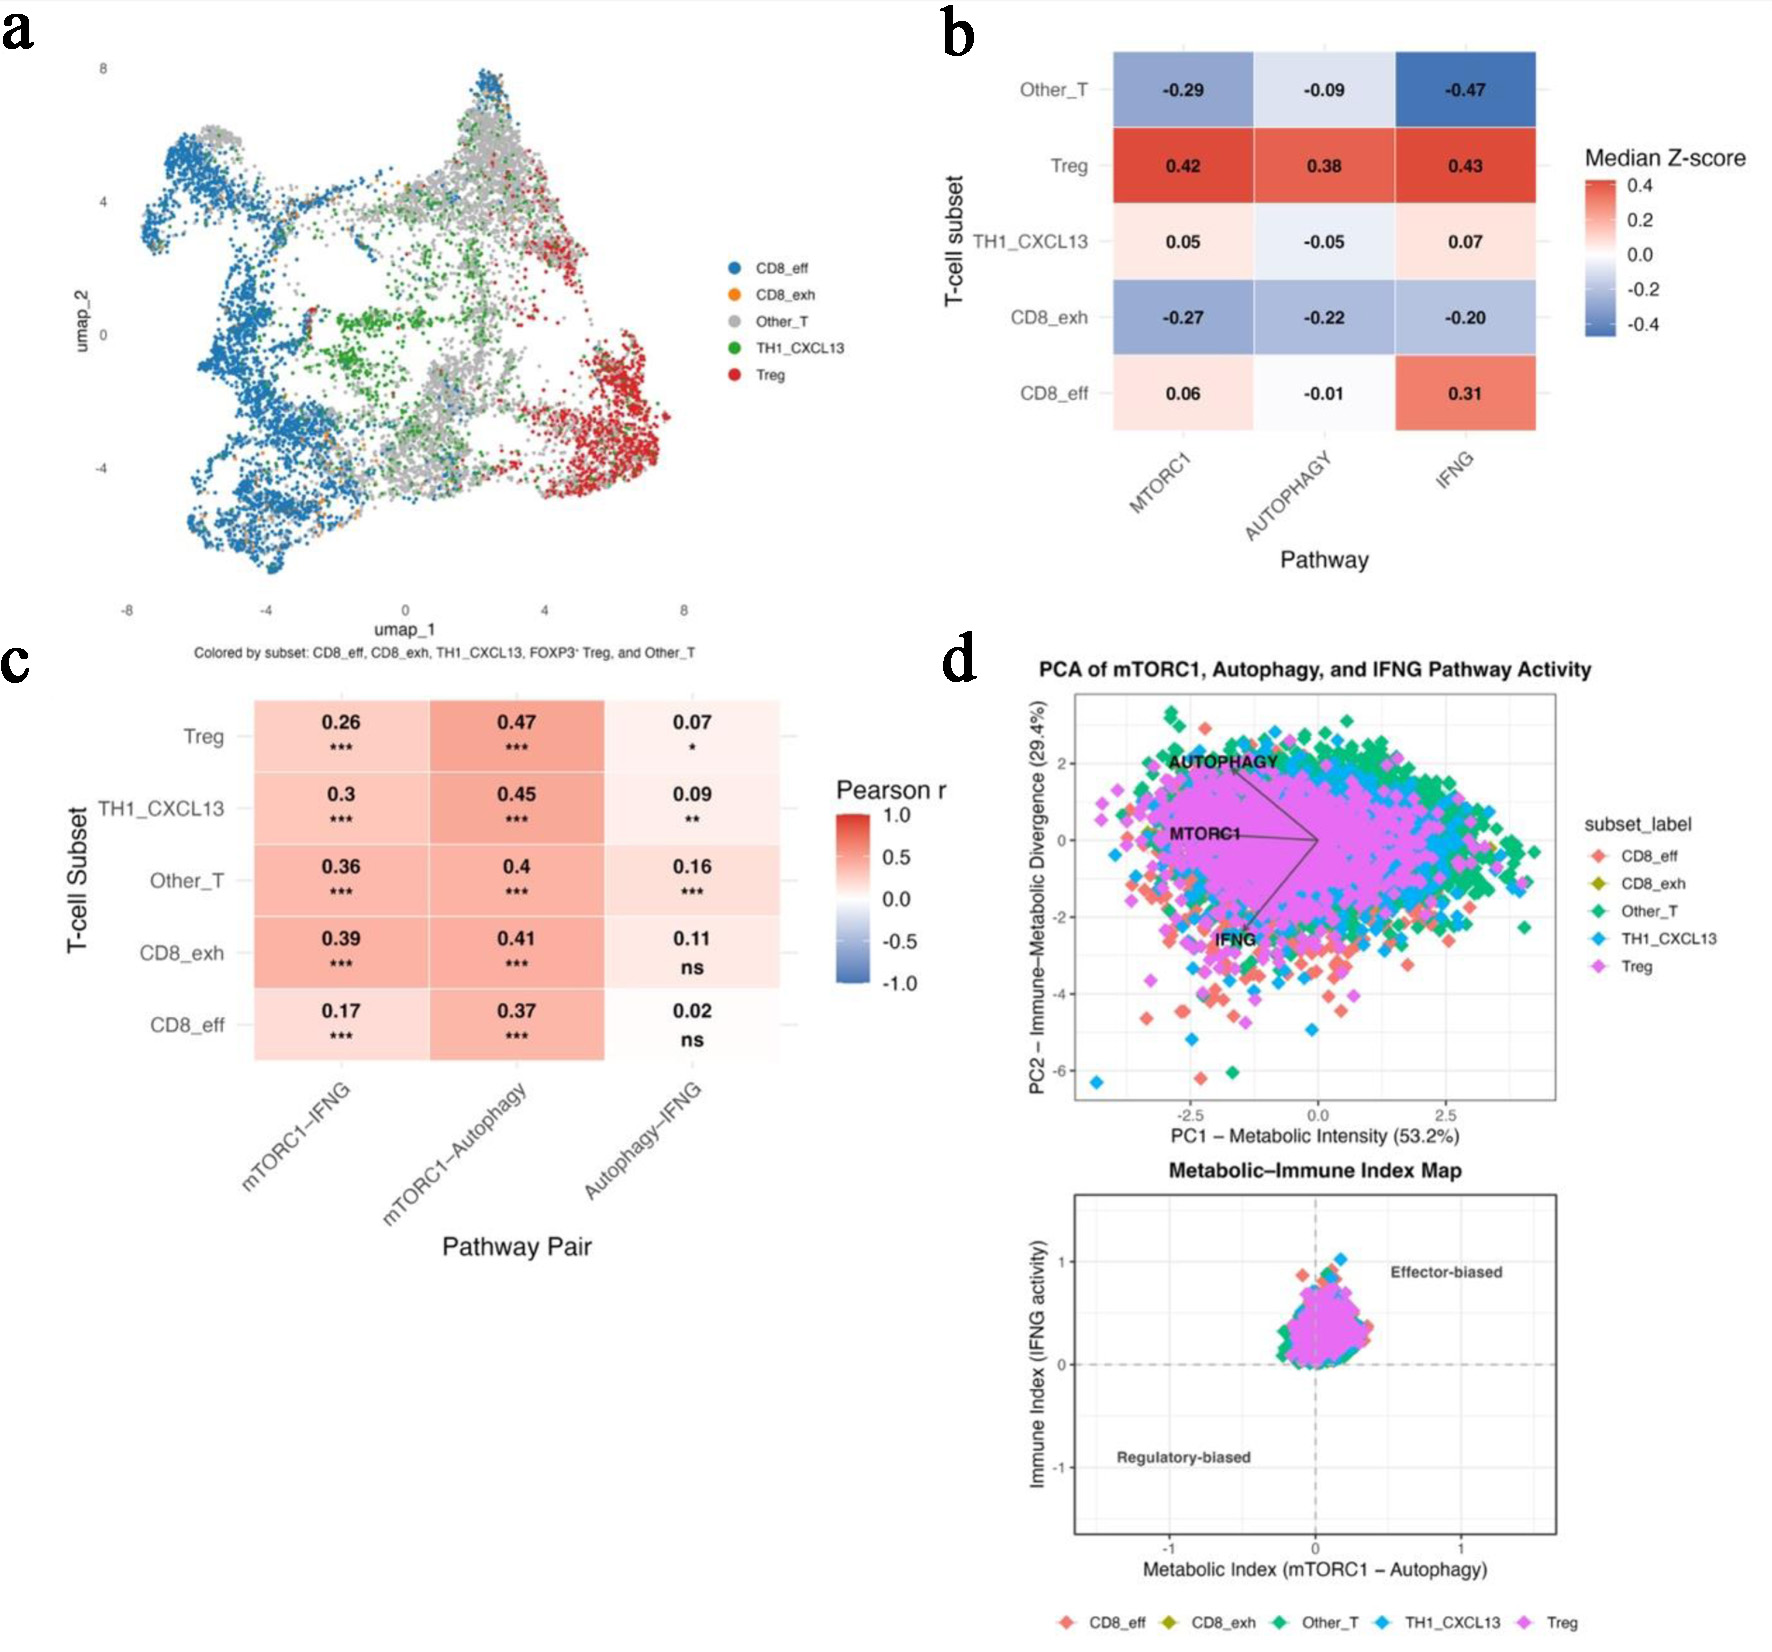
↓ Figure 3. Single-cell RNA-seq analysis
confirms subset-specific metabolic heterogeneity (GSE108989). (a) UMAP projection identifying five major
T-cell subsets: CD8_eff, CD8_exh, TH1_CXCL13, Treg, and Other_T. (b) Heatmap of median z-scores for
mTORC1, autophagy, and IFNG pathway activity across T-cell subsets, illustrating
metabolic polarization. (c) Heatmap showing pairwise correlation strengths among
mTORC1-autophagy, mTORC1-IFNG, and autophagy-IFNG within each subset. (d)
Principal-component analysis illustrating PC1 (metabolic intensity) and PC2 (immune-metabolic
divergence) with the derived Metabolic-Immune Index map separating effector and regulatory T-cell
states.
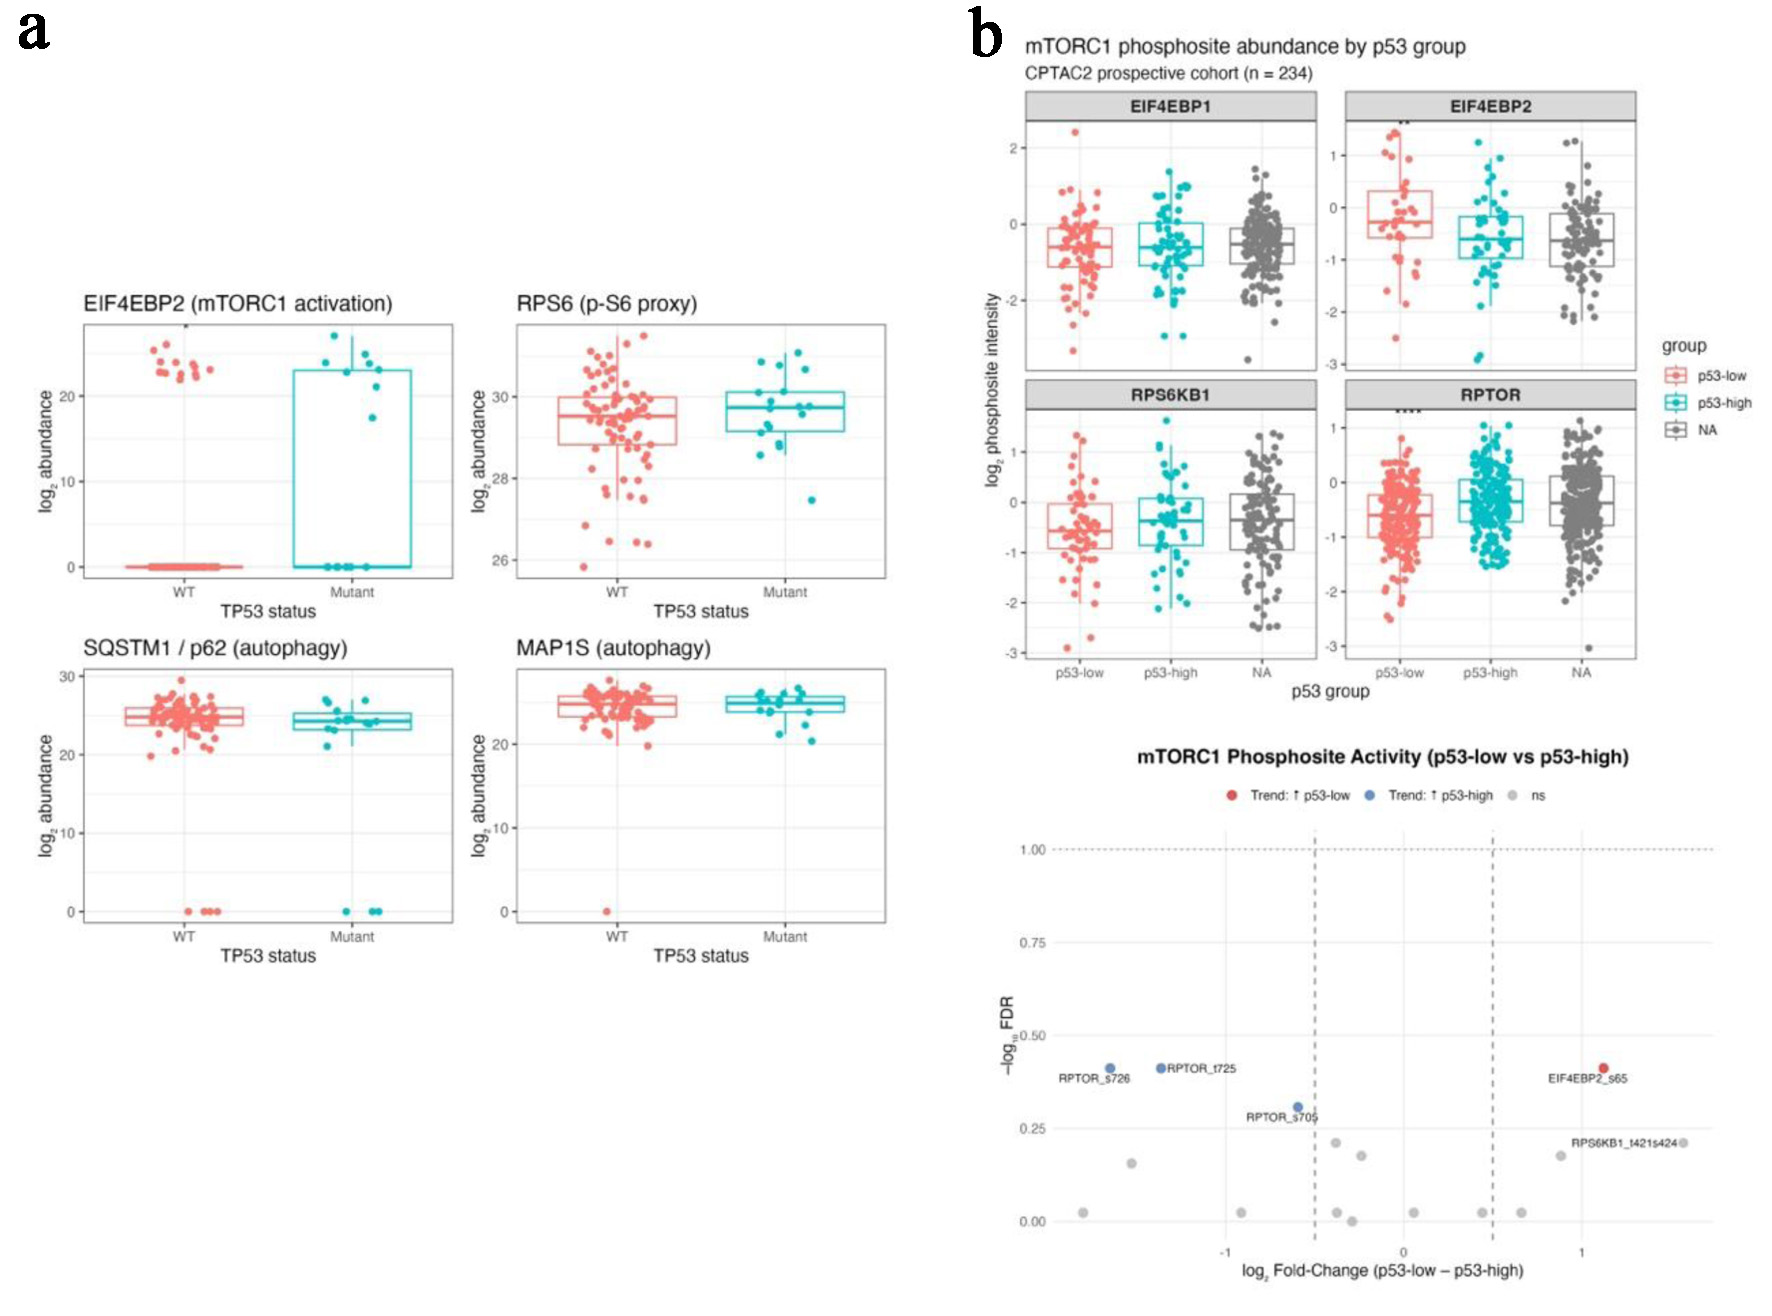
↓ Figure 4. Proteomic and phosphoproteomic
integration validates post-translational mTORC1 activation under p53 deficiency (CPTAC colon cohorts).
(a) Boxplots comparing protein abundance of EIF4EBP2, RPS6, SQSTM1 (p62), and MAP1S between TP53-mutant
and wild-type tumors in the CPTAC-TCGA matched proteome. (b) Bar (upper) and volcano (lower) plots from
the CPTAC2 phosphoproteome showing increased phosphorylation of EIF4EBP2 S65 and RPS6KB1 T421/S424 and
decreased phosphorylation of inhibitory RPTOR sites (S705, T725, S726) in p53-low tumors.
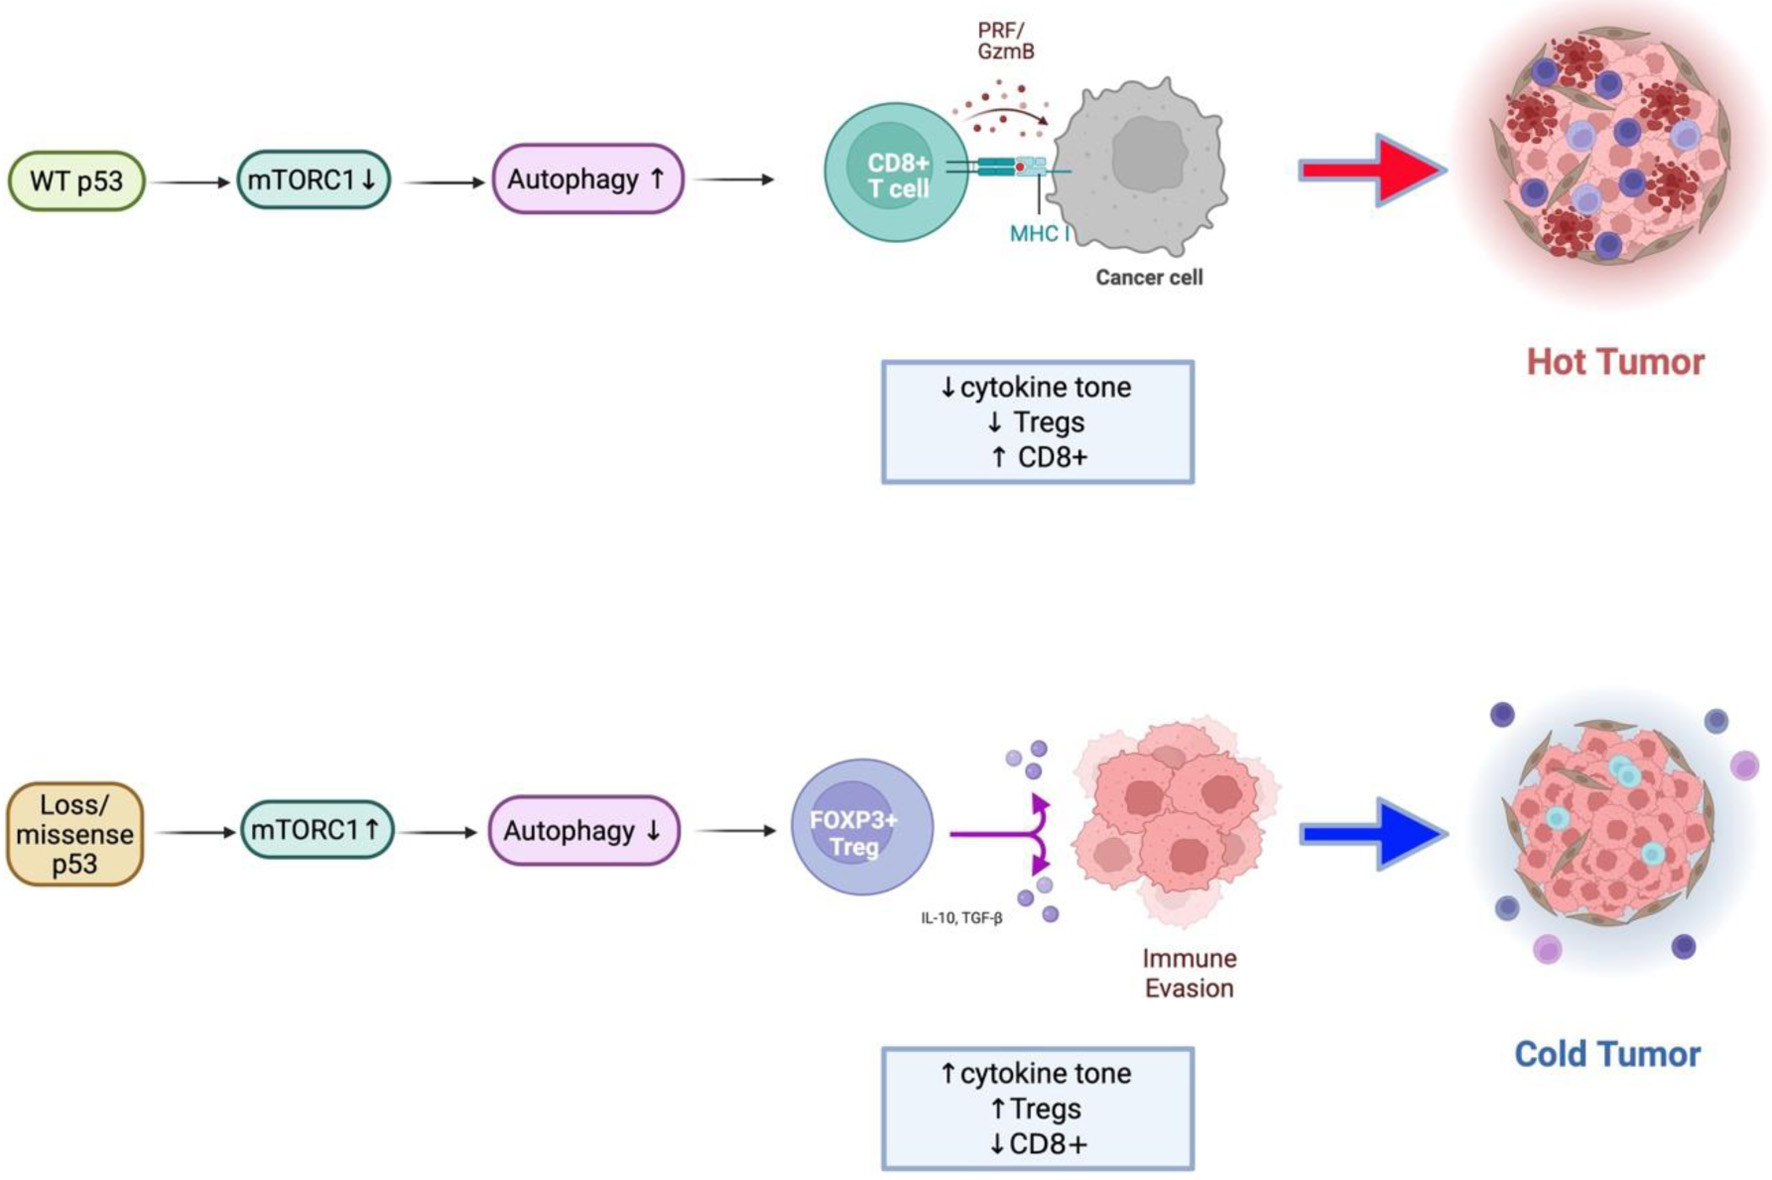
↓ Figure 5. Conceptual model of the
TP53–mTORC1–autophagy–immune axis in colorectal cancer. Schematic illustration
summarizing the proposed mechanism derived from integrated transcriptomic, single-cell, and proteomic
analyses. Upper: In wild-type p53 tumors, p53 restrains mTORC1 activity through AMPK/ULK1-mediated
phosphorylation of RPTOR and promotes autophagy, maintaining metabolic balance and supporting effective
antitumor immune function. Lower: In TP53-mutant or null tumors, loss of p53 control leads to
constitutive mTORC1 activation and suppression of autophagy. These changes drive increased cytokine
signaling (IL1B, IFNG), metabolic stress adaptation, and enrichment of FOXP3+ regulatory T
cells, resulting in an immune-cold, immunosuppressive tumor microenvironment.
Tables
↓ Table 1. Differential Expression of Immune-Related Genes Between Normal
and Tumor Tissues (GSE146009)
| Gene
|
Normal (mean ± SD) |
Tumor (mean ± SD) |
Fold-change (log2) |
P-value |
| FOXP3 |
2.24 ± 0.26 |
2.76 ± 0.31 |
+0.52 |
0.003 |
| CTLA4 |
2.37 ± 0.30 |
2.69 ± 0.33 |
+0.32 |
0.018 |
| CD274 (PD-L1) |
2.65 ± 0.29 |
2.89 ± 0.34 |
+0.24 |
0.022 |
| CD8A |
2.98 ± 0.41 |
2.92 ± 0.39 |
−0.06 |
0.712 |
↓ Table 2. TP53 Mutation Class and Immune Gene Expression Summary
(TCGA-COAD/READ)
| TP53
class |
n
|
FOXP3 (mean ± SD) |
CD8A/FOXP3 ratio |
P
(Kruskal–Wallis) |
| Wild type |
258 |
2.42 ± 0.36 |
1.28 ± 0.14 |
– |
| Missense |
287 |
2.59 ± 0.39 |
1.11 ± 0.16 |
0.005 |
| Null |
102 |
2.71 ± 0.43 |
0.96 ± 0.15 |
4.7 × 10⁻⁵ |
↓ Table 3. Summary of Principal Component and Metabolic-Immune Index
Analyses Across T-Cell Subsets (Fig. 3d)
|
Subset |
PC1
(metabolic intensity) |
PC2
(immune-metabolic divergence) |
Metabolic index (mTORC1–autophagy) |
IFN-γ index |
| Treg |
−0.72 |
−0.14 |
0.06 ± 0.07 |
0.30 ± 0.10 |
| CD8_eff |
−0.28 |
−0.31 |
0.05 ± 0.08 |
0.30 ± 0.09 |
| TH1_CXCL13 |
−0.11 |
−0.12 |
0.06 ± 0.07 |
0.27 ± 0.10 |
| CD8_exh |
+0.34 |
+0.04 |
0.04 ± 0.07 |
0.23 ± 0.07 |
| Other_T |
+0.37 |
+0.26 |
0.03 ± 0.08 |
0.22 ± 0.09 |
↓ Table 4. Protein-Level Differences by TP53 Mutation Status
(CPTAC–TCGA PDC000111)
|
Protein |
Mean
(WT) |
Mean
(mutant) |
Log2 FC (Mut – WT) |
Direction of change |
| Data from the CPTAC-TCGA matched colorectal proteome (PDC000111). Log2
fold-change represents mean abundance difference between TP53-mutant and wild-type tumors. |
| EIF4EBP2 |
4.25 |
10.23 |
+5.98 |
↑ in TP53-mutant |
| RPS6 |
29.31 |
29.65 |
+0.34 |
↑ in TP53-mutant |
| SQSTM1 (p62) |
23.58 |
20.51 |
−3.07 |
↓ in TP53-mutant |
| MAP1S |
24.20 |
24.41 |
+0.20 |
≈ No change |
↓ Table 5. Differential Phosphosite Abundance by p53 Protein Level (CPTAC2
PDC000117–000116)
| Gene
|
Phosphosite |
log2 FC (p53-low – p53-high) |
Direction of change |
| Data from the prospective CPTAC2 colon and rectal phosphoproteome (PDC000116-000117, n =
234). Positive log2FC indicates higher phosphorylation in p53-low tumors; negative values
indicate higher phosphorylation in p53-high tumors. |
| EIF4EBP2 |
S65 |
+1.12 |
↑ in p53-low |
| RPS6KB1 |
T421/S424 |
+1.57 |
↑ in p53-low |
| RPTOR |
S705 |
−0.60 |
↑ in p53-high |
| RPTOR |
T725 |
−1.36 |
↑ in p53-high |
| RPTOR |
S726 |
−1.65 |
↑ in p53-high |
| RPTOR |
S719 |
−0.38 |
↑ in p53-high |