| World Journal of Oncology, ISSN 1920-4531 print, 1920-454X online, Open Access |
| Article copyright, the authors; Journal compilation copyright, World J Oncol and Elmer Press Inc |
| Journal website https://wjon.elmerpub.com |
Original Article
Volume 16, Number 6, December 2025, pages 630-644

Analysis of the SH3-Domain Kinase Binding Protein 1 Predictive Model for Pancreatic Ductal Adenocarcinoma and CCCTC-Binding Factor Transcriptional Regulatory Study
Rui Zhuang Suna, Kun Peng Qiaob, Xiao Lian Xua, Yan Hua Chena, Jun Menga, c, d
aDepartment of Laboratory Medicine, Ruijin-Hainan Hospital, Shanghai Jiao Tong
University School of Medicine (Hainan Boao Research Hospital), Qionghai 571437,
China
bDepartment of Pathology, Ruijin-Hainan Hospital, Shanghai Jiao Tong
University School of Medicine (Hainan Boao Research Hospital), Qionghai 571437,
China
cDepartment of Laboratory Medicine, Ruijin Hospital, Shanghai Jiao Tong
University School of Medicine, Shanghai 200025, China
dCorresponding Author: Jun
Meng, Department of Laboratory Medicine, Ruijin-Hainan Hospital, Shanghai Jiao Tong University
School of Medicine (Hainan Boao Research Hospital), Qionghai 571437, China
Manuscript submitted September 6, 2025, accepted October 21, 2025, published online October 31,
2025
Short title: SH3-KBP1 PDAC Model and CTCF Regulation
doi:
https://doi.org/10.14740/wjon2668
| Abstract | ▴Top |
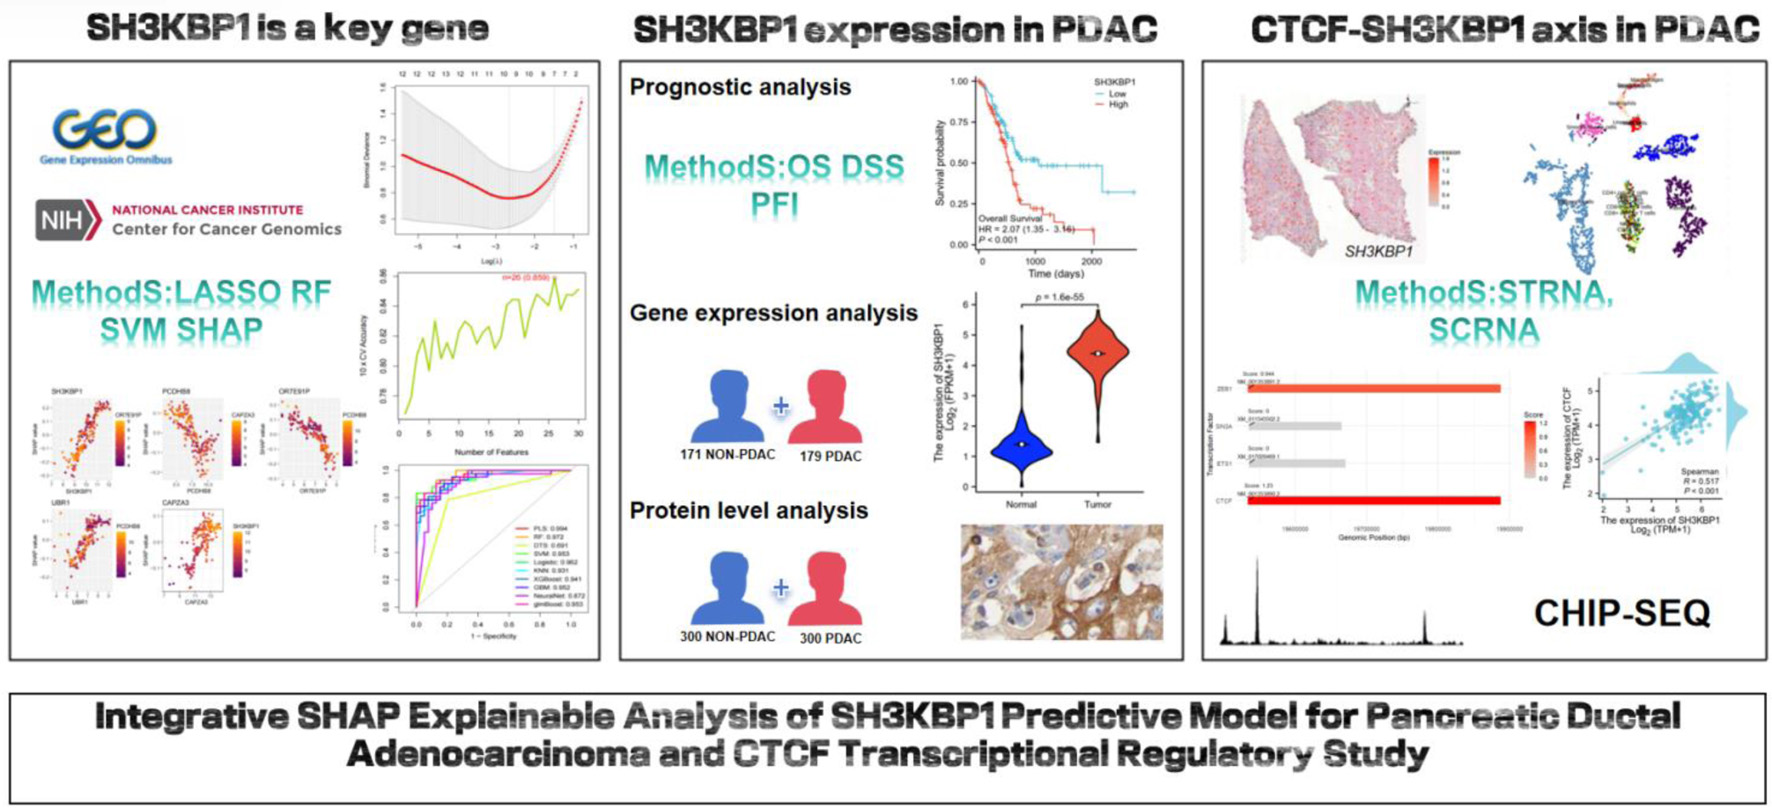
Background: Pancreatic ductal adenocarcinoma (PDAC) is among the most aggressive malignancies with extremely poor prognosis. This study systematically evaluates the expression patterns, biological functions, and regulatory mechanisms of the SH3-domain kinase binding protein 1 (SH3KBP1) in PDAC through multi-omics integrative analysis strategies.
Methods: Key predictive genes were identified using machine learning algorithms, including support vector machine (SVM), least absolute shrinkage and selection operator (LASSO) regression, and SHapley Additive exPlanations (SHAP), based on multi-omics datasets. Validation analysis was performed using mRNA expression data from 179 PDAC tumor samples and 171 adjacent non-tumor samples (including four adjacent tissues and 167 normal controls), combined with proteomics data from 300 pairs of PDAC and non-tumor samples. Single-cell RNA sequencing and spatial transcriptomics analyzed cell-type-specific distribution and spatial localization characteristics of SH3KBP1. Clustered regularly interspaced short palindromic repeats (CRISPR) knockout experiments assessed functional dependency, and transcription factor binding site prediction explored upstream regulatory mechanisms. All analyses were performed on the R platform using specialized packages.
Results: Machine learning analysis successfully identified SH3KBP1 as a key predictive biomarker for pancreatic cancer. The gene was consistently selected by multiple algorithms. The constructed predictive model demonstrated excellent performance, with a maximum area under the curve (AUC) value of 0.994, and SHAP analysis further confirmed its important contribution to pancreatic cancer prediction. Validation analysis showed significant overexpression of SH3KBP1 in PDAC tumor tissues, with a diagnostic receiver operating characteristic curve AUC value reaching 0.985, demonstrating excellent diagnostic capability. Survival analysis revealed significant associations between high SH3KBP1 expression and poorer overall survival, disease-specific survival, and progress-free interval. Proteomics and immunohistochemistry analysis further confirmed significant upregulation of SH3KBP1 at the protein level. CRISPR knockout experiments revealed functional dependency of some PDAC cell lines on SH3KBP1. Single-cell RNA sequencing data showed that SH3KBP1 was mainly enriched in malignant epithelial cell populations with obvious copy number variation characteristics, and spatial transcriptomics analysis further confirmed its significant enrichment in tumor core regions. Transcriptional regulatory analysis suggested that transcription factor CCCTC-binding factor (CTCF) may regulate SH3KBP1 transcriptional activity by binding to its promoter region, with both showing significant positive correlations in expression levels.
Conclusions: Via multi-omics integrative analysis, this study systematically elucidated the expression characteristics, spatial distribution, biological functions, and transcriptional regulatory networks of SH3KBP1 in PDAC, confirming its excellent diagnostic/prognostic value and potential as a PDAC molecular target, particularly involving the CTCF regulatory axis. It also provides a key theoretical basis for understanding how SH3KBP1-mediated signaling pathways (regulated by CTCF) drive pancreatic cancer development and progression.
Keywords: Pancreatic ductal adenocarcinoma; SH3KBP1; Machine learning; Spatial transcriptomics; Single-cell RNA sequencing; Transcription factor CTCF; Multi-omics integrative analysis
| Introduction | ▴Top |
Pancreatic ductal adenocarcinoma (PDAC) is among the most aggressive and poorly prognostic gastrointestinal malignancies, with a 5-year survival rate of less than 10% [1], significantly lower than other common solid tumors. Due to the subtle early symptoms and lack of screening methods, approximately 80% of patients are diagnosed at advanced stages, thereby losing the opportunity for a surgical cure. Although standard chemotherapy regimens, including FOLFIRINOX [2] and gemcitabine [3] combination therapy, have shown improvements, the overall response rate remains unsatisfactory. Therefore, there is an urgent need to identify new molecular targets to aid in the early screening, diagnosis, and development of targeted therapies for PDAC.
During tumorigenesis, most malignant biological behaviors are driven by specific signaling pathways, including proliferation, invasion, metastasis, and cell cycle abnormalities. Identifying key driver genes and regulatory molecules has become an important foundation for molecular subtyping and personalized therapy in the context of precision medicine. In recent years, high-throughput omics technologies and big data analysis have accelerated the development of tumor target screening. Some traditional studies have identified differentially expressed genes (DEGs) associated with the progression of cervical cancer precursors through microarray and transcriptomic analysis, among which SH3-domain kinase binding protein 1 (SH3KBP1) has been listed as a potential candidate gene involved in tumor evolution [4].
SH3KBP1 is an adaptor protein containing an SH3 domain, initially thought to be involved in such processes as endocytosis, signal transduction, and cytoskeleton remodeling [5-7]. Recent studies have shown that SH3KBP1 not only plays a role in physiological signal transduction but may also act as a tumor-associated molecule involved in regulating various malignant features of cancer. In a study of infantile hemangiomas, SH3KBP1 was found to be one of the most significantly upregulated genes, closely related to angiogenesis, immune microenvironment, and tumor progression; its interference in vitro significantly affected the migration and invasion abilities of tumor cells [7]. Additionally, in glioblastoma research, increased SH3KBP1 expression was closely associated with activation of the epidermal growth factor receptor (EGFR) signaling pathway and could serve as a tumor stem cell marker, participating in the maintenance of self-renewal ability [8]. This study further indicated that SH3KBP1 regulates tumor signaling cascades as an adaptor protein by directly interacting with EGFR.
Although SH3KBP1 has shown oncogenic potential in various solid tumors, its expression characteristics, functional mechanisms, and transcriptional regulation in PDAC have not been systematically elucidated. This study integrates multi-platform databases, including The Cancer Genome Atlas (TCGA), the Proteomic Data Commons (PDC), the cancer Dependency Map (DepMap), the Gene Expression Omnibus (GEO), and the Sequence Read Archive (SRA), combined with transcriptomic, proteomic, single-cell transcriptomics, and spatial transcriptomic data, to systematically evaluate SH3KBP1 expression levels, clinical value, spatial expression patterns, and functional dependencies in PDAC. Furthermore, potential upstream transcription factors of SH3KBP1 were screened through such databases as Cistrome, and preliminary results suggest that SH3KBP1 may be regulated by CCCTC-binding factor (CTCF). These findings will provide important evidence for understanding the role of SH3KBP1 in PDAC and the development of novel therapeutic targets.
| Materials and Methods | ▴Top |
Least absolute shrinkage and selection operator (LASSO), support vector machine (SVM), and SHapley Additive exPlanations (SHAP)
This study obtained three PDAC-related gene expression datasets from the GEO database: GSE217384, GSE263733, and GSE154763. All datasets were standardized and quality-controlled, and low-expressed genes and samples with excessive missing values were removed. Gene expression data were log2-transformed for normalization. LASSO regression was used for feature selection, identifying key genes related to PDAC prognosis by adjusting the regularization parameter λ, while random forest (RF) and SVM-recursive feature elimination (SVM-RFE) algorithms were used for feature selection cross-validation. Venn diagram analysis compared the feature selection results of the three algorithms, identifying core predictive genes consistently recognized by multiple algorithms. Ten-fold cross-validation was used to evaluate the stability and generalization ability of the model, and the optimal feature number was determined by accuracy and error rate curves. Multiple machine learning algorithms, including partial least squares (PLS) regression, RF, decision trees search (DTS), SVM, logistic regression (LR), k-nearest neighbors (KNN), eXtreme Gradient Boosting (XGBoost), Gradient Boosting Machine (GBM), Neural Network (NeuralNet), and Generalized Linear Model Boosting (glmBoost), were compared for performance, with receiver operating characteristic (ROC) curve and area under the curve (AUC) used to evaluate prediction performance. SHAP was used for model interpretability analysis, calculating each feature’s contribution to the model’s prediction. Feature importance distribution was visualized using a bee swarm plot, and SHAP dependency plots analyzed interactions between key genes. Based on feature selection and performance evaluation, a final PDAC prognosis prediction model was constructed, integrating gene expression levels and corresponding regression coefficients to output individual risk prediction probabilities.
Test set data of PDAC transcriptome and corresponding clinical follow-up information were obtained from the TCGA, with expression data in fragments per kilobase of transcript per million mapped reads (FPKM) format and a log2(FPKM + 1) transformation applied for subsequent analysis. Protein-level data were obtained from the PDC, including 300 cases of PDAC and 300 non-tumor tissue samples. Immunohistochemical data were obtained from the Human Protein Atlas (THPA), using antibody HPA003351 to visualize SH3KBP1 protein expression in PDAC tissue. Clustered regularly interspaced short palindromic repeats (CRISPR) knockout functional dependency data came from the DepMap database, extracting Chronos scores from typical PDAC cell lines, such as JOPACA1, PATU8988S, BXPC3, and KP2. These scores were used to assess the dependency of each cell line on specific genes, with lower (negative) scores indicating a gene essential for cell growth and survival. A threshold was set to classify genes as highly dependent (negative scores) or less critical (positive scores), facilitating the identification of potential therapeutic targets in PDAC. Spatial transcriptomic data were obtained from the GEO database sample GSM8452847, single-cell RNA sequencing data came from the National Center for Biotechnology Information (NCBI) SRA project PRJNA885258, and transcription factor target data and chromatin immunoprecipitation (ChIP) binding prediction information were taken from the Cistrome Data Browser and University of California, Santa Cruz (UCSC) Genome Browser. All data were uniformly processed based on the human reference genome version hg38.
Single-cell transcriptomics analysis
Single-cell RNA-seq data analysis was performed using the R Seurat package. Data were first quality controlled, retaining cells with gene counts between 200 and 7,500, mitochondrial gene proportions below 20%, and total unique molecular identifier (UMI) counts exceeding 500. Standardization was performed using the LogNormalize method, and principal component analysis (PCA) dimensionality reduction was conducted, followed by t-distributed stochastic neighbor embedding (t-SNE) visualization. Cell clustering was performed using the Louvain algorithm, and each cluster was annotated based on cell-type-specific marker genes. SH3KBP1 expression in different cell subpopulations was displayed using FeaturePlot. Copy number variation (CNV) inference was performed using the inferCNV package, with non-malignant cells like T cells used as references, and a copy number variation heatmap was generated to distinguish malignant cells.
Spatial transcriptomics analysis
Spatial transcriptomic data were analyzed using Seurat and STUtility. First, image stitching and spatial coordinate alignment were performed on sample GSM8452847, followed by expression matrix normalization. Tumor scores were constructed based on key driver genes (such as KRAS, TP53, and SMAD4) to discriminate and delineate tumor and non-tumor regions. SH3KBP1 spatial expression was presented using SpatialFeaturePlot, and expression differences between different regions were further compared.
Transcription factor prediction and binding analysis
To identify potential upstream transcription factors regulating SH3KBP1 expression, this study integrated TCGA differential expression analysis results (log2FC > 1, false discovery rate (FDR) < 0.05), genes significantly co-expressed with SH3KBP1 (Spearman correlation coefficient R > 0.5, P < 0.05), and the chromatin immunoprecipitation sequencing (ChIP-seq) target gene collection in PANC-1 cells from the Cistrome database. The intersection genes were considered candidate transcription factors. Binding site scores from the Cistrome database were further used to filter target transcription factors, and ChIP enrichment tracks for transcription factors like CTCF in the SH3KBP1 promoter region were visualized in the UCSC Genome Browser.
Statistical analysis
All statistical analyses were conducted using R (version 4.2.1). Group differences were assessed using the non-parametric Wilcoxon rank-sum test, with expression distributions shown using box plots or violin plots. Diagnostic ability was evaluated using the pROC package to plot ROC curves, calculate AUC values, and report 95% confidence intervals. Survival analysis was performed using the survival and survminer packages, with Kaplan-Meier curves dividing high and low expression groups based on median expression values, and Log-rank tests were used to assess survival differences. Hazard ratios (HRs) and P-values were reported. Correlation analysis was performed using the Spearman method, and trends and correlation strengths were visualized using ggplot2. All P-values were two-tailed, and P < 0.05 was considered statistically significant.
| Results | ▴Top |
Flowchart
The flowchart of this paper is shown in Figure 1.
 Click for large image |
Figure 1. Flow diagram. |
Machine learning analysis confirms SH3KBP1 as a key biomarker for PDAC prediction
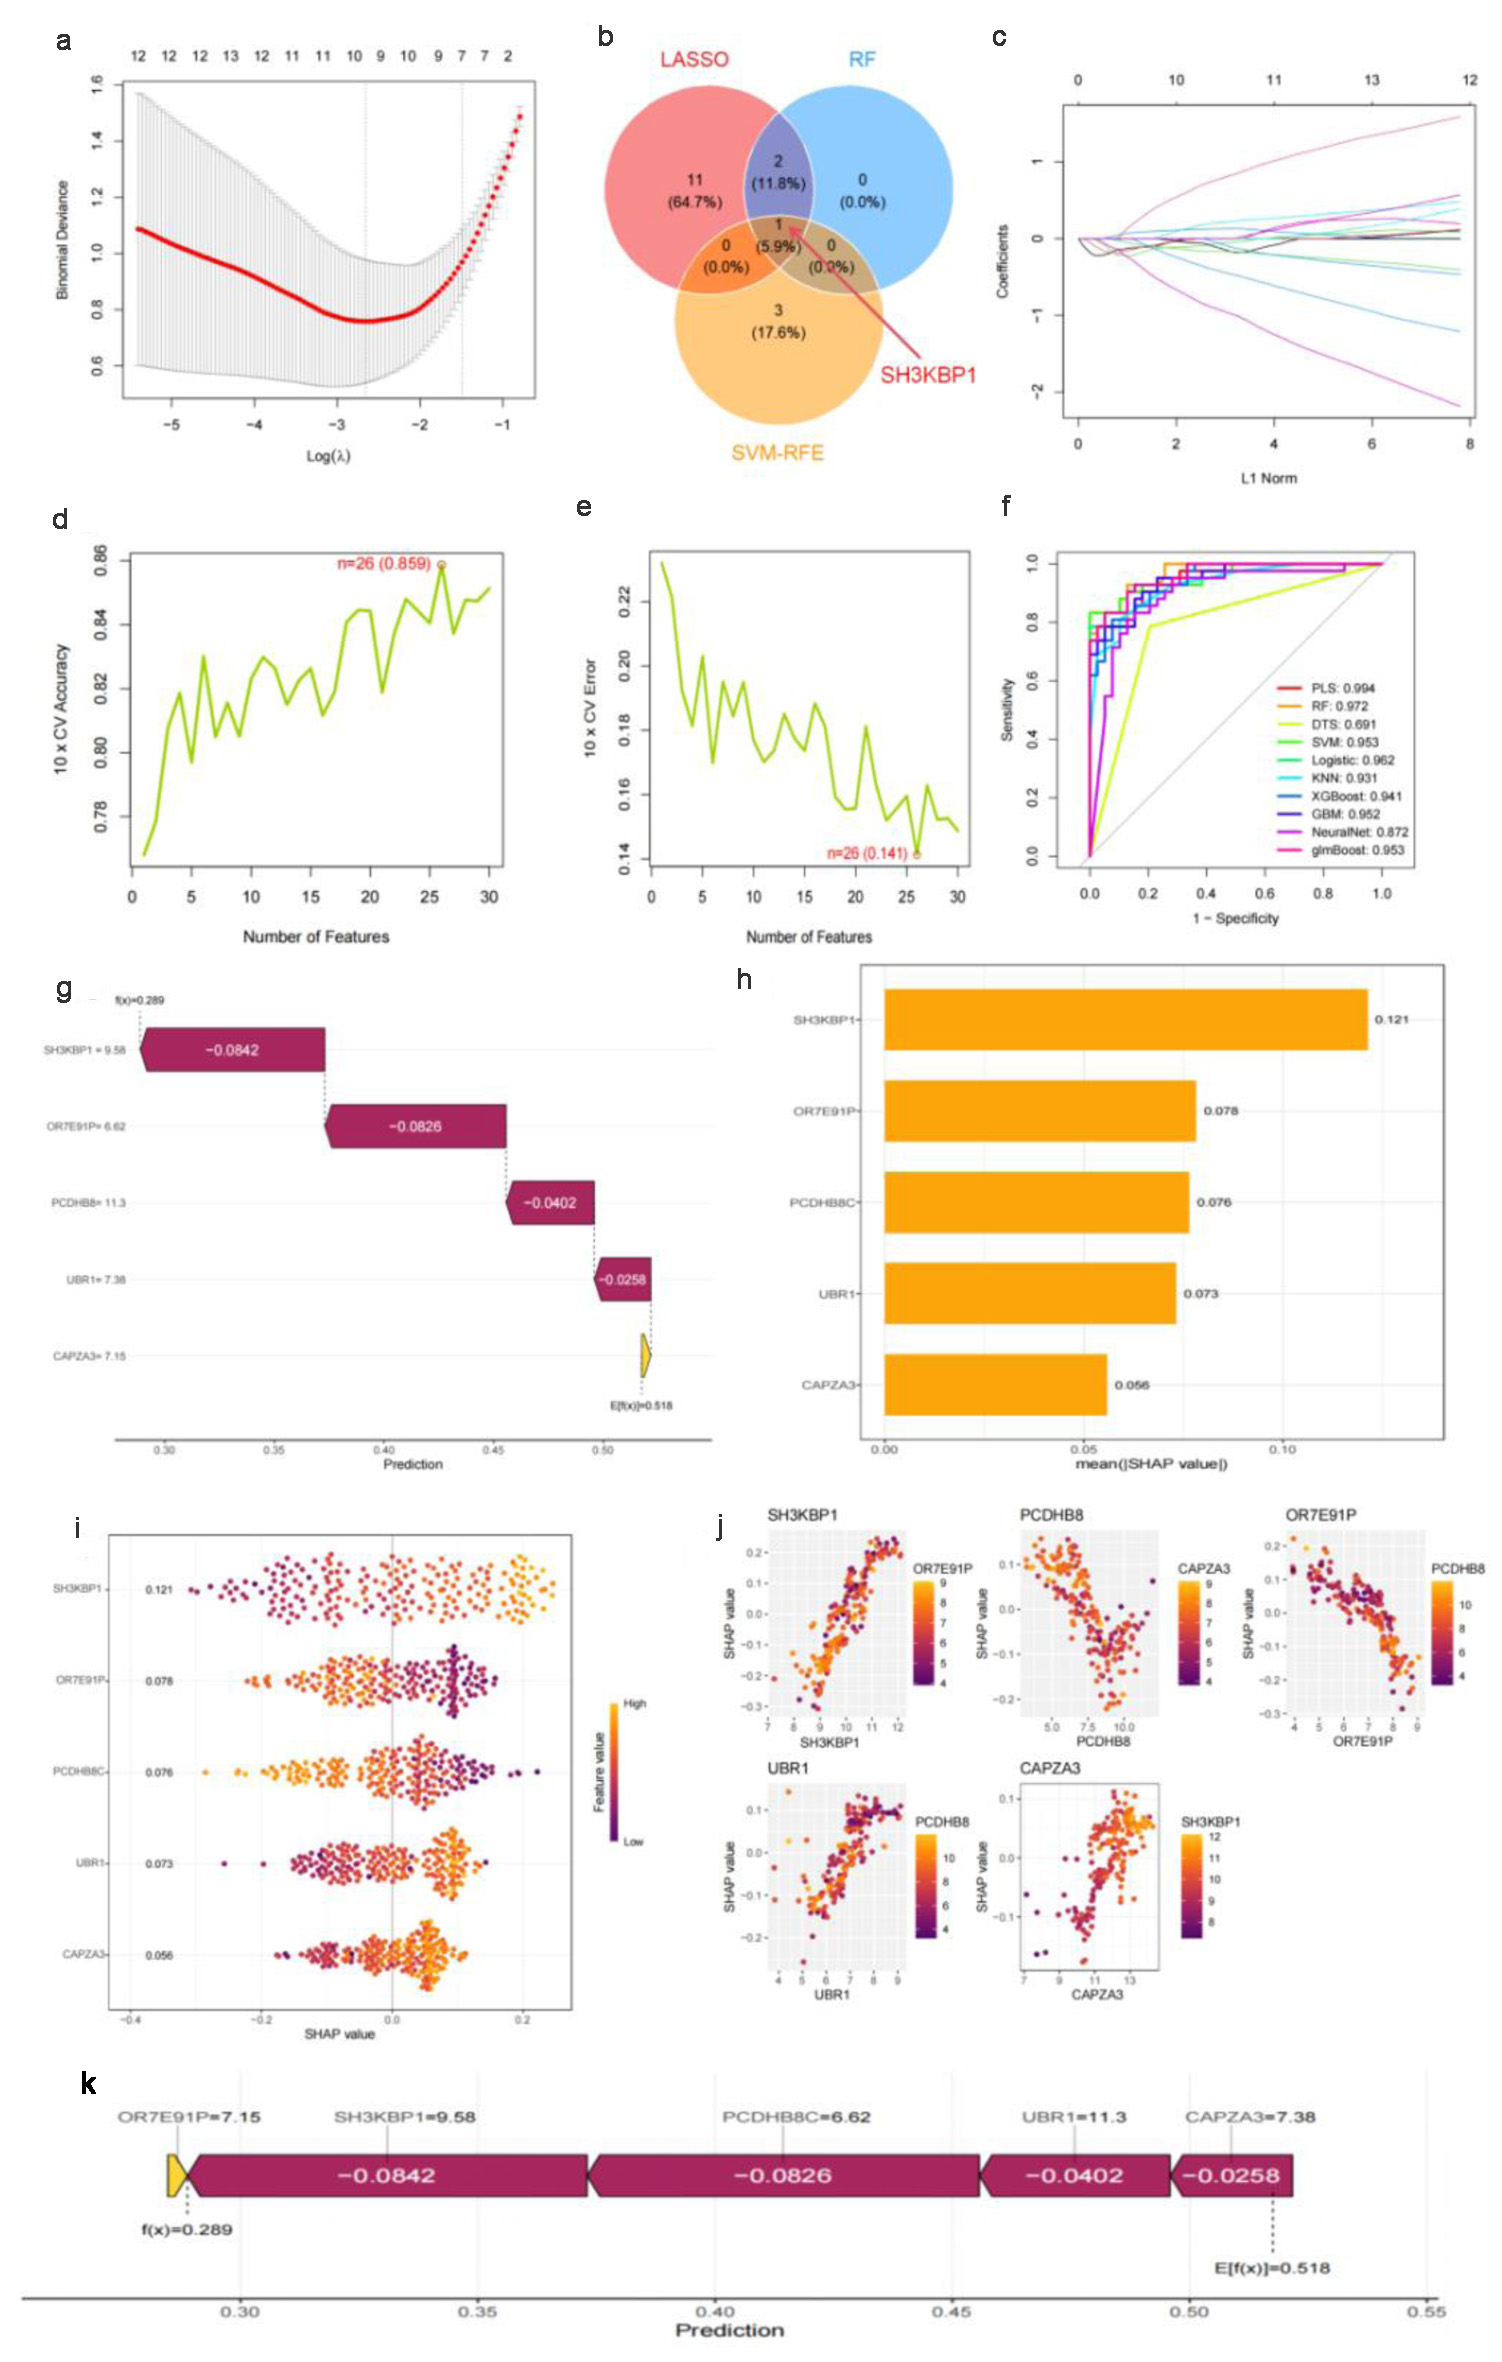
LASSO regression 10-fold cross-validation showed that SH3KBP1 was successfully retained at the optimal λ parameter, which corresponds to the best model complexity balance point (Fig. 2a). Consistency validation across multiple algorithms demonstrated that SH3KBP1 was identified as a core predictive feature by the LASSO, RF, and SVM-RFE algorithms, thus occupying an important position at the intersection of the corresponding Venn diagram (Fig. 2b). LASSO coefficient path analysis showed that the coefficient of SH3KBP1 remained stable during the shrinkage process as λ increased (Fig. 2c).
 Click for large image |
Figure 2. Machine learning feature selection and SHAP interpretability analysis based on multiple datasets. (a) Ten-fold cross-validation λ parameter selection curve for LASSO regression, with the optimal λ value marked by a red vertical line. (b) Venn diagram of feature selection results from three machine learning algorithms (LASSO, RF, SVM-RFE), with SH3KBP1 located in the intersection area of the algorithms. (c) LASSO regression coefficient shrinkage path diagram. (d) Ten-fold cross-validation accuracy curve with the number of features, showing a maximum accuracy of 0.850. (e) Ten-fold cross-validation error rate curve, showing a minimum error rate of 0.141. (f) ROC performance comparison of multiple machine learning algorithms, with the PLS algorithm having the highest AUC (0.994). (g) Univariate prediction efficiency analysis of key genes. (h) SHAP feature importance ranking diagram. (i) SHAP value summary diagram, showing the distribution of the impact of gene expression on prediction. (j) SHAP dependence diagram, showing the interaction between SH3KBP1 and such genes as PCDH8B, OR7E31P, USR1, and CAPZA3. (k) Flowchart of the final prediction model constructed based on key genes. |
Model performance evaluation confirmed the predictive value of SH3KBP1. Ten-fold cross-validation results showed that the feature combination including SH3KBP1 achieved the best accuracy of 0.850 with 28 features (Fig. 2d), and the prediction error rate dropped a minimum of 0.141 with 26 features (Fig. 2e). Multi-algorithm ROC performance comparison showed that the model incorporating SH3KBP1 achieved the highest AUC value of 0.994 in the neural network algorithm, with AUC values exceeding 0.960 in PLS, RF, DTS, and other algorithms (Fig. 2f). Univariate analysis showed that SH3KBP1 exhibited excellent independent predictive ability among the candidate genes (Fig. 2g). SHAP interpretability analysis revealed the significant contribution of SH3KBP1, with this gene ranking high in feature importance (Fig. 2h). SHAP value distribution analysis showed significant differences in SHAP value distribution between high and low expression samples, indicating that changes in SH3KBP1 expression had a significant impact on model prediction (Fig. 2i). SHAP dependency plots further revealed the complex interaction patterns of SH3KBP1 with other key genes, including synergistic effects with PCDH8B and OR7E31P, as well as regulatory relationships with USR1 and CAPZA3 (Fig. 2j). The final predictive model integrated the regression coefficients of such key genes as OR7E31P (-7.15), SH3KBP1 (-9.58), PCDH8B (-6.62), USR1 (-11.3), and CAPZA3 (-7.38), outputting a comprehensive risk prediction probability (Fig. 2k).
SH3KBP1 is highly expressed in PDAC and has potential prognostic value
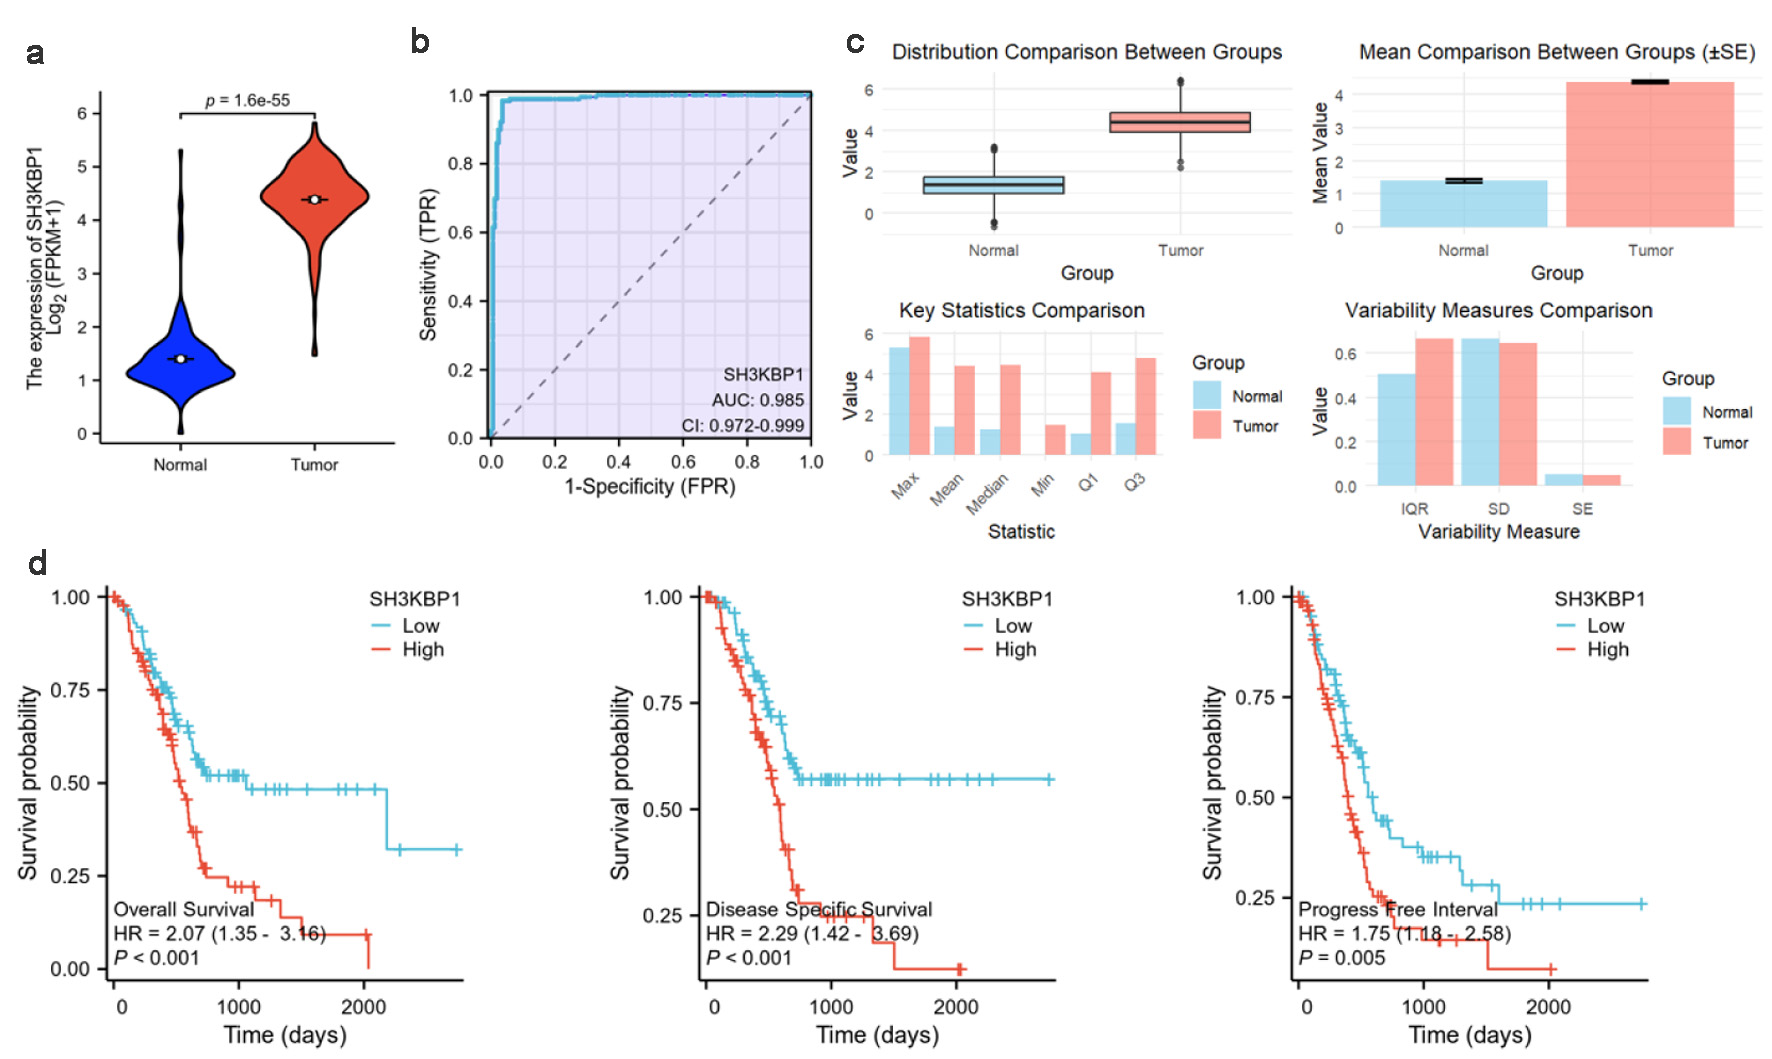
In the TCGA-PDAC dataset, SH3KBP1 expression was significantly higher in tumor tissues than normal tissues (Fig. 3a). ROC curve analysis indicated its excellent tumor identification ability with an AUC of 0.985 (Fig. 3b). Further statistical comparison showed that the mean, standard deviation, and distribution range of SH3KBP1 expression in the tumor group were all higher than those in the normal group (Fig. 3c). Kaplan-Meier analysis indicated that high SH3KBP1 expression was associated with poorer overall survival (OS), disease-specific survival (DSS), and progress-free interval (PFI; Fig. 3d).
 Click for large image |
Figure 3. SH3KBP1 expression and its clinical correlation analysis in the TCGA-PDAC dataset. (a) Expression distribution of SH3KBP1 in normal groups and tumor groups. (b) ROC diagnostic curve analysis of SH3KBP1. (c) Comparison of expression level distribution, mean value, and statistical characteristics. (d) Kaplan-Meier survival analysis of SH3KBP1 expression level with OS, DSS, and PFI. |
SH3KBP1 protein level is significantly elevated in PDAC tissues
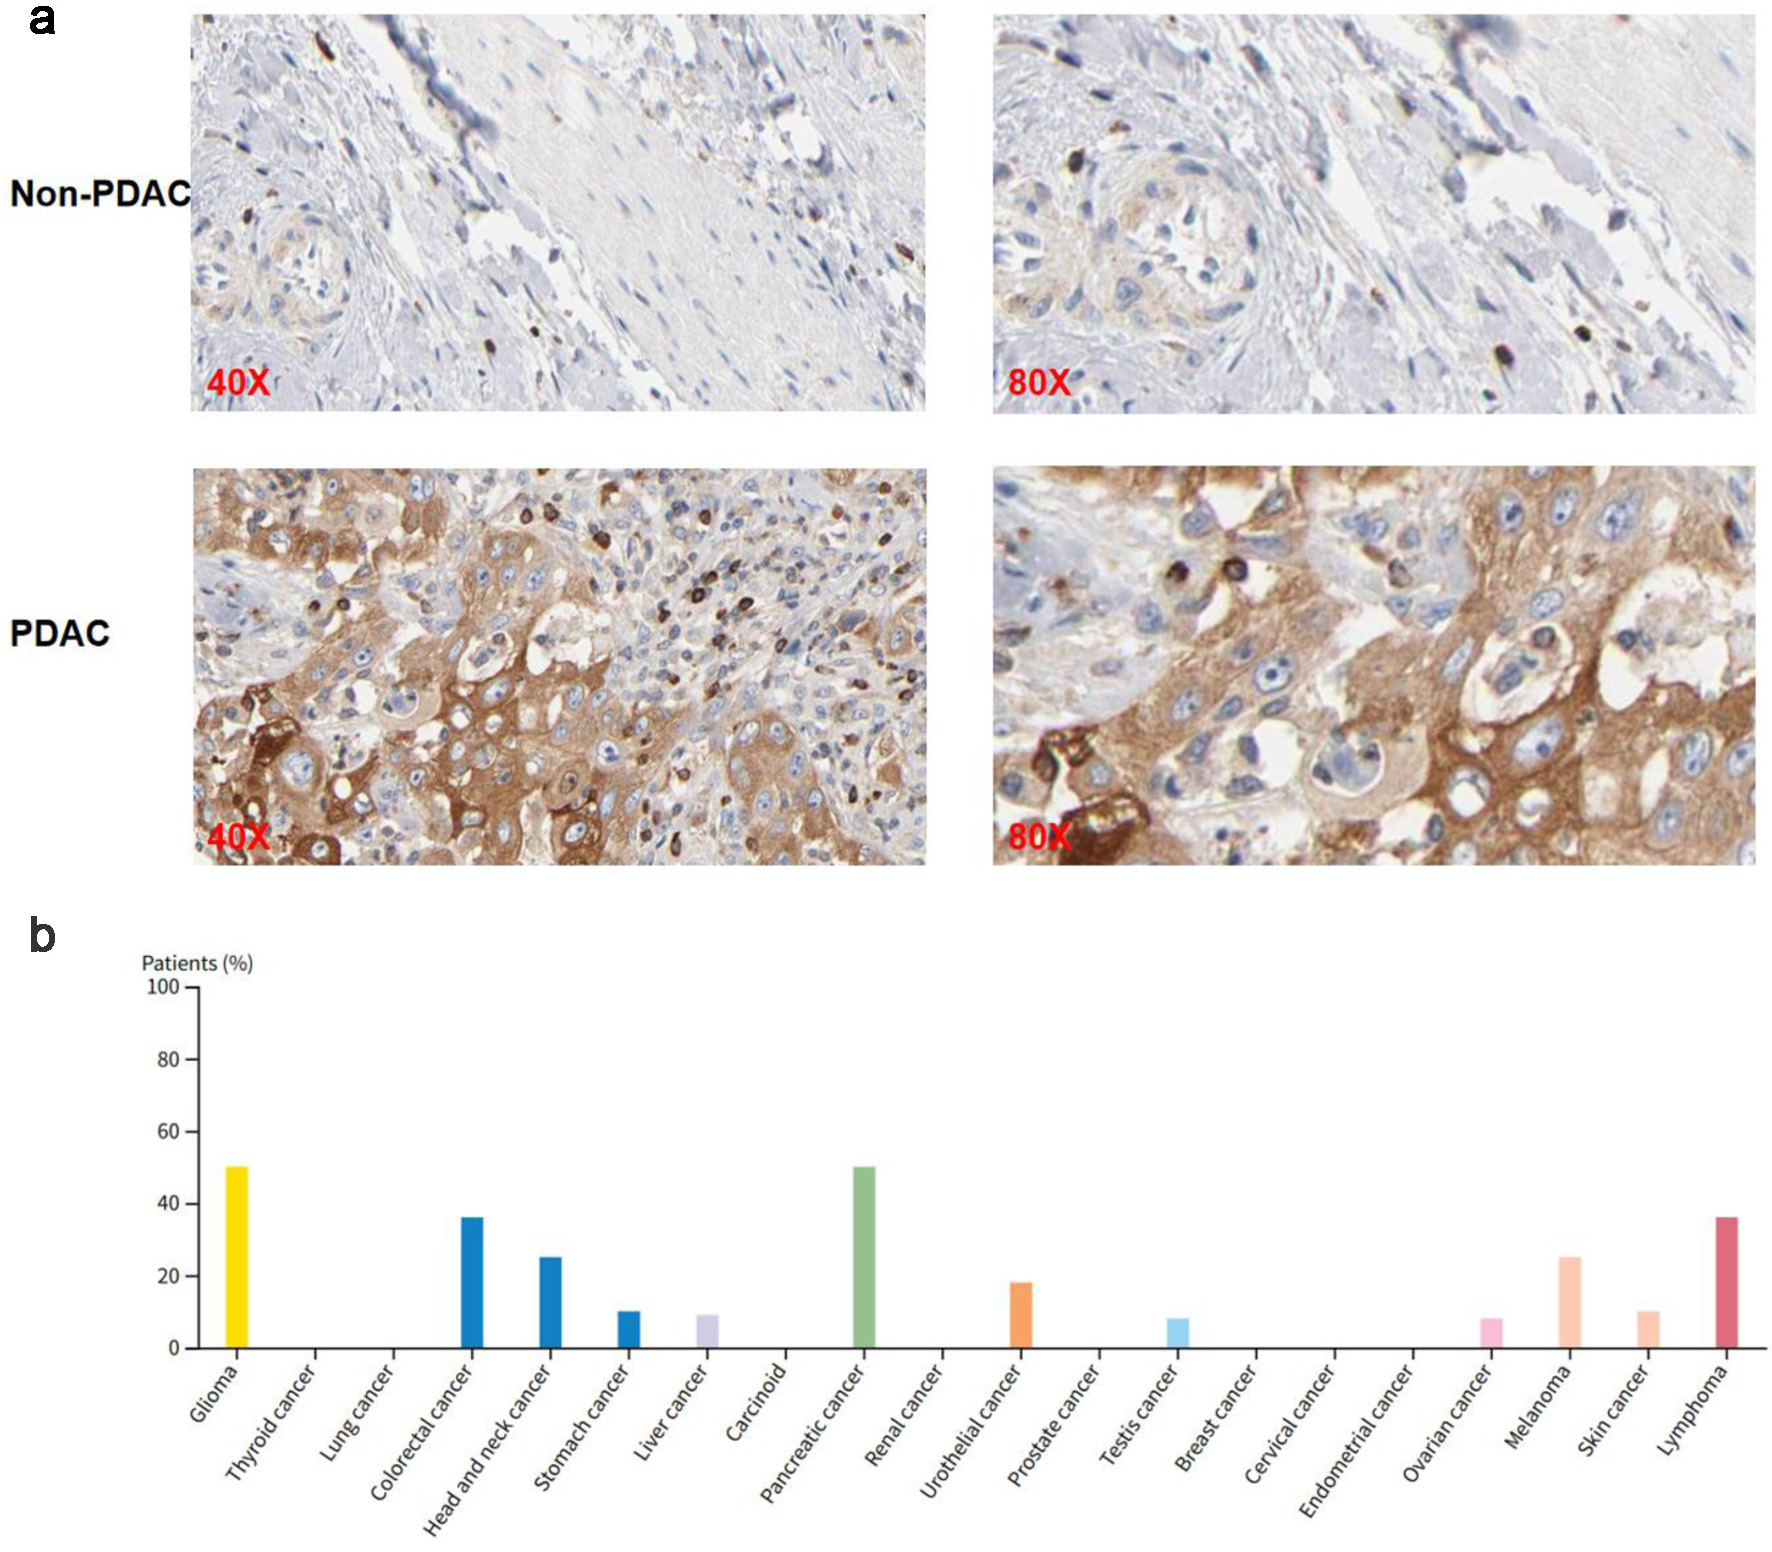
Immunohistochemical images from the THPA database showed that SH3KBP1 was prominently expressed in PDAC tissues but almost undetectable in non-tumor tissues (Fig. 4a). Further statistics showed that SH3KBP1 was expressed in various tumor types, with PDAC patients showing a relatively high positive ratio (Fig. 4b).
 Click for large image |
Figure 4. SH3KBP1 protein expression analysis based on the THPA (Antibody: HPA003351). (a) Immunohistochemical images showing the expression of SH3KBP1 in non-PDAC and PDAC tissues, with magnification levels of × 40 and × 80. (b) Distribution of the proportion of positive patients with SH3KBP1 in various tumor types. |
Protein-level validation of SH3KBP1 upregulation in PDAC
Using PDC database, this study analyzed protein expression data from 300 PDAC samples and 300 non-tumor samples. The violin plot showed that SH3KBP1 expression was significantly elevated in PDAC samples (Fig. 5a), and its ROC curve AUC was 0.911, further supporting its potential diagnostic value (Fig. 5b).
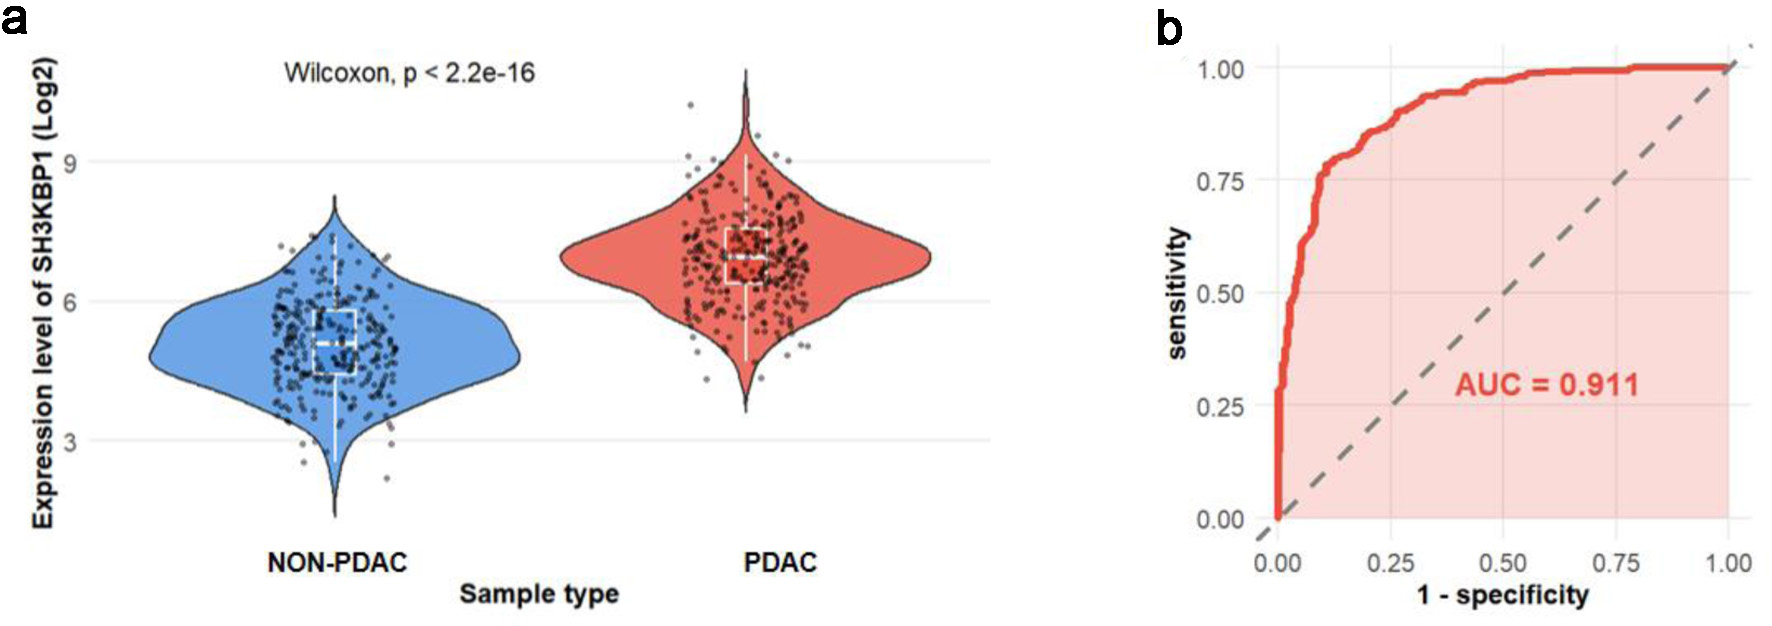 Click for large image |
Figure 5. SH3KBP1 protein expression analysis based on the PDC database. (a) Violin plot showing the expression distribution of SH3KBP1 in non-PDAC and PDAC samples (300 cases in each group). (b) ROC curve evaluating the discriminative ability of SH3KBP1 in PDAC (AUC = 0.911). |
SH3KBP1 shows functional dependency in PDAC cell survival
CRISPR knockout experimental results from the DepMap database showed that SH3KBP1 knockout led to mildly negative CRISPR scores in PDAC cell lines, including JOPACA1, PATU8988S, BXPC3, and KP2, suggesting its potential involvement in tumor cell growth regulation (Fig. 6).
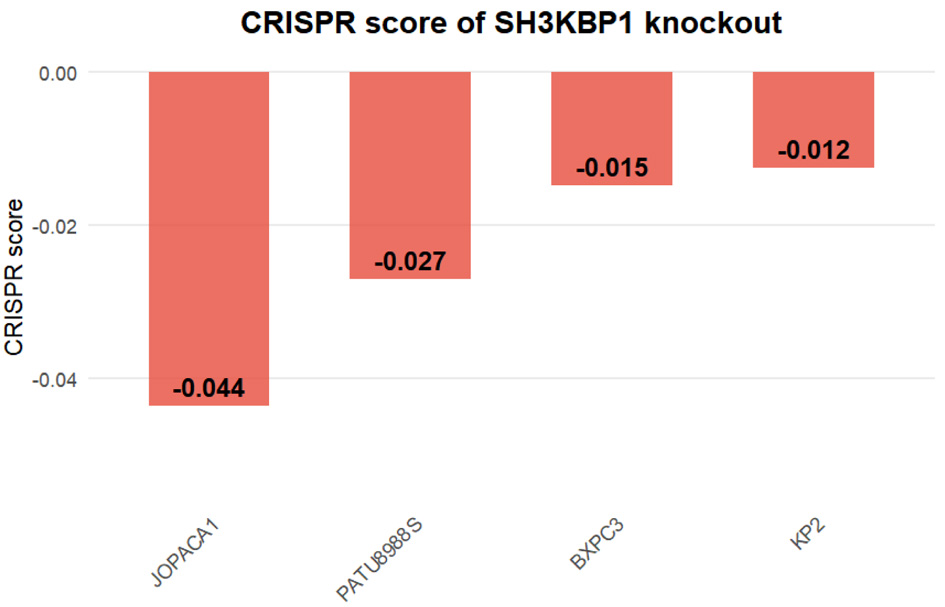 Click for large image |
Figure 6. CRISPR knockout score of the SH3KBP1 gene in PDAC cell lines based on the DepMap database. Bar chart showing the CRISPR dependency scores (CRISPR score) of SH3KBP1 in four PDAC cell lines (JOPACA1, PATU8988S, BXPC3, and KP2). |
Single-cell analysis reveals that SH3KBP1 is mainly expressed in malignant cells
Single-cell transcriptomic data from the PRJNA885258 project were analyzed to assess cell heterogeneity. Quality control parameters (nFeature, nCount, and MT.percent) showed reasonable distributions (Fig. 7a), and t-SNE clustering clearly separated multiple cell types, including T cells, macrophages, fibroblasts, and malignant cells (Fig. 7b). A pie chart further quantified the proportion of each cell type, with malignant cells constituting the highest proportion (Fig. 7c). DotPlot showed characteristic marker gene expression in each cell type (Fig. 7d). SH3KBP1 expression was primarily enriched in the malignant cell population in the t-SNE space (Fig. 7e). Further single-cell CNV heatmap analysis, compared with normal reference cells, confirmed that this population exhibited significant chromosomal instability, supporting its identification as tumor cells (Fig. 7f).
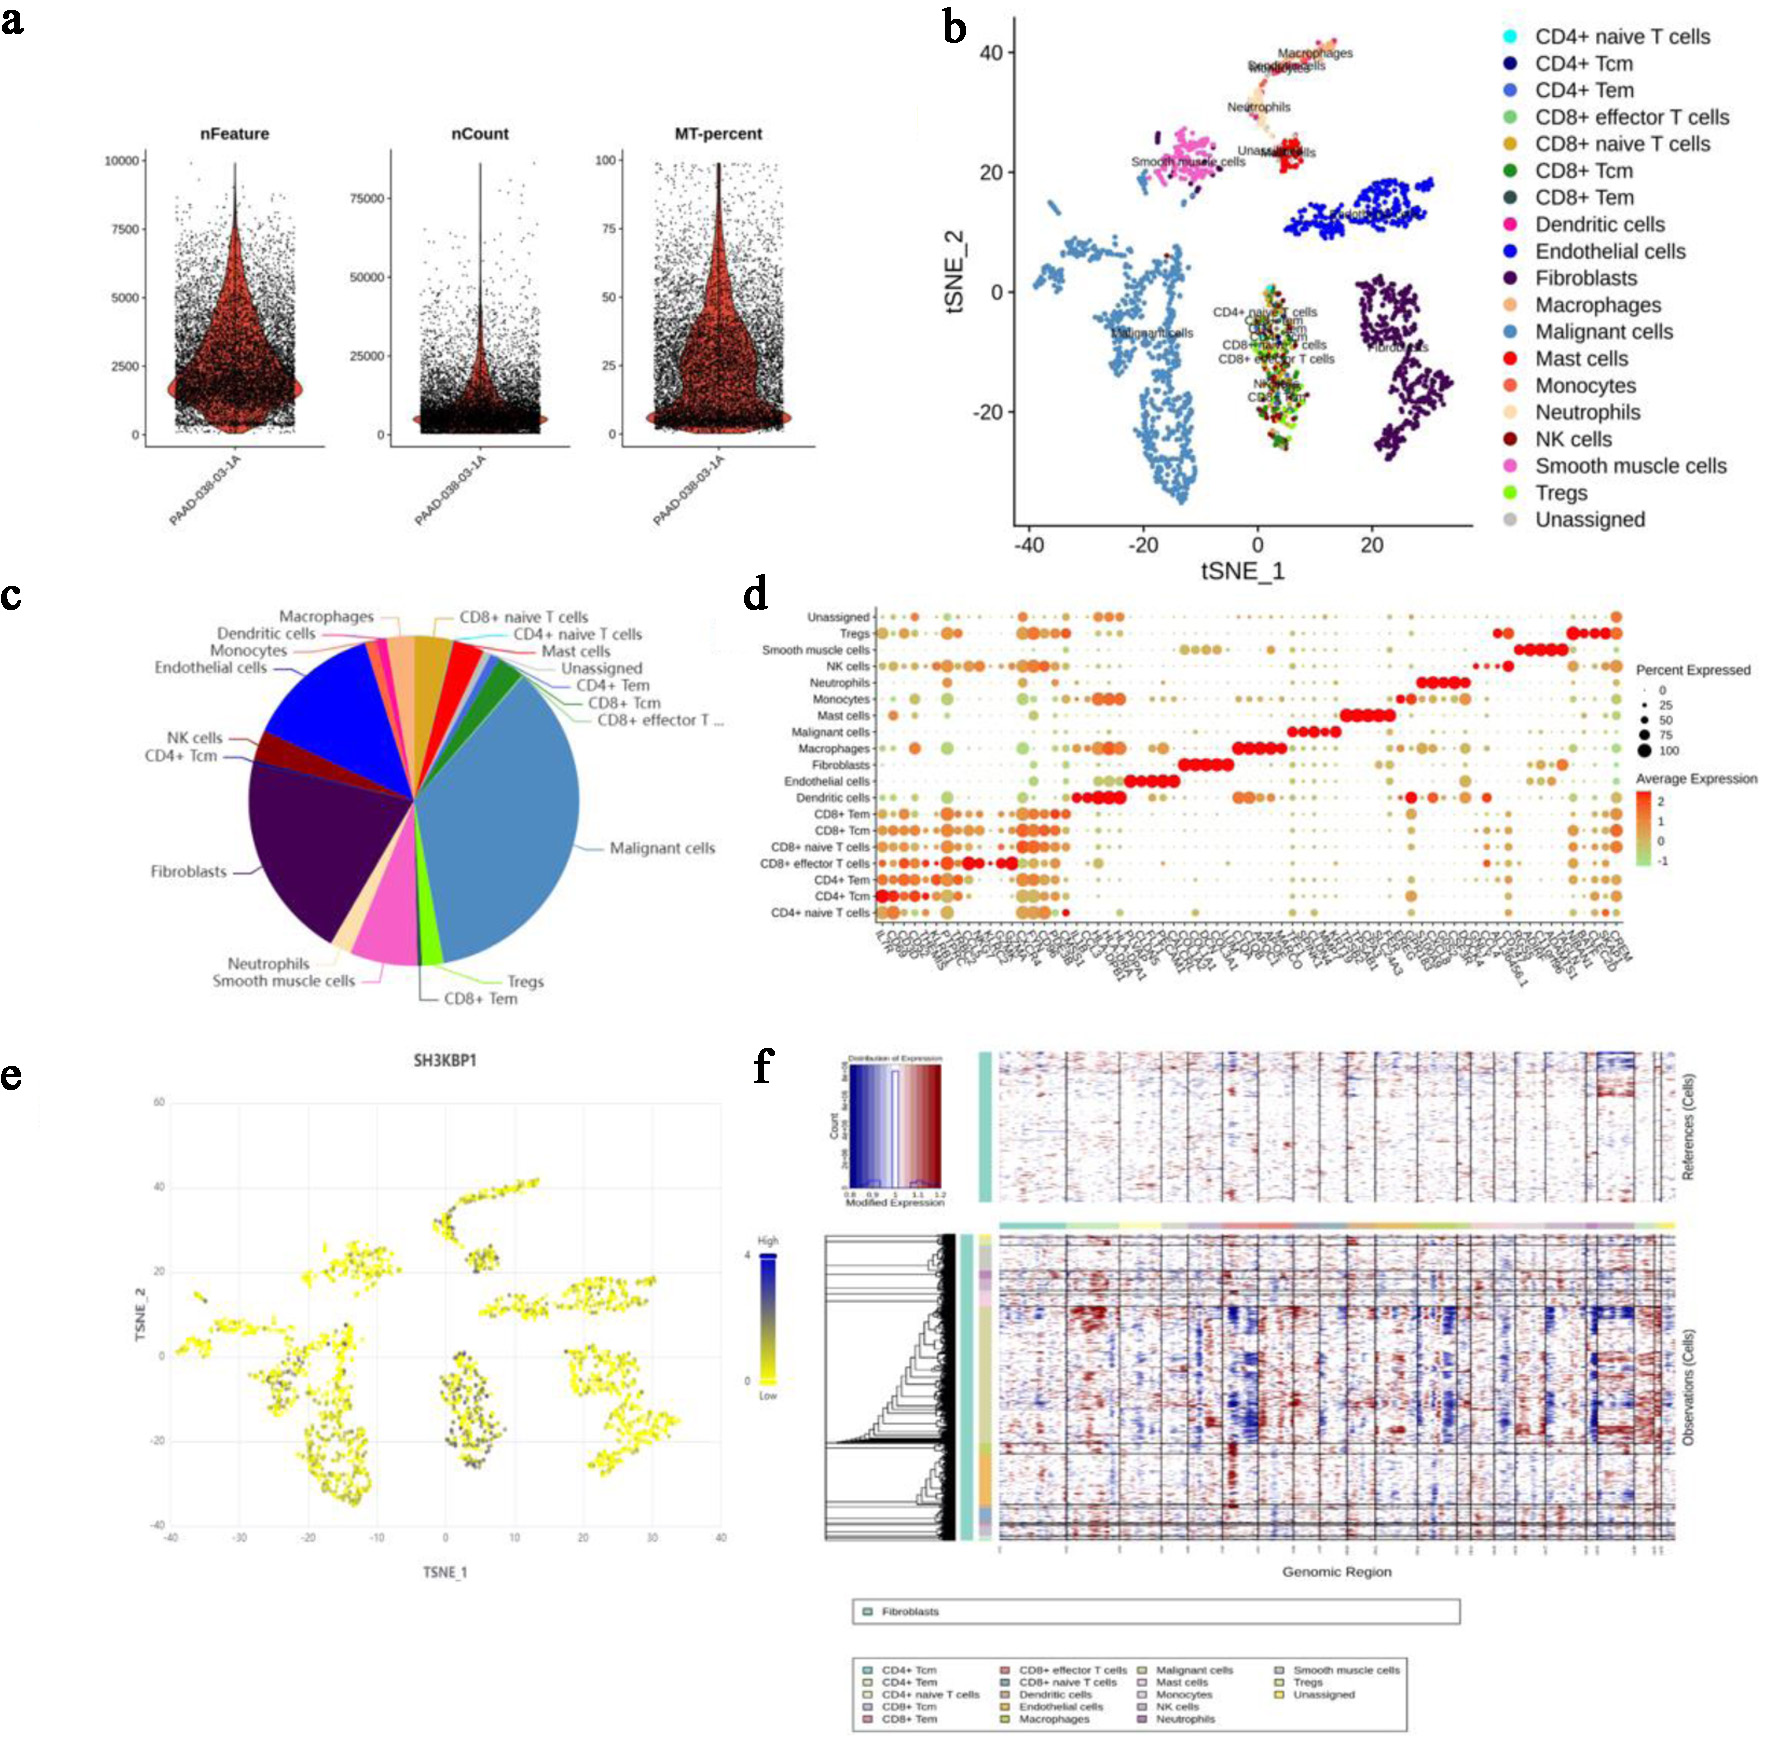 Click for large image |
Figure 7. Analysis of cell heterogeneity and SH3KBP1 expression in PDAC tissues based on single-cell sequencing data from the NCBI SRA project (accession number: PRJNA885258). (a) Sample quality control parameters, including the number of genes (nFeature), number of UMIs (nCount), and mitochondrial gene ratio (MT.percent). (b) t-SNE dimensionality reduction map showing the spatial distribution of different cell populations. (c) Pie chart showing the composition ratio of various cell types in the sample. (d) DotPlot showing the expression levels and expression proportions of characteristic marker genes in each cell population. (e) Expression distribution of SH3KBP1 in various cell populations (t-SNE map). (f) Inference of whether cells are malignant based on single-cell CNV analysis, with the upper panel showing reference cells (e.g., T cells) and the lower panel showing the CNV heatmap of other cells. |
Spatial expression analysis shows SH3KBP1 elevated in tumor regions
Based on spatial transcriptomic data from GSM8452847, hematoxylin and eosin (H&E) staining images and nCount_Spatial distribution maps showed the tissue structure and sequencing quality (Fig. 8a, left). Key PDAC driver genes (CDKN2A, TP53) also exhibited characteristic expression patterns in the tumor region (Fig. 8a, right). KRAS and SMAD4 spatial expression maps were used to construct the tumor score (Fig. 8b), further distinguishing the tissue into normal and tumor regions (Fig. 8c). SH3KBP1 exhibited significantly higher expression in tumor regions (Fig. 8d, left), as confirmed by the violin plot statistical analysis (Fig. 8d, right).
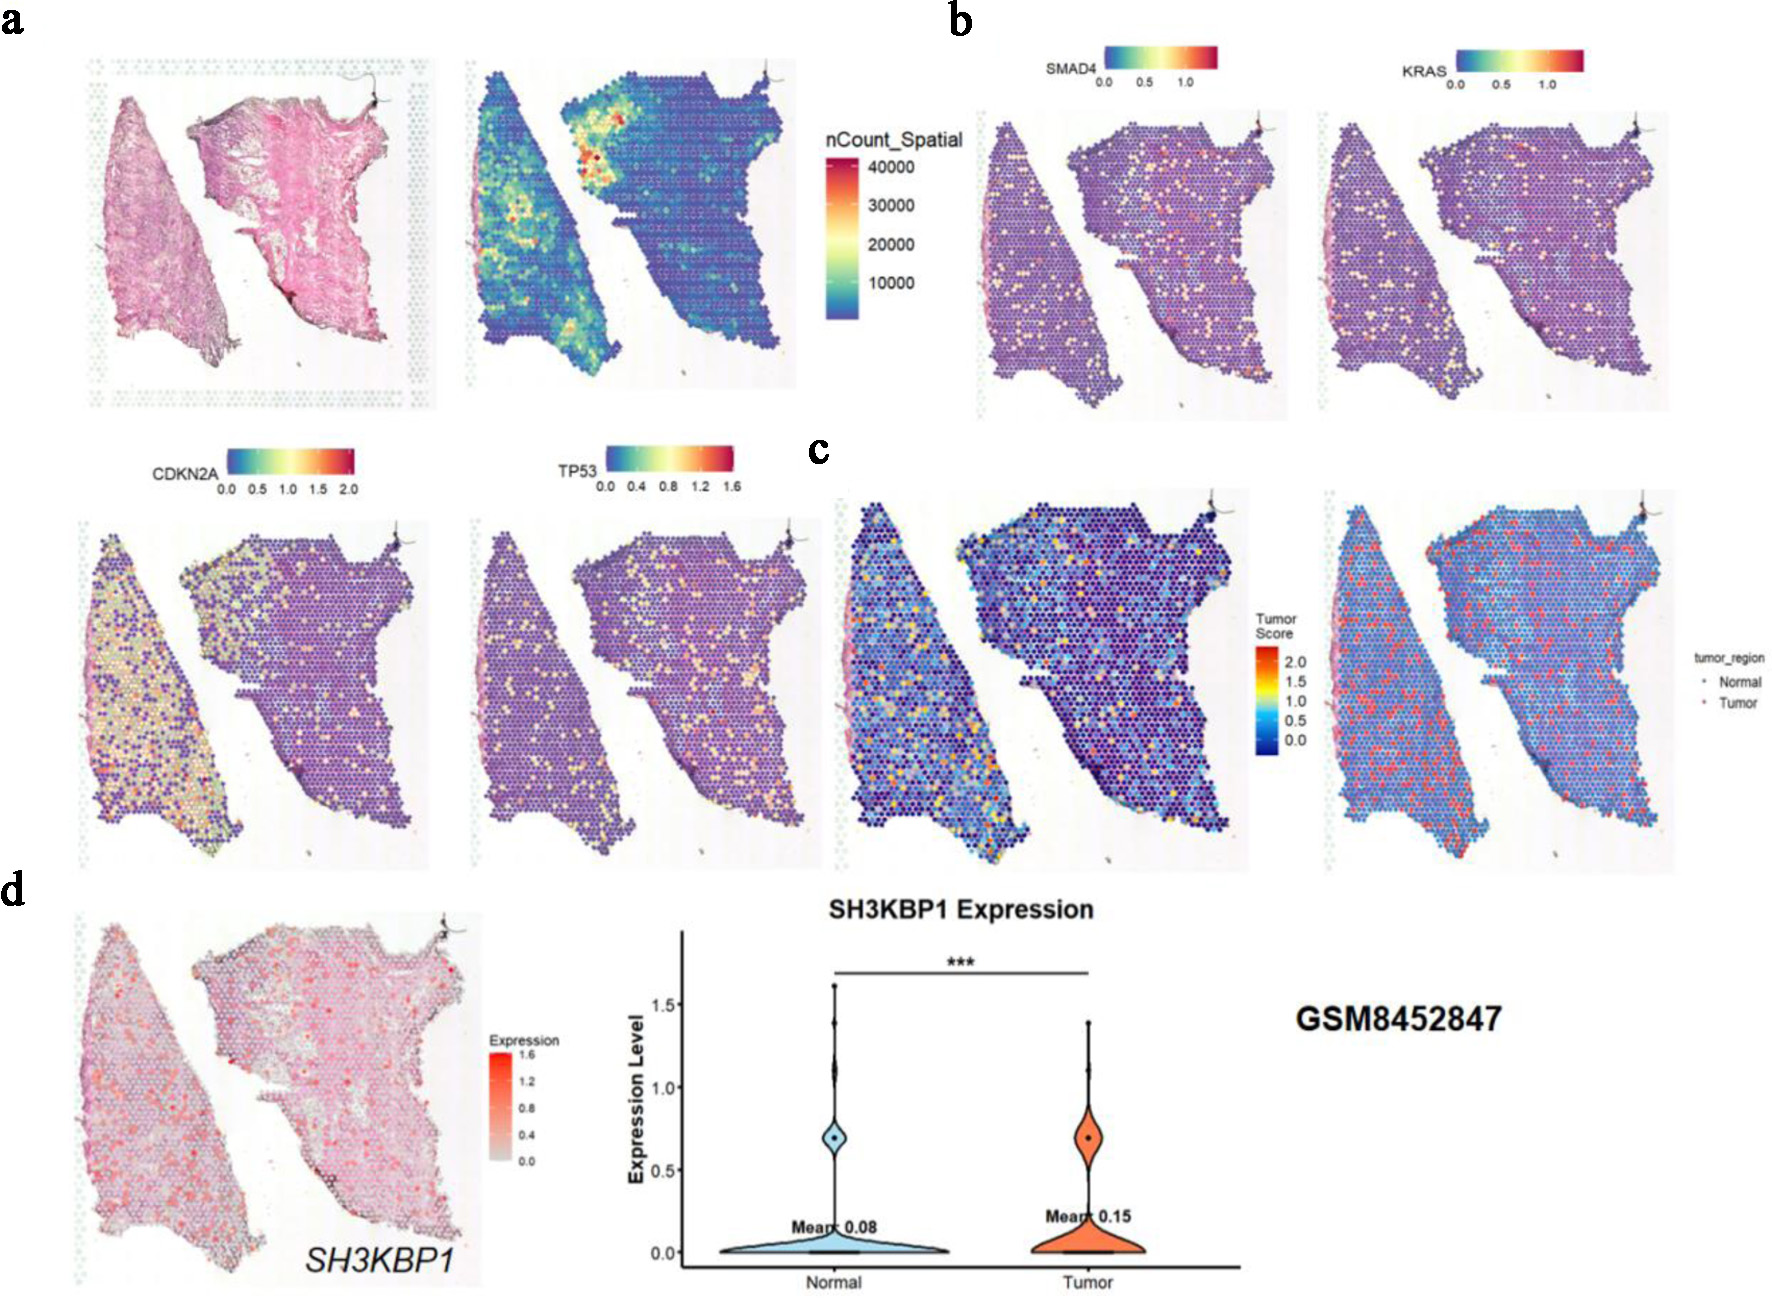 Click for large image |
Figure 8. Spatial expression analysis of SH3KBP1 based on GSM8452847 spatial transcriptome data. (a) Spatial tissue structure map, spatial UMI count map (nCount_Spatial), and expression distribution of tumor key genes (CDKN2A, TP53) in tissue sections. (b) Spatial expression distribution of common driver genes (SMAD4, KRAS) in PDAC. (c) Tumor region heatmap and binary classification region map (Tumor vs. Normal) divided according to the expression patterns of key molecules (e.g., KRAS, TP53) in (b). (d) Spatial expression heatmap of SH3KBP1 and violin plot of its expression difference analysis between tumor regions and normal regions. |
Multi-databases integrating to identify potential upstream transcription factors for SH3KBP1
This study integrated SH3KBP1 co-expressed genes (CEG), TCGA-PDAC DEGs, and the ChIP-seq target gene set from the PANC-1 cell line to identify four potential transcription factors that may regulate SH3KBP1: CTCF, ETS1, ZEB1, and SIN3A (Fig. 9a). Based on the predictions from the Cistrome Data Browser (CDB) database, CTCF and ZEB1 had higher binding scores at the SH3KBP1 promoter region (1.23 and 0.944, respectively), suggesting their potential regulatory roles (Fig. 9b).
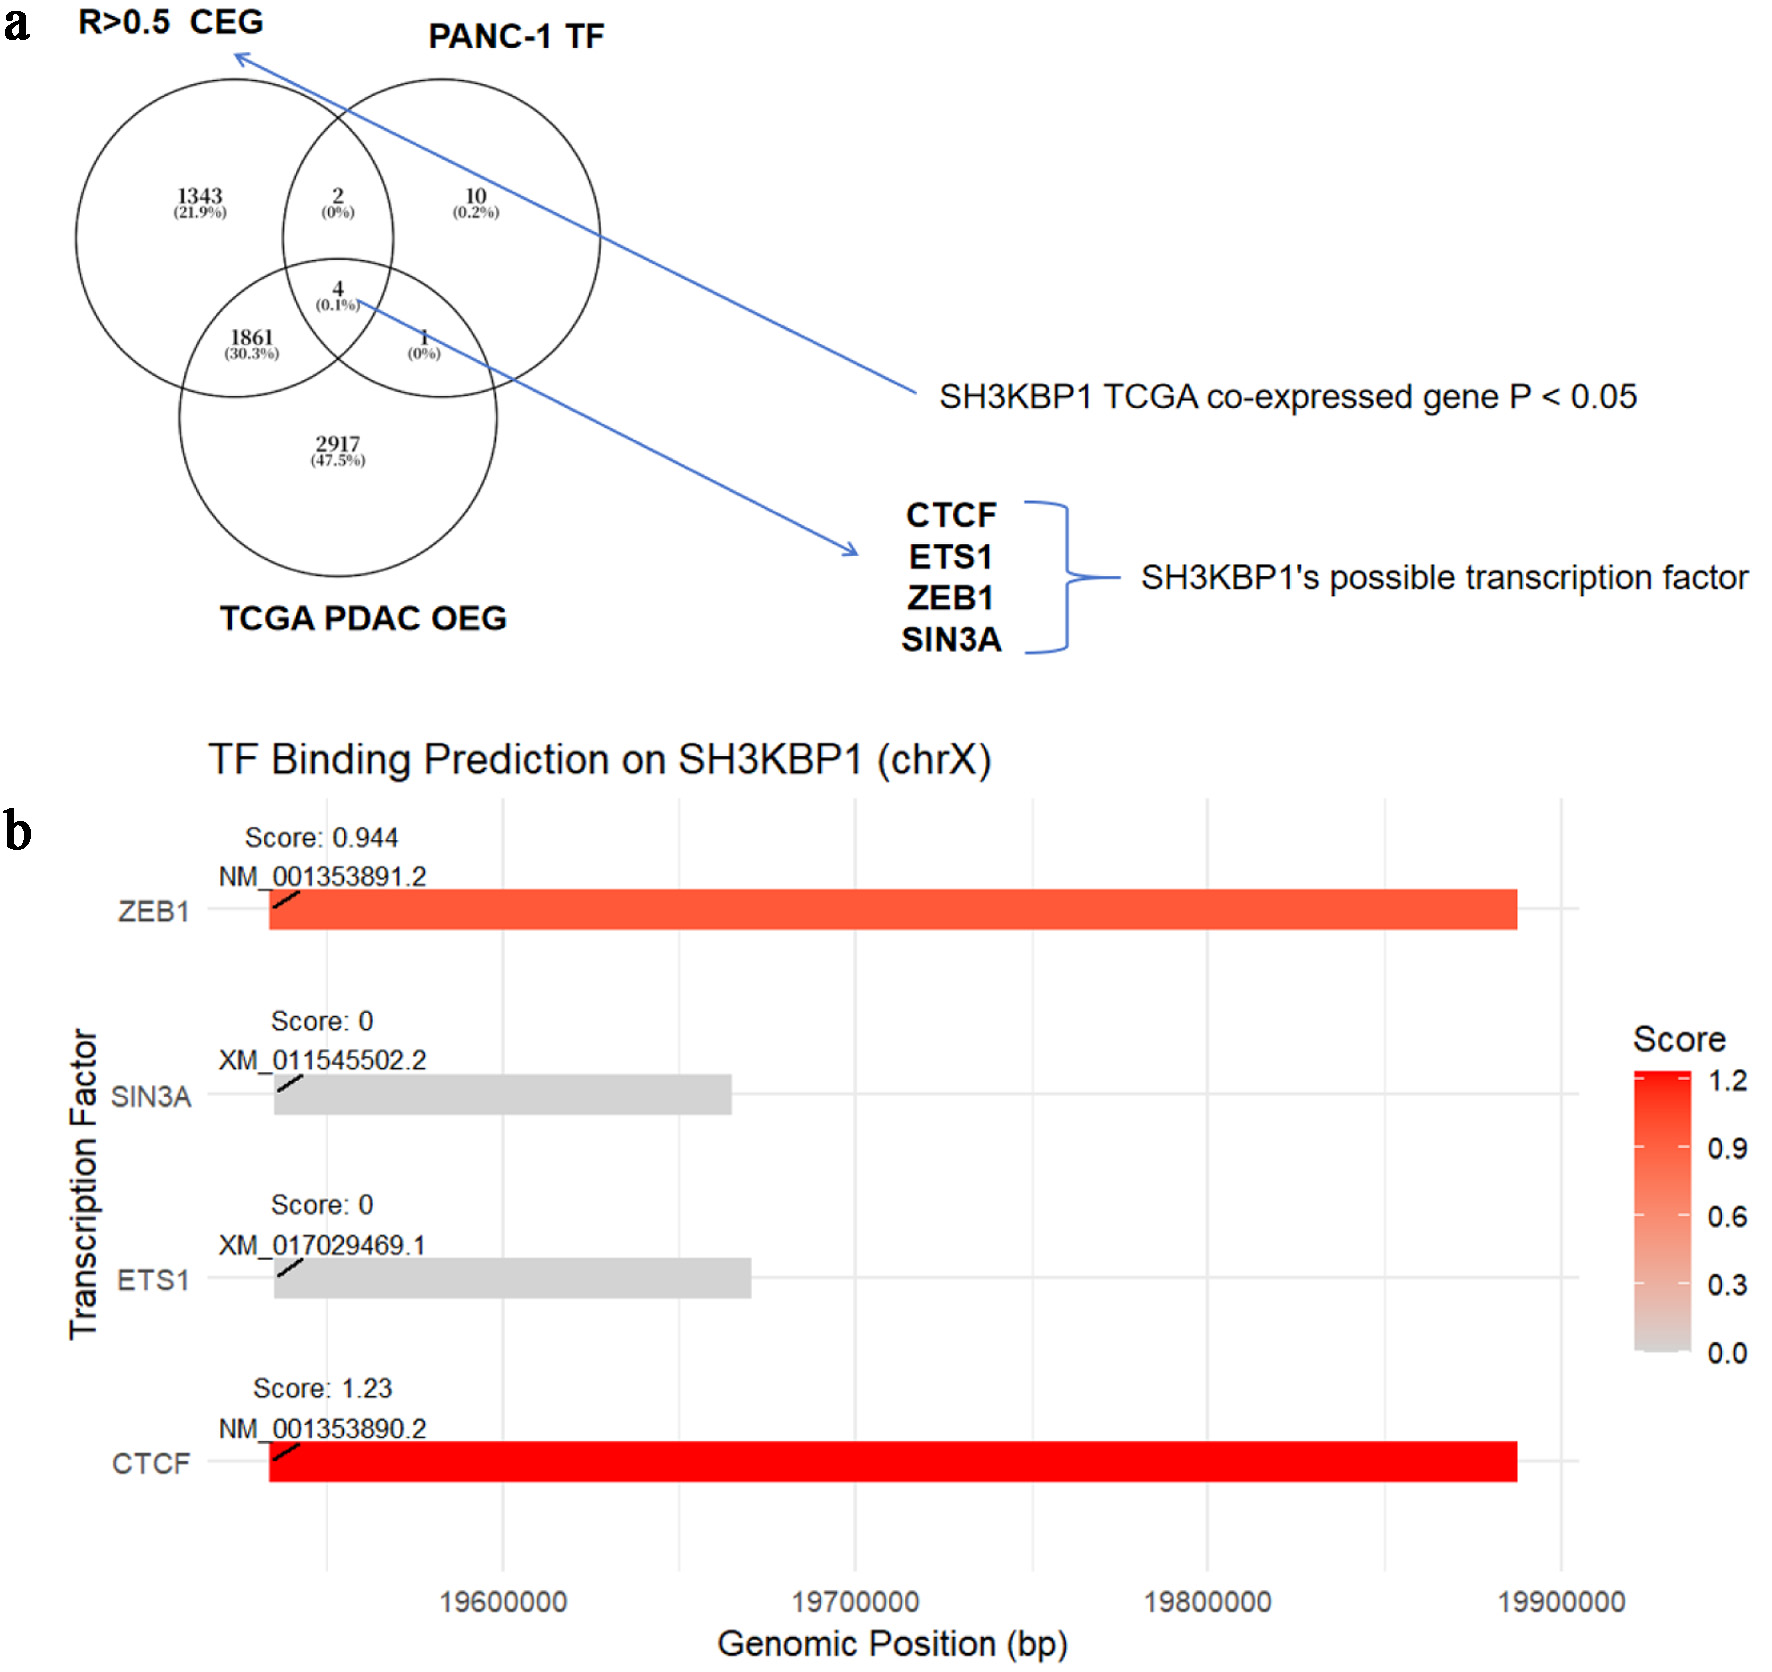 Click for large image |
Figure 9. Prediction analysis of potential transcription factors of SH3KBP1 based on the CDB database. (a) Venn diagram showing the intersection of SH3KBP1-coexpressed genes (P < 0.05) in TCGA-PDAC, upregulated DEG, and TF targets in the PANC-1 cell line, screening out four candidate transcription factors (CTCF, ETS1, ZEB1, and SIN3A). (b) Binding sites and scoring of transcription factors predicted by the CDB database in the SH3KBP1 promoter region (chrX). |
CTCF may regulate SH3KBP1 transcription by binding to its promoter
TCGA data analysis showed that CTCF expression was significantly elevated in PDAC (Fig. 10a), with its ROC curve showing an AUC of 0.964, indicating its potential diagnostic value (Fig. 10b). Spearman correlation analysis further revealed a significant positive correlation between CTCF and SH3KBP1 (R = 0.517; Fig. 10c). ChIP-seq tracks showed that CTCF was enriched at the SH3KBP1 gene promoter region, suggesting its direct binding and regulation of SH3KBP1 transcriptional activity (Fig. 10d).
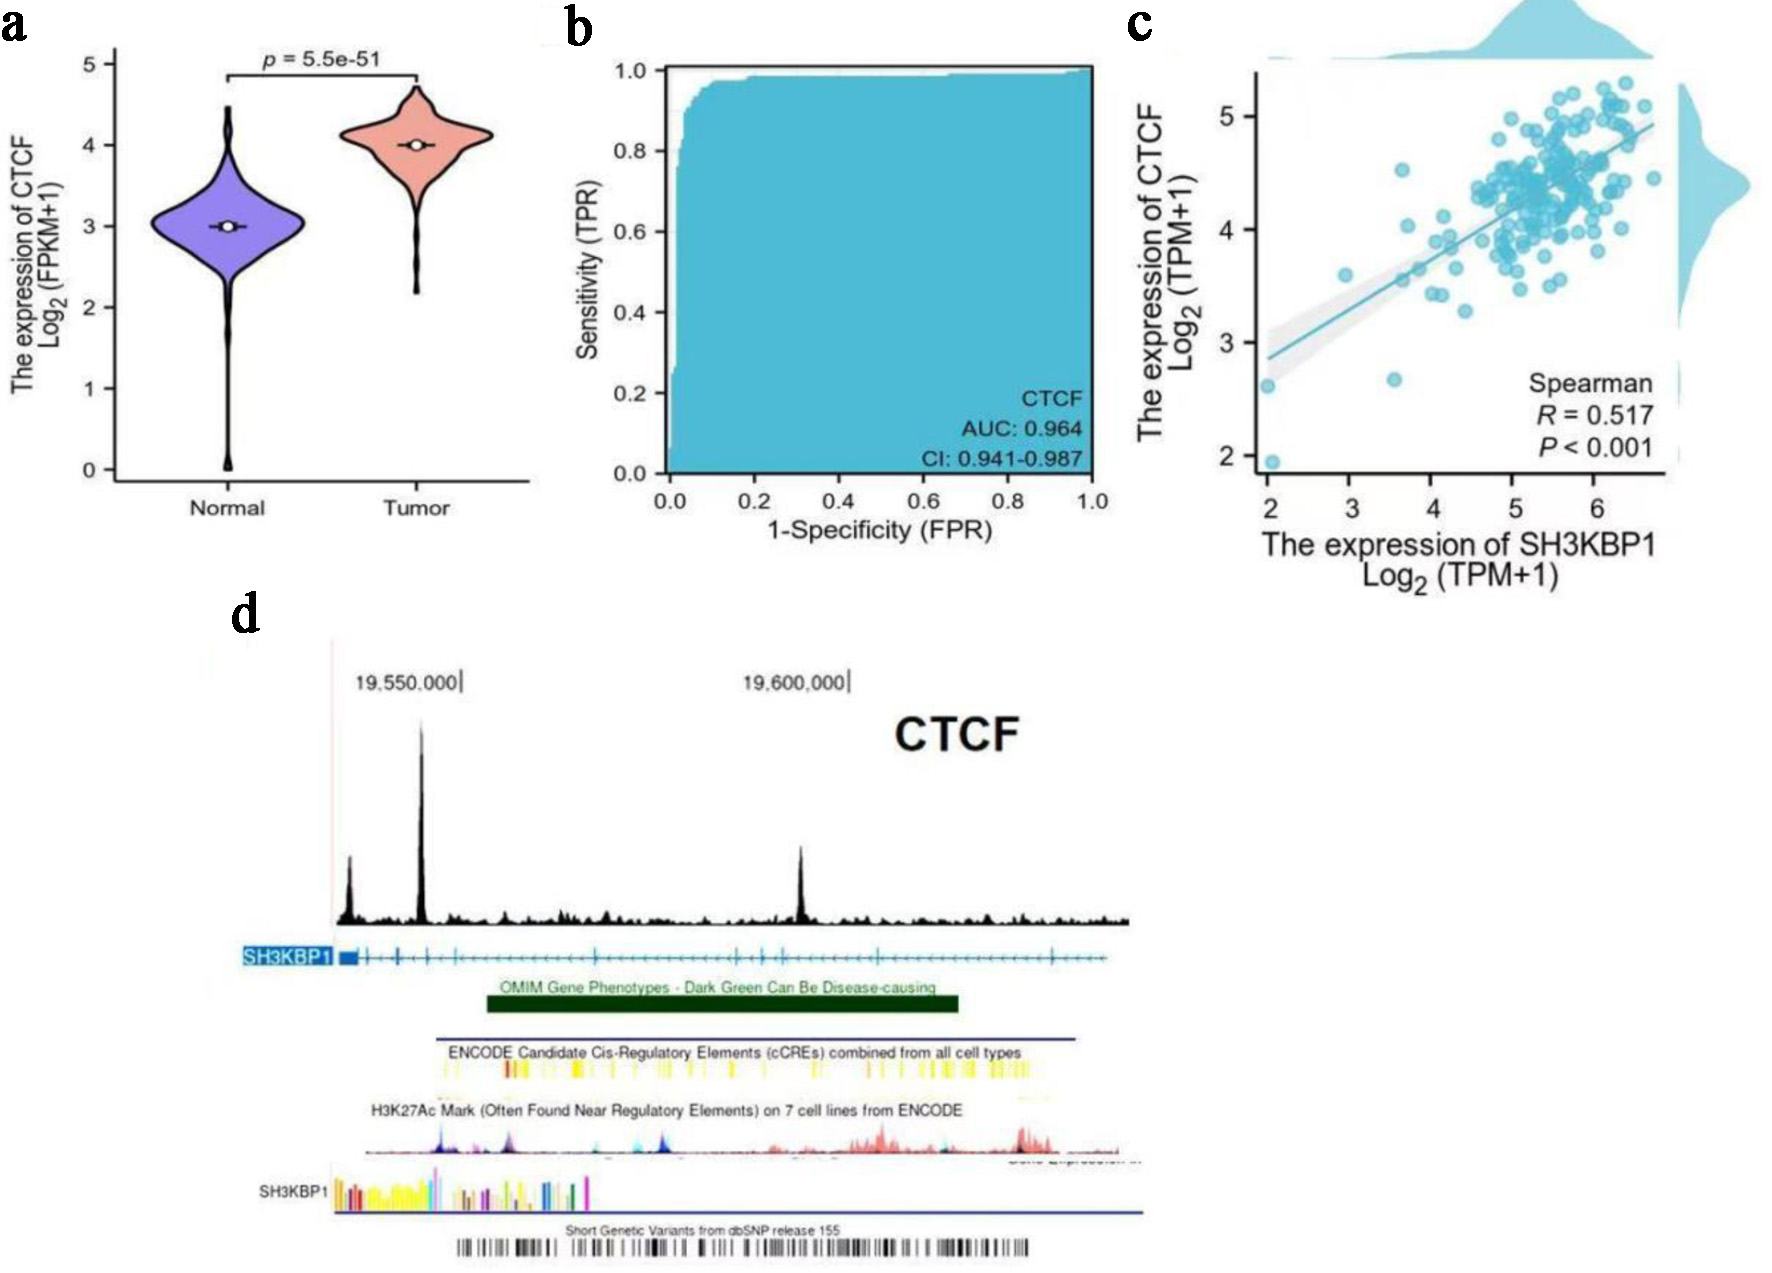 Click for large image |
Figure 10. Expression characteristics of CTCF in PDAC and its correlation with SH3KBP1. (a) Analysis of CTCF expression difference between normal tissues and tumor tissues in the TCGA database (Log2(FPKM+1)). (b) ROC curve evaluating the diagnostic efficacy of CTCF for PDAC (AUC). (c) Spearman correlation analysis of SH3KBP1 and CTCF expression levels in PDAC samples (Log2(TPM+1)). (d) ChIP-seq enrichment map of CTCF in the SH3KBP1 gene region (hg38 reference genome), showing its potential binding sites and transcriptional regulatory regions. |
| Discussion | ▴Top |
This study integrates transcriptomics, proteomics, single-cell omics, spatial transcriptomics, and functional dependency data to systematically evaluate the expression characteristics, biological functions, and potential regulatory mechanisms of SH3KBP1 in PDAC. The research provides systematic support for SH3KBP1 as a novel molecular marker and potential therapeutic target for PDAC, further revealing that it may contribute to tumorigenesis and development through multiple pathways. SH3KBP1 is an adaptor protein containing an SH3 domain. Early studies have shown that it participates in the formation of such signaling complexes as EGFR, c-CBL, and Grb2, regulating processes like receptor endocytosis, cell proliferation, and migration. In glioblastoma, SH3KBP1 has been confirmed to directly bind to EGFR, promoting the activation of downstream signaling pathways, including the RAS/RAF/MEK/ERK and PI3K/AKT axes, thereby enhancing tumor stemness and invasiveness [8]. As a signaling integrator, SH3KBP1 demonstrates the ability to promote cell growth and metastasis in various malignant tumors.
In PDAC, a highly malignant and immunosuppressive tumor, the function of SH3KBP1 has not been fully elucidated. This study finds that SH3KBP1 is widely overexpressed in PDAC tissues, suggesting that it may not only serve as a disease marker but also play a driving role. Combined with single-cell and spatial transcriptomic data, SH3KBP1 was shown to be predominantly enriched in malignant epithelial cells, exhibiting significant spatial heterogeneity in tumor tissues. This expression pattern is similar to its localization in glioblastoma stem cells, implying its potential involvement in maintaining PDAC stemness or regulating the epithelial-mesenchymal transition (EMT) process [9]. Furthermore, previous studies have shown that SH3KBP1 may promote tumor cell migration and invasion through the regulation of Rho GTPases [10, 11] and cytoskeleton remodeling, and its role in angiogenesis is gaining increasing attention [7]. Collectively, these mechanisms suggest that SH3KBP1 not only is involved in cell proliferation but also widely participates in tumor progression and metastasis, acting as a multifunctional cancer-associated molecule.
Furthermore, SH3KBP1 may function as a signaling integrator and amplifier in multiple classical cancer-related signaling pathways. As an adaptor protein for EGFR signaling, it may not only activate the RAS/RAF/MEK/ERK axis [12] but also enhance the activation of the PI3K/AKT pathway, involved in anti-apoptotic regulation and metabolic reprogramming [13]. Studies in breast cancer and other tumors have confirmed that SH3KBP1 promotes EGFR phosphorylation [14-16], further recruiting Src family kinases [17] and, thereby, enhancing the activity of downstream STAT3 and NF-κB signaling pathways [13]. These pathways are highly relevant to PDAC drug resistance, immunosuppressive state, and stemness maintenance.
In addition to the EGFR-related axis, SH3KBP1 may also regulate tumor metastasis and EMT status by modulating the TGF-β signaling pathway [18]. Through its SH3 domain, SH3KBP1 might interact with SMAD family regulators [19] to enhance the activation of TGF-β-induced EMT programs. Its high expression at the tumor infiltration edge suggests that it may be closely related to tumor cell plasticity. Moreover, studies have shown that SH3KBP1 is involved in the synergistic activation of the JAK/STAT pathway in certain malignancies [20, 21], possibly by regulating key molecules like IL-6R and SOCS, contributing to the remodeling of the inflammatory microenvironment and the construction of immune escape mechanisms. In metabolic reprogramming, SH3KBP1 may also regulate glycolysis (the Warburg effect) [22] and glutamine metabolism. Metabolomics studies have shown that under high SH3KBP1 expression, key glycolytic enzymes, such as HK2 and PKM2, are significantly upregulated [23-25], accompanied by increased nuclear expression of HIF-1α [26], suggesting that SH3KBP1 helps tumor cells adapt to hypoxic environments and gain metabolic advantages. This characteristic is particularly relevant to the low perfusion and high hypoxia features of the PDAC microenvironment. Additionally, SH3KBP1 may participate in antigen presentation escape and immune suppression by regulating the membrane expression of programmed death-ligand 1 (PD-L1) [27] and major histocompatibility complex I (MHC-I) [28].
In terms of regulatory mechanisms, we predicted and preliminarily validated several potential transcription factors that regulate SH3KBP1 expression based on the Cistrome database, with CTCF showing the highest binding intensity and a positive correlation with its expression. CTCF is a typical chromatin architectural regulator involved in transcription regulation, enhancer insulation, and the stability of the three-dimensional genomic structure [29, 30]. CTCF may promote SH3KBP1 transcriptional activation by modulating chromatin accessibility at the SH3KBP1 promoter region. Additionally, CTCF is also upregulated in PDAC, suggesting that it may collaborate with SH3KBP1 in the unique transcriptional regulatory network of PDAC. This finding provides important clues for further investigating SH3KBP1’s upstream regulation and chromatin opening status. Further exploration of the CTCF binding sites and their role in SH3KBP1 expression in PDAC suggests that CTCF’s interaction with the chromatin architecture may facilitate a more accessible chromatin environment at the SH3KBP1 locus, thereby enhancing its transcription. This could be critical in PDAC, where the dysregulation of chromatin structure and transcriptional networks plays a significant role in tumor progression. Furthermore, the upregulation of CTCF in PDAC could indicate a synergistic effect, such that CTCF regulates not only SH3KBP1 but also other genes involved in cancer-related pathways, potentially contributing to the malignant characteristics of PDAC cells. Investigating the specific binding sites of CTCF within the SH3KBP1 promoter and its effect on chromatin modification could reveal novel therapeutic targets for disrupting this regulatory loop in PDAC.
From a clinical translation perspective, SH3KBP1 has potential diagnostic and prognostic value. It consistently shows high expression across multiple omics platforms, and ROC analysis indicates its good discriminative ability, suggesting that it could serve as an auxiliary diagnostic marker in tissue section analysis or liquid biopsy. Moreover, its expression level is correlated with patient survival, demonstrating its potential for stratifying risks and guiding personalized treatment. SH3KBP1 primarily localizes to the cytoplasm and membrane, providing a feasible basis for developing small molecule inhibitors, antibody-drug conjugates (ADCs), or other targeted strategies. CRISPR functional dependency scores show that certain PDAC cell lines are addicted to SH3KBP1, suggesting its potential applicability for patients with specific molecular subtypes. Combining spatial expression patterns, future approaches could integrate nanodrug delivery technologies to precisely target areas of high expression, improving treatment selectivity and efficiency.
However, this study has certain limitations. All data come primarily from secondary analyses of publicly available databases, and although cross-validation across multiple platforms enhances the credibility of the conclusions, experimental evidence is lacking. Future research should further validate SH3KBP1’s role in PDAC development through cell models and animal experiments and clarify its mechanisms in such pathways as EGFR, JAK/STAT, TGF-β, etc. Additionally, its potential impact on the tumor immune microenvironment and feasibility as a target for immune combination therapy warrants further exploration. A schematic diagram (Fig. 11) illustrates the proposed role of SH3KBP1 in PDAC pathogenesis. Loss or downregulation of CTCF may lead to transcriptional activation of SH3KBP1, resulting in its overexpression and subsequent activation of downstream signaling molecules. Elevated SH3KBP1 promotes EGFR-related signaling cascades, thereby enhancing cell proliferation, invasion, and EMT and facilitating a motile and metastatic phenotype. Collectively, this model suggests that the CTCF-SH3KBP1 regulatory axis may play a crucial oncogenic role in PDAC by driving malignant transformation and tumor progression.
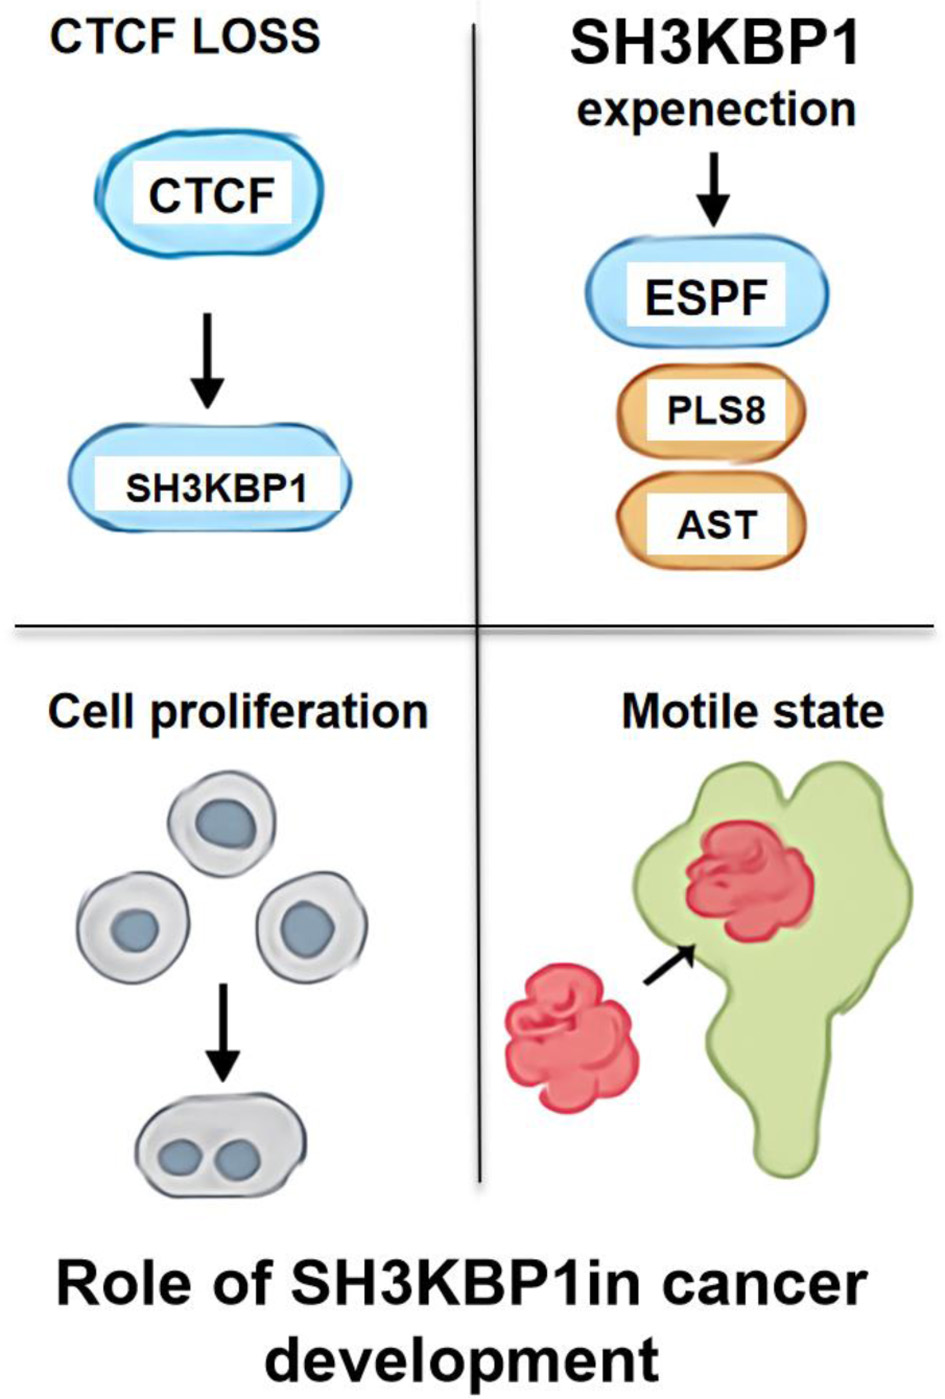 Click for large image |
Figure 11. Schematic diagram of the role of SH3KBP1 in the PDAC. |
In conclusion, this study systematically reveals SH3KBP1’s high expression characteristics and multifunctional oncogenic potential in PDAC, suggesting its important application prospects as a molecular marker and therapeutic target. Future in-depth mechanistic studies and clinical translation efforts may promote its application in precision medicine for PDAC.
Limitations
This study has several limitations. All analyses relied on publicly available datasets, which may have introduced selection bias and data heterogeneity across platforms and cohorts. To reduce these effects, standardized preprocessing and cross-dataset validation were applied. The results are based mainly on bioinformatics predictions and lack experimental validation; thus, future cellular and animal studies are needed to confirm SH3KBP1’s functional role in PDAC. Although the applied algorithms and statistical methods have been previously validated, model performance may still be affected by dataset composition. Further prospective and experimental studies are required to strengthen these findings.
Acknowledgments
None to declare.
Financial Disclosure
The authors state that this study and the preparation of the manuscript received no financial support from any funding body or organization, and there are no financial conflicts of interest to disclose.
Conflict of Interest
All authors disclose no relevant conflict of interest.
Informed Consent
Not applicable.
Author Contributions
Jun Meng and Rui Zhuang Sun were responsible for the study design and manuscript revision; Xiao Lian Xu and Yan Hua Chen oversaw data collection and data analysis; and Rui Zhuang Sun and Kun Peng Qiao undertook the manuscript writing and revision. All authors have read and approved the final version of the manuscript for submission.
Data Availability
The datasets generated and/or analyzed during the current study are available in the referenced public databases.
Abbreviations
AUC: area under the curve; CDB: Cistrome Data Browser; CEGs: co-expressed genes; ChIP: chromatin immunoprecipitation; CNV: copy number variation; CRISPR: clustered regularly interspaced short palindromic repeats; CTCF: CCCTC-binding factor; DEG: differentially expressed gene; DepMap: the Cancer Dependency Map; DSS: disease-specific survival; EGFR: epidermal growth factor receptor; EMT: epithelial-mesenchymal transition; FPKM: fragments per kilobase of transcript per million mapped reads; GEO: Gene Expression Omnibus; LASSO: least absolute shrinkage and selection operator; NCBI: National Center for Biotechnology Information; OS: overall survival; PCA: principal component analysis; PDAC: pancreatic ductal adenocarcinoma; PDC: Proteomic Data Commons; PFI: progress-free interval; RF: random forest; ROC: receiver operating characteristic; SH3KBP1: SH3-domain kinase binding protein 1; SHAP: SHapley Additive exPlanations; SRA: Sequence Read Archive; SVM: support vector machine; SVM-RFE: support vector machine-recursive feature elimination; TCGA: The Cancer Genome Atlas; THPA: The Human Protein Atlas; t-SNE: t-distributed stochastic neighbor embedding; UCSC: University of California, Santa Cruz; UMI: unique molecular identifier
| References | ▴Top |
- Yang S, Ta YN, Chen Y. Nanotechnology-enhanced immunotherapies for
pancreatic ductal adenocarcinoma: challenges and opportunities. Drug Deliv Transl Res.
2025;15(11):4067-4097.
doi pubmed - Ramaswamy A, Bhargava P, Gota V, Srinivas S, Sultana N, Mandavkar S,
Jadhav P, et al. Efficacy of losartan plus modified FOLFIRINOX versus modified FOLFIRINOX in
advanced pancreatic cancers: A randomized clinical trial (AFPAC Study). Cancer.
2025;131(13):e35945.
doi pubmed - Luo Y, Biswas H, Makinwa Y, Liu SH, Dong Z, Liu JY, Zhang JT, et al.
A PP2A-mtATR-tBid axis links DNA damage-induced CIP2A degradation to apoptotic dormancy and
therapeutic resistance in PDAC. Cancer Lett. 2025;627:217790.
doi pubmed - Jiang Y, Yin F, Chen Y, Yue L, Li L. Discovery of
microarray-identified genes associated with the progression of cervical intraepithelial
neoplasia. Int J Clin Exp Pathol. 2018;11(12):5667-5681.
pubmed - Zhen Z, Zhang C, Li J, Liang L, Wu C. Blebs regulate phosphoinositide
distribution and promote cell survival through the Septin-SH3KBP1-PI3K axis.
Am J Physiol Cell Physiol. 2025;329(1):C145-C158.
doi pubmed - Guiraud A, Couturier N, Christin E, Castellano L, Daura M, Kretz-Remy
C, Janin A, et al. SH3KBP1 promotes skeletal myofiber formation and functionality through ER/SR
architecture integrity. EMBO Rep. 2025;26(8):2166-2191.
doi pubmed - Yin J, Gou H, Qi J, Xing W. Feature gene selection and functional
validation of SH3KBP1 in infantile hemangioma using machine learning. Biochem Biophys Res
Commun. 2025;752:151469.
doi pubmed - Song H, Wang Y, Shi C, Lu J, Yuan T, Wang X. SH3KBP1 promotes
glioblastoma tumorigenesis by activating EGFR signaling. Front Oncol. 2020;10:583984.
doi pubmed - Wei M, Yang X, Yang X, Huang Y, Yuan Z, Huang J, Wei J, et al. MLPH
regulates EMT in pancreatic adenocarcinoma through the PI3K-AKT signaling pathway.
J Cancer. 2024;15(17):5828-5838.
doi pubmed - Lo EKW, Idrizi A, Tryggvadottir R, Zhou W, Hou W, Ji H, Cahan P, et
al. DNA methylation memory of pancreatic acinar-ductal metaplasia transition state altering
Kras-downstream PI3K and Rho GTPase signaling in the absence of Kras mutation. Genome Med.
2025;17(1):32.
doi pubmed - Cao Z, Hu Z, Wang Y, Zhao F, Li J, Li R, Hu W, et al. Letrozole-based
near-infrared dynamic imaging targeting ductal-vascular RhoJ from pancreatic intraepithelial
neoplasia to pancreatic ductal adenocarcinoma. Adv Healthc Mater. 2024;13(32):e2402913.
doi pubmed - Zhang H, Corredor ALG, Messina-Pacheco J, Li Q, Zogopoulos G, Kaddour
N, Wang Y, et al. REG3A/REG3B promotes acinar to ductal metaplasia through binding to EXTL3 and
activating the RAS-RAF-MEK-ERK signaling pathway. Commun Biol. 2021;4(1):688.
doi pubmed - Wang Z, Su X, Zhan Z, Wang H, Zhou S, Mao J, Xu H, et al. miR-660: A
novel regulator in human cancer pathogenesis and therapeutic implications. Gene.
2025;953:149434.
doi pubmed - Horak IR, Latyshko NV, Hudkova OO, Tokarchuk KO, Kishko TO, Yusova
OI, Drobot LB, et al. Adaptor protein RUK/CIN85regulates redox balance in 4T1mouse breast cancer
cells exposed to plasmin(OGEN). Exp Oncol. 2022;44(1):31-38.
doi pubmed - Ahmed SF, Buetow L, Gabrielsen M, Lilla S, Sibbet GJ, Sumpton D,
Zanivan S, et al. E3 ligase-inactivation rewires CBL interactome to elicit oncogenesis by
hijacking RTK-CBL-CIN85 axis. Oncogene. 2021;40(12):2149-2164.
doi pubmed - Kozlova N, Mennerich D, Samoylenko A, Dimova EY, Koivunen P, Biterova
E, Richter K, et al. The pro-oncogenic adaptor CIN85 acts as an inhibitory binding partner of
hypoxia-inducible factor prolyl hydroxylase 2. Cancer Res. 2019;79(16):4042-4056.
doi pubmed - Song X, Zhou Z, Elmezayen A, Wu R, Yu C, Gao B, Minna JD, et al. SRC
kinase drives multidrug resistance induced by KRAS-G12C inhibition. Sci Adv.
2024;10(50):eadq4274.
doi pubmed - Kolarzyk AM, Kwon Y, Oh E, Lee KJ, Cho SY, Cano I, Lu R, et al.
Non-canonical ALK7 pathways promote pancreatic cancer metastasis through
beta-catenin/MMP-mediated basement membrane breakdown and intravasation. Mol Cancer.
2025;24(1):188.
doi pubmed - Ray P, Shukla S, Zhang Y, Donahue KL, Nancarrow DJ, Kasturirangan S,
Shankar S, et al. SMURF2 facilitates GAP17 isoform 1 membrane displacement to promote mutant
p53-KRAS oncogenic synergy. Mol Cancer Res. 2025;23(6):530-541.
doi pubmed - Szondi DC, Crompton RA, Oon L, Subramaniam N, Lee SH, Lopez-Castejon
G, Wong J, et al. Keratinocyte arginase 1 regulates proinflammatory responses and drives
re-epithelialization via lipocalin 2. Br J Dermatol. 2025;193(5):924-935.
doi pubmed - Yue S, Fan J, Xie D, Cao C, Wang Z, Huang J, Qiu F, et al. Unveiling
the therapeutic potential: targeting fibroblast-like synoviocytes in rheumatoid arthritis.
Expert Rev Mol Med. 2025;27:e18.
doi pubmed - Baiskhanova D, Menzel M, Geismann C, Rocken C, Beitz E, Sebens S,
Trauzold A, et al. Transmembrane protease serine 11B modulates lactate transport through SLC16A1
in pancreatic ductal adenocarcinoma-a functional link to phenotype heterogeneity.
Int J Mol Sci. 2025;26(11):5398.
doi pubmed - Nan J, Xia C, Zhang J, Xie Y, Shi S, Yang W, Yu M, et al.
Gadolinium-ceria hybrid system enables synergistic alleviation of oxidative stress and metabolic
thrombo-inflammation for efficient ischemic stroke treatment. Biomaterials.
2025;322:123379.
doi pubmed - Zhang W, Yang Z, Li X, Li D, Liu J, Liu W, Xie W, et al. Discovery of
N-methylguanidine derivatives as a new type of potent pyruvate kinase M2 inhibitor. Bioorg Med
Chem Lett. 2025;124:130264.
doi pubmed - Tong Z, Zhao H, Cui C, Hong M, Ma Y, Sui L, Wang J, et al.
m6A-mediated regulation of ECA39 promotes renal fibrosis in chronic kidney disease by enhancing
glycolysis and epithelial-mesenchymal transition. Biochim Biophys Acta Mol Cell Res.
2025;1872(6):119981.
doi pubmed - Samoylenko A, Dimova EY, Kozlova N, Drobot L, Kietzmann T. The
adaptor protein Ruk/CIN85 activates plasminogen activator inhibitor-1 (PAI-1) expression via
hypoxia-inducible factor-1alpha. Thromb Haemost. 2010;103(5):901-909.
doi pubmed - Rastogi I, Mannone JA, Gibadullin R, Moseman JE, Sidney J, Sette A,
McNeel DG, et al. beta-amino acid substitution in the SIINFEKL antigen alters immunological
recognition. Cancer Biol Ther. 2025;26(1):2486141.
doi pubmed - Zhao MZ, Zheng HC, Sun Y, Jiang XF, Liu L, Dang CY, Li JY, et al.
IFN-gamma downregulates miR-4319 to enhance NLRC5 and MHC-I expression in MHC-I-deficient breast
cancer cells. Cancer Biol Ther. 2025;26(1):2523621.
doi pubmed - Sen S, Lacey M, Baribault C, Ponnaluri VKC, Esteve PO, Ehrlich KC,
Meletta M, et al. The myoblast methylome: multiple types of associations with chromatin and
transcription. Epigenetics. 2025;20(1):2508251.
doi pubmed - Elhassan G, Bu X, Liu J, Hou S, Yan J, Lei H. LncRNA MEG3/CTCF-CXCR4
axis functions in the regulation of breast cancer cell migration. Noncoding RNA Res.
2025;14:117-128.
doi pubmed
This
article is distributed under the terms of the Creative Commons Attribution Non-Commercial 4.0
International License, which permits unrestricted non-commercial use, distribution, and
reproduction in any medium, provided the original work is properly cited.
World
Journal of Oncology is published by Elmer Press Inc.