Figures
↓ Figure 1. Flow diagram.
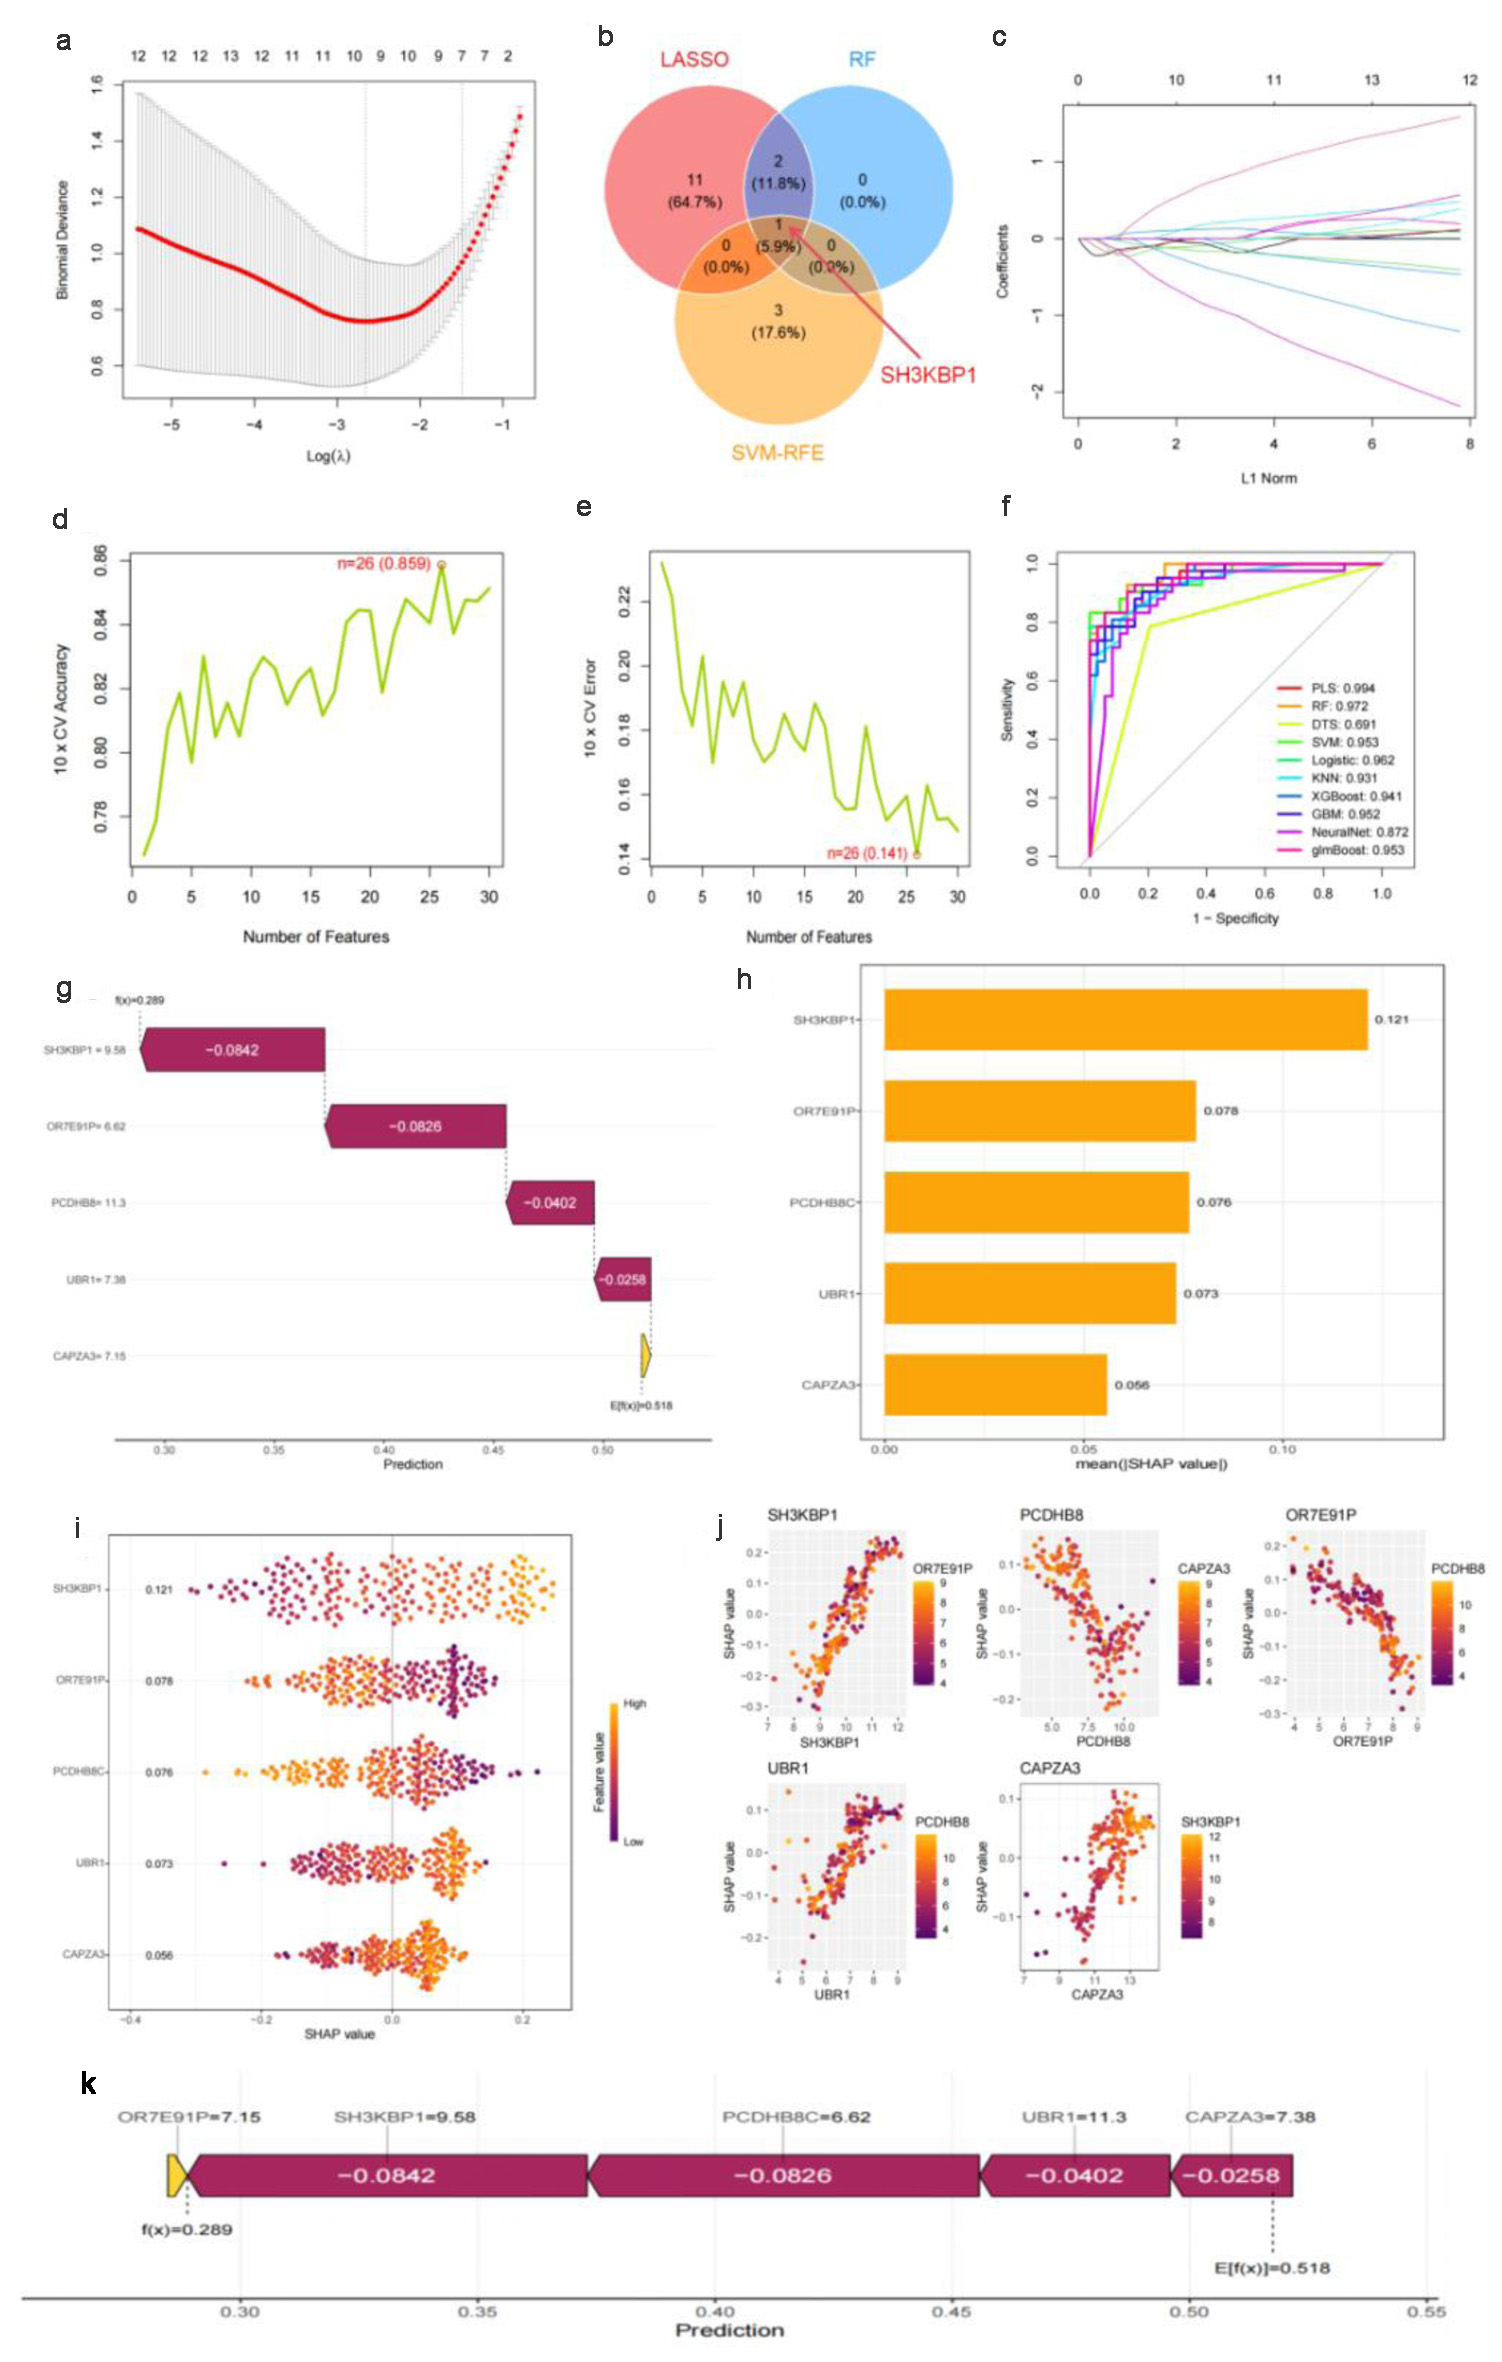
↓ Figure 2. Machine learning feature selection
and SHAP interpretability analysis based on multiple datasets. (a) Ten-fold cross-validation λ
parameter selection curve for LASSO regression, with the optimal λ value marked by a red vertical
line. (b) Venn diagram of feature selection results from three machine learning algorithms (LASSO, RF,
SVM-RFE), with SH3KBP1 located in the intersection area of the algorithms. (c) LASSO regression
coefficient shrinkage path diagram. (d) Ten-fold cross-validation accuracy curve with the number of
features, showing a maximum accuracy of 0.850. (e) Ten-fold cross-validation error rate curve, showing a
minimum error rate of 0.141. (f) ROC performance comparison of multiple machine learning algorithms,
with the PLS algorithm having the highest AUC (0.994). (g) Univariate prediction efficiency analysis of
key genes. (h) SHAP feature importance ranking diagram. (i) SHAP value summary diagram, showing the
distribution of the impact of gene expression on prediction. (j) SHAP dependence diagram, showing the
interaction between SH3KBP1 and such genes as PCDH8B, OR7E31P, USR1, and CAPZA3. (k) Flowchart of the
final prediction model constructed based on key genes.
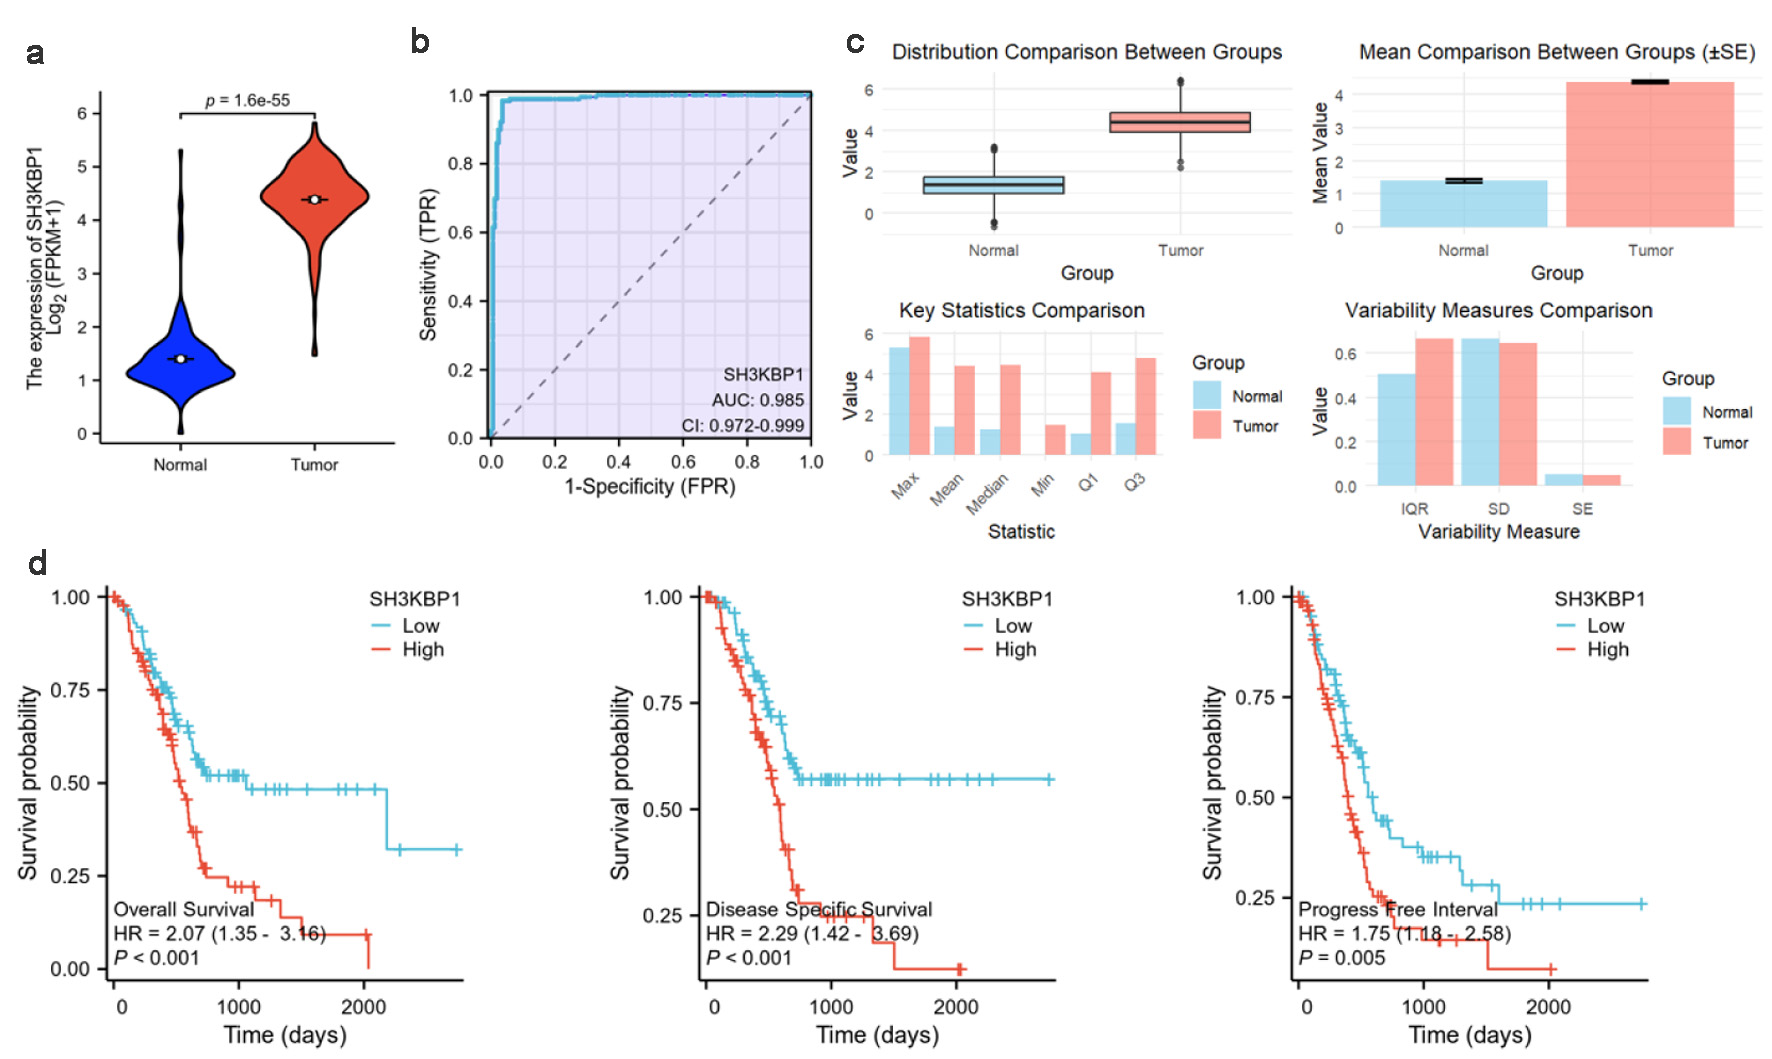
↓ Figure 3. SH3KBP1 expression and its clinical
correlation analysis in the TCGA-PDAC dataset. (a) Expression distribution of SH3KBP1 in normal groups
and tumor groups. (b) ROC diagnostic curve analysis of SH3KBP1. (c) Comparison of expression level
distribution, mean value, and statistical characteristics. (d) Kaplan-Meier survival analysis of SH3KBP1
expression level with OS, DSS, and PFI.
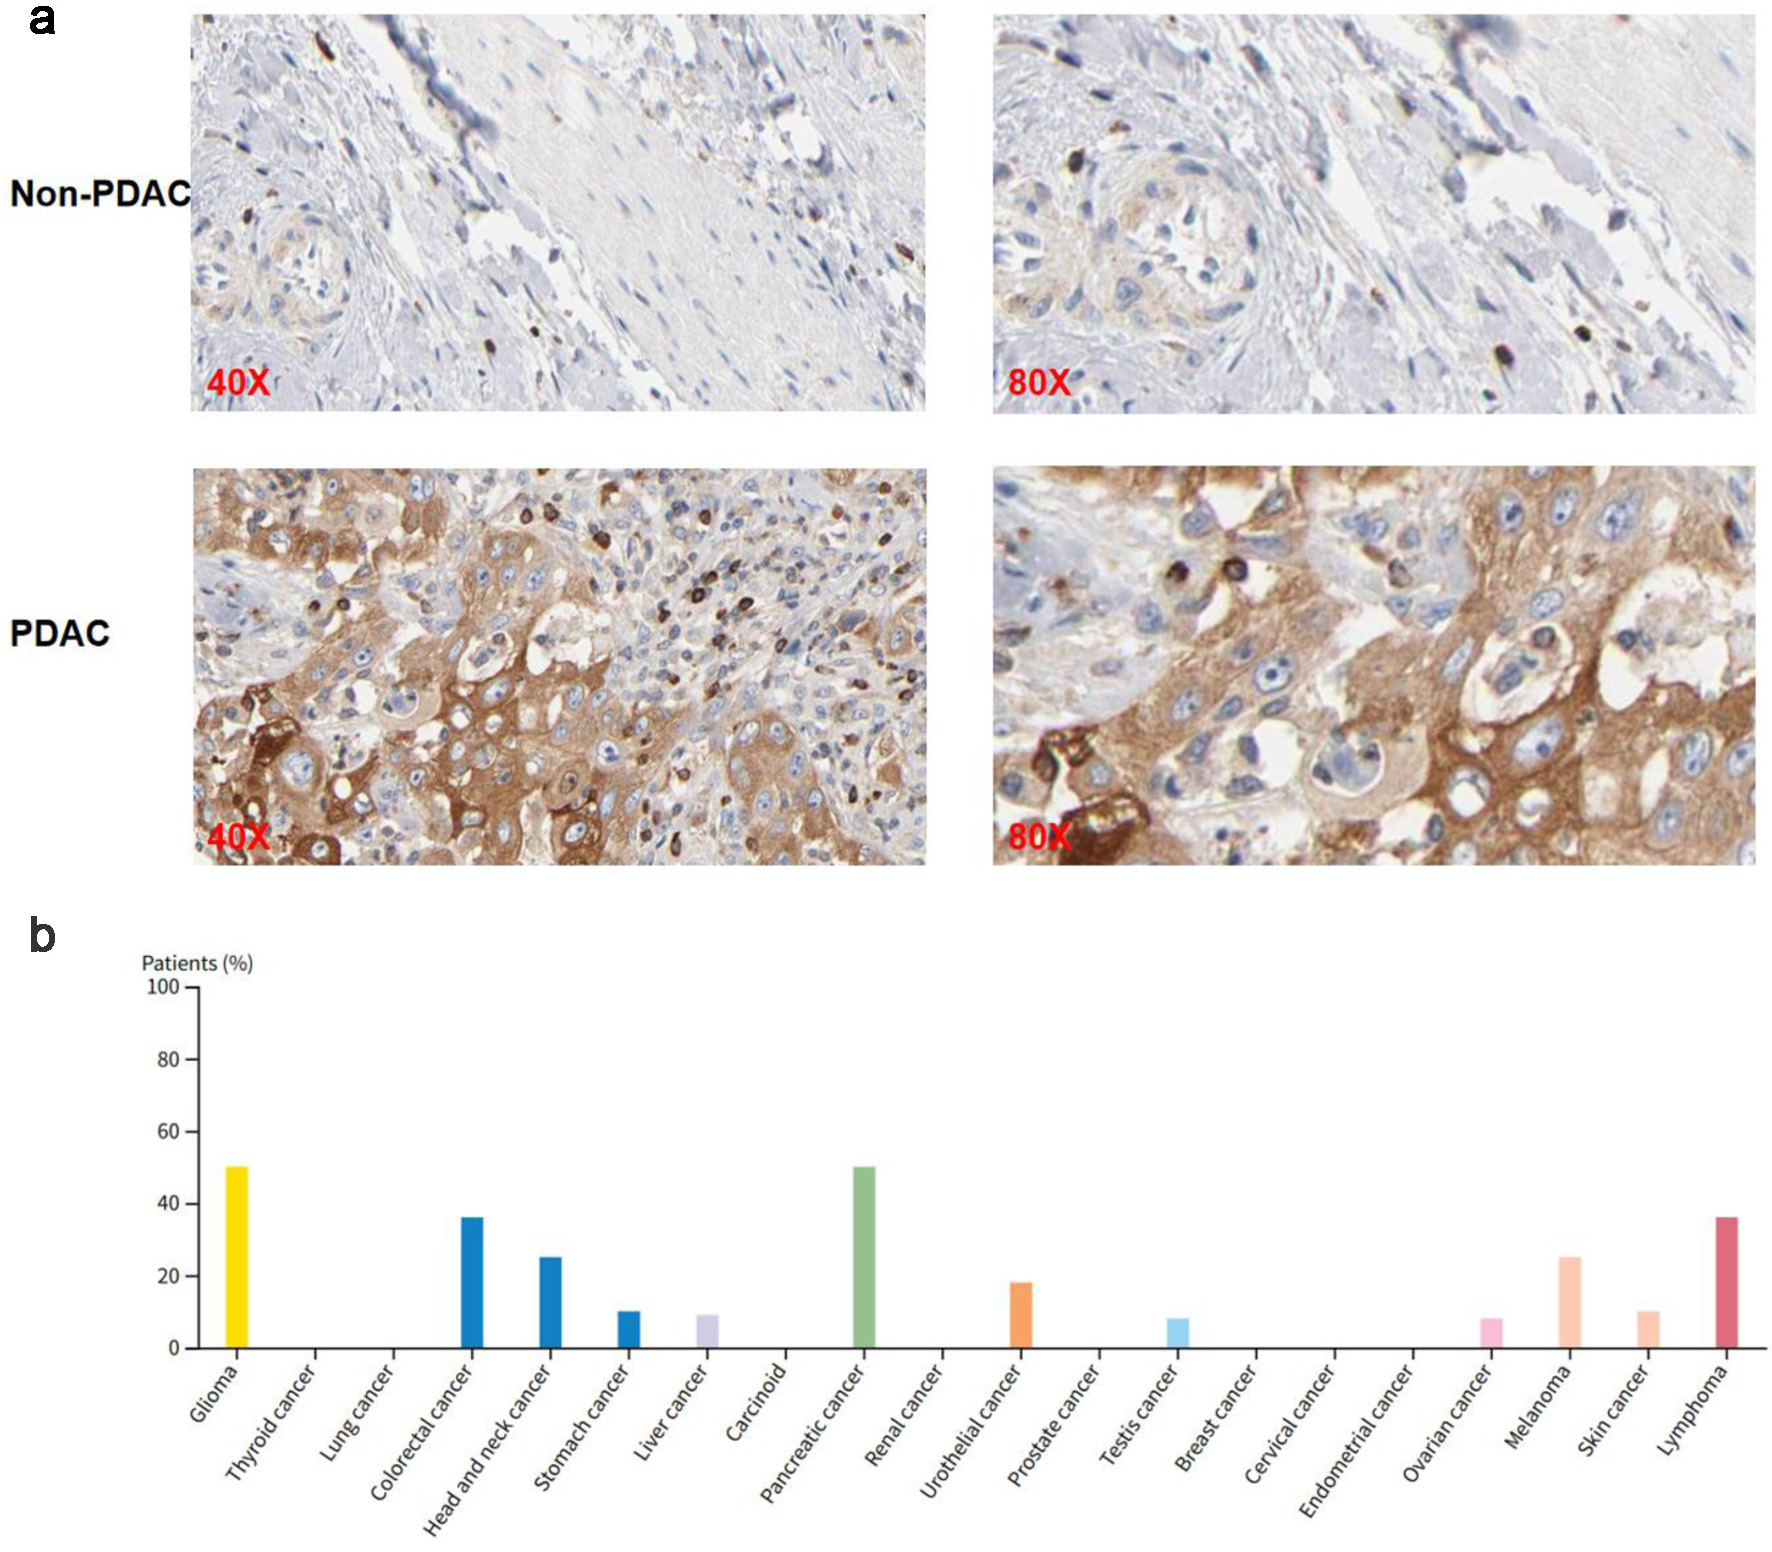
↓ Figure 4. SH3KBP1 protein expression analysis
based on the THPA (Antibody: HPA003351). (a) Immunohistochemical images showing the expression of
SH3KBP1 in non-PDAC and PDAC tissues, with magnification levels of × 40 and × 80. (b)
Distribution of the proportion of positive patients with SH3KBP1 in various tumor types.
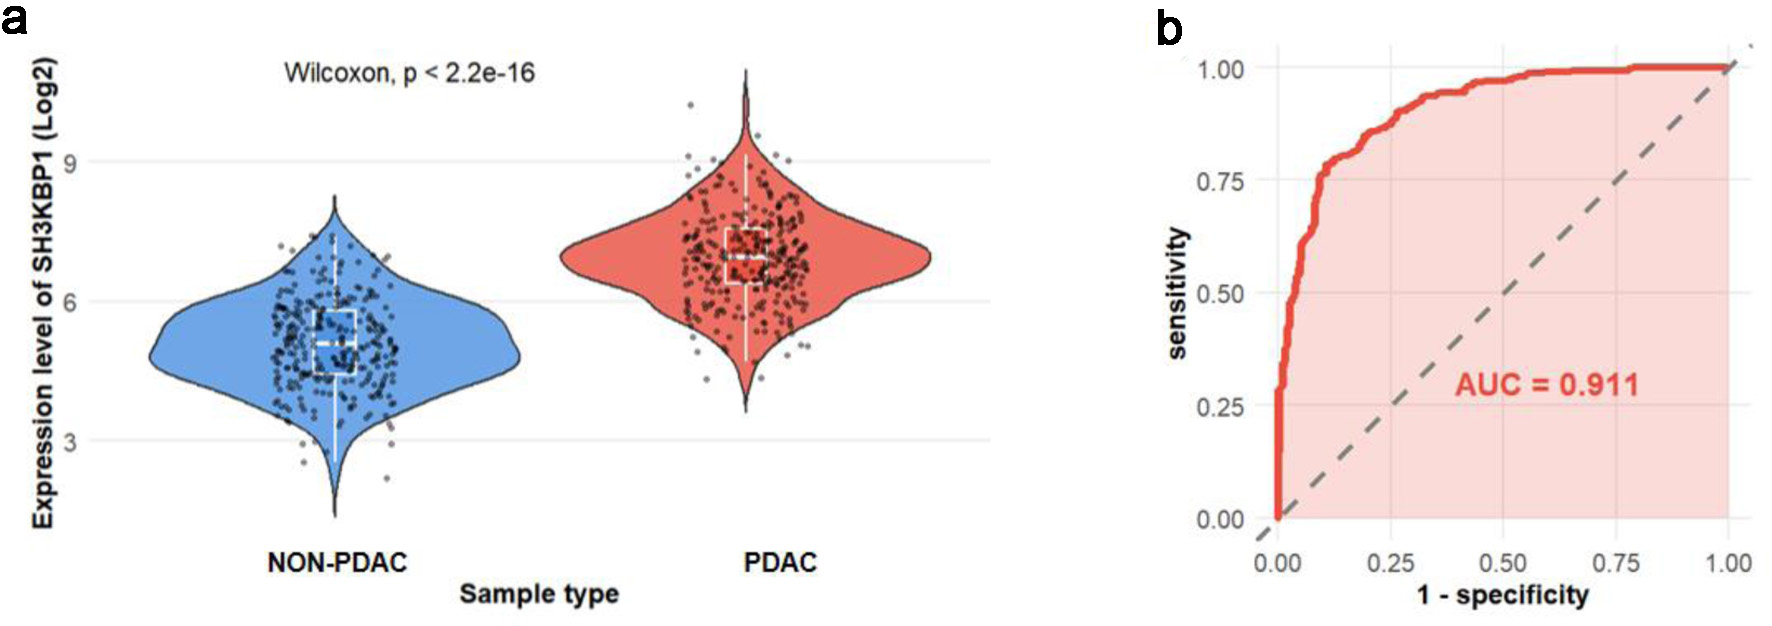
↓ Figure 5. SH3KBP1 protein expression analysis
based on the PDC database. (a) Violin plot showing the expression distribution of SH3KBP1 in non-PDAC
and PDAC samples (300 cases in each group). (b) ROC curve evaluating the discriminative ability of
SH3KBP1 in PDAC (AUC = 0.911).
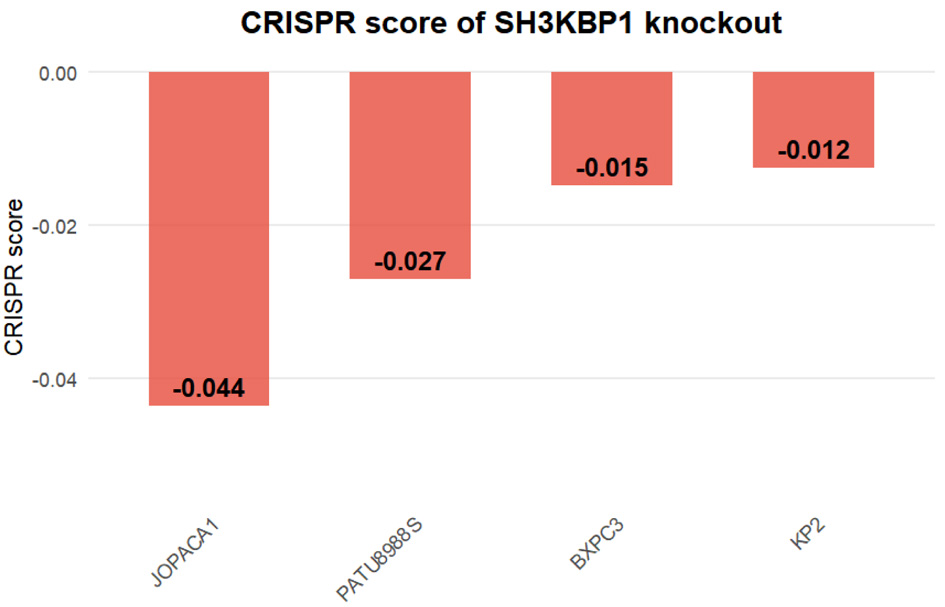
↓ Figure 6. CRISPR knockout score of the SH3KBP1
gene in PDAC cell lines based on the DepMap database. Bar chart showing the CRISPR dependency scores
(CRISPR score) of SH3KBP1 in four PDAC cell lines (JOPACA1, PATU8988S, BXPC3, and KP2).
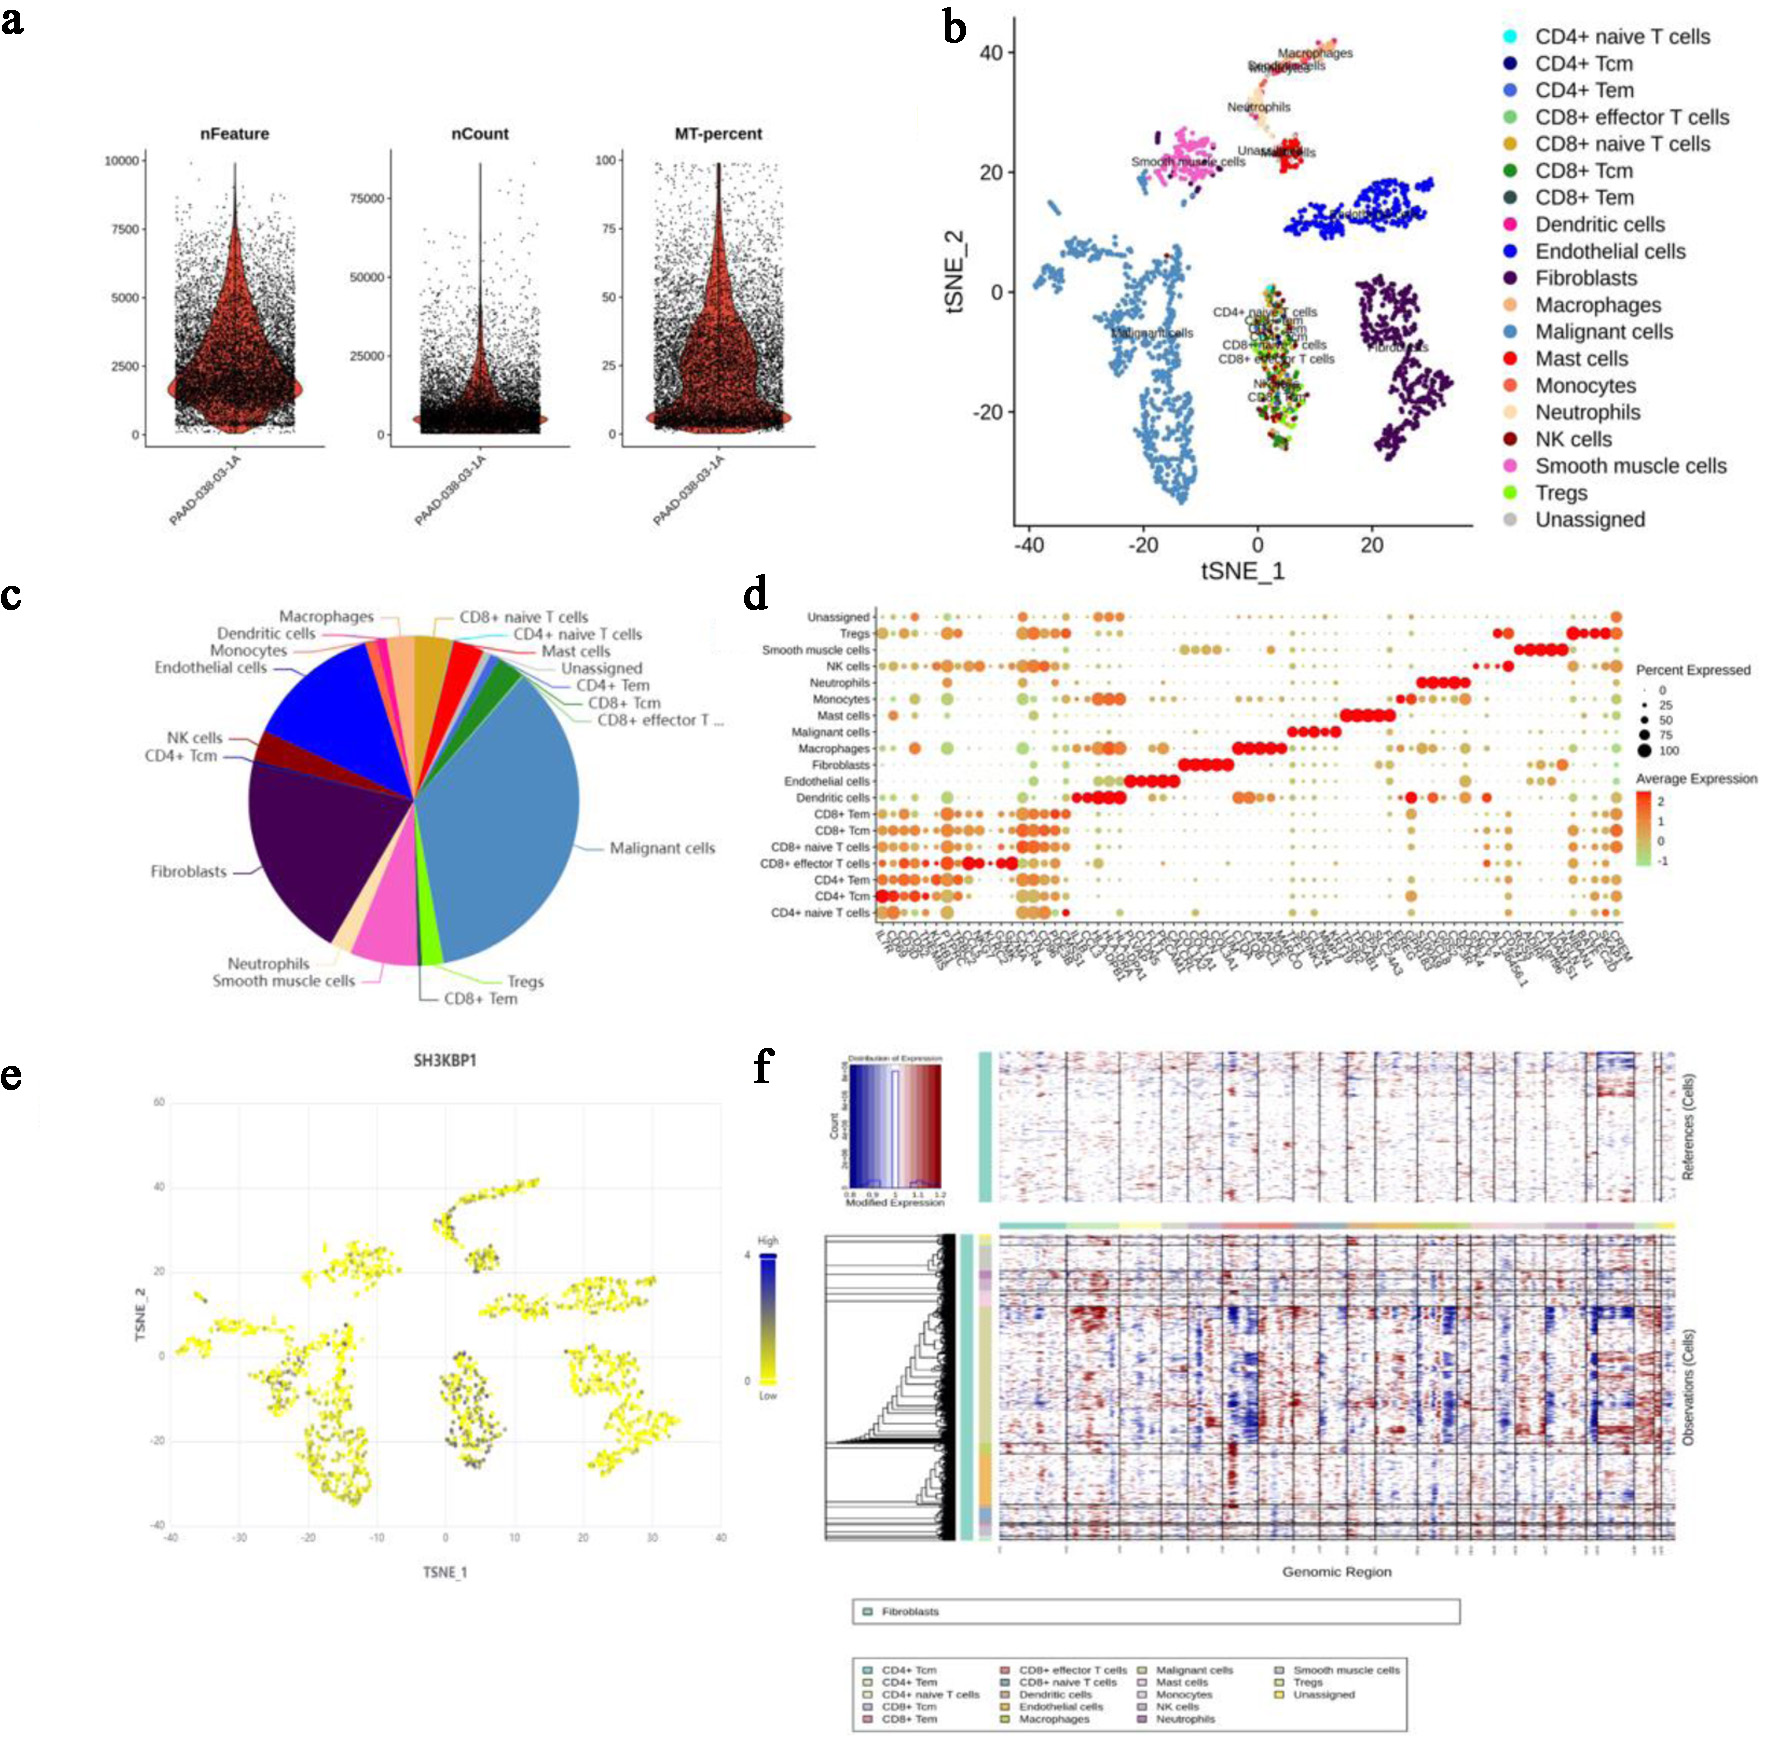
↓ Figure 7. Analysis of cell heterogeneity and
SH3KBP1 expression in PDAC tissues based on single-cell sequencing data from the NCBI SRA project
(accession number: PRJNA885258). (a) Sample quality control parameters, including the number of genes
(nFeature), number of UMIs (nCount), and mitochondrial gene ratio (MT.percent). (b) t-SNE dimensionality
reduction map showing the spatial distribution of different cell populations. (c) Pie chart showing the
composition ratio of various cell types in the sample. (d) DotPlot showing the expression levels and
expression proportions of characteristic marker genes in each cell population. (e) Expression
distribution of SH3KBP1 in various cell populations (t-SNE map). (f) Inference of whether cells are
malignant based on single-cell CNV analysis, with the upper panel showing reference cells (e.g., T
cells) and the lower panel showing the CNV heatmap of other cells.
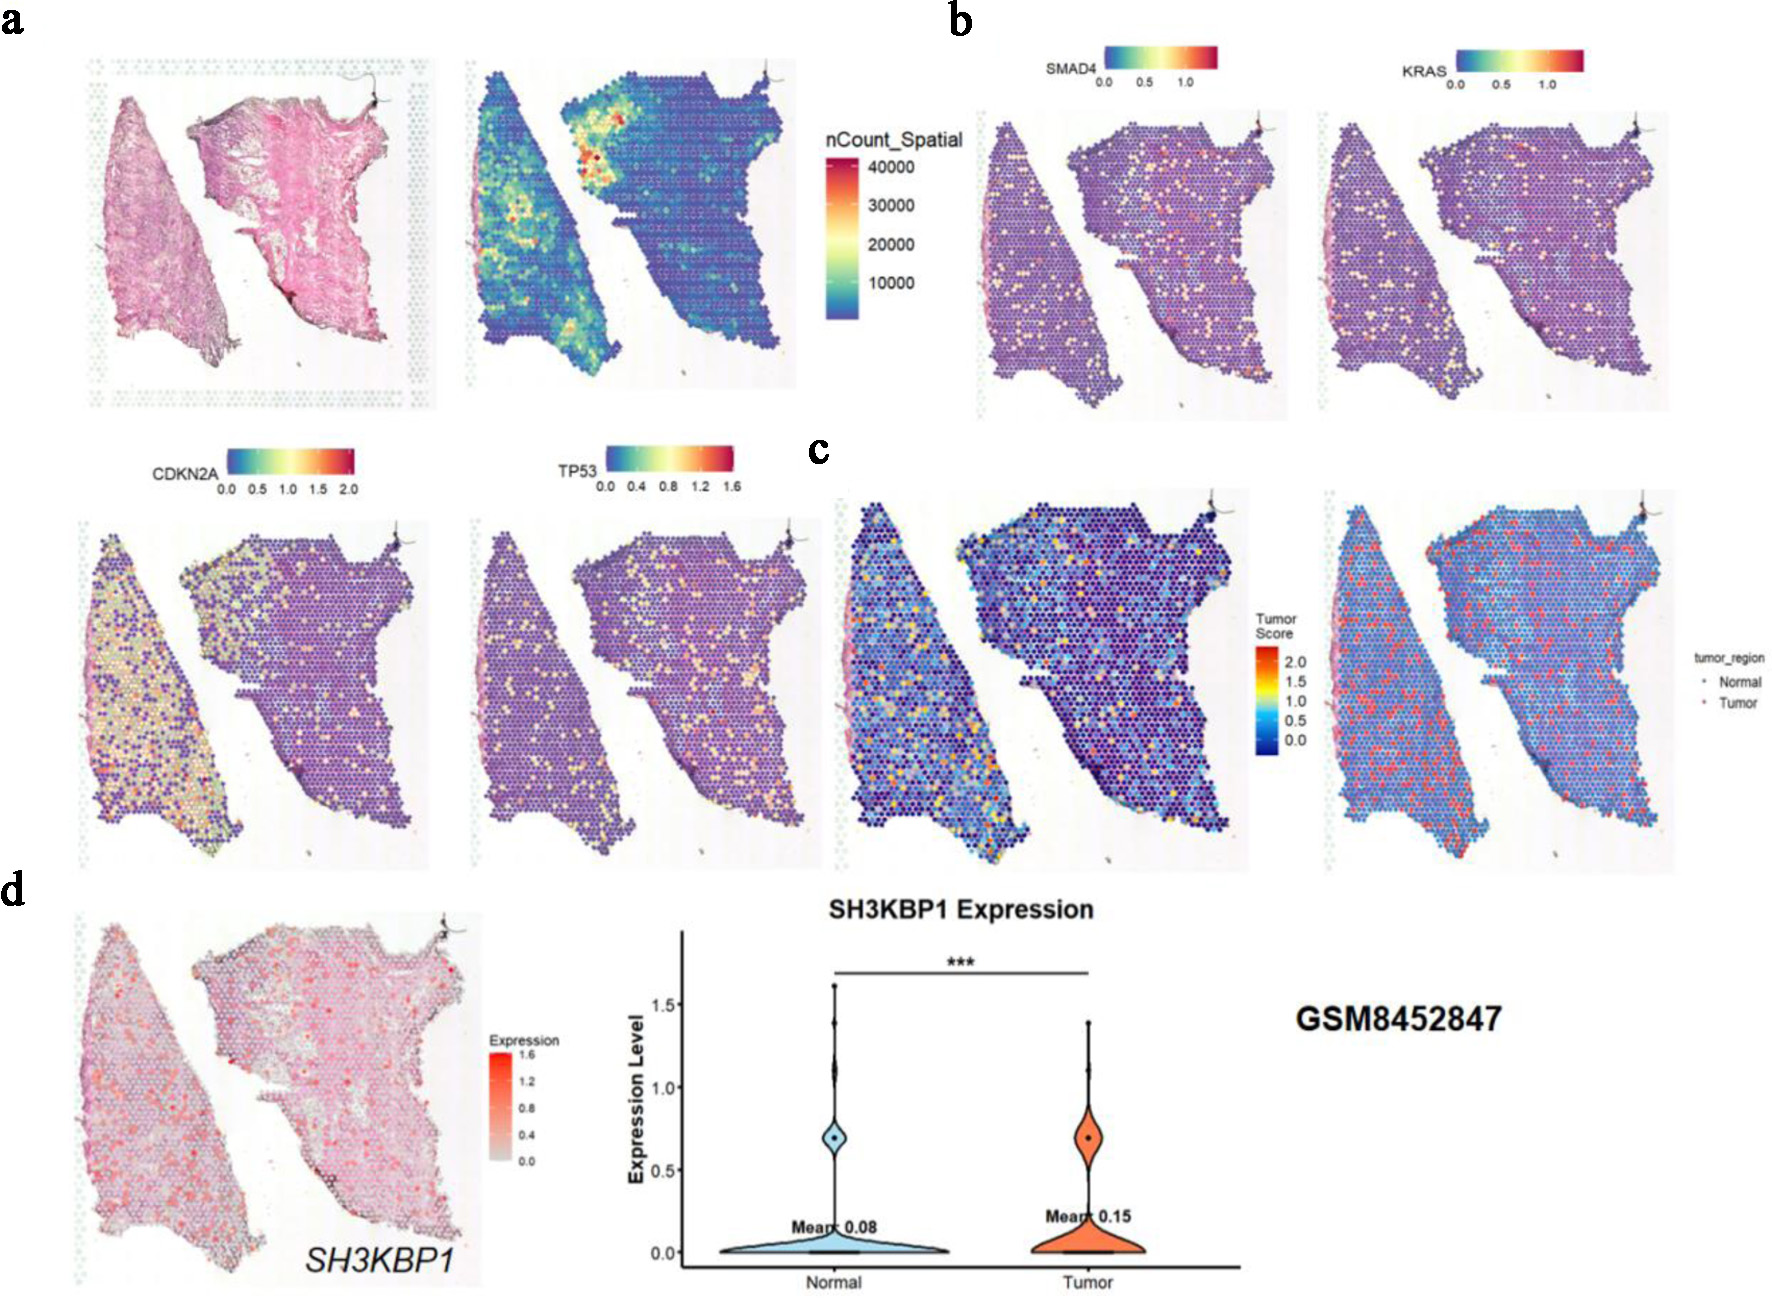
↓ Figure 8. Spatial expression analysis of
SH3KBP1 based on GSM8452847 spatial transcriptome data. (a) Spatial tissue structure map, spatial UMI
count map (nCount_Spatial), and expression distribution of tumor key genes (CDKN2A, TP53) in tissue
sections. (b) Spatial expression distribution of common driver genes (SMAD4, KRAS) in PDAC. (c) Tumor
region heatmap and binary classification region map (Tumor vs. Normal) divided according to the
expression patterns of key molecules (e.g., KRAS, TP53) in (b). (d) Spatial expression heatmap of
SH3KBP1 and violin plot of its expression difference analysis between tumor regions and normal
regions.
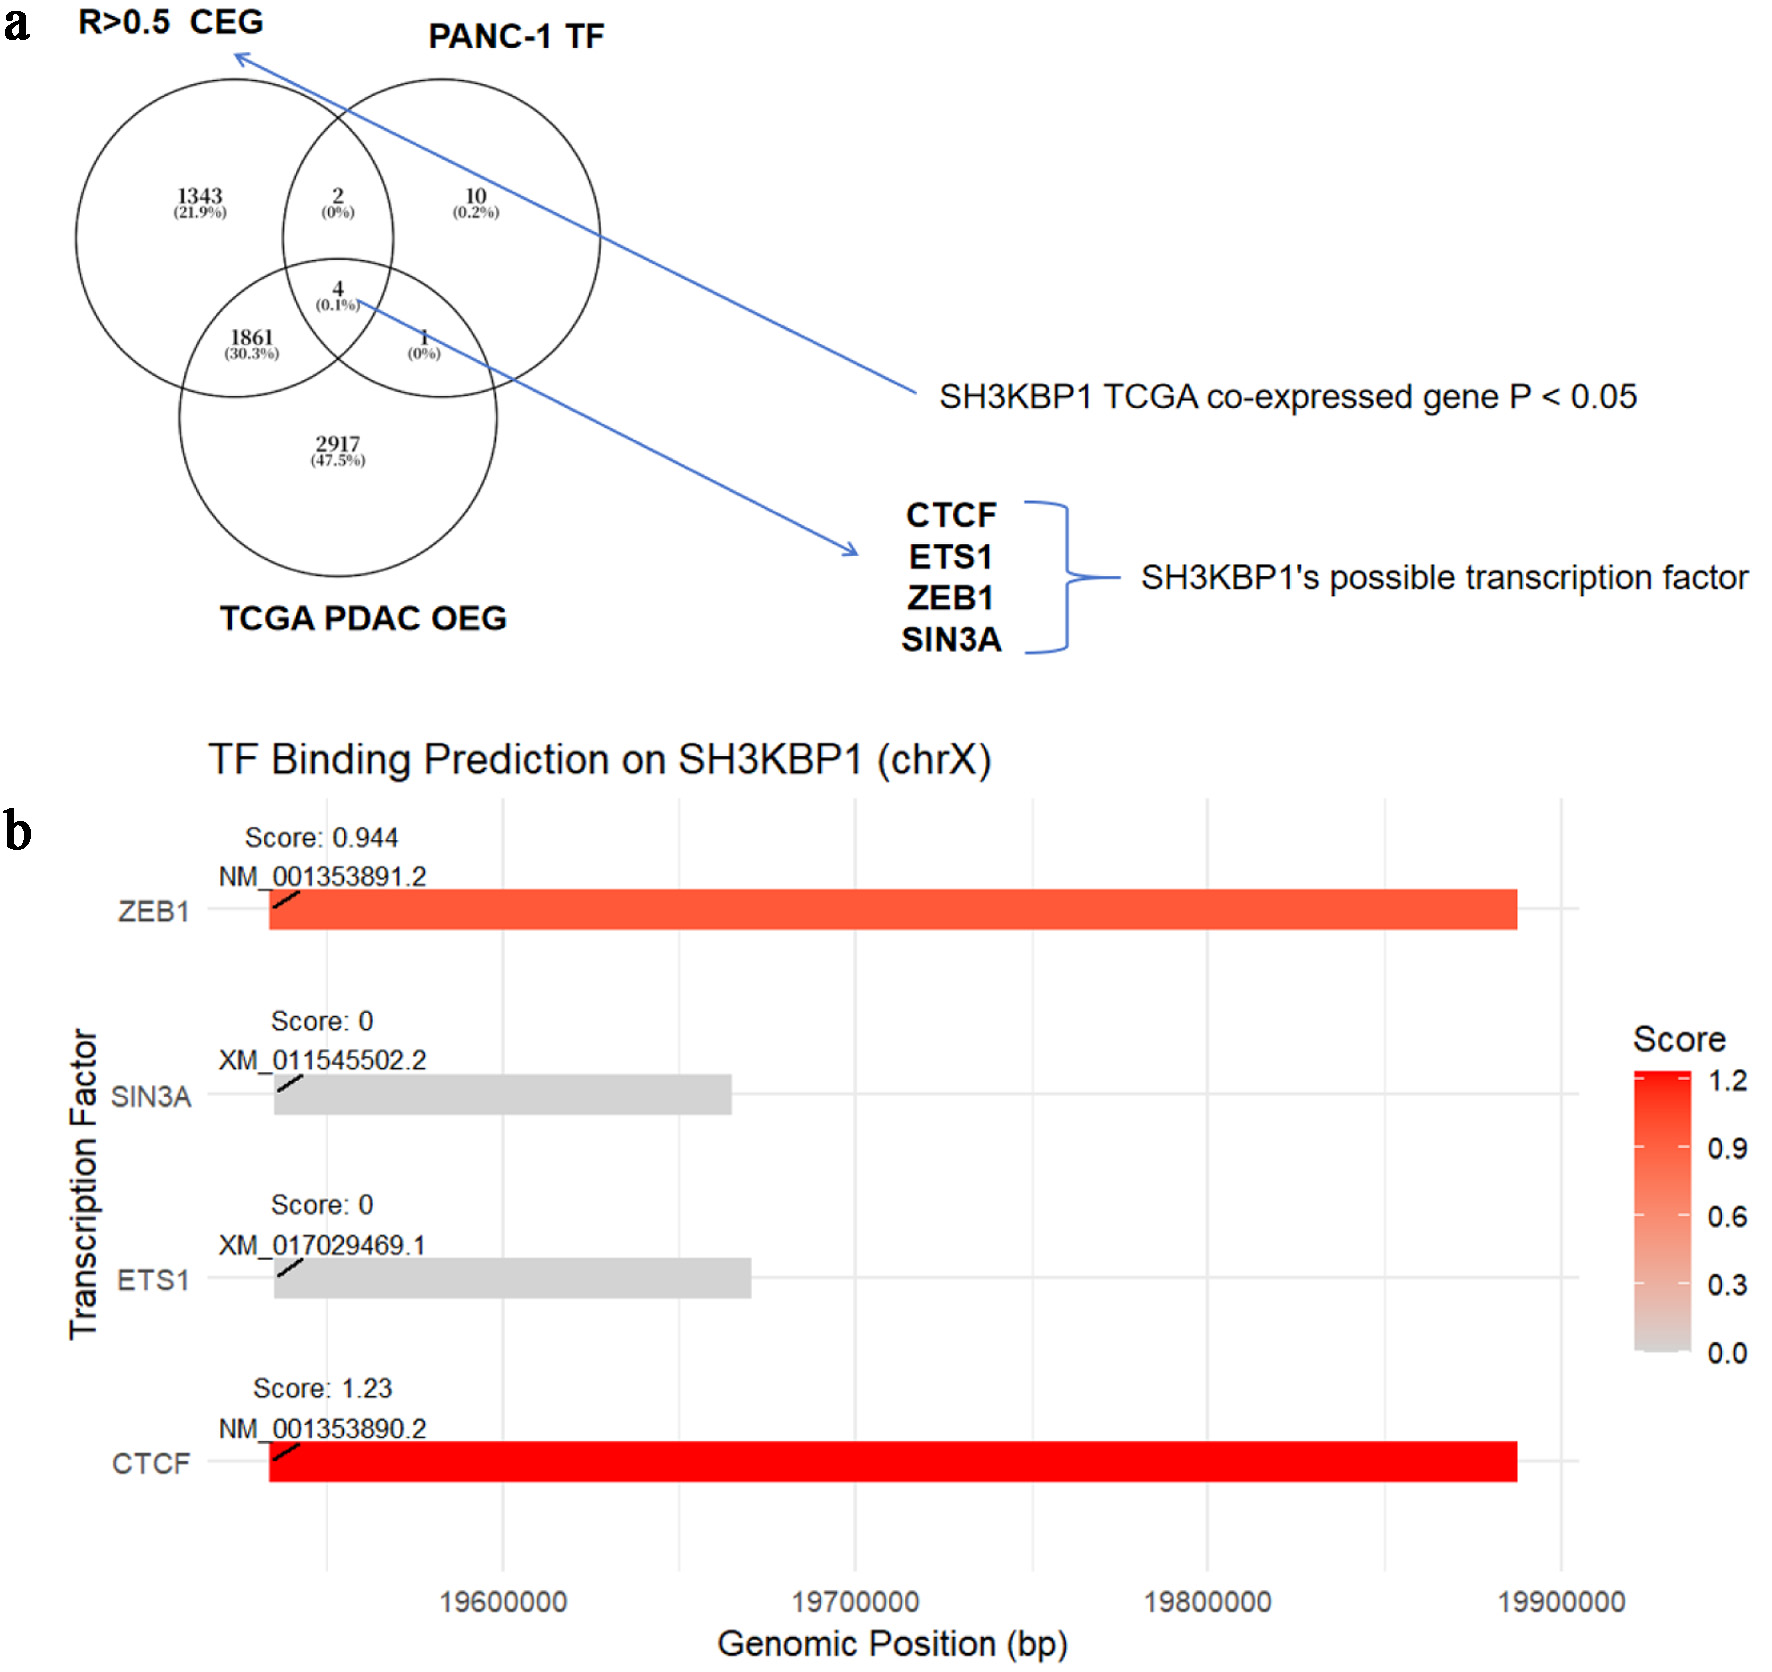
↓ Figure 9. Prediction analysis of potential
transcription factors of SH3KBP1 based on the CDB database. (a) Venn diagram showing the intersection of
SH3KBP1-coexpressed genes (P < 0.05) in TCGA-PDAC, upregulated DEG, and TF targets in the PANC-1 cell
line, screening out four candidate transcription factors (CTCF, ETS1, ZEB1, and SIN3A). (b) Binding
sites and scoring of transcription factors predicted by the CDB database in the SH3KBP1 promoter region
(chrX).
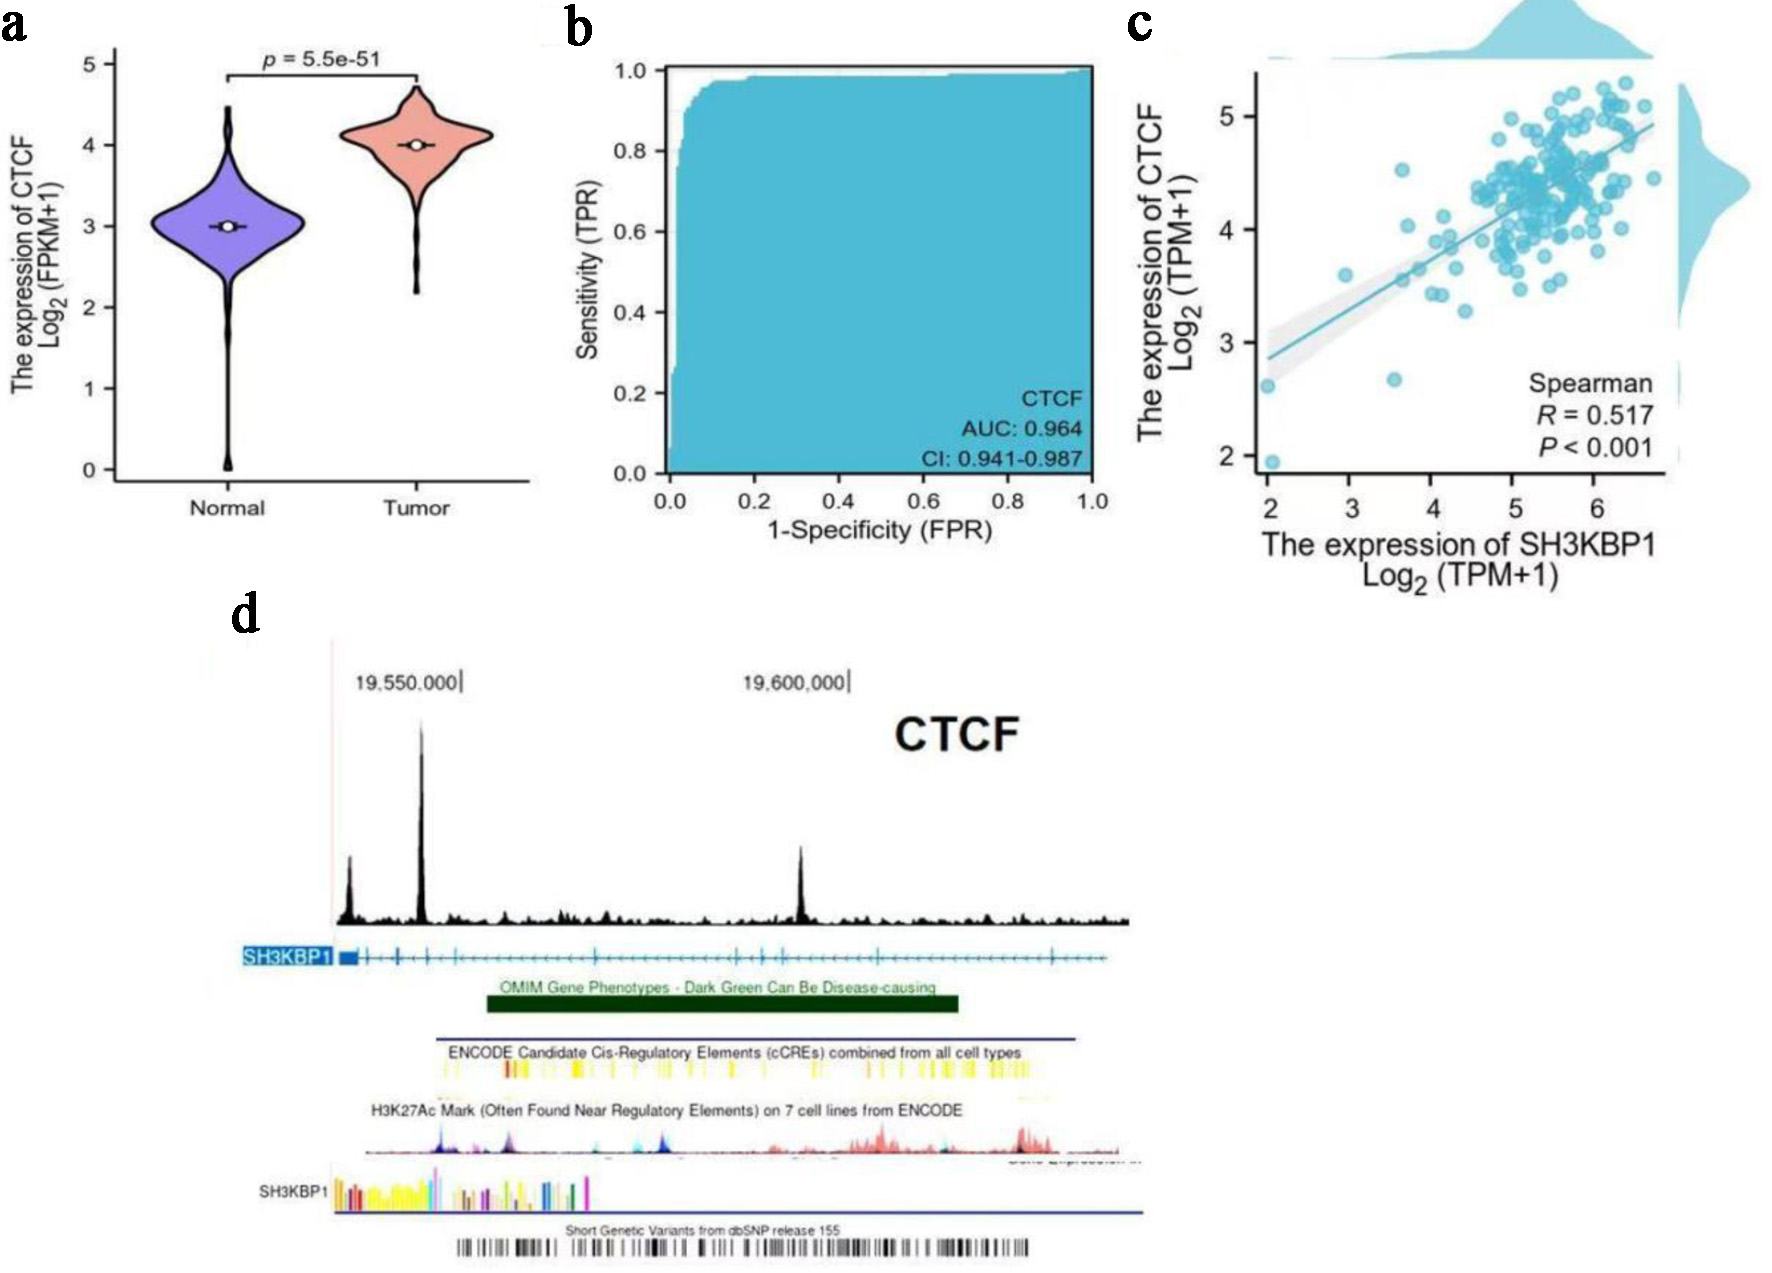
↓ Figure 10. Expression characteristics of CTCF
in PDAC and its correlation with SH3KBP1. (a) Analysis of CTCF expression difference between normal
tissues and tumor tissues in the TCGA database (Log2(FPKM+1)). (b) ROC curve evaluating the
diagnostic efficacy of CTCF for PDAC (AUC). (c) Spearman correlation analysis of SH3KBP1 and CTCF
expression levels in PDAC samples (Log2(TPM+1)). (d) ChIP-seq enrichment map of CTCF in the
SH3KBP1 gene region (hg38 reference genome), showing its potential binding sites and transcriptional
regulatory regions.
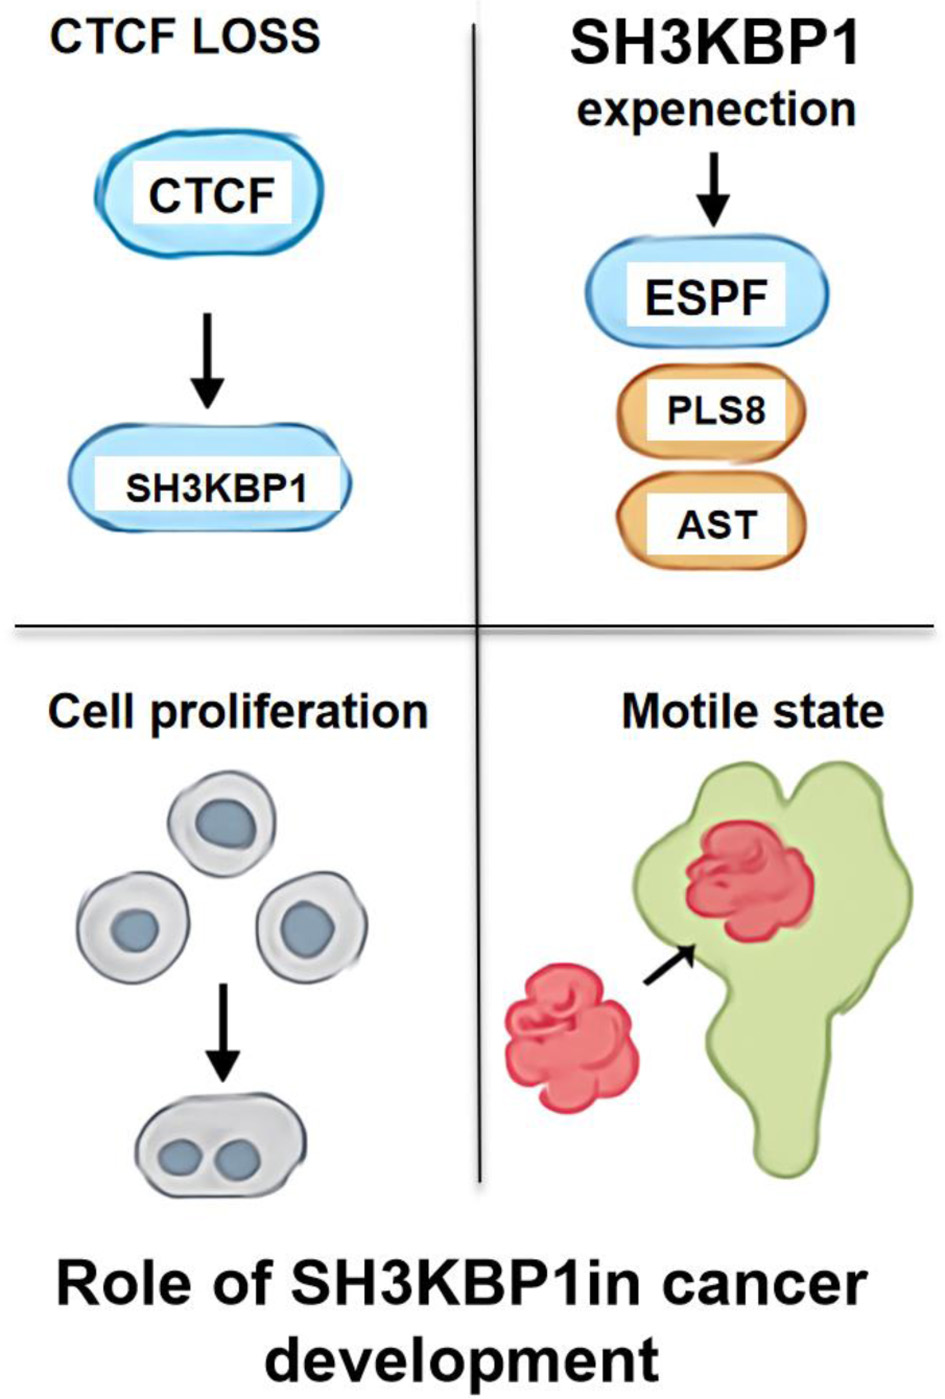
↓ Figure 11. Schematic diagram of the role of
SH3KBP1 in the PDAC.