| World Journal of Oncology, ISSN 1920-4531 print, 1920-454X online, Open Access |
| Article copyright, the authors; Journal compilation copyright, World J Oncol and Elmer Press Inc |
| Journal website https://wjon.elmerpub.com |
Original Article
Volume 17, Number 1, February 2026, pages 116-128

The Role and Mechanism of G Protein Subunit Alpha-15 in Colorectal Cancer: An Analysis of Two Hundred Eight Patient Samples and Public Datasets
Da Tong Zenga, g, Zu Yuan Chenb, g, Zuo Yan Ming Lib, Bang Teng Chic, Jian Di Lic, Wei Zhangc, Zong Yu Lic, Jian Jun Lib, Hui Lid, Rong Quan Hee, Gang Chenc, Jia Ying Wenf, h, Wei Jian Huanga, h
aDepartment of Pathology, Redcross Hospital of Yulin City, Yulin 537000, Guangxi
Zhuang Autonomous Region, China
bDepartment of General Surgery, The Second
Affiliated Hospital of Guangxi Medical University, Nanning 530021, Guangxi Zhuang Autonomous
Region, China
cDepartment of Pathology, The First Affiliated Hospital of Guangxi
Medical University, Nanning 530021, Guangxi Zhuang Autonomous Region,
China
dDepartment of Colorectal and Anal Surgery, The First Affiliated Hospital
of Guangxi Medical University, Nanning 530021, Guangxi Zhuang Autonomous Region,
China
eDepartment of Medical Oncology, The First Affiliated Hospital of Guangxi
Medical University, Nanning 530021, Guangxi Zhuang Autonomous Region,
China
fDepartment of Radiation Oncology, The Second Affiliated Hospital of
Guangxi Medical University, Nanning 530021, Guangxi Zhuang Autonomous Region,
China
gThese authors contributed equally to this
work.
hCorresponding Authors: Wei Jian Huang, Department of Pathology, Redcross
Hospital of Yulin City, Yulin 537000, Guangxi Zhuang Autonomous Region, China; Jia Ying Wen,
Department of Radiation Oncology, The Second Affiliated Hospital of Guangxi Medical University,
Nanning 530021, Guangxi Zhuang Autonomous Region, China
Manuscript submitted August 2, 2025, accepted November 11, 2025, published online December 17,
2025
Short title: GNA15 Expression and Mechanism in CRC
doi:
https://doi.org/10.14740/wjon2647
| Abstract | ▴Top |
Background: Colorectal cancer (CRC) is a tumor with a relatively high incidence rate. The expression of G protein subunit α-15 (GNA15) in CRC and its specific role remain unclear.
Methods: This study focused on both the diagnostic potential of GNA15 and its mechanistic role in CRC progression. Relevant expression data of CRC were obtained from global databases, and the expression differences of GNA15 in CRC tissues and non-cancerous tissues were analyzed after processing. Tissue microarrays of CRC samples and surrounding non-tumor tissues from 208 CRC patients at the Red Cross Hospital of Yulin City were collected and prepared. The expression level of GNA15 was scored after immunostaining with rabbit anti-human GNA15 antibody. Meanwhile, the GNA15 gene was knocked out in CRC cells, and its effects were evaluated. Data from databases were used to explore the relationship between GNA15 expression and various pathways through Gene Set Enrichment Analysis (GSEA). Finally, the reliability of the conclusions was tested through statistical analysis.
Results: The analysis results from the database and the tissue microarrays from the Red Cross Hospital of Yulin City both indicated that GNA15 was significantly overexpressed in CRC tissues. The gene effect scores calculated after knocking out GNA15 showed that the gene effect scores of HCC56 and DLD1 cell lines were strongly negative. GSEA indicated that the differentially expressed genes were mainly concentrated in biological processes such as antigen-antibody binding, immunoglobulin complex, phagocytosis, antigen processing and presentation, cell adhesion molecules, T helper 17 (Th17) cell differentiation, and toll-like receptor signaling pathway. This study has limitations, including a single-center retrospective cohort design and lack of in vivo validation.
Conclusions: GNA15 is highly expressed in CRC and has certain diagnostic value. GNA15 may play a role in CRC through affecting the growth of cell lines such as HCC56, DLD1 and biological processes such as antigen-antibody binding, immunoglobulin complex, phagocytosis, antigen processing and presentation, cell adhesion molecules, Th17 cell differentiation, and toll-like receptor signaling pathway.
Keywords: G protein subunit α-15; Colorectal cancer; Immunohistochemistry; Single-cell sequencing; Pathology; Tumor microenvironment
| Introduction | ▴Top |
Colorectal cancer (CRC) is now the third most common cancer globally and the second leading cause of cancer death. Incidence has increased in recent years. According to projections, the global burden of CRC is expected to increase by 72% from 1.8 million new cases in 2018 to more than 3 million by 2040, with substantial increases expected in low - and middle-income countries [1, 2]. At present, a variety of targeted drugs such as epidermal growth factor receptor (EGFR) inhibitors (cetuximab, panitumumab) and vascular endothelial growth factor (VEGF) inhibitors (bevacizumab) have been used in the treatment of CRC, but the current targeted drug therapy still has problems of resistance and side effects. Some patients still receive poor benefits from targeted drug therapy now. Therefore, it is of great significance to search for new and potential therapeutic targets.
G protein subunit α-15 (GNA15) as the α subunit of G protein, its key role in cell signaling has made it an important target for biomedical research. Existing studies have confirmed that high expression of GNA15 is associated with poor prognosis in some malignancies, such as pancreatic ductal adenocarcinoma [3], adult acute myeloid leukemia [4], small intestinal neuroendocrine neoplasia [5] and serous ovarian cancer [6]. The exact mechanism by which GNA15 promotes tumorigenesis is not well understood. Existing studies suggest that GNA15 may induce malignant cell proliferation mainly by inhibiting apoptosis. GNA15 was proved to be able to couple with β1 adrenergic receptor and regulate proliferation signal through G protein-coupled receptor. When GNA15 expression was low, proliferation was inhibited and apoptosis was activated [5]. Some researchers treat cells in vitro with the monoclonal antibody (mAb) AC10364 and found that it could reduce the expression of GNA15 and induce apoptosis [7]. These studies all suggest that the high expression of GNA15 in tumor cells may lead to the inhibition of apoptosis and the development of tumors. In CRC, it remains unclear whether the carcinogenic effects of GNA15 are different from those in other tumors and whether it is a promising target for screening and prognostic determination.
Using data from Gene Expression Omnibus (GEO), Tumor Immune Estimation Resource (TIMER), and relevant databases, along with clinical data from 208 CRC patients at the Red Cross Hospital of Yulin City, this study clarified the expression differences of GNA15 in CRC cells and evaluated GNA15 expression through single-cell analysis. The correlation between GNA15 expression and tumor microenvironment (TME) was studied. At the same time, GNA15 was knocked out using the CRISPR-Cas9 system, and the gene effect score was calculated with the CERES (CRISPR Efficiency through expression level Regularization and Evaluation of Scores) algorithm to evaluate the role of GNA15 in the regulation of CRC cell proliferation. Through the above research, this study integrated multi-source data (public databases + 208 clinical samples) to clarify two core objectives: 1) the diagnostic value of GNA15 in CRC; 2) the mechanistic role of GNA15 in CRC progression via immune-related pathways.
| Materials and Methods | ▴Top |
Evaluation of differential expressions of GNA15 in CRC
Assessment of differential expressions of GNA15 mRNA in CRC based on global public databases
The expression profiles of GNA15 in CRC were analyzed using data from the GEO, The Cancer Genome Atlas (TCGA), the Genotype-Tissue Expression (GTEx) project, the International Cancer Genome Consortium (ICGC), ArrayExpress, the Sequence Read Archive (SRA), and relevant scientific literature. The search keywords included “colon,” “rectal,” “rectum,” “colorectal,” “carcinoma,” “cancer,” “malignancy,” and “tumor.” The inclusion criteria were as follows: 1) data derived from human samples; 2) experimental groups consisting of CRC tissue samples, with control groups comprising non-tumor tissues; 3) a minimum of three samples in each group. The exclusion criteria were: 1) samples from recurrent or metastatic CRC; 2) absence of GNA15 expression data. Following the screening process, datasets from the same GEO platform were consolidated to form a comprehensive expression matrix. The mRNA expression matrix was standardized and log2 (x + 1) transformed, with batch effects removed using the “limma” and “sva” packages in R.
Immunohistochemical validation of GNA15 protein expression in CRC
This study utilized a tissue microarray containing 208 pairs of CRC and corresponding non-tumor tissue samples from the Red Cross Hospital of Yulin City to elucidate the expression of GNA15 protein in CRC. We collected clinical pathological data from the patients, including age, gender, macroscopic subtype, vascular invasion, neural invasion, lymph node involvement, TNM staging, survival status, and clinical stage (Supplementary Material 1, wjon.elmerpub.com). Institutional Review Board approval for this study was obtained from the Ethics Committees of both the Red Cross Hospital of Yulin City and the First Affiliated Hospital of Guangxi Medical University. This research was conducted in accordance with the ethical standards for human subjects set by the responsible institution.
During tissue analysis, paraffin-embedded blocks were cut into 2-µm thick sections and heated at 75 °C for 20 min to remove the paraffin, thereby facilitating histological examination. After deparaffinization, sections were incubated in 3% hydrogen peroxide for 15 min, followed by multiple washes with distilled water and phosphate-buffered saline (PBS). We performed immunostaining using rabbit anti-human GNA15 antibody (AB225949), followed by washing with PBS. Subsequently, the sections underwent re-staining, dehydration, clearing, and mounting. Adjacent non-cancerous tissue sections served as positive controls, while PBS was used as a negative control. The immunohistochemical staining was analyzed to compare the expression between CRC and adjacent non-cancerous tissues, with the collected data being synthesized.
Two experienced pathologists independently evaluated the processed sections. The evaluation criteria included the percentage of positively stained cells and staining intensity. The scoring system for the percentage of positively stained cells was as follows: 0 points for no expression, 1 point for fewer than 25% positive cells, 2 points for 26% to 50% positive cells, 3 points for 51% to 75% positive cells, and 4 points for over 75% positive cells. The staining intensity was scored as 0 for unstained, 1 for weak cytoplasmic staining, 2 for moderate yellow staining, and 3 for strong brown-yellow staining [8-10]. The overall score was derived by multiplying the staining intensity by the percentage of positively stained cells. In cases where the scores from the two pathologists differed, the average of their scores was taken as the final score.
Evaluation of GNA15 expression in single-cell analyses of CRC
This study employed single-cell RNA sequencing data from the GEO dataset GSE144735 to investigate the single-cell expression patterns of the GNA15 gene in CRC. The criteria for cell selection included a total RNA feature count ranging from 200 to 2,500, and a requirement for mitochondrial DNA content to be below 5%. Data analysis was performed using the Seurat package. During this process, the data were normalized using the NormalizeData function. To address batch effects arising from differences in sequencing technologies, the Harmony package was utilized for integration. Subsequently, principal component analysis (PCA) was conducted using the FindVariableFeatures function, with a resolution parameter set to 0.5. Dimensionality reduction was achieved using Uniform Manifold Approximation and Projection (UMAP), with the analysis range set from 1 to 20 dimensions. GNA15 expression in normal and malignant epithelial cells of colorectal tissue was illustrated using violin plots.
Correlation between GNA15 expression and the TME
The TIMER database serves as an online tool focused on the tumor immune microenvironment, aimed at providing researchers with in-depth analyses of immune cell infiltration in tumor patients [11]. To clarify the immune infiltration status of GNA15 in CRC, we downloaded data for seven immune cell types, including purity, B cells, CD8+ T cells, CD4+ T cells, macrophages, neutrophils, and dendritic cells.
Investigation of the role of GNA15 in regulating CRC cell proliferation
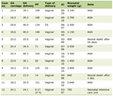
In this segment of the study, we explored the functional role of GNA15 in CRC cells by elimination of GNA15 using CRISPR-Cas9 gene editing technology. CRISPR-Cas9 knockout data were retrieved from the DepMap public database, and gene effect scores were calculated via the CERES algorithm (details of Research Resource Identifiers (RRIDs) are provided in Table 1). The CERES algorithm was utilized to compute gene effect scores to assess the importance of GNA15 across various CRC cell lines. A negative gene effect score indicated that the knockout of GNA15 resulted in a significant disruption of cell growth, underscoring its essential role in cell proliferation [12].
 Click to view |
Table 1. DepMap CRISPR-Cas9 Knockout Gene
Effect Scores |
Potential pathogenic mechanisms of GNA15 in CRC
We obtained RNA sequencing data for CRC along with corresponding clinical information from TCGA database. For the genes involved in relevant pathways, we utilized the Gene Set Enrichment Analysis (GSEA) package in R for analysis. Spearman correlation analysis was performed to evaluate the relationship between gene expression and pathway scores.
Statistical analysis
In the analysis of CRC and its non-cancerous colorectal tissues, we implemented a comprehensive assessment strategy that integrated mRNA microarray and sequencing data to illustrate the expression of the GNA15 gene in CRC. The Wilcoxon test was performed using SPSS 22.0 to analyze the expression differences of GNA15 between CRC and non-tumor tissues. Significant differences were visualized using the ggplot2 package in R software, and standardized mean differences (SMDs) along with their 95% confidence intervals (CIs) were calculated in STATA 12.0. Model selection was based on heterogeneity analysis (I2 value and Chi-squared test); a random-effects model was employed in cases of significant heterogeneity (I2 > 50% and P < 0. 05). Furthermore, we assessed the expression differences of GNA15 between CRC and non-cancerous colorectal tissues using non-parametric tests, with a two-tailed P value of < 0. 05 considered statistically significant. We constructed receiver operating characteristic (ROC) curves using the pROC package in R and calculated the summary ROC (SROC) curves to evaluate the expression of GNA15 between CRC tissues and non-cancerous colorectal tissues, assessing its performance through the area under the curve (AUC). Additionally, we evaluated the characteristics of GNA15 using sensitivity, specificity, and diagnostic likelihood ratio (DLR). Publication bias was assessed using Egger’s and Begg’s tests, with a P ≥ 0. 05 indicating no significant publication bias.
| Results | ▴Top |
GNA15 is highly expressed in CRC
GNA15 protein is highly expressed in CRC according to immunohistochemical validation
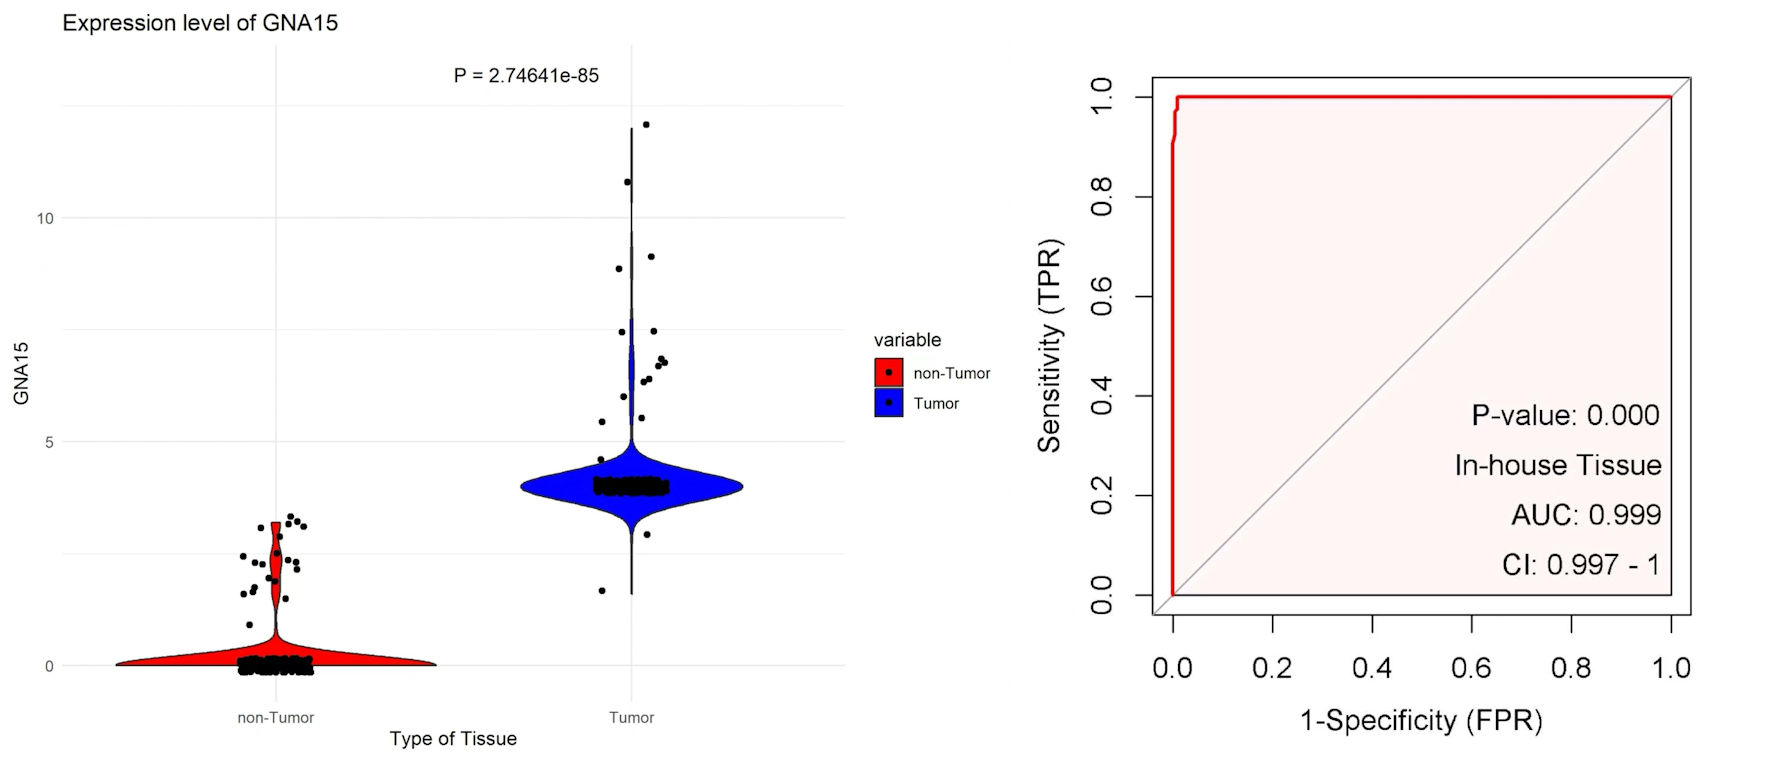
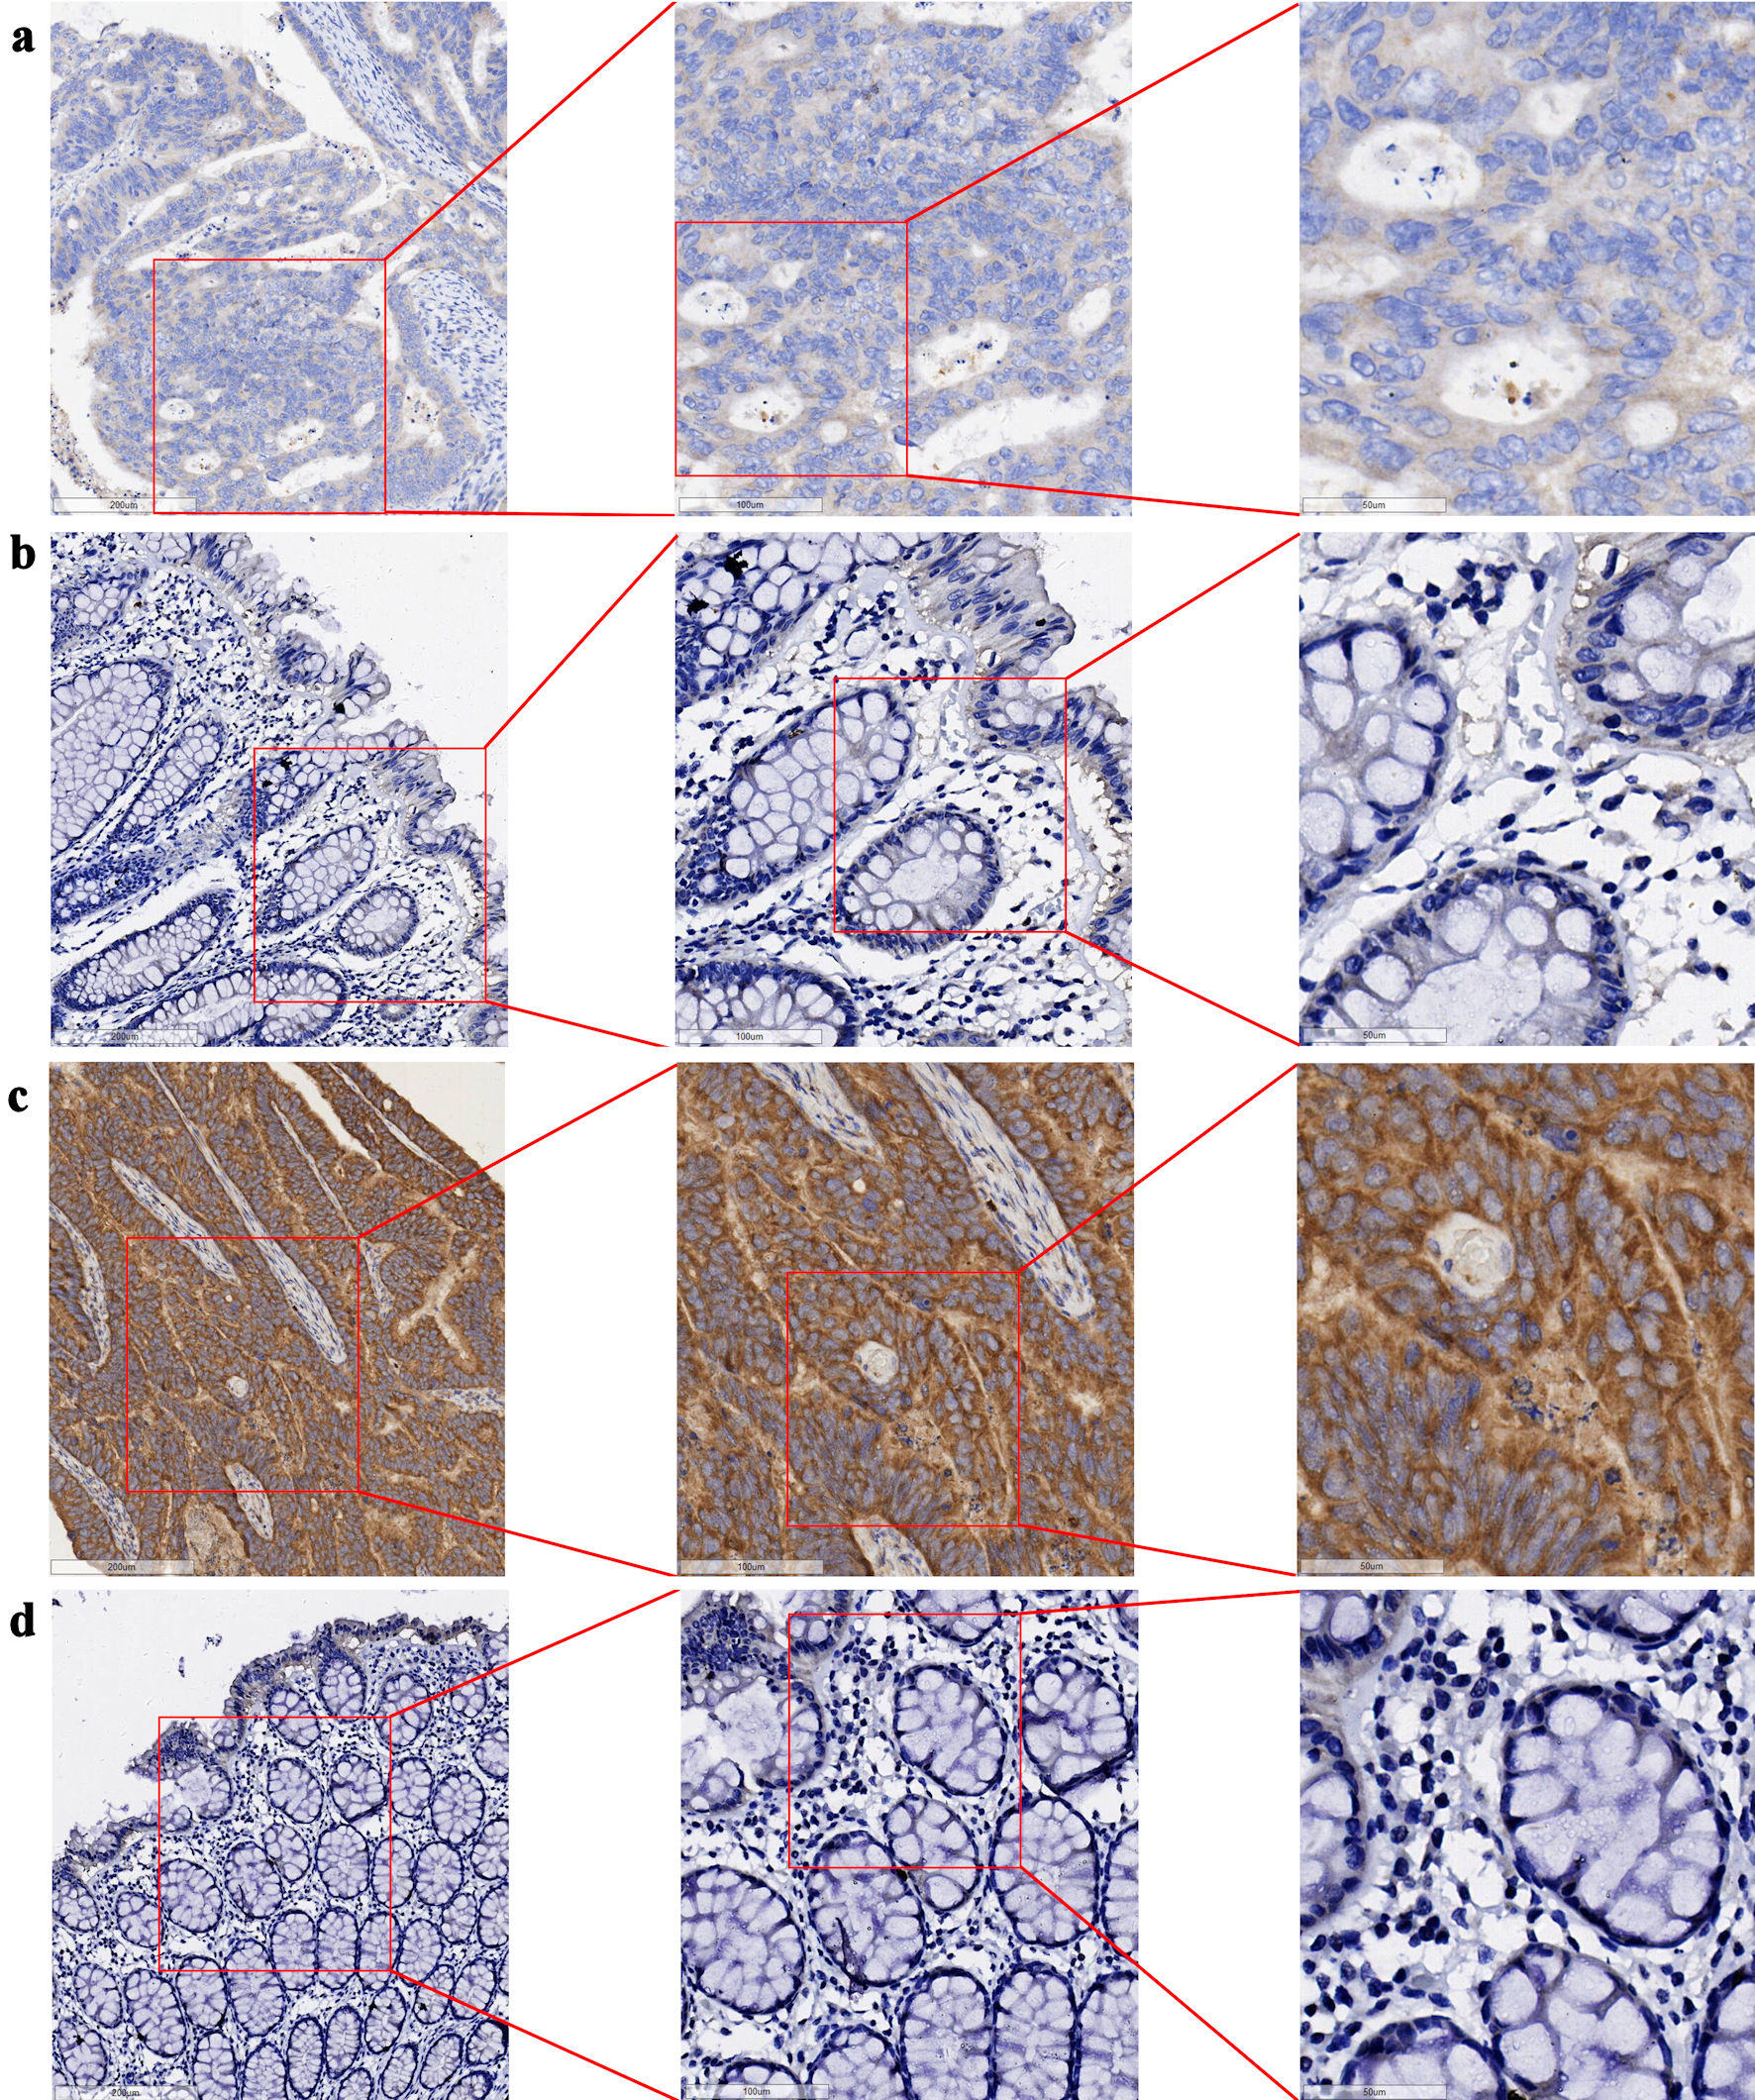
The tissue chips of 208 CRC and corresponding non-tumor tissue samples from Red Cross Hospital of Yulin City were scored, and the collected data were visualized with R 4.3.3. The expression level of GNA15 in tumor tissues was significantly higher than that in adjacent tissues (P = 2.74641 × 10-85). At the same time, the AUC value of the ROC curve was greater than 0. 99 (Fig. 1). In the immunohistochemical study, the difference in the protein expression level of GNA15 between non-cancerous adjacent tissues and CRC tissues was analyzed. The detection results of three pairs of clinical samples showed that the staining of GNA15 protein in non-cancerous tissues was significantly lighter than that in the corresponding CRC tissues (Fig. 2). These results suggest that GNA15 expression product could serve as a new screening diagnostic target.
 Click for large image |
Figure 1. The left plot uses scatter-violin visualization to show that GNA15 expression is significantly higher in tumor (blue) than non-tumor (red) tissues. The right ROC curve, based on in-house tissue samples, shows that GNA15 has excellent diagnostic ability to distinguish tumor from non-tumor tissues. GNA15: G protein subunit α-15; ROC: receiver operating characteristic; AUC: area under the curve; FPR: false positive rate; CI: confidence interval; TPR: true positive rate. |
 Click for large image |
Figure 2. Expression of GNA15 protein in CRC tissues and their adjacent non-cancerous tissues (bar = 200 µm (left side of images), 100 µm (middle column), 50 µm (right side)). (a) CRC tissue (sample 1); (b) adjacent non-cancerous tissue (sample 1), with (a) and (b) derived from the same sample. (c) CRC tissue (sample 2); (d) adjacent non-cancerous tissue (sample 2), with (c) and (d) derived from the same sample. GNA15: G protein subunit α-15; CRC: colorectal cancer. |
UMAP analysis reveals high GNA15 expression in malignant cells compared with epithelial cells
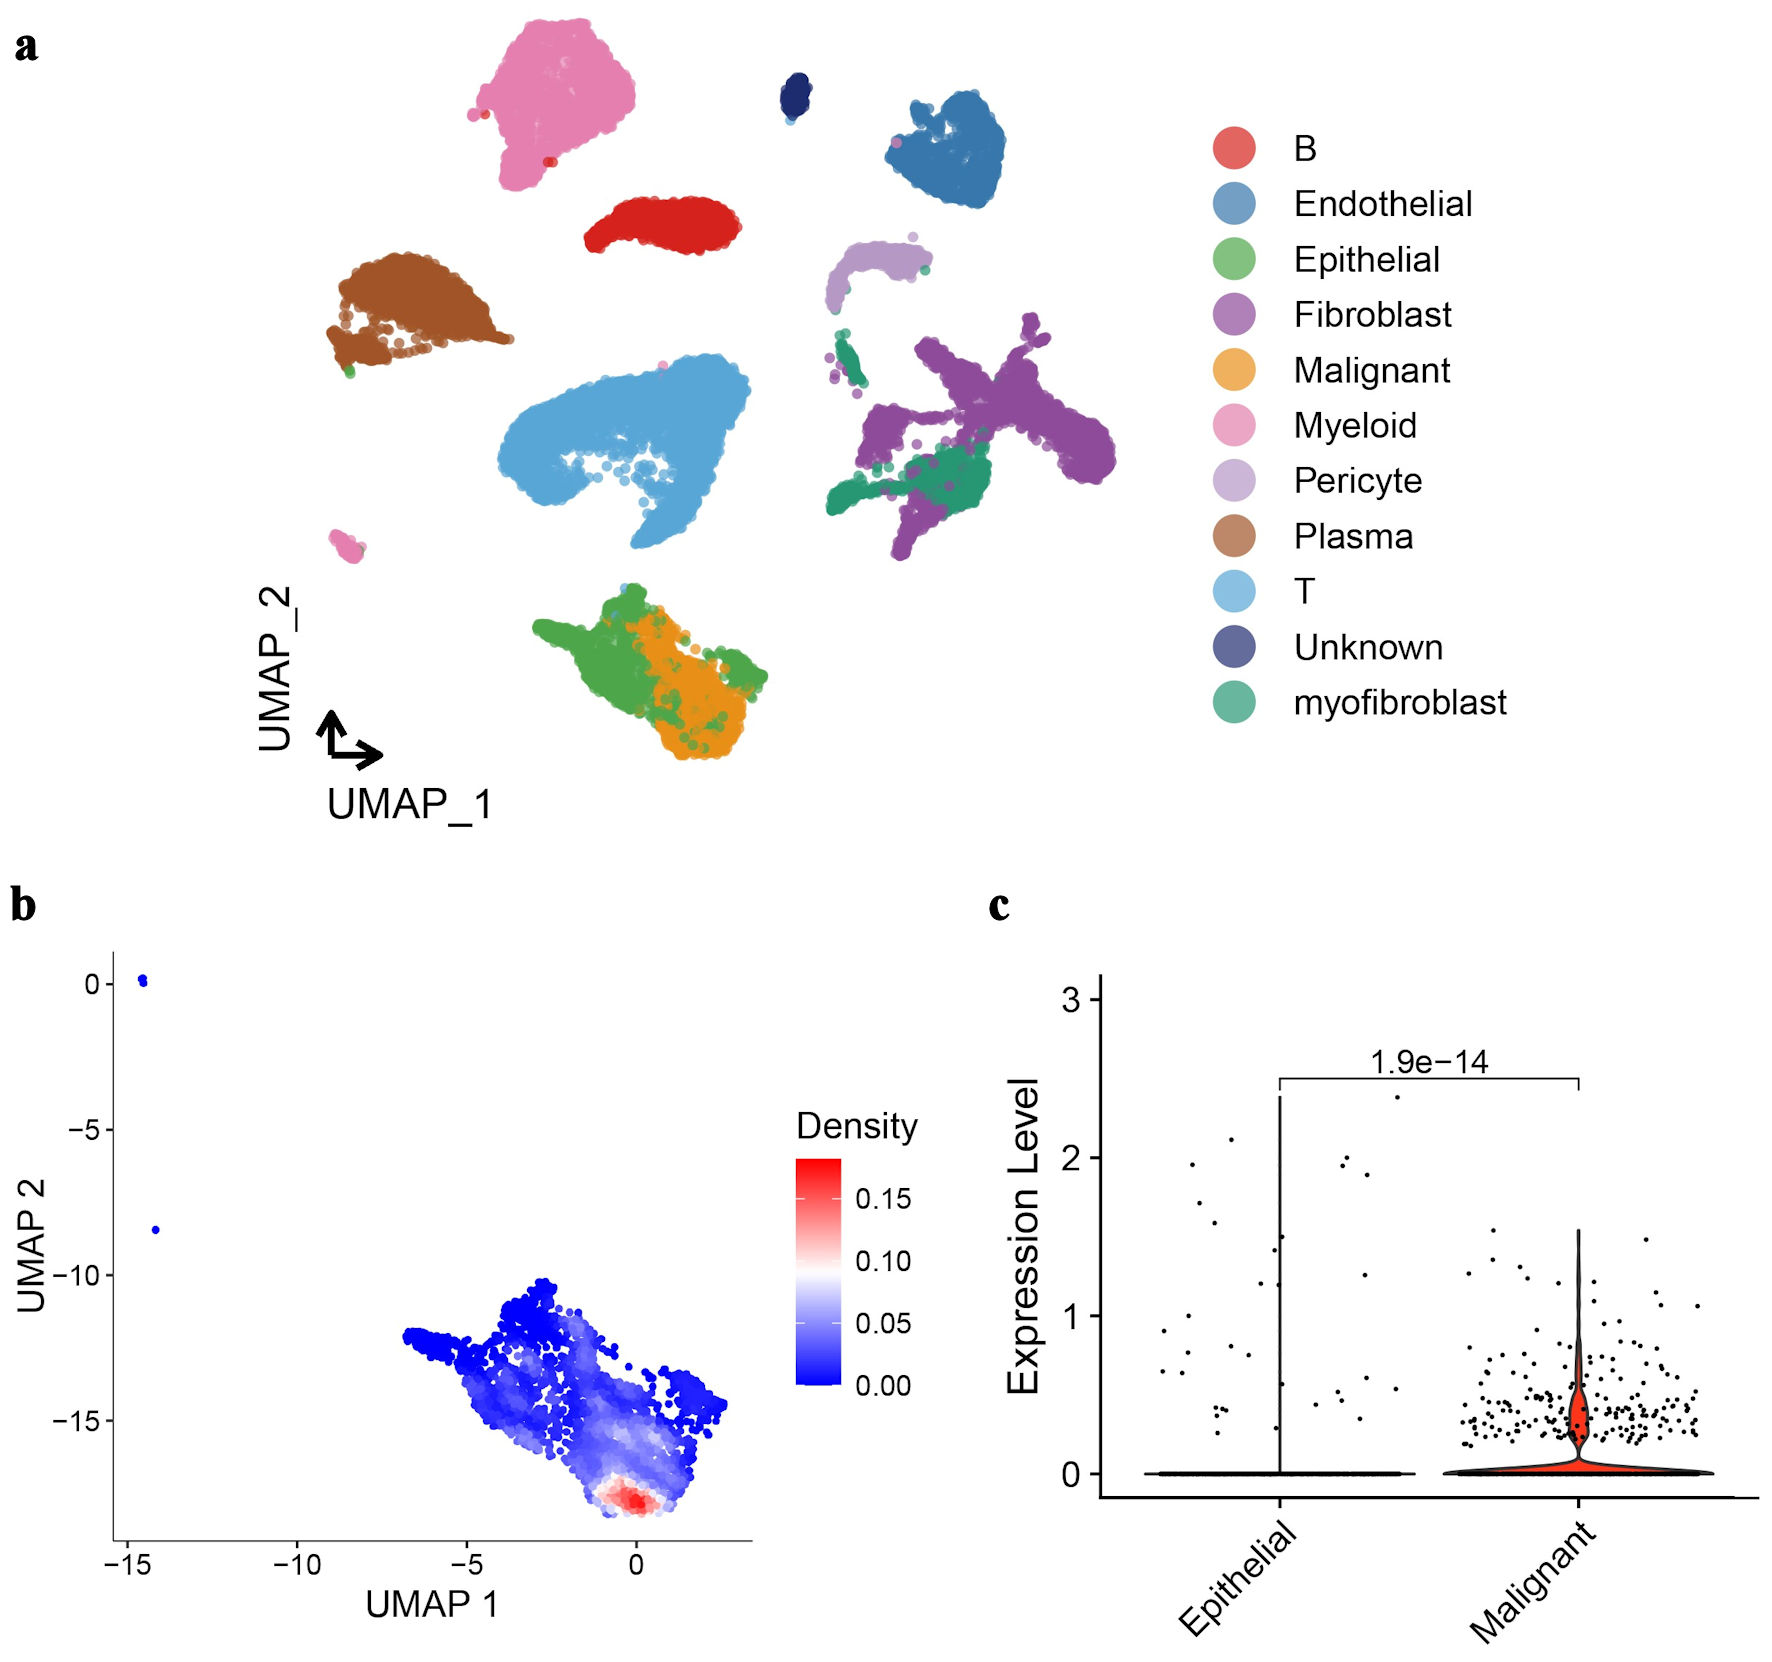
Cells in CRC tissue were further divided into different cell types by UMAP analysis. It can be seen that the expression profiles of malignant cells and normal epithelial cells are most similar (Fig. 3a). Among the differentially expressed genes between them, GNA15 is clearly highly expressed in malignant cells (Fig. 3b). The violin plot of GNA15 expression in malignant cells and normal epithelial cells also shows the same result (Fig. 3c).
 Click for large image |
Figure 3. UMAP analysis and GNA15 expression in CRC tissue cells. (a) UMAP plot clusters CRC tissue cells into different types (each color represents a cell type like epithelial, malignant, fibroblast, etc.). (b) UMAP plot with a density gradient (red = high density, blue = low density) shows GNA15-expressing cell distribution. (c) Violin plot compares GNA15 expression between epithelial and malignant cells, showing significantly higher expression in malignant cells (P = 1.9 × 10⁻¹⁴). These panels demonstrate cell-type clustering in CRC via UMAP and high GNA15 expression in malignant cells. UMAP: Uniform Manifold Approximation and Projection; GNA15: G protein subunit α-15; CRC: colorectal cancer. |
B cells, CD8+ T cells, CD4+ T cells, macrophages, neutrophils and dendritic cells were all positively correlated with GNA15 expression
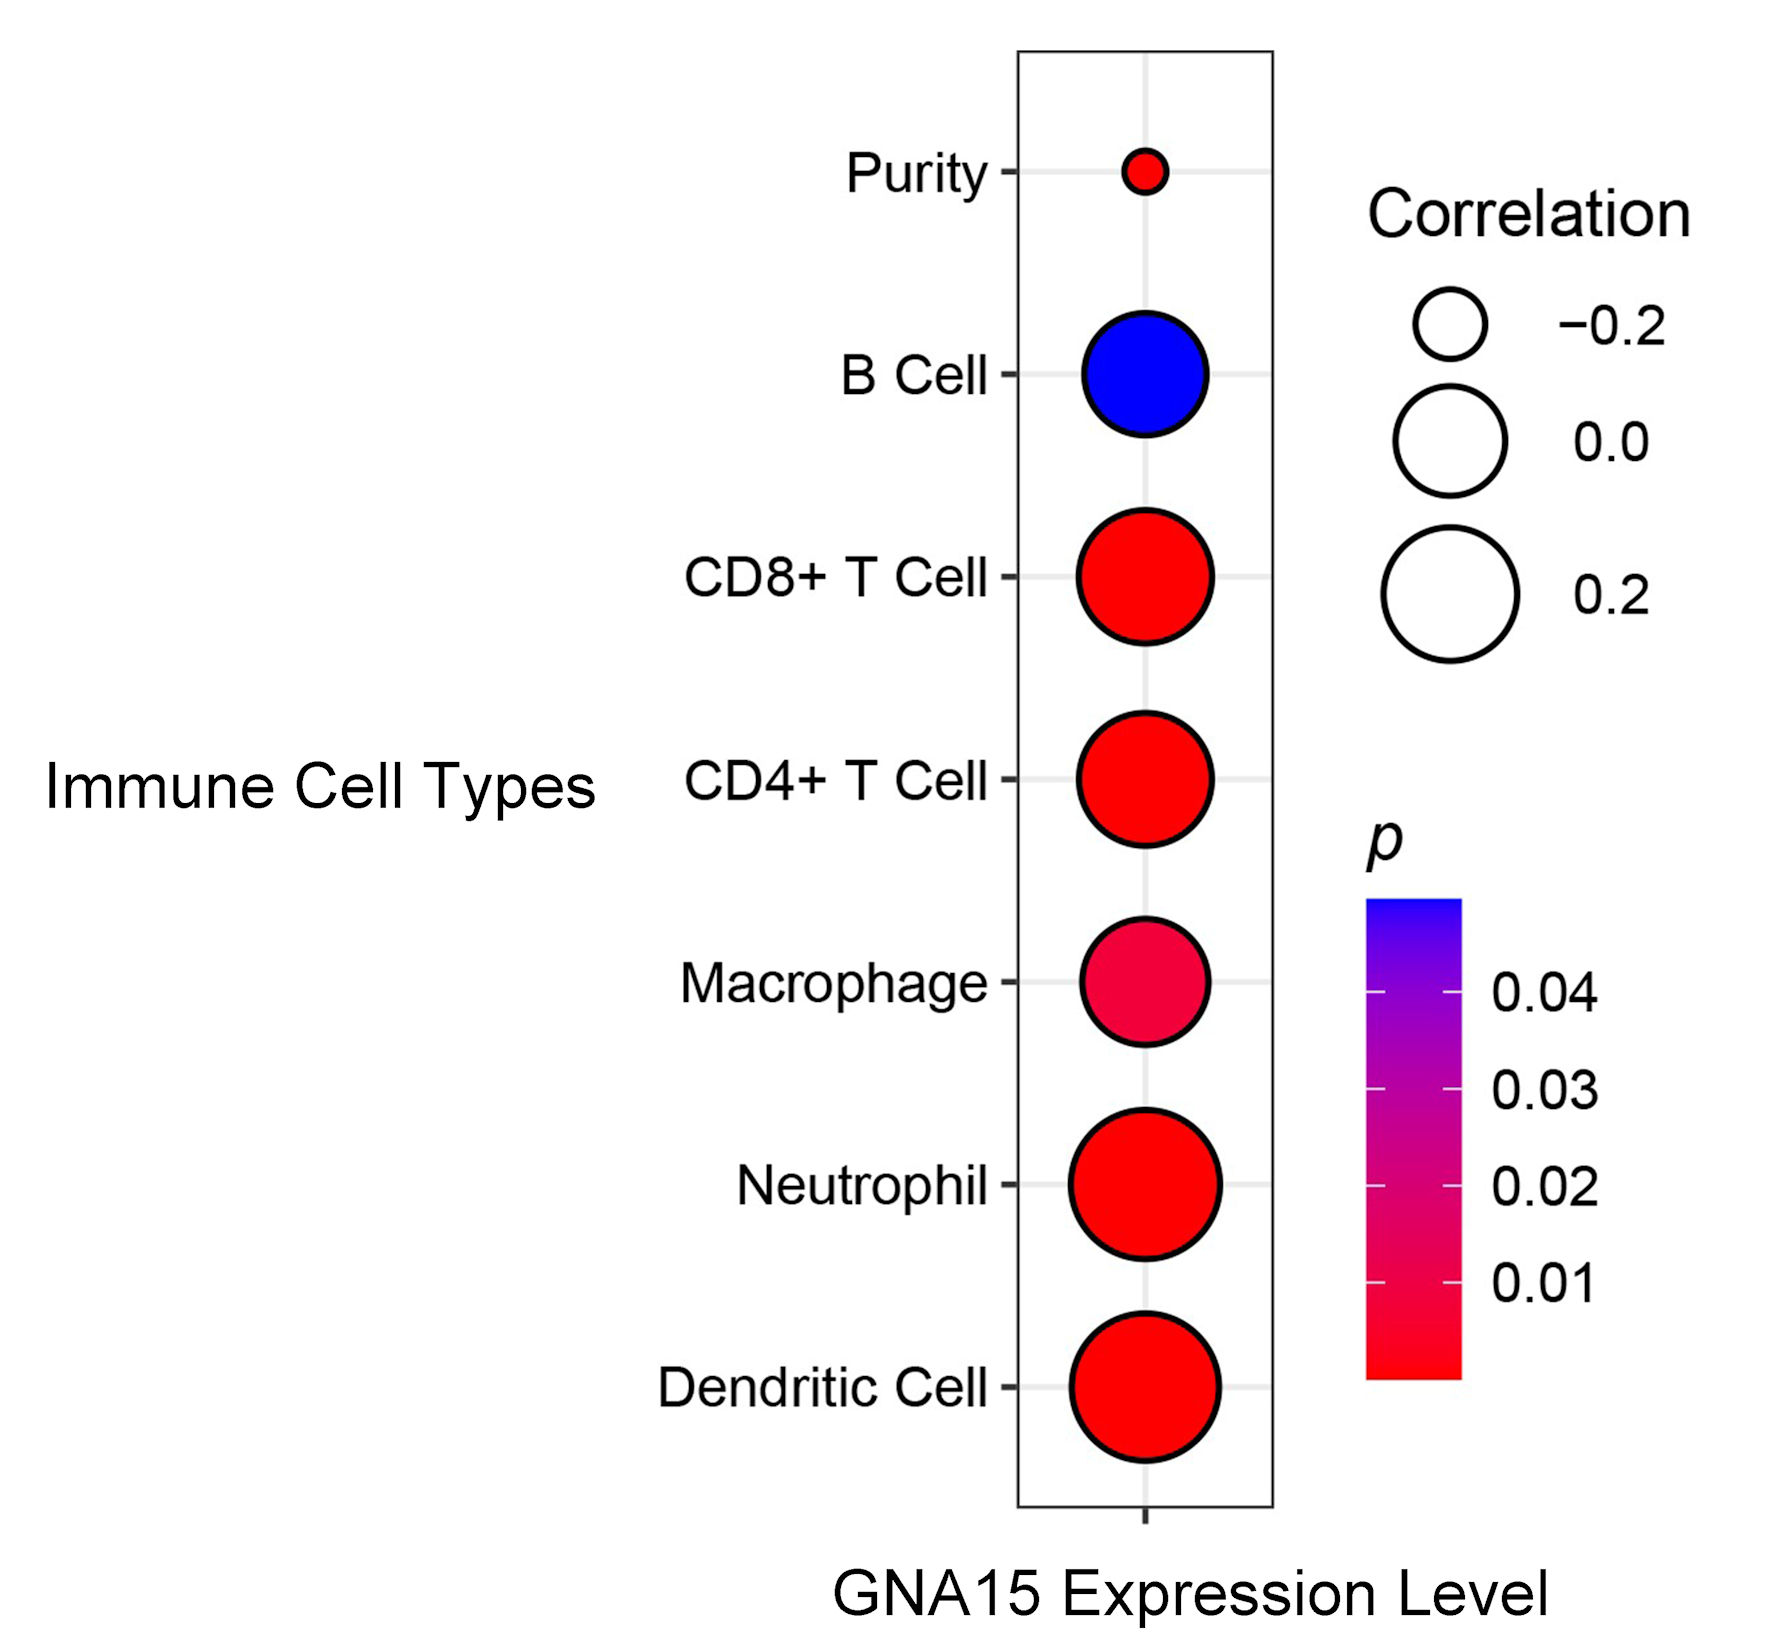
According to the analysis of data in the TIMER database, B cells, CD8+ T cells, CD4+ T cells, macrophages, neutrophils and dendritic cells were all positively correlated with GNA15 expression, and the correlation coefficients were all greater than 0.2 except macrophages and B cells, and P < 0.05 was found in all cells except B cells (Fig. 4).
 Click for large image |
Figure 4. Correlation between GNA15 expression and immune cell types. Circle size indicates the correlation coefficient (larger circles indicate = stronger positive correlation, legend values: 0.2, 0.0, -0.2). Circle color represents the P value (redder = smaller P value, more significant; bluer = larger P value). Using the TIMER database, correlations were evaluated for B cell, CD8+ T cell, CD4+ T cell, macrophage, neutrophil, dendritic cell, and purity. TIMER: Tumor Immune Estimation Resource; GNA15: G protein subunit α-15. |
GNA15 expression was negatively correlated with the growth of cell lines such as HCC56, DLD1
After the elimination of GNA15 using CRISPR-Cas9 gene editing technology, the growth of CRC cells was significantly interrupted. The gene effect score was calculated by CERES algorithm, and the gene effect scores of HCC56 and DLD1 cell lines showed strongly negative values (Fig. 5). It indicates that the growth of CRC cell lines such as HCC56 and DLD1 (not genes) is significantly affected after GNA15 knockout. The negative gene effect score showed that knocking out GNA15 resulted in a significant interruption of cell growth, demonstrating that GNA15 plays an important role in cell proliferation. These results suggest that GNA15 may function by influencing cell lines such as HCC56 and DLD1.
 Click for large image |
Figure 5. Dot plot showing the gene effect scores of different CRC cell lines (e.g., HCC56, DLD1, CL40, etc.) after GNA15 gene knockout via CRISPR-Cas9 technology. The color gradient (from blue to red) and the size of the black dots both represent the gene effect score: a more negative score (closer to -0.20, indicated by red and larger dots) means that knocking out GNA15 has a stronger inhibitory effect on the growth of that cell line, while a score near 0 (blue, small dots) means the cell line’s growth is barely affected. |
GNA15 may act through immune-related pathways
The RNA sequencing data of CRC and corresponding clinical information were obtained from TCGA, and the genes involved in related pathways were analyzed using the GSEA software package in R. GSEA analysis showed that differential genes were mainly concentrated in biological processes such as antigen-antibody binding, immunoglobulin complex, phagocytosis, antigen treatment presentation, cell adhesion molecules, T helper 17 (Th17) cell differentiation, and toll-like receptor signaling pathway (Fig. 6), suggesting that GNA15 may play a role through these pathways.
 Click for large image |
Figure 6. GSEA plots showing immune-related pathway enrichment in CRC. RNA sequencing data and clinical information from TCGA were analyzed using GSEA in R. (a) Enriched pathways include antigen binding, immunoglobulin complex, and phagocytosis pathways. (b) Additional enriched pathways include antigen processing/presentation, cell adhesion molecules, cytokine-cytokine receptor interaction, Th17 cell differentiation, and toll-like receptor signaling pathways. The curves and plots indicate pathways with differentially expressed genes, suggesting GNA15 may act through these immune-related pathways in CRC. GSEA: Gene Set Enrichment Analysis; CRC: colorectal cancer; TCGA: The Cancer Genome Atlas. |
Statistical analysis proves that the expression difference has statistical significance
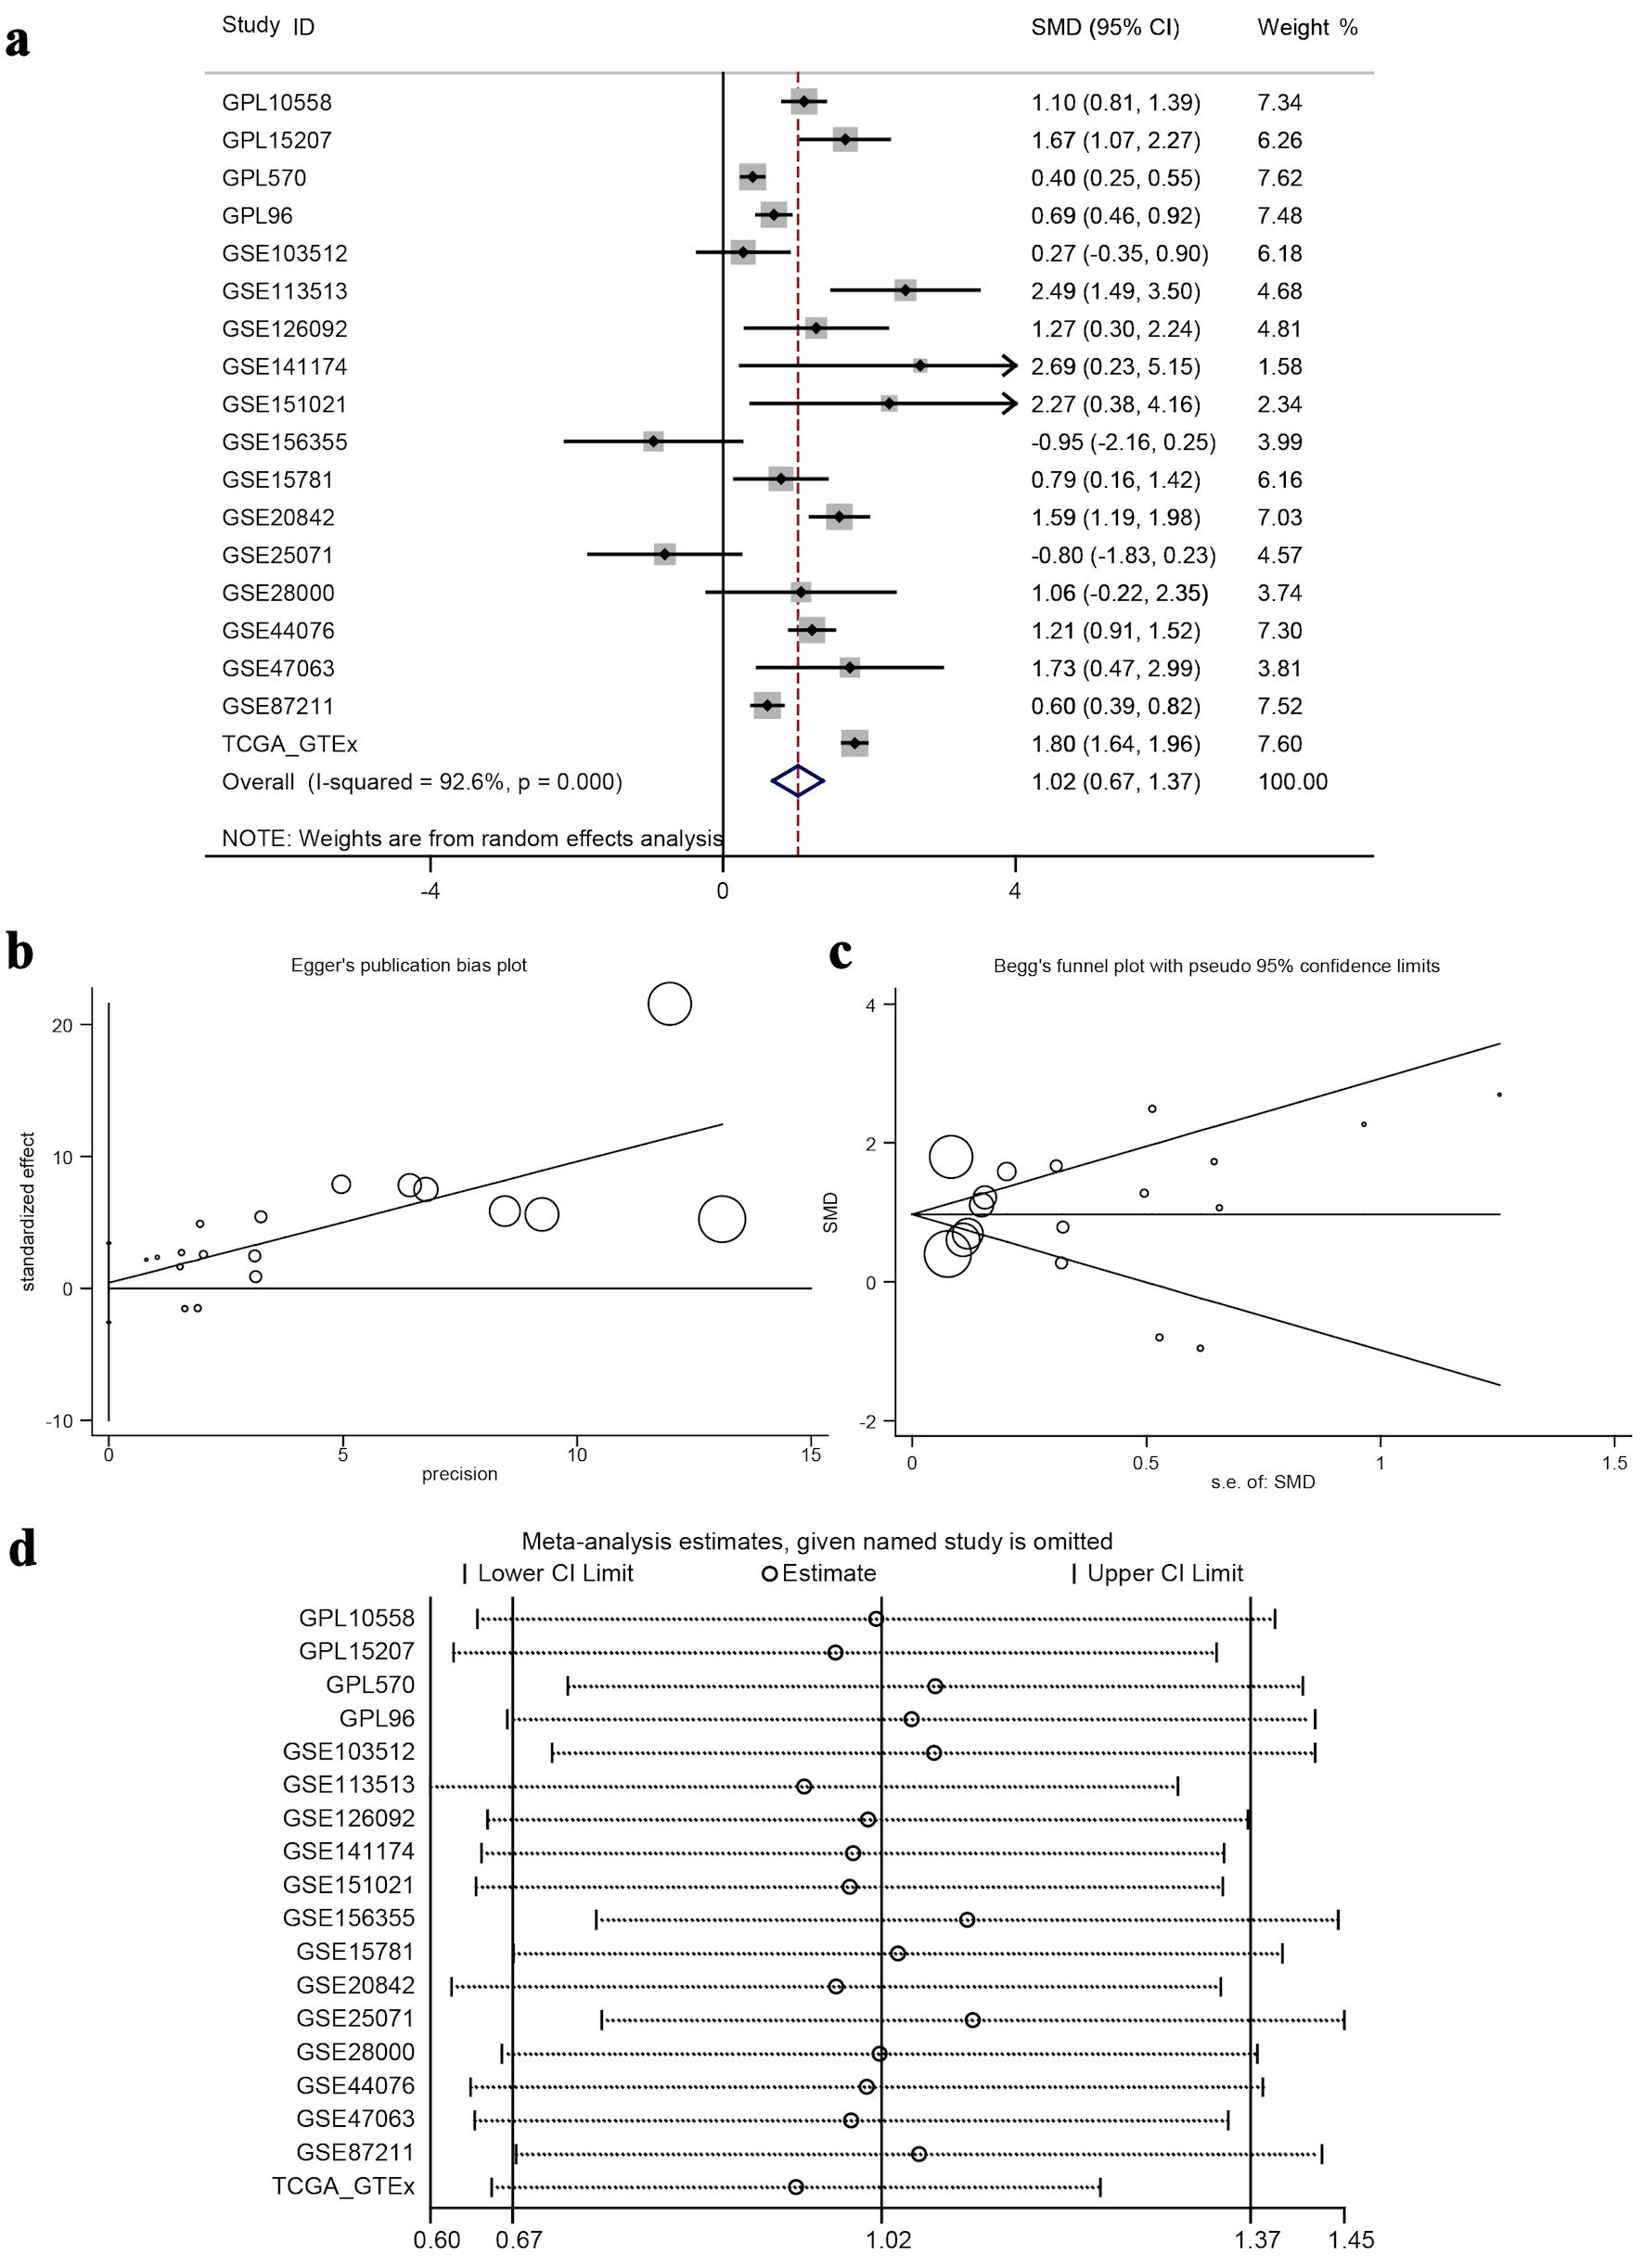
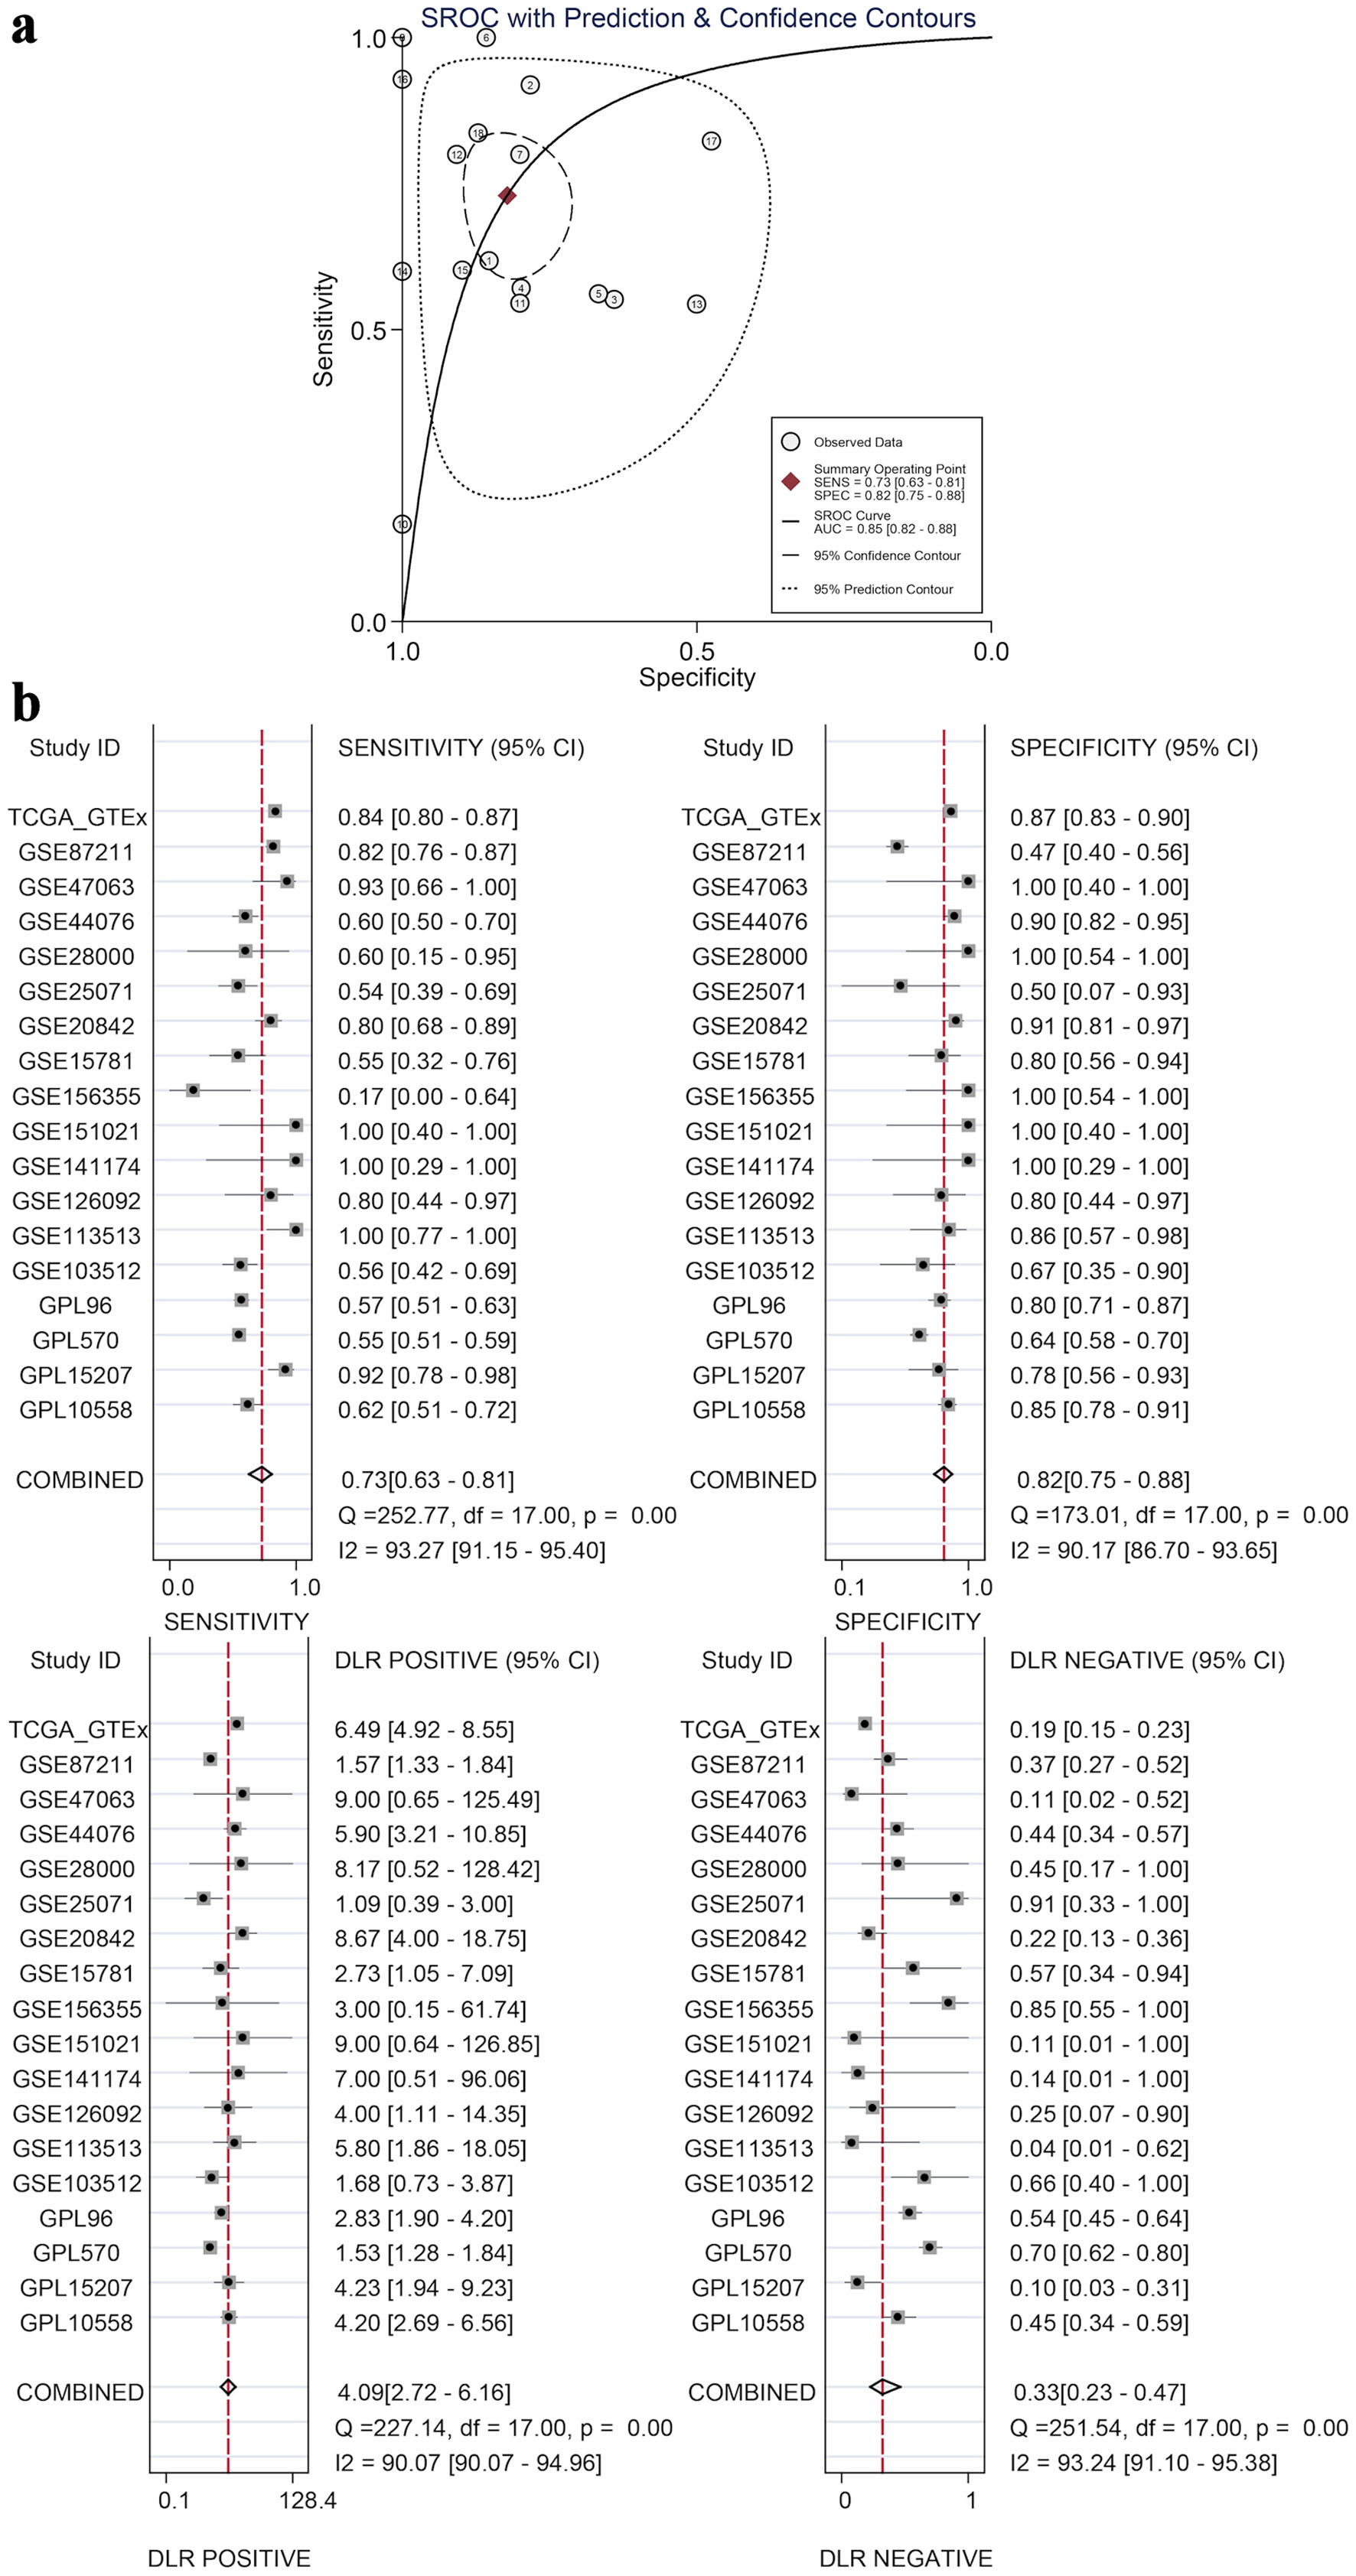
The calculated results showed that I2 = 92.6% (Fig. 7a), which shows significant heterogeneity, indicating that the difference in GNA15 expression was largely attributed to non-sampling error factors. The Egger’s and Begg’s tests also showed no significant publication bias. This indicates that the conclusion of high expression of GNA15 in tumor cells is reliable (Fig. 7b, c). Also, using the pROC package in R to build the ROC and calculate the SROC curve, the AUC was 0.85, indicating that the expression level of GNA15 could better distinguish between cancerous and non-cancerous tissues (Fig. 8a). Summarizing each dataset from the TCGA and GTEx databases, the meta-analysis estimates for each dataset were relatively close, with an average of 1.02 (Fig. 7d), and the combined of sensitivity 0.73, the combined of specificity 0.82, the combined of DLR positive 4.09, and the combined of DLR negative was 0.33. These findings also show that GNA15 has high value in diagnosing CRC (Fig. 8b).
 Click for large image |
Figure 7. Meta-analysis and bias/sensitivity assessments. (a) A forest plot generated using inverse variance weighting is shown, where each study ID denotes a different dataset, and the diamond reflects the overall effect size with 95% CI, showing significant heterogeneity (I2 = 92.6%). (b) Egger’s publication bias plot, checking for the relationship between study precision and effect size to identify publication bias. (c) Begg’s funnel plot with pseudo 95% confidence limits, where symmetric distribution of study points around the mean effect suggests no significant publication bias. (d) A sensitivity analysis plot, displaying meta-analysis estimates when each study is excluded to test the robustness of the overall result. ID: identifier; GSE: Gene Set Enrichment; CRC: colorectal cancer; TCGA: The Cancer Genome Atlas; CI: confidence interval; SMD: standardized mean difference. |
 Click for large image |
Figure 8. Diagnostic value by SROC and subgroup analyses. (a) An SROC curve with prediction and confidence contours, where circles are observed data, the red diamond is the summary operating point, and the AUC (0.85) indicates GNA15’s ability to distinguish cancerous and non-cancerous tissues. (b) Four subplots (sensitivity, specificity, DLR positive, and DLR negative), each with 95% CI for individual datasets and combined results, demonstrating GNA15’s high diagnostic value for CRC. SROC: summary ROC; ROC: receiver operating characteristic; DLR: diagnostic likelihood ratio; GSE: Gene Set Enrichment; CRC: colorectal cancer; TCGA: The Cancer Genome Atlas; CI: confidence interval; AUC: area under the curve. |
| Discussion | ▴Top |
CRC is one of the most common malignant tumors globally, with rising incidence and mortality rates [2]. Currently, targeted therapies, alongside surgical resection, are a primary approach in CRC management. EGFR inhibitors (such as cetuximab and panitumumab) and VEGF inhibitors (such as bevacizumab) are widely used in clinical practice. However, the development of resistance and severe side effects associated with most targeted drugs remain significant challenges in CRC treatment [13]. Therefore, identifying new potential targets to enhance therapeutic efficacy and reduce adverse effects is crucial in the field of CRC.
GNA15 plays an important role in cancer-related research and plays a key role in the migration and invasion of tumor cells as well as in the malignant development of cancer, which makes it a promising therapeutic target for research. GNA15 has been shown to mediate the effects of oncogenic microRNAs (miRNAs), such as miR-211-5p, which enhance tumor cell migration and invasion by modifying the immune functions of the TME. This indicates the role of GNA15 in facilitating the transfer of metastatic capabilities between cancer cells [14]. A study identified a multi-marker panel (CEACAM6, HOXA-AS3, miR29a) with complementary roles in CRC progression [15]. CEACAM6, a cell surface glycoprotein, is significantly overexpressed in CRC tissues and correlates with tumor growth; HOXA-AS3, a long non-coding RNA, regulates cellular proliferation via epigenetic mechanisms; and miR29a, a miRNA, modulates key oncogenic pathways through post-transcriptional gene silencing. This panel highlights the value of integrating protein-coding genes, non-coding RNAs, and miRNAs for CRC diagnosis and prognosis - an approach that could be extended to GNA15. For instance, our study mentions GNA15’s mediation of miR-211-5p effects, and the newly identified miR29a may represent another regulatory miRNA interacting with GNA15, which merits further validation. In a study where CRC cells were exposed to the tobacco-specific nitrosamine 4-(methylnitrosamino)-1-(3-pyridyl)-1-butanone (NNK), a four-gene signature, including GNA15, was identified as a prognostic marker for CRC. Notably, GNA15 was found to be part of the core genes contributing to CRC cell proliferation, migration, and invasion when induced by NNK [16]. This underscores GNA15’s potential role in CRC malignancy and supports its investigation as a therapeutic target. GNA15 is of great significance in the malignant behavior of tumor cells and the development of CRC, and its in-depth study is expected to provide new directions and strategies for cancer treatment, and it is worthwhile to further explore the possibility of its use as a therapeutic target.
The results of this study have provided valuable insights into the role of GNA15 in CRC. Through the integration and analysis of multiple datasets, including immunohistochemical validation and single-cell analysis, it has been shown that GNA15 is highly expressed in CRC tissues compared to adjacent non-tumor tissues, indicating its potential as a screening diagnostic target. Noninvasive biomarkers have gained growing attention in CRC management, with circulating tumor DNA (ctDNA) leading the field. A 2025 review highlighted that advanced technologies such as droplet digital polymerase chain reaction (PCR) and next-generation sequencing (NGS) enable sensitive detection of ctDNA, which shows utility in early diagnosis, minimal residual disease (MRD) monitoring, and tracking tumor evolution [17]. Our finding that GNA15 is highly expressed in CRC tissues raises the question of whether GNA15 mutations or copy number variations can be detected in ctDNA, which warrants future exploration. Additionally, the correlation between GNA15 expression and the TME suggests a complex interplay between the gene and immune cells in CRC progression. In the TME, B cells are closely associated with tertiary lymphoid structures (TLS), and B cells in mature TLS can differentiate into plasma cells that produce immunoglobulin (Ig)G or IgA antibodies against tumor-associated antigens, exerting an anti-tumor effect that is correlated with a better clinical outcome and immunotherapeutic response in patients [18]. Given the positive correlation between GNA15 expression and B cell infiltration, it is hypothesized that GNA15 may regulate B cell-related anti-tumor processes rather than inhibiting B-cell function. In view of the anti-tumor mechanism of B cells in CRC, the high expression of GNA15 may inhibit the development of B cells in the direction of anti-tumor function. The finding that knocking out GNA15 interrupts CRC cell growth further emphasizes its importance in cell proliferation, potentially linking its high expression to the excessive proliferation of CRC cells. This is consistent with other studies on GNA15’s role in acute myeloid leukemia cell proliferation [4], further advancing our understanding of GNA15’s mechanisms in CRC. In tumor development, antigen-antibody binding and immunoglobulin complex formation are closely related to tumor immune escape mechanisms, and the results of GNA15 in GSEA analysis suggest that GNA15 may be involved in these processes, potentially interfering with the normal immune function of the body to recognize and remove tumor cells. For example, some tumor cells may use antigen-antibody binding to escape from the immune system, and GNA15 may play a facilitating or regulating role in this process, thus affecting the development of CRC [19]. GSEA and correlation analyses provide inferential evidence for GNA15-related immune pathways, but they only reflect potential associations rather than definite causal relationships. These methods cannot fully exclude the influence of confounding factors, and further experimental verification is needed to confirm the actual regulatory mechanisms of GNA15 in these pathways.
In summary, our study provides a comprehensive evaluation of GNA15 expression and biological function in CRC, offering new insights into its role. The upregulation of GNA15 may be closely related to tumor cell proliferation and modulation of the TME, suggesting its potential application in CRC diagnosis and treatment. Notably, this study has several limitations that warrant attention. First, the single-center retrospective design and limited sample size may restrict the generalizability of GNA15’s prognostic value across diverse CRC subtypes. Second, while in vitro experiments validated GNA15’s pro-proliferative role, in vivo models recapitulating tumor-stroma interactions were lacking, which limits mechanistic insights into its microenvironment-modulating effects. Although CRISPR-Cas9 knockout experiments confirmed the role of GNA15 in CRC cell proliferation, the current study lacks rescue experiments (e.g., restoring GNA15 expression in knockout cells to verify whether cell proliferation can be recovered) and pathway-specific inhibition experiments (e.g., inhibiting key molecules in the predicted pathways to observe changes in GNA15’s regulatory effects). These experiments would help more rigorously confirm the causal relationship between GNA15 and CRC progression. Future research should further elucidate the specific functions of GNA15 within the CRC TME and its interactions with immune cells. Clinical studies are needed to validate the practical utility of GNA15 as a biomarker and explore its potential as a target for new therapeutic strategies. Overall, GNA15 not only provides a new direction for CRC research but also lays the groundwork for developing novel treatment strategies.
Conclusions
This study comprehensively investigated GNA15 in CRC. Results showed that GNA15 is highly expressed in CRC tissues, holding potential as a screening diagnostic target. Its expression correlates with the TME, and it plays a crucial role in cell proliferation, possibly acting via immune-related pathways. Overall, this study provides new insights into GNA15’s role in CRC, suggesting its potential for CRC diagnosis and treatment. However, the single-center design and lack of in vivo validation limit the generalizability of our findings, and further multicenter studies are needed to confirm GNA15’s diagnostic and therapeutic value.
| Supplementary Material | ▴Top |
Suppl 1. Clinicopathological characteristics of 208 CRC patients.
Acknowledgments
None to declare.
Financial Disclosure
This work was supported by the Guangxi Zhuang Autonomous Region Health Commission Scientific Research Project (Z-K20221823, Wei Jian Huang; Z20210442, Da Tong Zeng); the Youth Science Foundation of Guangxi Medical University (GXMUYSF202423, Jia Ying Wen); the Promoting Project of Basic Capacity for Young and Middle-aged University Teachers in Guangxi (2025KY0164, Jia Ying Wen); the Guangxi Medical University Special Project on Educational and Teaching Reform for Clinical Disciplines (2025LCJG02, Gang Chen); the Guangxi Medical University Digital Textbook Construction Project (Gxmuszjc2515, Gang Chen); the Guangxi Medical University “Four New” Project (SX202403, Gang Chen).
Conflict of Interest
None to declare.
Informed Consent
Informed consent for the study was obtained from all patients involved.
Author Contributions
Da Tong Zeng, Zu Yuan Chen, Zuo Yan Ming Li, Bang Teng Chi, Jian Di Li, Wei Zhang, Zong Yu Li, Jian Jun Li, Hui Li, Rong Quan He, Gang Chen, Jia Ying Wen, and Wei Jian Huang participated in the conception and design of the study and were involved in the acquisition, analysis, or interpretation of data; Zu Yuan Chen and Zuo Yan Ming Li wrote the manuscript; Da Tong Zeng, Bang Teng Chi, Jian Di Li, Wei Zhang, Zong Yu Li, Jian Jun Li, and Hui Li accessed and verified the study data. All authors critically reviewed and provided final approval of the manuscript; all authors were responsible for the decision to submit the manuscript for publication.
Data Availability
The data supporting the findings of this study are available from the corresponding author upon reasonable request.
| References | ▴Top |
- Gunter MJ, Alhomoud S, Arnold M, Brenner H, Burn J, Casey G, Chan AT,
et al. Meeting report from the joint IARC-NCI international cancer seminar series: a focus on
colorectal cancer. Ann Oncol. 2019;30(4):510-519.
doi pubmed - Sung H, Ferlay J, Siegel RL, Laversanne M, Soerjomataram I, Jemal A,
Bray F. Global cancer statistics 2020: GLOBOCAN estimates of incidence and mortality worldwide
for 36 cancers in 185 countries. CA Cancer J Clin. 2021;71(3):209-249.
doi pubmed - Innamorati G, Wilkie TM, Malpeli G, Paiella S, Grasso S, Rusev B,
Leone BE, et al. Galpha15 in early onset of pancreatic ductal adenocarcinoma. Sci Rep.
2021;11(1):14922.
doi pubmed - Li M, Liu Y, Liu Y, Yang L, Xu Y, Wang W, Jiang Z, et al.
Downregulation of GNA15 inhibits cell proliferation via P38 MAPK pathway and correlates with
prognosis of adult acute myeloid leukemia with normal karyotype. Front Oncol.
2021;11:724435.
doi pubmed - Zanini S, Giovinazzo F, Alaimo D, Lawrence B, Pfragner R, Bassi C,
Modlin I, et al. GNA15 expression in small intestinal neuroendocrine neoplasia: functional and
signalling pathway analyses. Cell Signal. 2015;27(5):899-907.
doi pubmed - Zhan F, Guo Y, He L. A novel defined programmed cell death related
gene signature for predicting the prognosis of serous ovarian cancer. J Ovarian Res.
2024;17(1):92.
doi pubmed - Wu J, Qu J, Cao H, Jing C, Wang Z, Xu H, Ma R. Monoclonal antibody
AC10364 inhibits cell proliferation in 5-fluorouracil resistant hepatocellular carcinoma via
apoptotic pathways. Onco Targets Ther. 2019;12:5053-5067.
doi pubmed - Zhang W, Li GS, Gan XY, Huang ZG, He RQ, Huang H, Li DM, et al. MMP12
serves as an immune cell-related marker of disease status and prognosis in lung squamous cell
carcinoma. PeerJ. 2023;11:e15598.
doi pubmed - Li SH, Zhai GQ, He RQ, Chen G, Wang SS, Liu JL, Cheng JW, et al.
Down-regulation and clinical significance of Sorbin and SH3 domain-containing protein 1 in
bladder cancer tissues. IET Syst Biol. 2023;17(2):70-82.
doi pubmed - Liu Z, Gu S, Lu T, Wu K, Li L, Dong C, Zhou Y. IFI6 depletion
inhibits esophageal squamous cell carcinoma progression through reactive oxygen species
accumulation via mitochondrial dysfunction and endoplasmic reticulum stress. J Exp Clin
Cancer Res. 2020;39(1):144.
doi pubmed - Li T, Fu J, Zeng Z, Cohen D, Li J, Chen Q, Li B, et al. TIMER2.0 for
analysis of tumor-infiltrating immune cells. Nucleic Acids Res. 2020;48(W1):W509-W514.
doi pubmed - Ho KH, Huang TW, Liu AJ, Shih CM, Chen KC. Cancer Essential Genes
Stratified Lung Adenocarcinoma Patients with Distinct Survival Outcomes and Identified a
Subgroup from the Terminal Respiratory Unit Type with Different Proliferative Signatures in
Multiple Cohorts. Cancers (Basel). 2021;13(9):2128.
doi pubmed - Siegel RL, Miller KD, Fuchs HE, Jemal A. Cancer statistics, 2022. CA
Cancer J Clin. 2022;72(1):7-33.
doi pubmed - Zeng B, Chen Y, Chen H, Zhao Q, Sun Z, Liu D, Li X, et al. Exosomal
miR-211-5p regulates glucose metabolism, pyroptosis, and immune microenvironment of melanoma
through GNA15. Pharmacol Res. 2023;188:106660.
doi pubmed - Bahramian S, Akbar S, Nikoo MHR, Amini A, Shamsabadi FT. Molecular
profiling and bioinformatics validation of CEACAM6, HOXA-AS3 and miR29a in colorectal cancer.
Sci Rep. 2025;15(1):37281.
doi pubmed - Jiang M, Zhang X, Huang H, Sun G, Huang Y, Chen Y. A novel four-gene
biomarker for tobacco smoking-induced colorectal cancer progression. Nicotine Tob Res.
2024;26(10):1286-1295.
doi pubmed - Parums DV. A review of circulating tumor DNA (ctDNA) and the liquid
biopsy in cancer diagnosis, screening, and monitoring treatment response. Med Sci Monit.
2025;31:e949300.
doi pubmed - Fridman WH, Meylan M, Petitprez F, Sun CM, Italiano A, Sautes-Fridman
C. B cells and tertiary lymphoid structures as determinants of tumour immune contexture and
clinical outcome. Nat Rev Clin Oncol. 2022;19(7):441-457.
doi pubmed - Magre L, Verstegen MMA, Buschow S, van der Laan LJW, Peppelenbosch M,
Desai J. Emerging organoid-immune co-culture models for cancer research: from oncoimmunology to
personalized immunotherapies. J Immunother Cancer. 2023;11(5):e006290.
doi pubmed
This
article is distributed under the terms of the Creative Commons Attribution 4.0 International
License (CC BY 4.0), which permits unrestricted use, distribution, and reproduction in any
medium, including commercial use, provided the original work is properly
cited.
World Journal of Oncology is published by Elmer Press Inc.