Figures
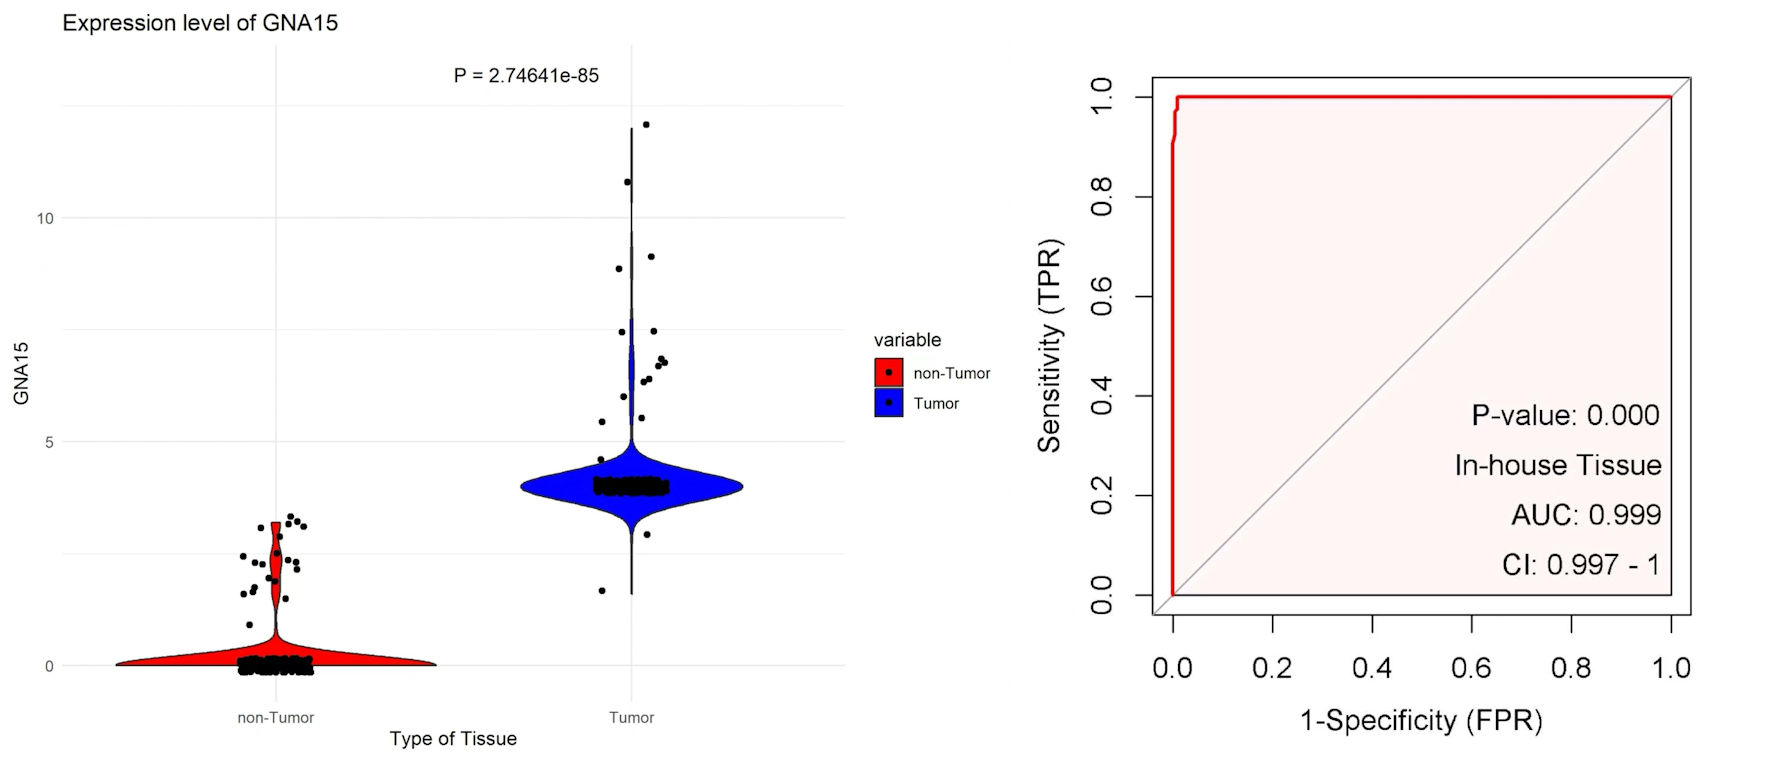
↓ Figure 1. The left plot uses scatter-violin
visualization to show that GNA15 expression is significantly higher in tumor (blue) than non-tumor (red)
tissues. The right ROC curve, based on in-house tissue samples, shows that GNA15 has excellent
diagnostic ability to distinguish tumor from non-tumor tissues. GNA15: G protein subunit α-15;
ROC: receiver operating characteristic; AUC: area under the curve; FPR: false positive rate; CI:
confidence interval; TPR: true positive rate.
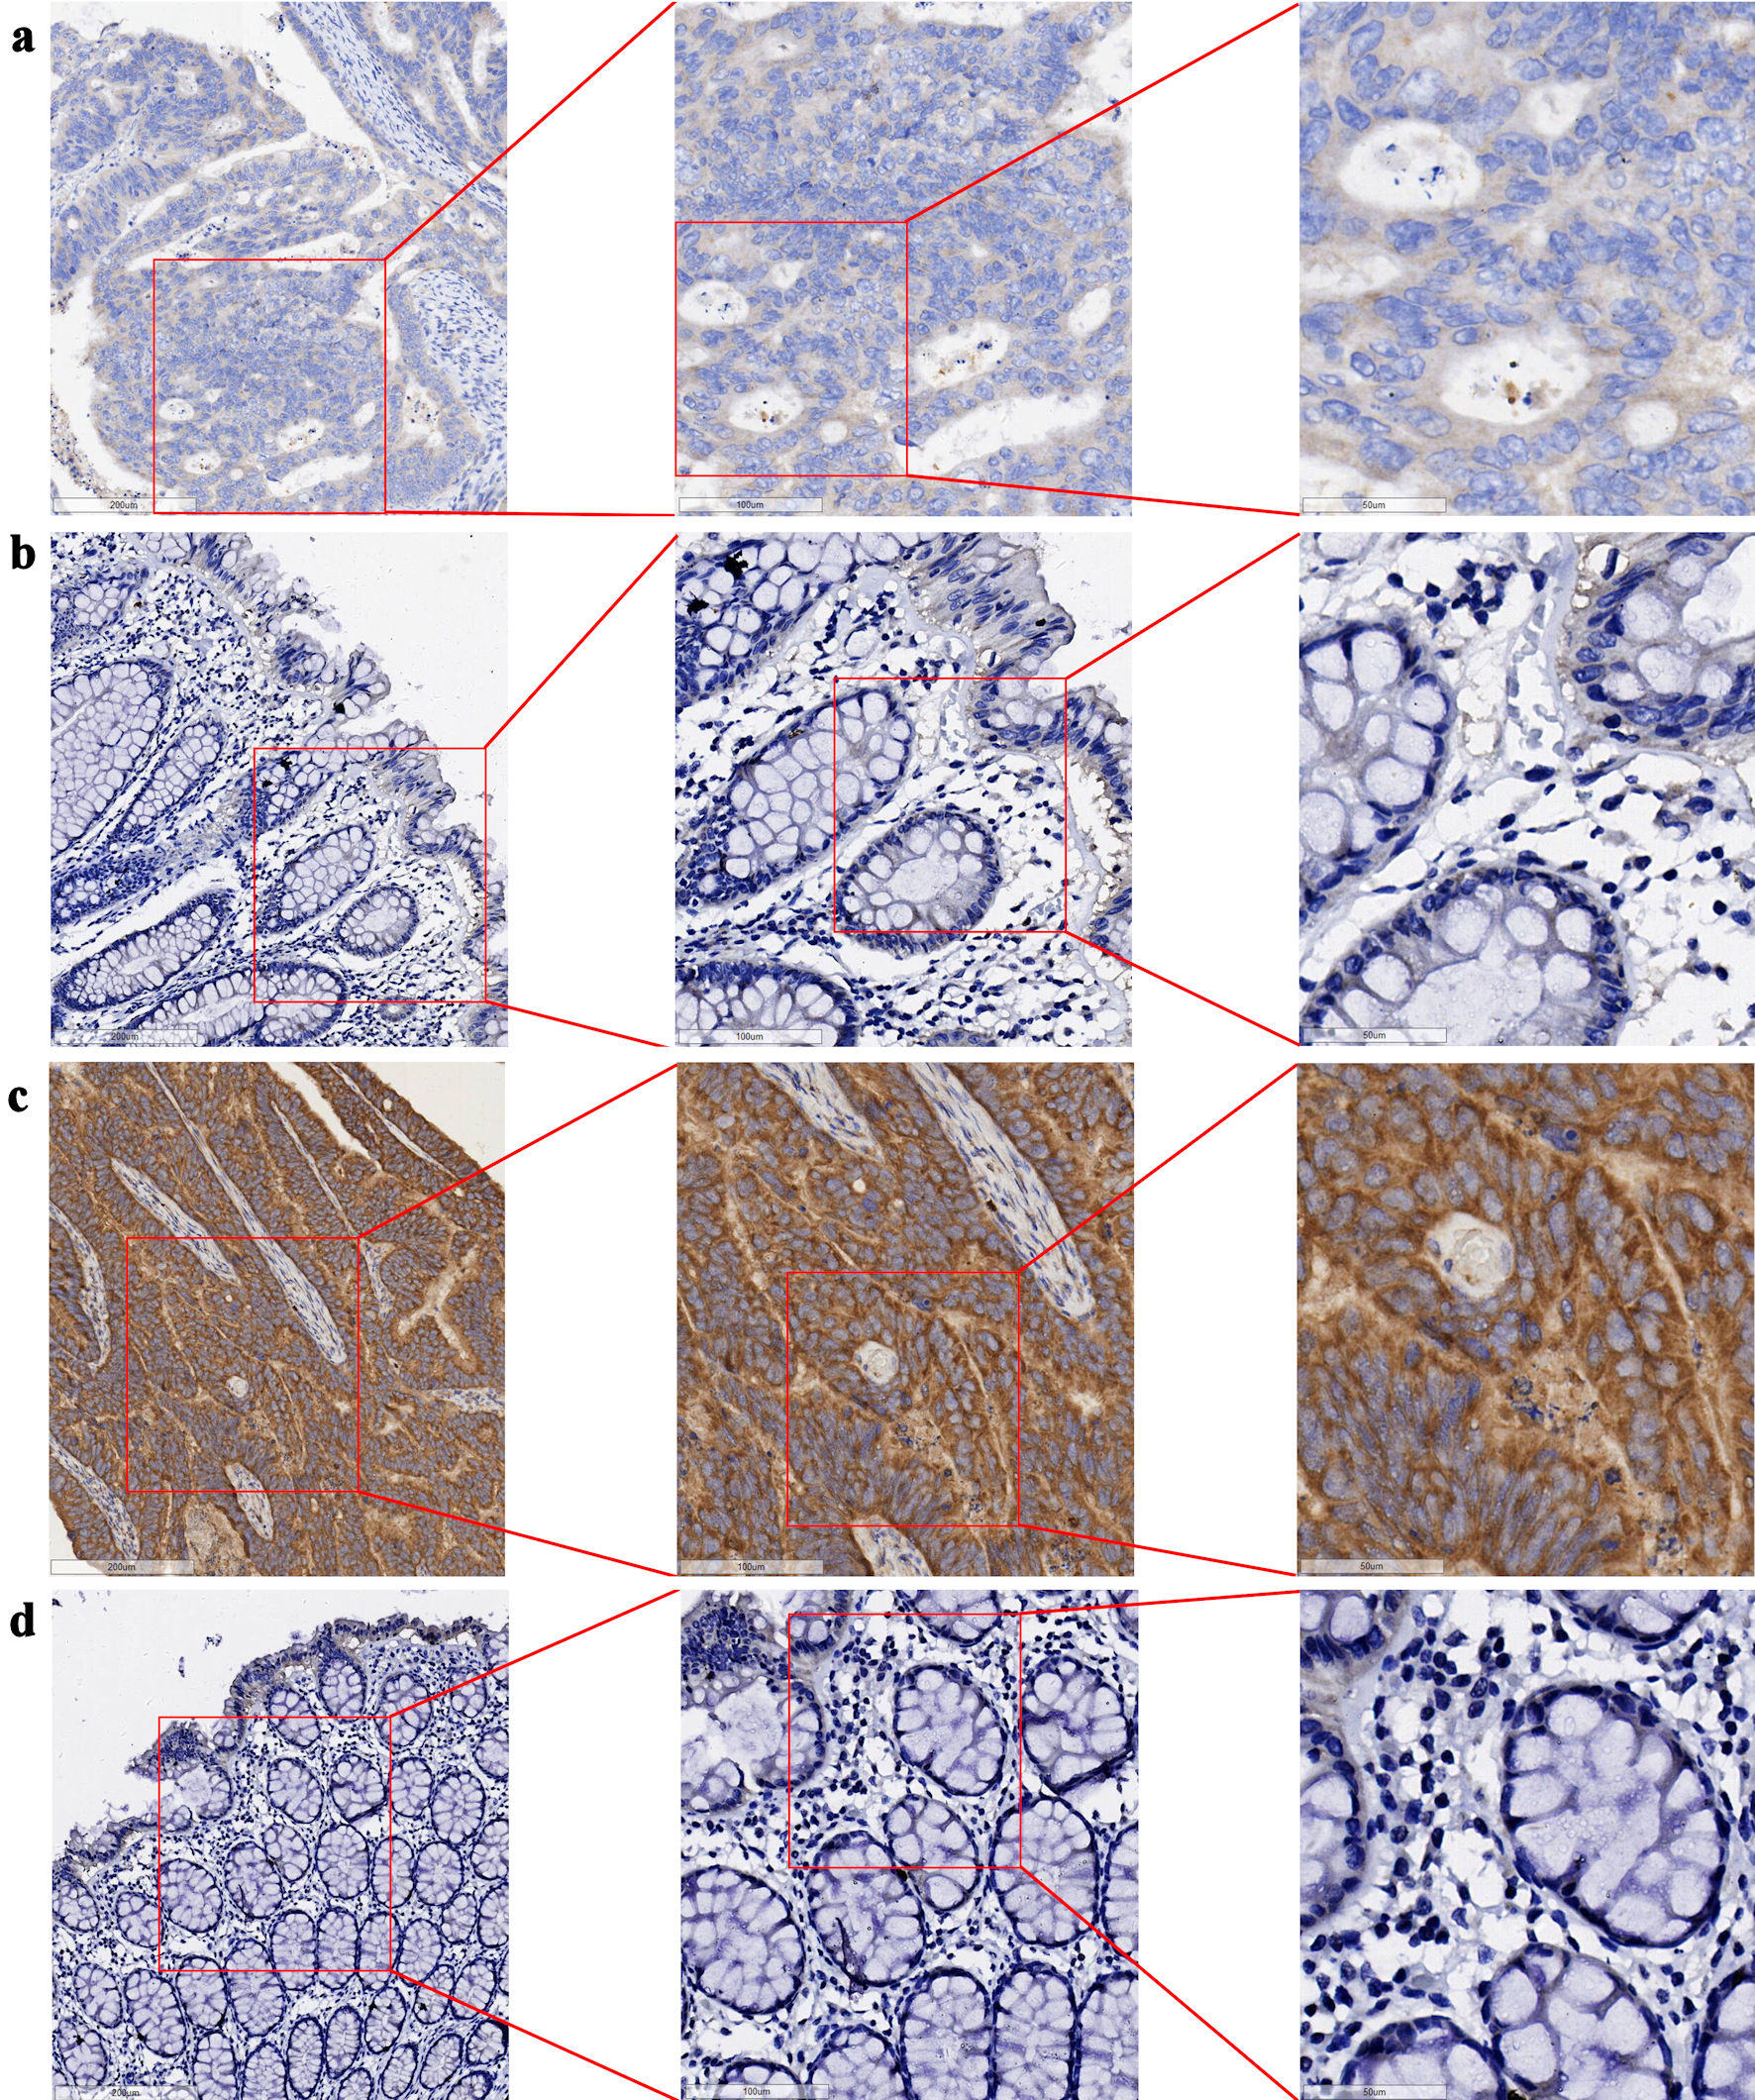
↓ Figure 2. Expression of GNA15 protein in CRC
tissues and their adjacent non-cancerous tissues (bar = 200 µm (left side of images), 100 µm
(middle column), 50 µm (right side)). (a) CRC tissue (sample 1); (b) adjacent non-cancerous tissue
(sample 1), with (a) and (b) derived from the same sample. (c) CRC tissue (sample 2); (d) adjacent
non-cancerous tissue (sample 2), with (c) and (d) derived from the same sample. GNA15: G protein subunit
α-15; CRC: colorectal cancer.
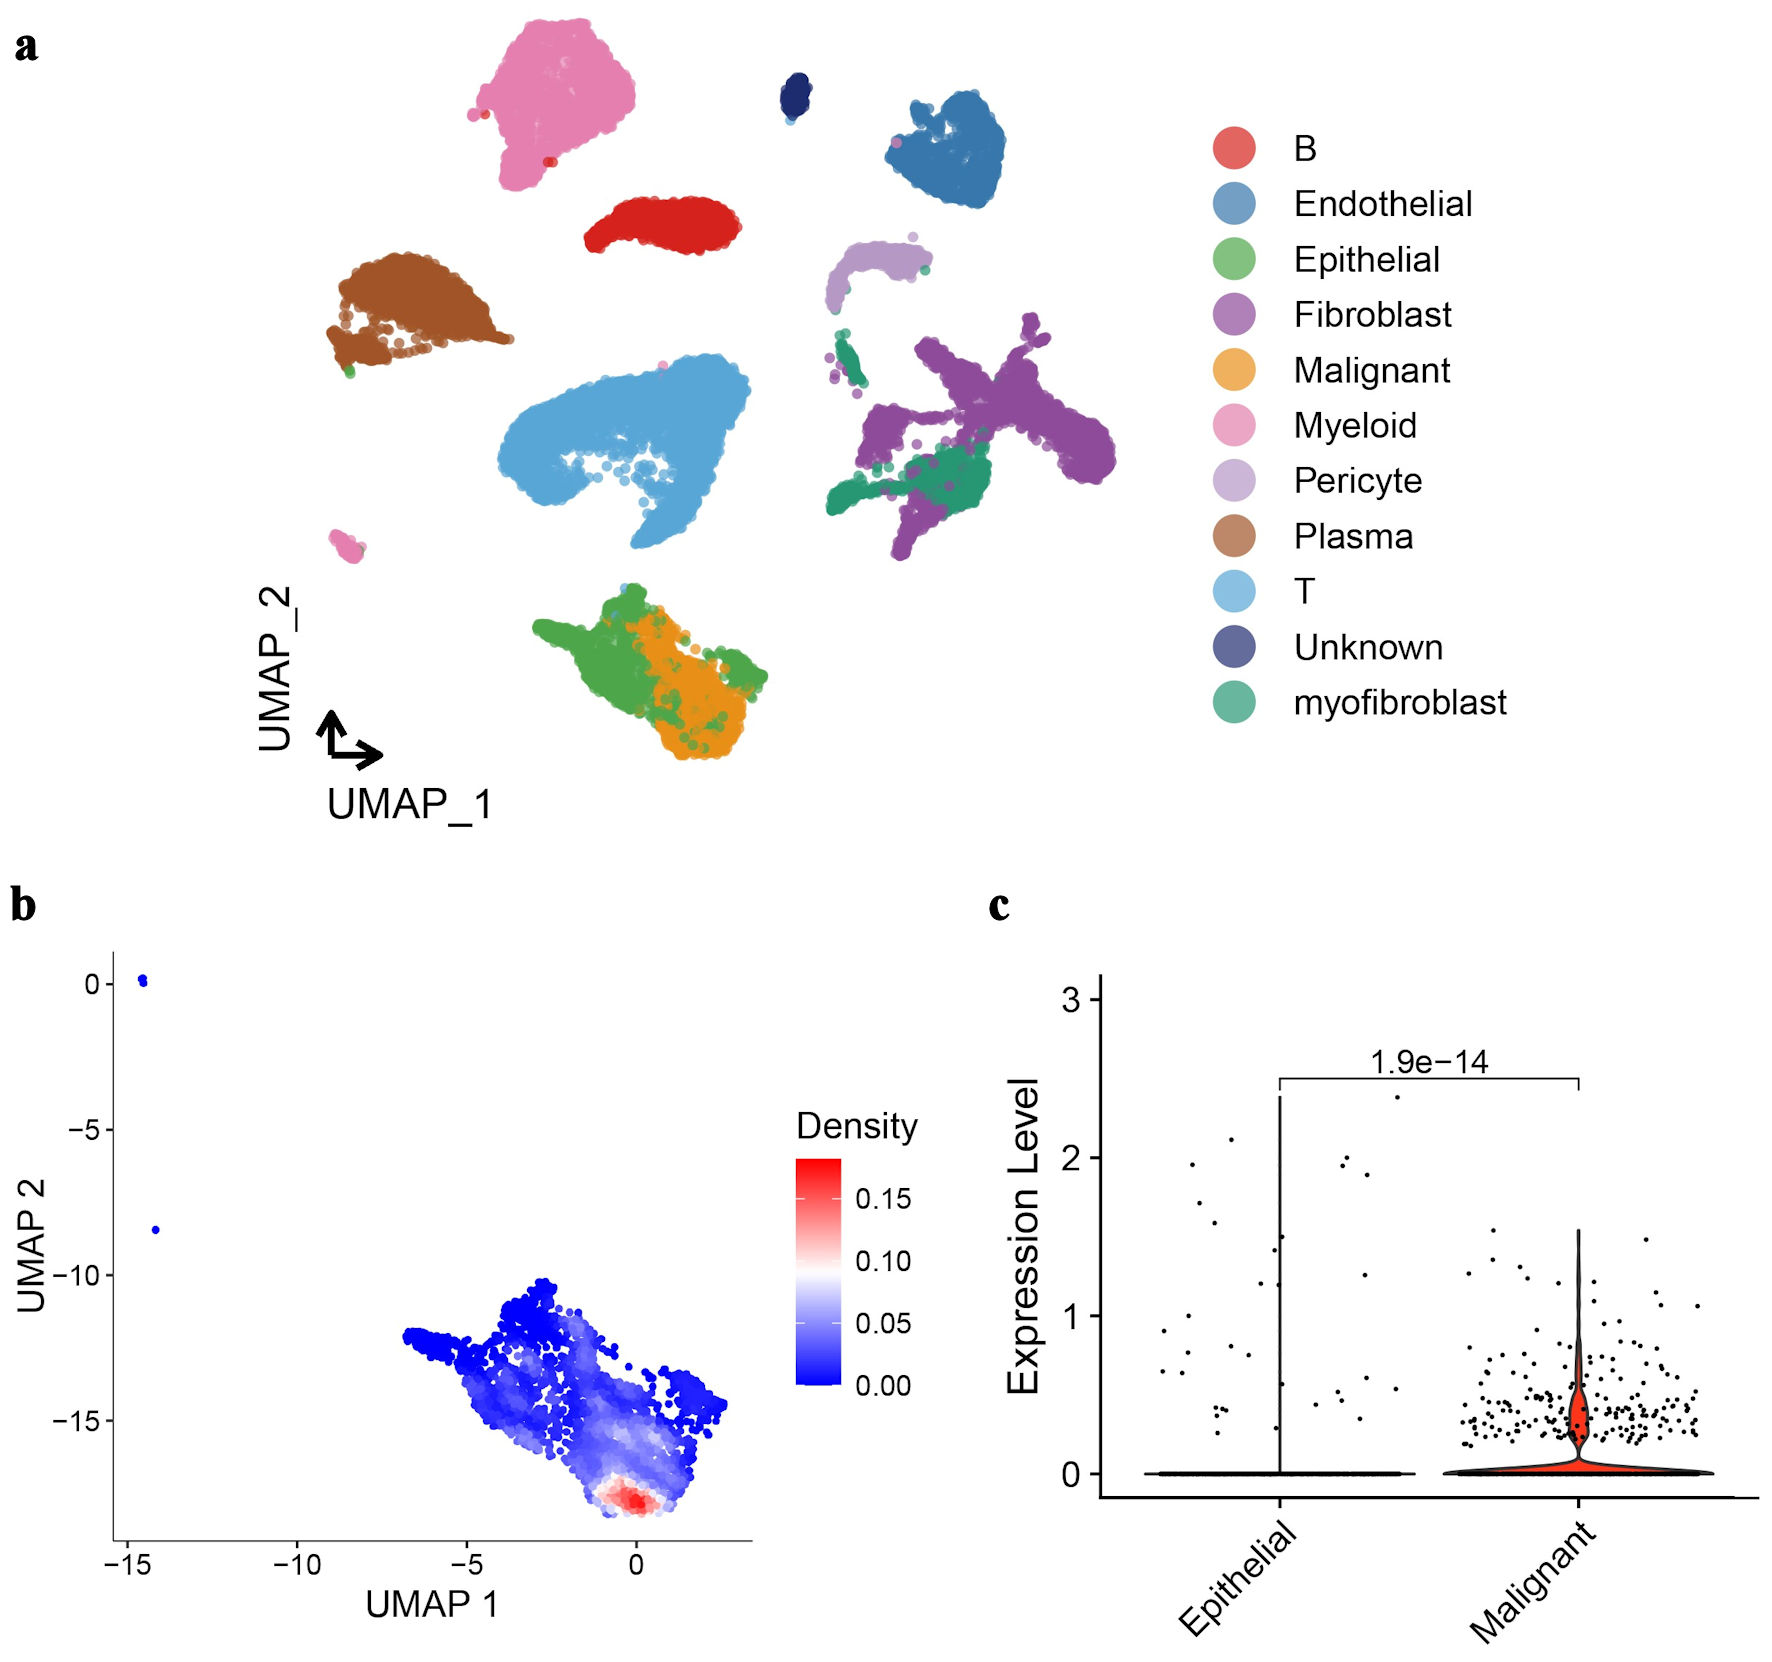
↓ Figure 3. UMAP analysis and GNA15 expression in
CRC tissue cells. (a) UMAP plot clusters CRC tissue cells into different types (each color represents a
cell type like epithelial, malignant, fibroblast, etc.). (b) UMAP plot with a density gradient (red =
high density, blue = low density) shows GNA15-expressing cell distribution. (c) Violin plot compares
GNA15 expression between epithelial and malignant cells, showing significantly higher expression in
malignant cells (P = 1.9 × 10⁻¹⁴). These panels demonstrate cell-type clustering in CRC
via UMAP and high GNA15 expression in malignant cells. UMAP: Uniform Manifold Approximation and
Projection; GNA15: G protein subunit α-15; CRC: colorectal cancer.
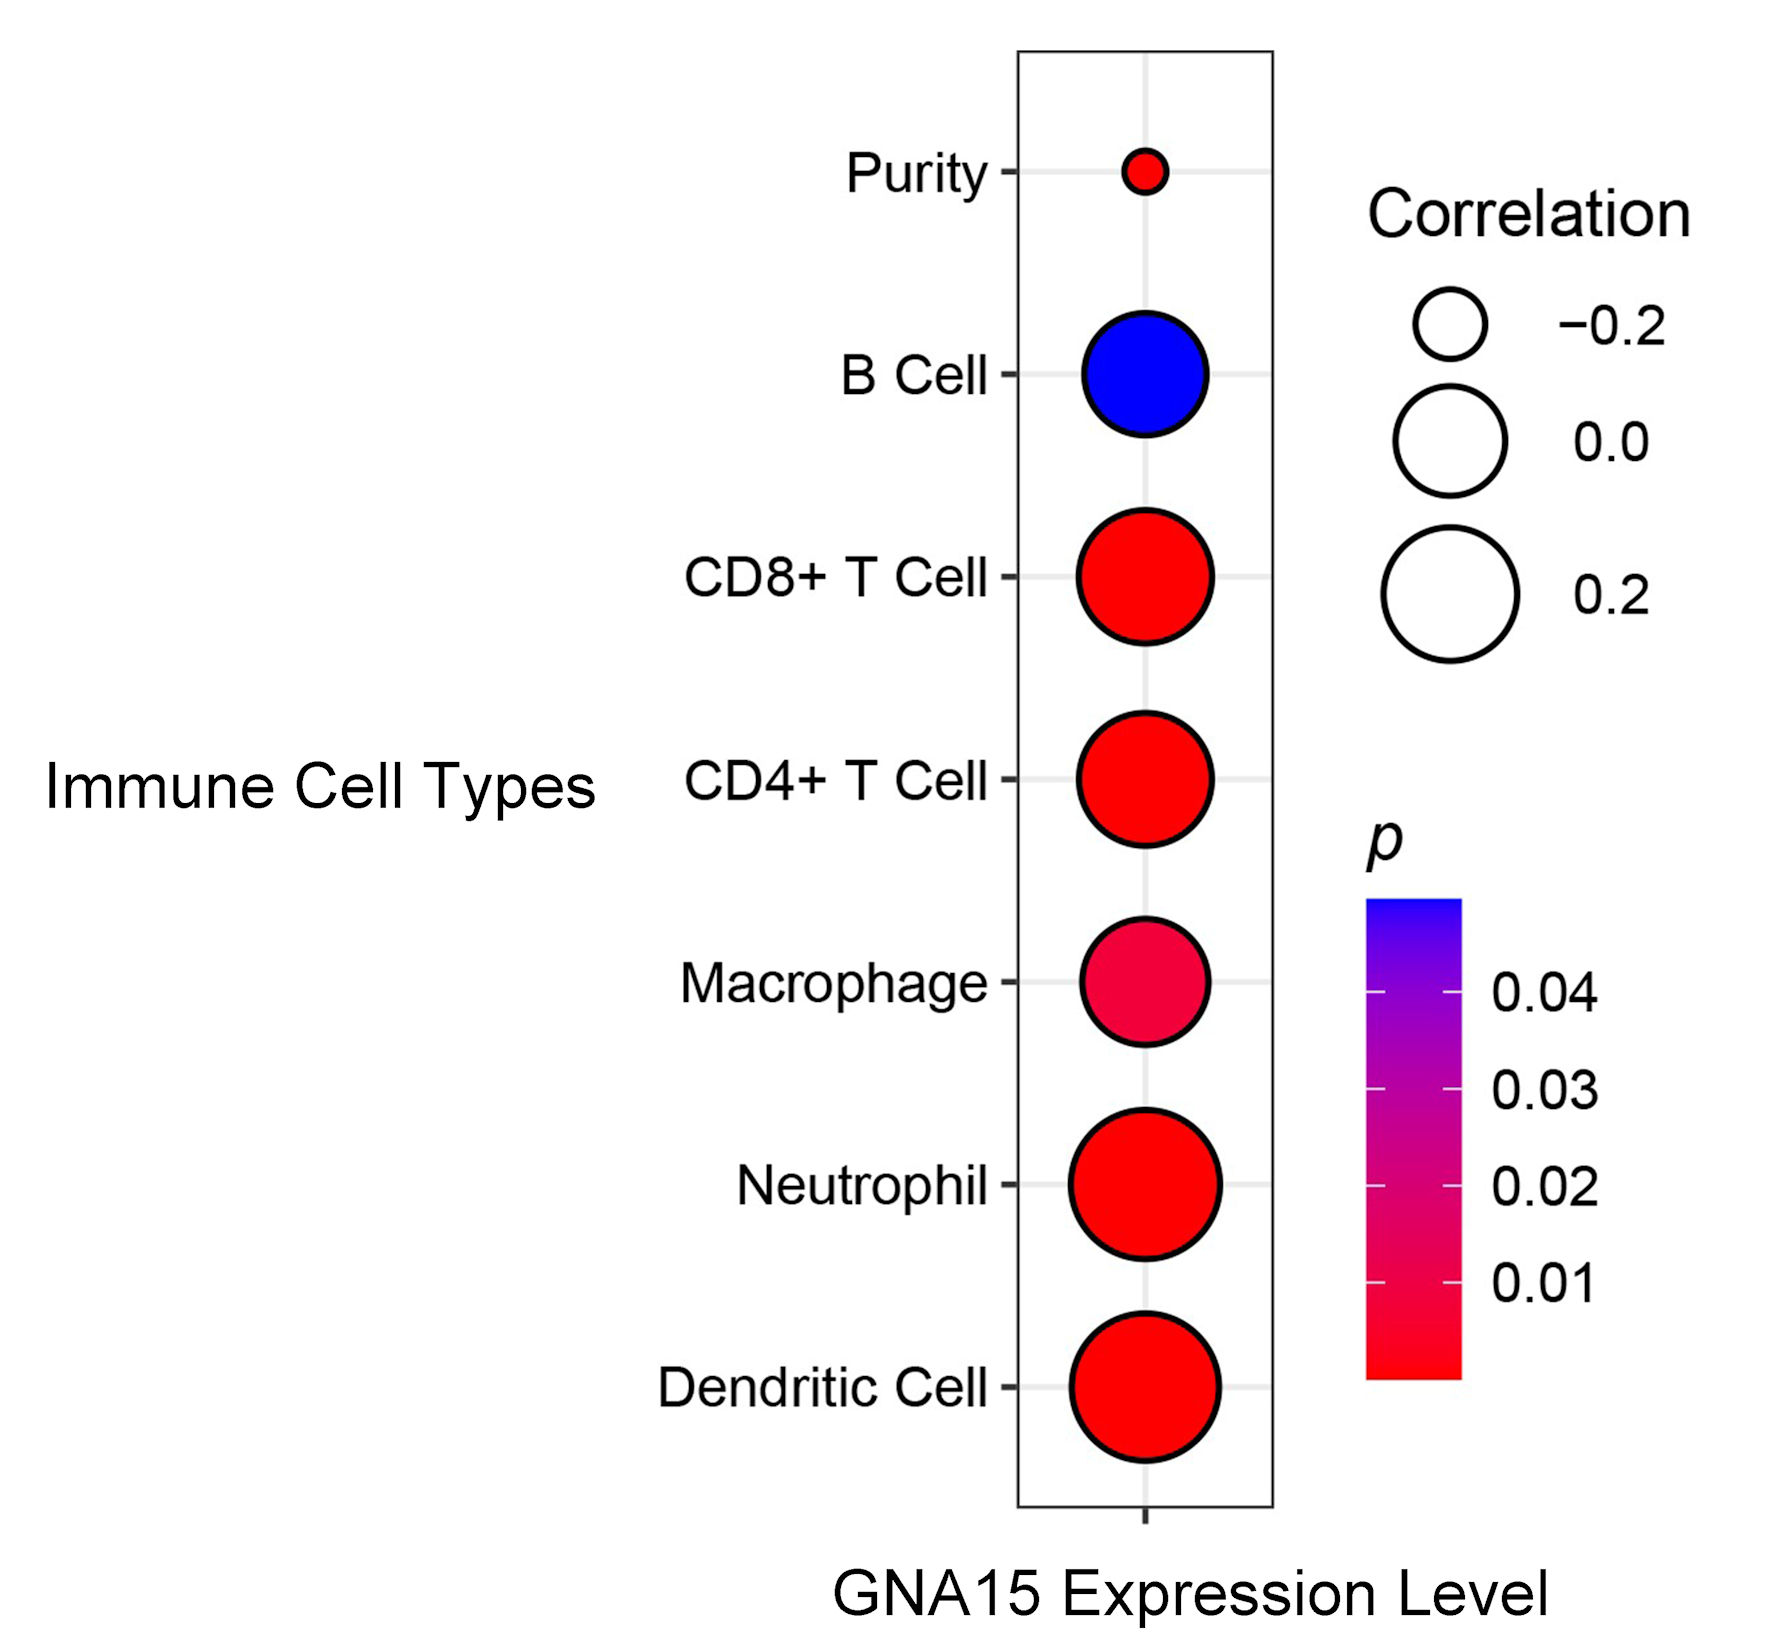
↓ Figure 4. Correlation between GNA15 expression
and immune cell types. Circle size indicates the correlation coefficient (larger circles indicate =
stronger positive correlation, legend values: 0.2, 0.0, -0.2). Circle color represents the P value
(redder = smaller P value, more significant; bluer = larger P value). Using the TIMER database,
correlations were evaluated for B cell, CD8+ T cell, CD4+ T cell, macrophage,
neutrophil, dendritic cell, and purity. TIMER: Tumor Immune Estimation Resource; GNA15: G protein
subunit α-15.
↓ Figure 5. Dot plot showing the gene effect
scores of different CRC cell lines (e.g., HCC56, DLD1, CL40, etc.) after GNA15 gene knockout via
CRISPR-Cas9 technology. The color gradient (from blue to red) and the size of the black dots both
represent the gene effect score: a more negative score (closer to -0.20, indicated by red and larger
dots) means that knocking out GNA15 has a stronger inhibitory effect on the growth of that cell line,
while a score near 0 (blue, small dots) means the cell line’s growth is barely affected.

↓ Figure 6. GSEA plots showing immune-related
pathway enrichment in CRC. RNA sequencing data and clinical information from TCGA were analyzed using
GSEA in R. (a) Enriched pathways include antigen binding, immunoglobulin complex, and phagocytosis
pathways. (b) Additional enriched pathways include antigen processing/presentation, cell adhesion
molecules, cytokine-cytokine receptor interaction, Th17 cell differentiation, and toll-like receptor
signaling pathways. The curves and plots indicate pathways with differentially expressed genes,
suggesting GNA15 may act through these immune-related pathways in CRC. GSEA: Gene Set Enrichment
Analysis; CRC: colorectal cancer; TCGA: The Cancer Genome Atlas.

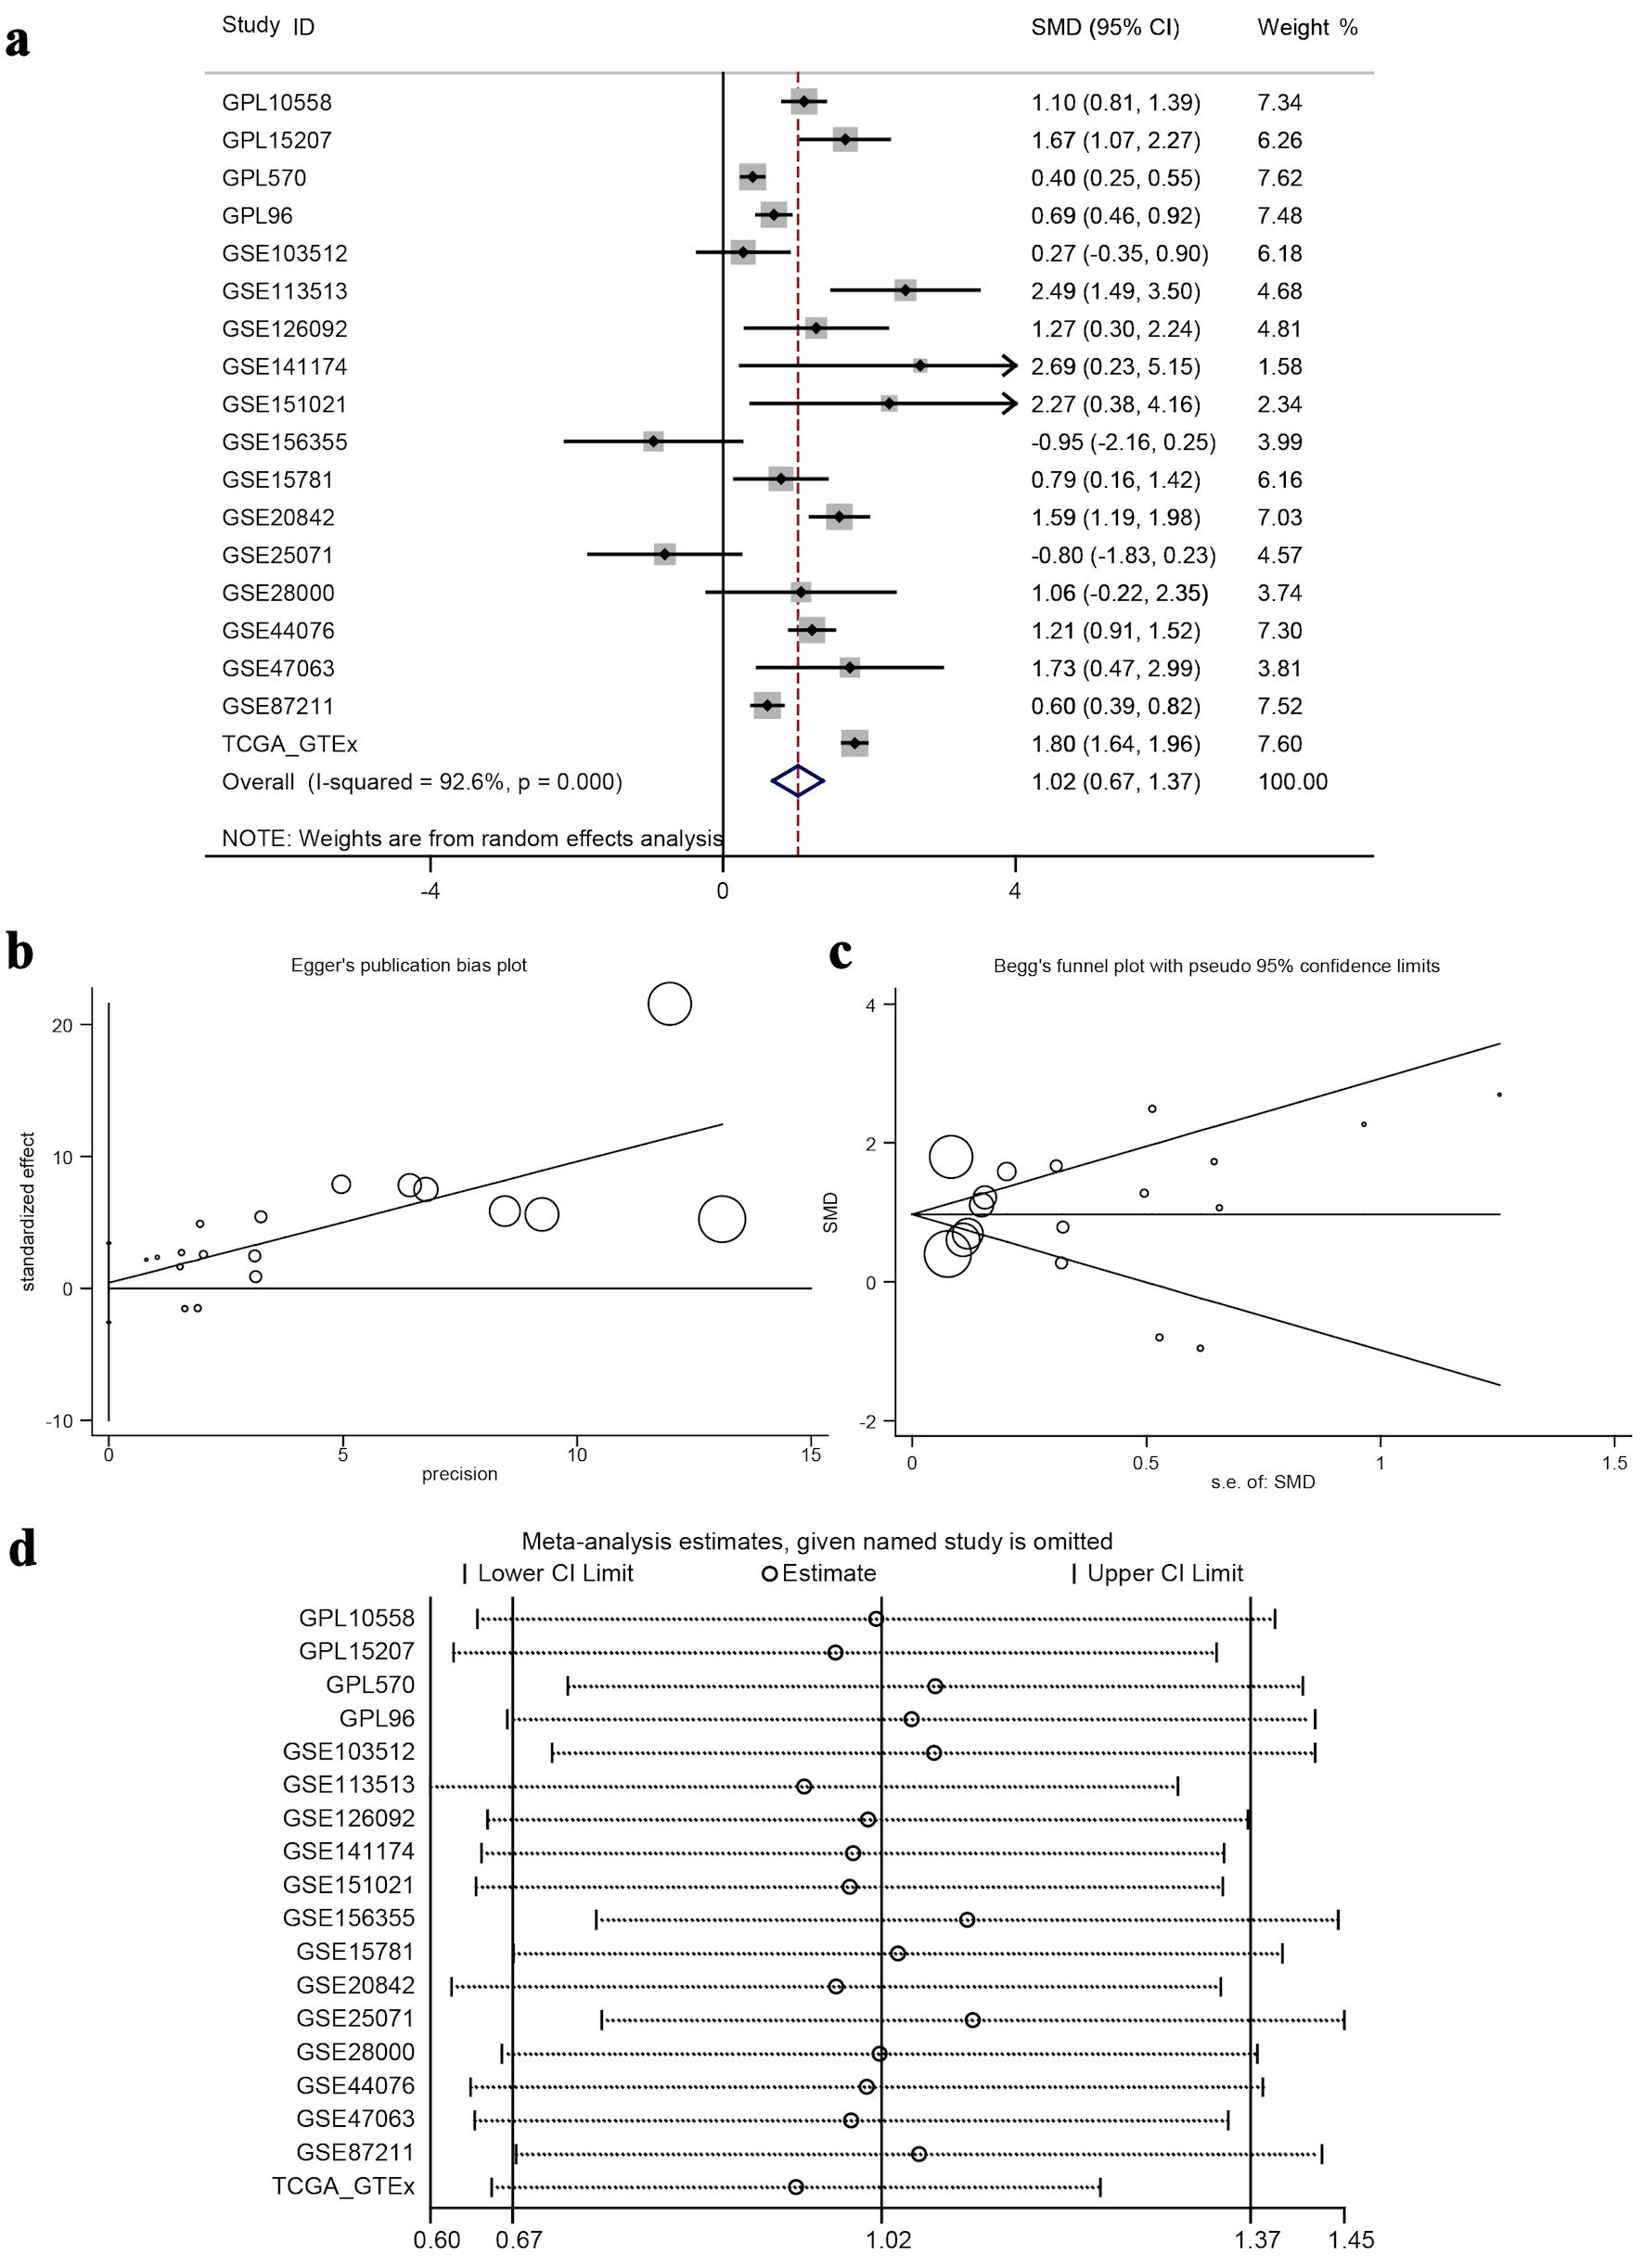
↓ Figure 7. Meta-analysis and bias/sensitivity
assessments. (a) A forest plot generated using inverse variance weighting is shown, where each study ID
denotes a different dataset, and the diamond reflects the overall effect size with 95% CI, showing
significant heterogeneity (I2 = 92.6%). (b) Egger’s publication bias plot, checking
for the relationship between study precision and effect size to identify publication bias. (c)
Begg’s funnel plot with pseudo 95% confidence limits, where symmetric distribution of study
points around the mean effect suggests no significant publication bias. (d) A sensitivity analysis plot,
displaying meta-analysis estimates when each study is excluded to test the robustness of the overall
result. ID: identifier; GSE: Gene Set Enrichment; CRC: colorectal cancer; TCGA: The Cancer Genome Atlas;
CI: confidence interval; SMD: standardized mean difference.
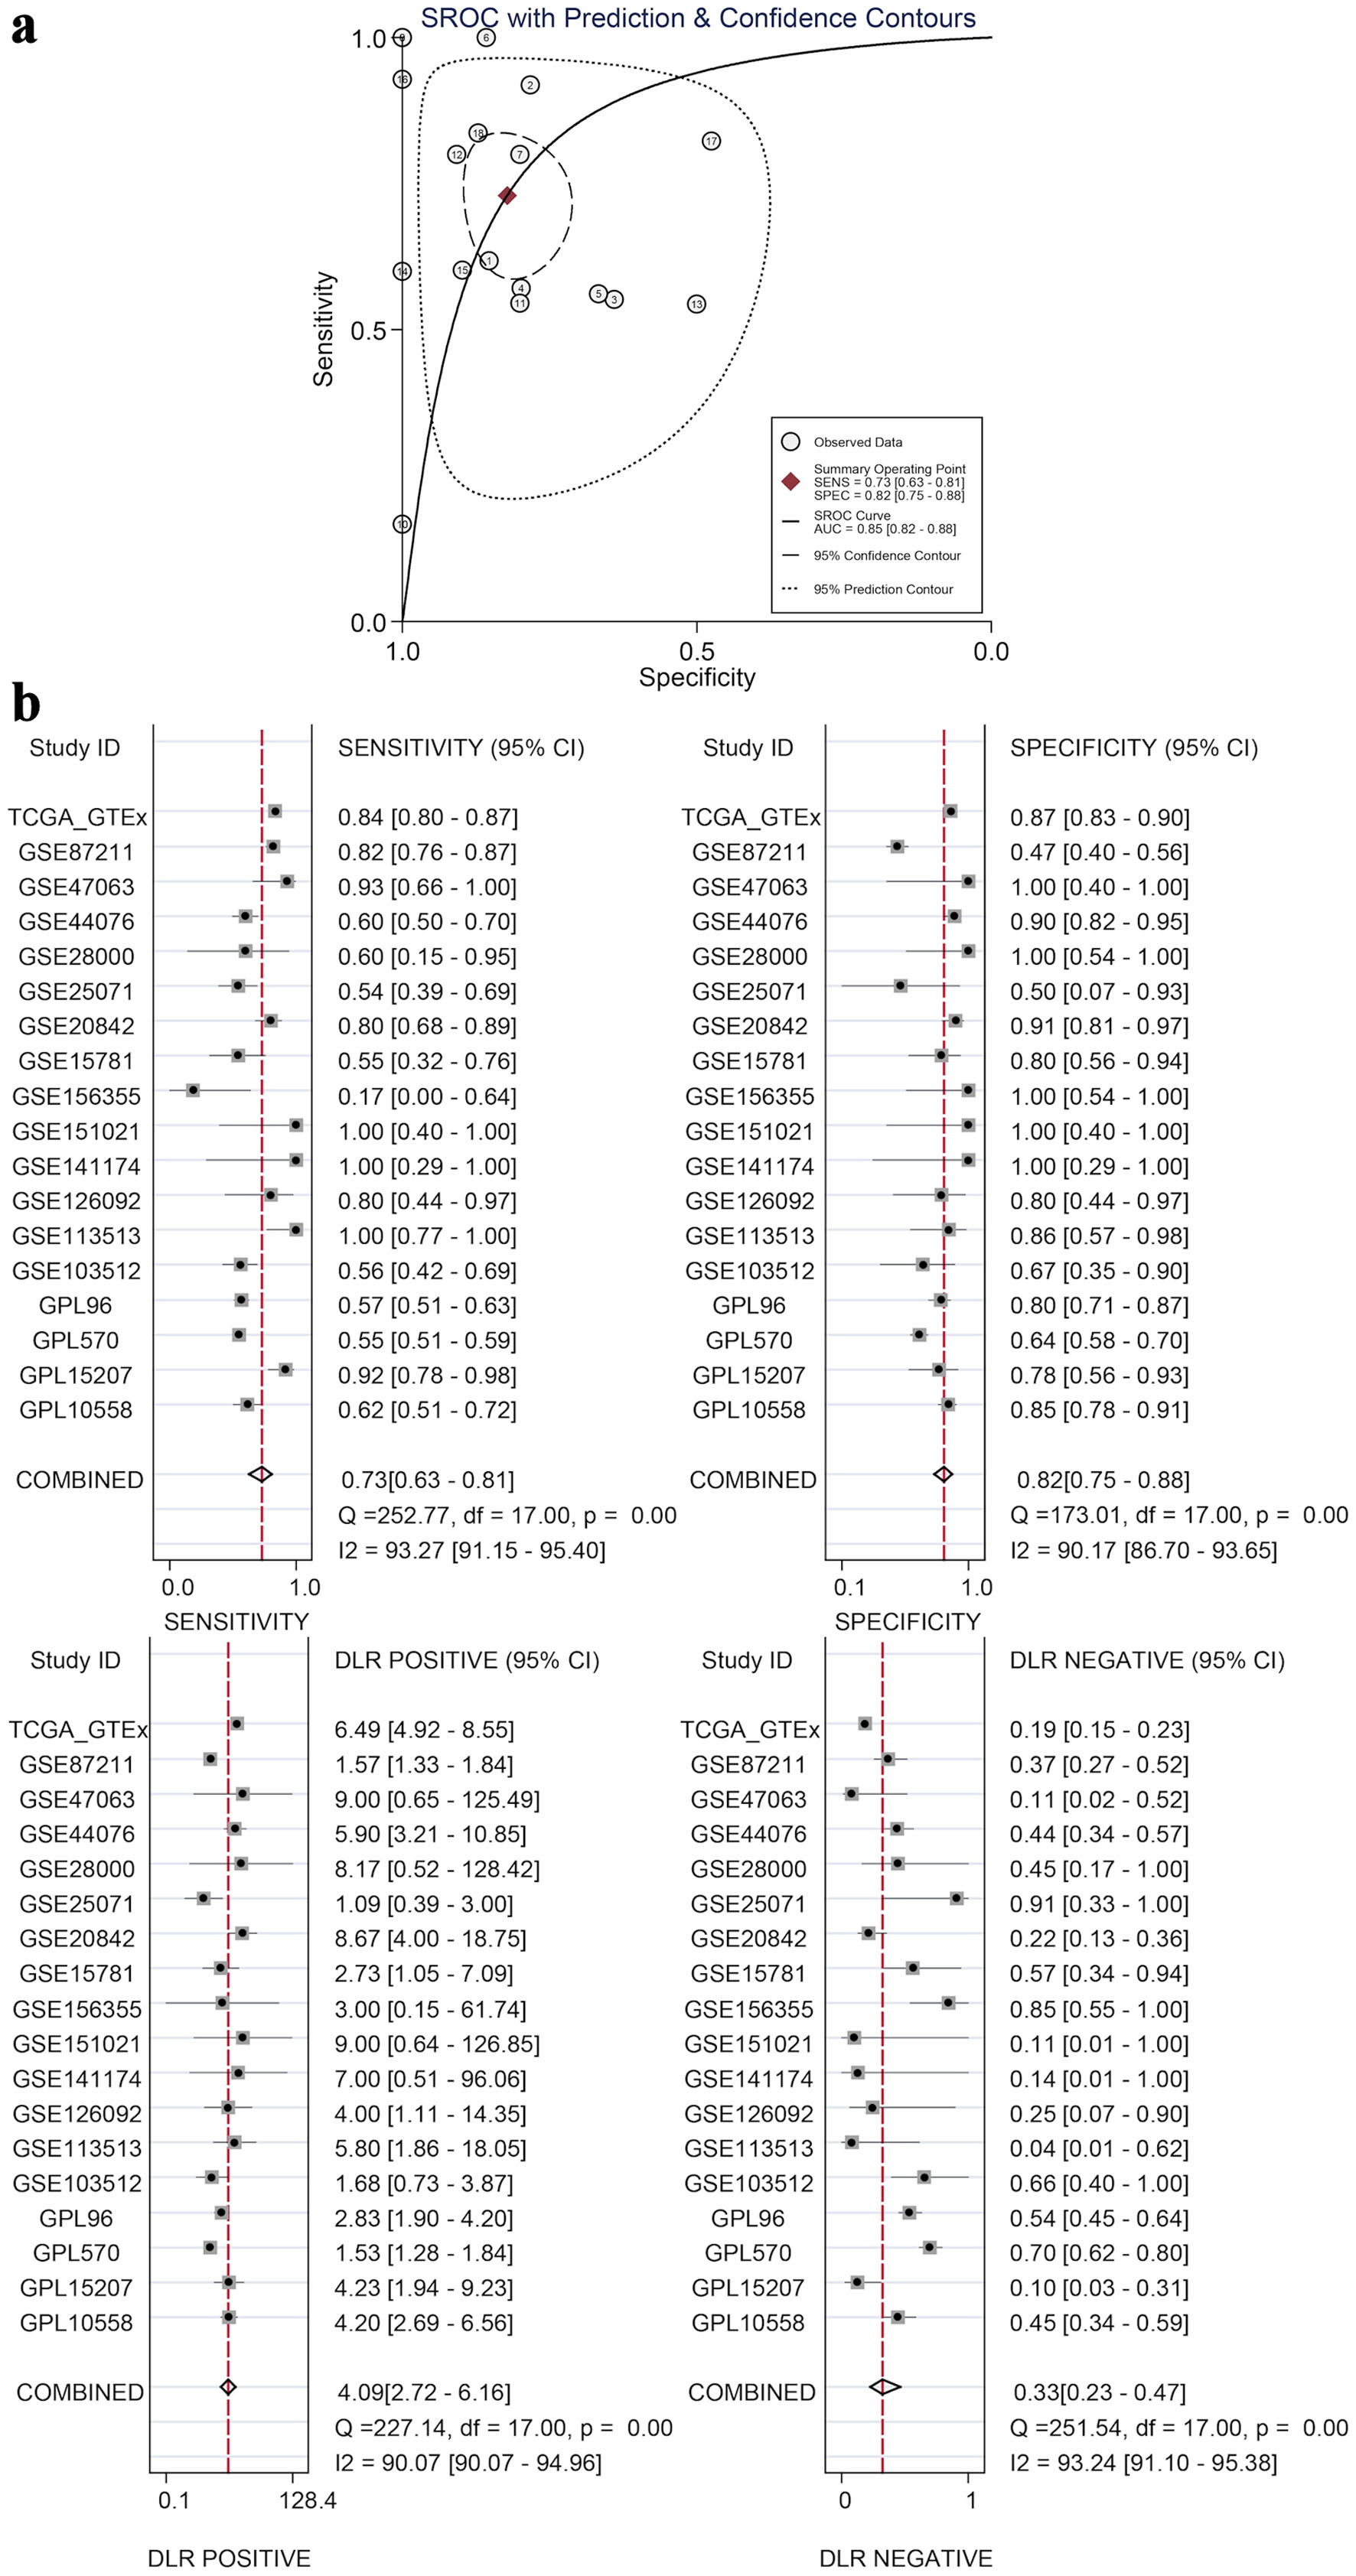
↓ Figure 8. Diagnostic value by SROC and subgroup
analyses. (a) An SROC curve with prediction and confidence contours, where circles are observed data,
the red diamond is the summary operating point, and the AUC (0.85) indicates GNA15’s ability to
distinguish cancerous and non-cancerous tissues. (b) Four subplots (sensitivity, specificity, DLR
positive, and DLR negative), each with 95% CI for individual datasets and combined results,
demonstrating GNA15’s high diagnostic value for CRC. SROC: summary ROC; ROC: receiver operating
characteristic; DLR: diagnostic likelihood ratio; GSE: Gene Set Enrichment; CRC: colorectal cancer;
TCGA: The Cancer Genome Atlas; CI: confidence interval; AUC: area under the curve.
Table
↓ Table 1. DepMap CRISPR-Cas9 Knockout Gene Effect Scores
| Cell
line name |
DepMap ID |
Gene
effect score |
| ID: identifier. |
| HCC56 |
ACH-000467 |
-0.24839 |
| DLD1 |
ACH-001061 |
-0.22831 |
| CL40 |
ACH-000798 |
-0.19379 |
| JVE127 |
ACH-002659 |
-0.19327 |
| SNU1033 |
ACH-000286 |
-0.19194 |
| COLO678 |
ACH-000350 |
-0.18189 |
| SNUC1 |
ACH-000722 |
-0.17757 |
| CCK81 |
ACH-000963 |
-0.15942 |
| KP363T |
ACH-002669 |
-0.15636 |
| RKO |
ACH-000943 |
-0.14606 |
| T84 |
ACH-000381 |
-0.14006 |
| NCIH747 |
ACH-000403 |
-0.13433 |
| C2BBE1 |
ACH-000009 |
-0.13306 |
| JVE015 |
ACH-002654 |
-0.11808 |
| SNU503 |
ACH-000683 |
-0.11213 |
| LS411N |
ACH-000985 |
-0.1076 |
| SW1116 |
ACH-000489 |
-0.08493 |
| SW626 |
ACH-001399 |
-0.08292 |
| LOVO |
ACH-000950 |
-0.07995 |
| SW837 |
ACH-000421 |
-0.07115 |
| TT1TKB |
ACH-002025 |
-0.06795 |
| SW620 |
ACH-000651 |
-0.0569 |
| NCIH716 |
ACH-000491 |
-0.04153 |
| HCC2998 |
ACH-001081 |
-0.04031 |
| COLO201 |
ACH-000253 |
-0.03847 |
| KM12 |
ACH-000969 |
-0.03499 |
| LS180 |
ACH-000957 |
-0.0335 |
| HT115 |
ACH-000986 |
-0.02879 |
| SNU61 |
ACH-000532 |
-0.02814 |
| LS513 |
ACH-000007 |
-0.02252 |
| JVE253 |
ACH-002664 |
-0.00896 |
| MDST8 |
ACH-000935 |
-0.00034 |