| World Journal of Oncology, ISSN 1920-4531 print, 1920-454X online, Open Access |
| Article copyright, the authors; Journal compilation copyright, World J Oncol and Elmer Press Inc |
| Journal website https://wjon.elmerpub.com |
Original Article
Volume 000, Number 000, October 2025, pages 000-000

A Tertiary Lymphoid Structure-Related Gene Signature Predicts Prognosis and Treatment Response in Hepatocellular Carcinoma
Xiang Yin Konga, Xiao Hao Lia, Xing Long Qiua, Ming Yu Maa, Jin Hao Liua, Zi Chun Wanga, Zi Hui Menga, c, Shang Wei Jib, c
aDepartment of Hepatic Biliary Pancreatic Surgery, China-Japan Union Hospital of Jilin University, Changchun, Jilin, China
bDepartment of Infectious Diseases, China-Japan Union Hospital of Jilin University, Changchun, Jilin, China
cCorresponding Author: Zi Hui Meng, Department of Hepatic Biliary Pancreatic Surgery, China-Japan Union Hospital of Jilin University, Changchun, Jilin Province 130000, China; Shang Wei Ji, Department of Infectious Diseases, China-Japan Union Hospital of Jilin University, Changchun, Jilin Province 130000, China
Manuscript submitted July 30, 2025, accepted September 17, 2025, published online October 10, 2025
Short title: TLS Signature, Prognosis, and Therapy in HCC
doi: https://doi.org/10.14740/wjon2646
| Abstract | ▴Top |
Background: Hepatocellular carcinoma (HCC) carries a poor prognosis with limited treatment options. Tertiary lymphoid structures (TLS) impact tumor immunity, but their role in HCC requires clarification. This study aimed to develop and validate a TLS-related gene signature for predicting survival and therapeutic response in HCC, and to explore its mechanisms.
Methods: We analyzed transcriptomic data from public databases (The Cancer Genome Atlas (TCGA) and Gene Expression Omnibus (GEO)) using LASSO-Cox regression to identify a six-gene TLS signature (CCL20, CD200, PLAC8, DNASE1L3, C7, and SKAP1). We validated this TLS score across multiple independent HCC cohorts, including patients receiving transarterial chemoembolization (TACE), programmed cell death protein-1 (PD-1)/ligand 1 (PD-L1) inhibitors, or lenvatinib. Through single-cell RNA sequencing (scRNA-seq), we characterized immune microenvironment differences between score groups.
Results: The TLS score effectively stratified patients’ survival outcomes across all validation cohorts. Low TLS scores significantly correlated with improved overall survival, enhanced therapeutic response (especially to immune checkpoint inhibitors (ICIs)), and lower immune evasion potential. Mechanistically, scRNA-seq revealed distinct immune microenvironments: low-score tumors were enriched in cytotoxic and exhausted CD8+ T cells (Tex), favorable for immunotherapy, showing beneficial immune remodeling post-treatment (decreased Tex, increased effector memory T cells). High-score tumors featured dense regulatory T-cell (Treg) infiltration, contributing to immunosuppression.
Conclusion: Our findings suggest a potential TLS-based biomarker for HCC prognosis and therapeutic response. This work offers preliminary insights into tumor immune microenvironment (TIME) heterogeneity, which may be modulated by the Treg/Tex balance, and proposes a possible tool for improving patient stratification.
Keywords: Single-cell sequencing; Tertiary lymphoid structures; Hepatocellular carcinoma; Tumor immune microenvironment; Bioinformatics analysis
| Introduction | ▴Top |
The 5-year survival rate for hepatocellular carcinoma (HCC) is only about 18%, making it one of the main causes of cancer-related death globally and posing a substantial and expanding health burden [1]. The progression of HCC in China is mostly linked to chronic liver illnesses, chiefly attributed to hepatitis B virus infection, but hepatitis C virus infection and alcohol-related liver damage also play significant roles [2]. These chronic liver conditions provide a fertile ground for HCC initiation and progression.
HCC management is stage-bound: CNLC 0-Ia tumors can be cured surgically with 60-70% 5-year survival, but > 60% of patients already present at CNLC IIb-IIIb and need multimodal therapy [3], where treatment options include locoregional therapies like transarterial chemoembolization (TACE) for intermediate-stage disease, as well as palliative options such as molecular targeted therapies and immune checkpoint inhibitors (ICIs) for advanced stages [4]. Critically, the underlying chronic hepatic inflammation profoundly reshapes the tumor microenvironment (TME), leading to immune dysregulation. This altered immune landscape not only compromises the efficacy and durability of current therapies - including ICI - but also contributes to therapy resistance and accelerated disease progression [5].
Therefore, there is a pressing necessity to enhance comprehension of the intricate immunological microenvironment of HCC and to identify robust biomarkers capable of accurately predicting prognosis and therapeutic response. Such advances would facilitate informed clinical decision-making and support the development of more effective immunotherapeutic strategies.
Tertiary lymphoid structures (TLS) within the TME are ectopically formed, structured clusters of immune cells. TLS, which structurally and functionally mimic secondary lymphoid organs, are generally produced by persistent inflammation or other localized stimuli and are essential for beginning and maintaining efficient local anti-tumor immune responses [6]. A canonical TLS comprises distinct T- and B-cell zones, with high endothelial venules facilitating the recruitment of lymphocytes. Within the T-cell area, one finds plentiful CD4+ T follicular helper cells, Th1 cells, CD8+ cytotoxic T cells, plus regulatory T cells (Tregs). Meanwhile, the B-cell section possesses germinal center-like structures together with macrophages and plasma cells. In addition, specific stromal cell networks provide structural scaffolding and anchor TLS within inflamed tissues [7, 8].
Although TLS - assessed by immunohistochemistry and characterized by their presence, location, density, and maturity - have been widely associated with favorable clinical outcomes across multiple solid tumors, their prognostic significance in HCC remains controversial [9]. This inconsistency may stem from the inherent heterogeneity of TLS, the molecular complexity of HCC, and variability across study cohorts. Therefore, an in-depth characterization of TLS features within the immune microenvironment of HCC, along with clarification of their clinical relevance, is essential for advancing our understanding of tumor immune regulation and optimizing therapeutic strategies.
Given the suggested role of TLS in tumor immunity and the currently inconclusive evidence regarding their prognostic significance in HCC, this study aimed to develop and evaluate a TLS gene-based prognostic model. The goal was to explore a method for more precise risk stratification of HCC patients and to investigate the model’s potential in predicting therapeutic response.
We employed comprehensive bioinformatics approaches to integrate multi-source transcriptomic data for model construction, followed by rigorous internal and external validation. Importantly, we examined the link between the TLS-based model and TME features such as immune cell infiltration and pathway activation. We examined immune cell subpopulation composition and function across risk categories using single-cell RNA sequencing (scRNA-seq) data. It is important to note that this study utilizes bulk transcriptomic data, thus the identified signature reflects TLS-related gene expression within the broader tumor microenvironment, rather than gene expression derived directly from isolated TLS.
By integrating single-cell resolution data, we aim to further the understanding of potential TLS-mediated immune modulation and its possible implications for therapeutic decision-making, which may contribute to the future development of precision medicine in HCC. This study not only proposes a potentially useful TLS-associated prognostic tool but also offers new hypotheses regarding the cellular and molecular mechanisms by which TLS might regulate the immune landscape in HCC.
| Materials and Methods | ▴Top |
Gene expression datasets
Transcriptomic data for the training set were obtained from The Cancer Genome Atlas Liver Hepatocellular Carcinoma (TCGA-LIHC) cohort. To identify differentially expressed genes (DEGs) between HCC and normal tissues, we processed the raw gene counts (htseq_counts) using three parallel pipelines to ensure robustness: 1) DESeq2, which employs median of ratios normalization; 2) edgeR, which uses trimmed mean of M-values (TMM) normalization; and 3) limma-voom, which applies TMM followed by quantile normalization. The intersection of DEGs identified by all three methods was selected for downstream analysis. For independent external validation, five Gene Expression Omnibus (GEO) datasets were utilized: GSE14520, GSE202069, GSE104580, GSE279750, and GSE235863. For these cohorts, we used the pre-processed and normalized expression matrices as provided by the original authors, with no further normalization applied on our part. The scRNA-seq data, also sourced from the GSE235863 dataset, were processed using the Scanpy library in Python. The pipeline included quality control, library size normalization, log-transformation, and batch correction across patients using the Harmony algorithm. All data used in this study were obtained from publicly available databases such as TCGA and GEO, therefore no ethics approval was required.
Identification of candidate TLS-related genes
In this study, DEGs were first identified using three R packages: “Limma”, “DESeq2”, and “EdgeR”. The selection criteria were P < 0.05 (false discovery rate (FDR)) and |log2 fold change (FC)| > 1.2 [10]. Only the DEGs commonly identified by all three methods were retained to ensure robustness. To specifically focus on TLS, the resulting DEG list was intersected with a set of 45 TLS-related genes previously reported in the literature [11, 12]. This yielded a total of 12 candidate genes for subsequent in-depth analysis.
TLS-related gene enrichment
The R “clusterProfiler” package was used to perform Gene Ontology (GO) and Kyoto Encyclopedia of Genes and Genomes (KEGG) functional enrichment analysis on the 45 TLS-related DEGs. After stratifying HCC samples into high and low TLS scores using the TLS scoring algorithm, differential gene expression analysis was performed between the two groups. The resulting DEGs were ranked and subjected to Gene Set Enrichment Analysis (GSEA) to explore differences in biological processes and signaling pathways between the groups [13]. Gene sets for GSEA were sourced from the Hallmark (H) collection, with statistical significance established at P < 0.05.
Building the prognostic model from candidate TLS genes
To investigate the prognostic relevance of TLS-related genes in hepatocellular carcinoma (LIHC), we conducted analyses based on normalized mRNA expression data. We selected six of the 12 candidate TLS-related genes with the best predictive potential using Lasso-Cox regression analysis. Each patient’s integrated TLS score was computed by integrating the expression levels (y) of these six genes with their regression coefficients (x) using the formula: TLS score = ∑inxiyi [10]. Patients were divided by median TLS score into high- and low-scoring groups. This approach is widely adopted for its robustness and ability to avoid overfitting that can arise from searching for an optimal cut-off in retrospective datasets [12]. TLS score and prognosis were examined by comparing the two groups’ overall survival (OS). To further assess the combined prognostic impact of the six model genes, we constructed a multivariate Cox regression model incorporating all six genes. Finally, we evaluated the model’s performance in discriminating survival risk using time-dependent receiver operating characteristic (ROC) curve analysis and the concordance index (C-index).
Prognostic model validation
We used the GSE14520 dataset to validate the prognostic model before assessing its efficacy. The model was then applied to four additional independent datasets - GSE202069, GSE104580, GSE279750, and GSE235863 - to further assess the ability of the TLS score to predict survival outcomes and treatment responses in HCC patients.
For each dataset, samples were stratified into high and low TLS score subgroups based on the median TLS score. Kaplan-Meier curves were utilized to assess the TLS score’s predictive significance for OS in GSE14520 and GSE202069. Model predictive accuracy was quantified by plotting ROC curves and calculating the area under the curve (AUC). For datasets that included treatment response information (GSE104580, GSE279750, and GSE235863), response rates were examined between high and low TLS scores. ROC curve analysis and corresponding AUC values were used to assess the predictive performance of the TLS score for therapeutic efficacy. To further explore potential underlying mechanisms, we used the R packages “progeny” and “TCellSI” [14] to analyze changes in signaling pathway activity and T-cell infiltration characteristics under different treatment contexts. Finally, we predicted immunotherapy response across TLS-defined subgroups using tumor immune dysfunction and exclusion (TIDE) [15].
Development of nomogram and calibration curves
The “rms” package in R was used to create a nomogram for clinical use of the TLS score. This nomogram integrated the calculated TLS score with age, sex, and tumor stage (stage and TNM classification) to give doctors a more complete and individualized predictive tool. To validate the model’s prediction accuracy and clinical value, we generated calibration curves to assess the projected survival probability at 1, 3, and 5 years to observed survival outcomes.
Mutation and drug sensitivity analysis
Our initial step was to examine the mutation profiles of TCGA-LIHC HCC patients with high and low TLS scores. We created waterfall plots using R’s “maftools” package to show mutational landscape variations across groups. Next, we applied the “oncoPredict” R package to predict drug sensitivity based on gene expression profiles. This investigation examined whether the TLS score may indicate variations in responsiveness to HCC-treating drugs.
Immune profiling analysis
Many solid cancers have better prognoses and treatment responses with TLS, particularly among patients who benefit from immunotherapy. These findings suggest a critical role for TLS in shaping the tumor immune microenvironment (TIME). However, researchers disagree on how TLS affects HCC therapy results. To further elucidate this mechanism, we employed a multi-dimensional immune microenvironment analysis strategy. First, the CIBERSORT approach was used to estimate immune cell subpopulation abundance from TCGA cohort mRNA expression data to determine the relationship between TLS model genes, immune cell infiltration patterns, and immune checkpoint expression. To achieve higher resolution at the single-cell level and to assess the impact of treatment, we analyzed scRNA-seq data from the GSE235863 cohort, which includes HCC patients treated with programmed cell death protein-1 (PD-1) inhibitors in combination with lenvatinib. Leveraging the high resolution of scRNA-seq, we investigated the composition of immune cell subsets and the dynamic evolution of the immune microenvironment across TLS-defined groups under therapeutic intervention. This approach enabled a more comprehensive understanding of how TLS model genes function within the complicated web of immune system interactions.
Statistical analysis
R software (version 4.4.2) was used to analyze and visualize transcriptomic data, while Python (version 3.11) was used to process and visualize scRNA-seq data. The statistical analyses included the following methods: Chi-square tests were applied for comparison of categorical variables; t-tests or Wilcoxon rank-sum tests were used for comparing continuous variables between two groups. A P-value < 0.05 was considered statistically significant.
| Results | ▴Top |
Functional enrichment analysis of TLS-related genes
Following the workflow outlined in Figure 1, we conducted GO and KEGG enrichment analyses to investigate the functional roles of TLS-related genes. The GO enrichment study (Fig. 2a) indicated that these genes are involved in cell death, humoral immune response, pore complex formation, chemokine action, and receptor binding. KEGG pathway analysis (Fig. 2b) further highlighted the involvement of the 45 TLS-related genes in key immunological and pathological pathways like cytokine-cytokine receptor interaction, the programmed death ligand 1 (PD-L1)/PD-1 immune checkpoint pathway in cancer, rheumatoid arthritis, and cell adhesion. Collectively, these findings suggest that TLS-related genes regulate tumor microenvironment immunity.
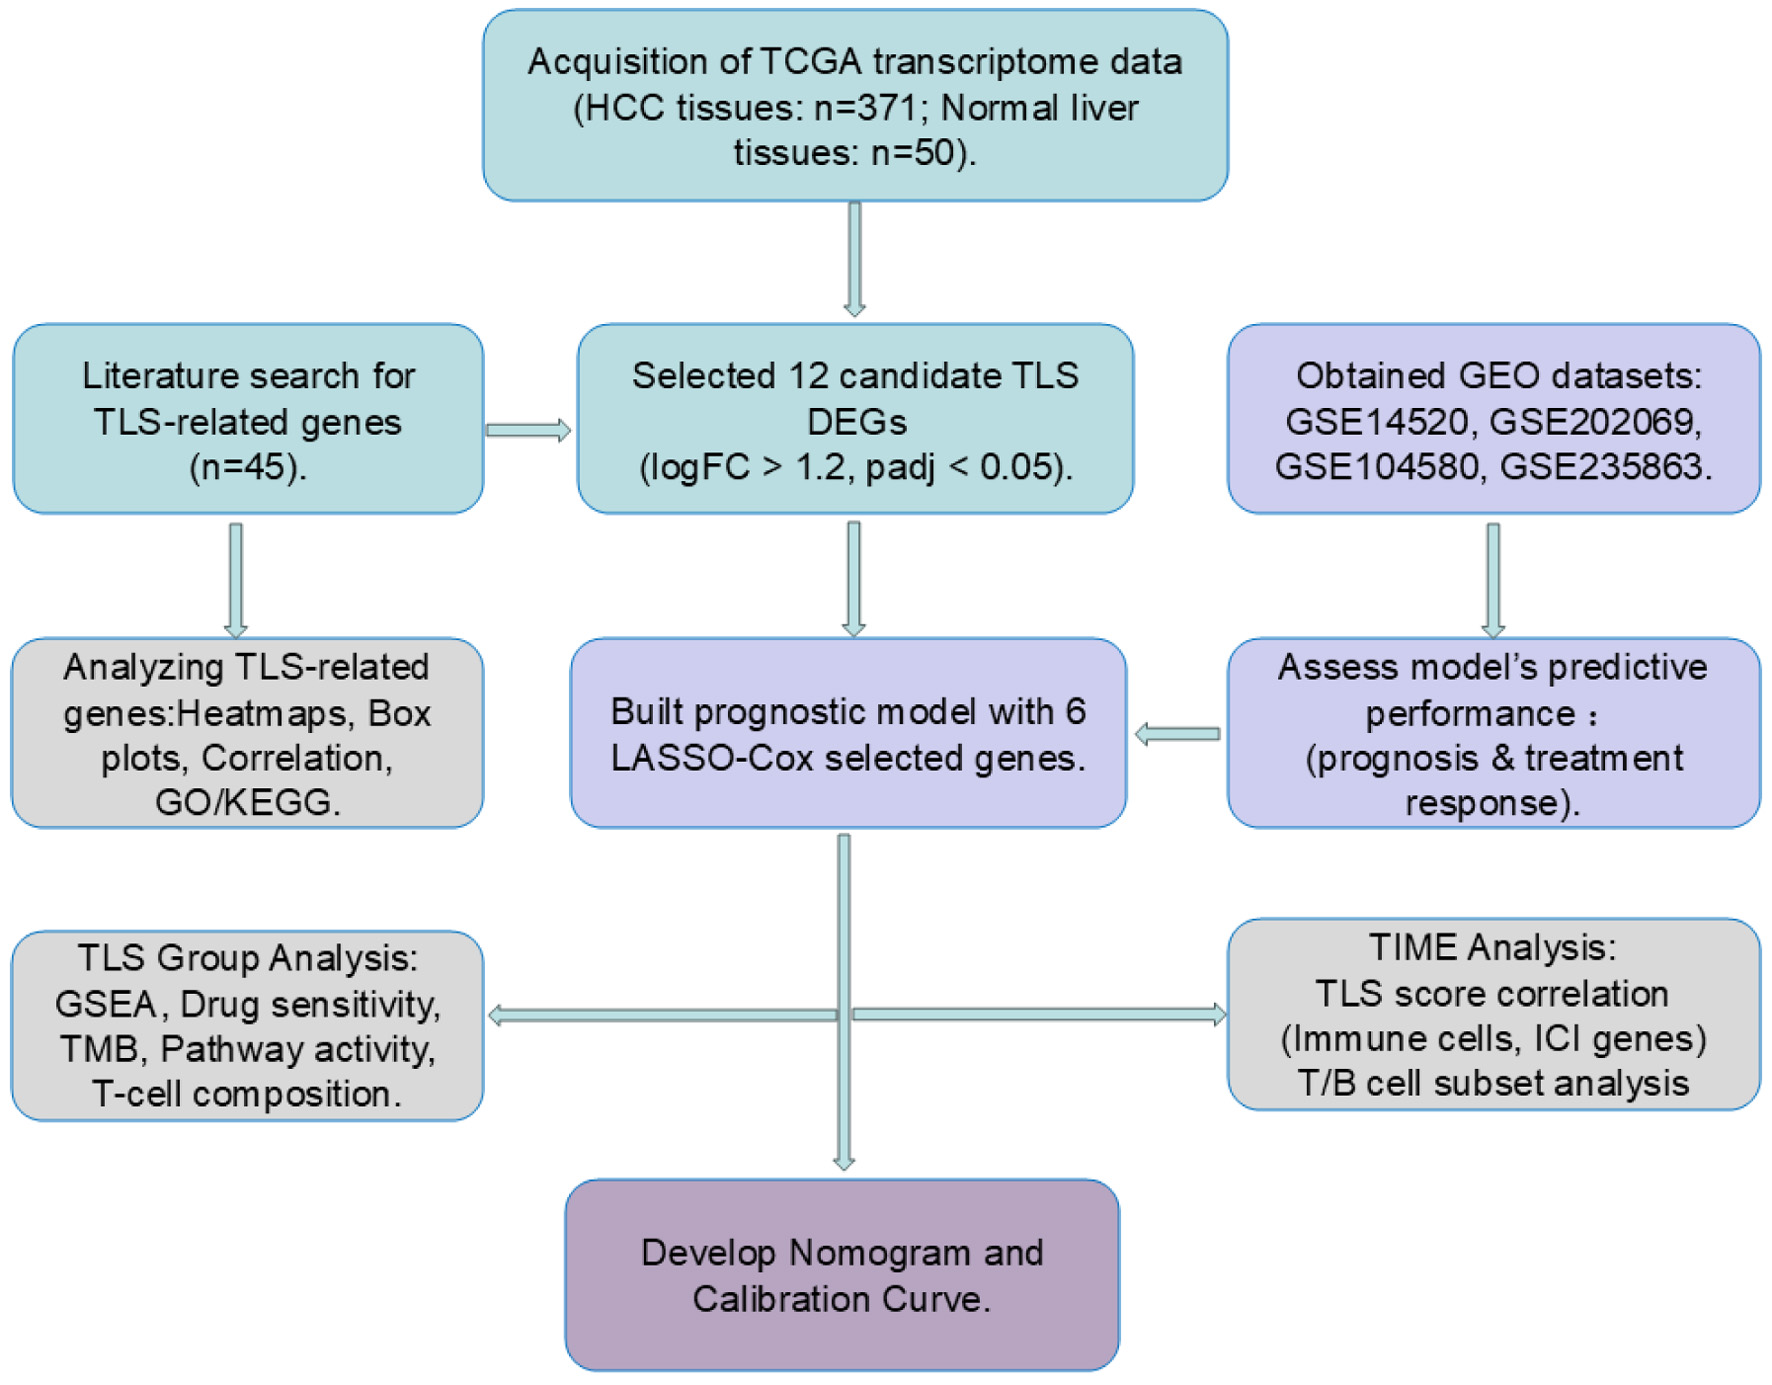 Click for large image | Figure 1. Workflow of the study. Cyan blocks represent data processing, light purple blocks model validation, gray blocks data analytics, and dark purple blocks clinical prediction model building. |
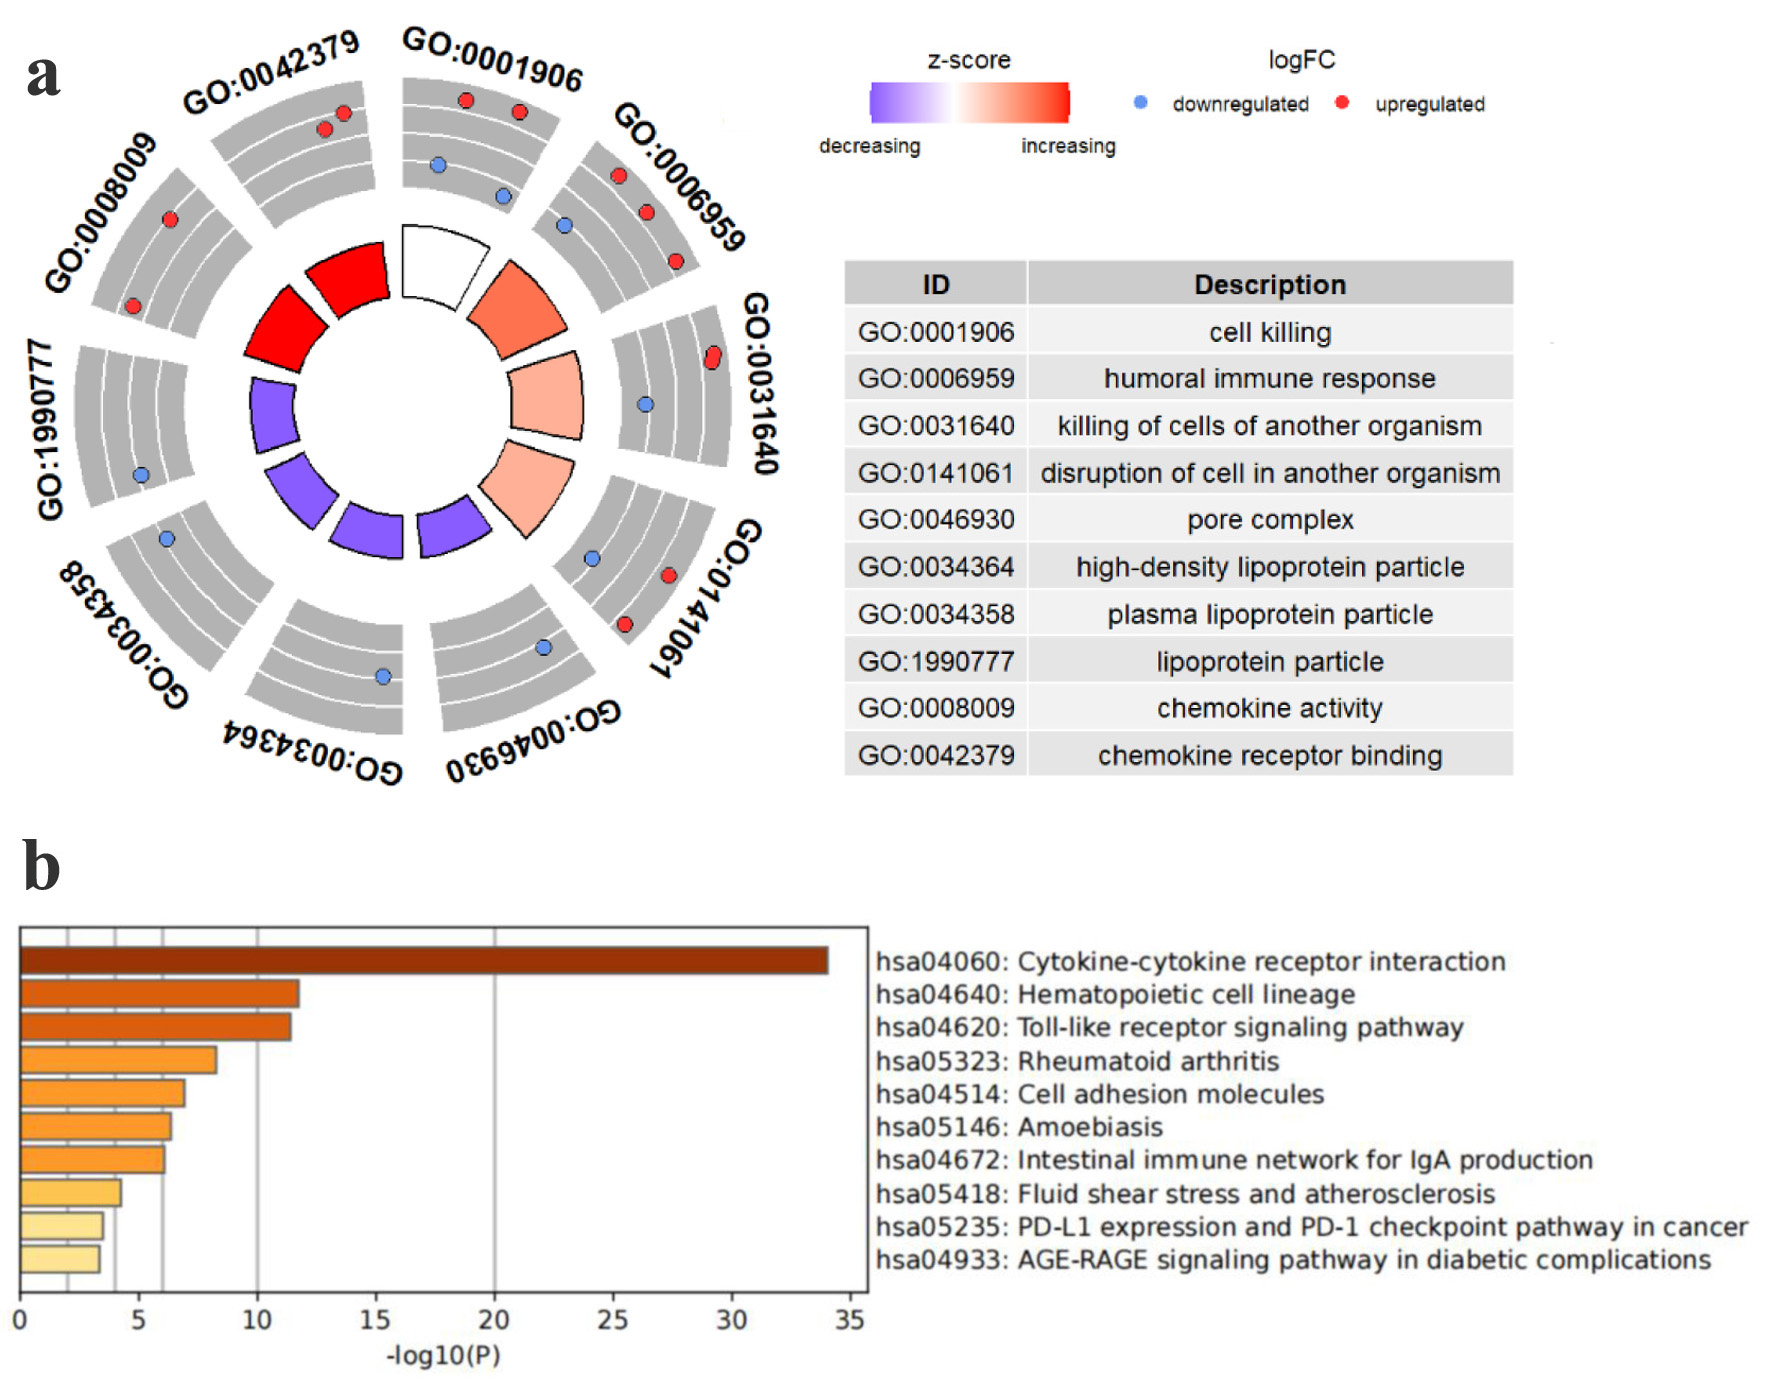 Click for large image | Figure 2. Pathway enrichment study of TCGA HCC patients’ TLS-related genes. (a) Enriched terms identified in the GO analysis. (b) Enriched pathways identified in the KEGG. |
Identification of candidate TLS-related genes in HCC
We used the TCGA database to analyze transcriptome data from HCC and normal liver tissues to find HCC-specific TLS-related genes. By integrating differential expression results from three widely used R packages - Limma, DESeq2, and EdgeR - we identified a total of 1,779 upregulated and 992 downregulated genes (Fig. 3a). We then intersected these DEGs with a curated list of 45 TLS-related genes from the literature, resulting in the identification of 12 candidate genes. In a heatmap (Fig. 3c), these 12 genes were expressed differently in tumor and normal tissues. Among them, CCL20 and CD200 were significantly upregulated in HCC tissues, while the other 10 genes exhibited higher expression in normal liver tissues. Furthermore, correlation analysis of these 12 genes’ expression levels showed considerable inter-gene relationships, suggesting potential co-regulatory relationships (Fig. 3b).
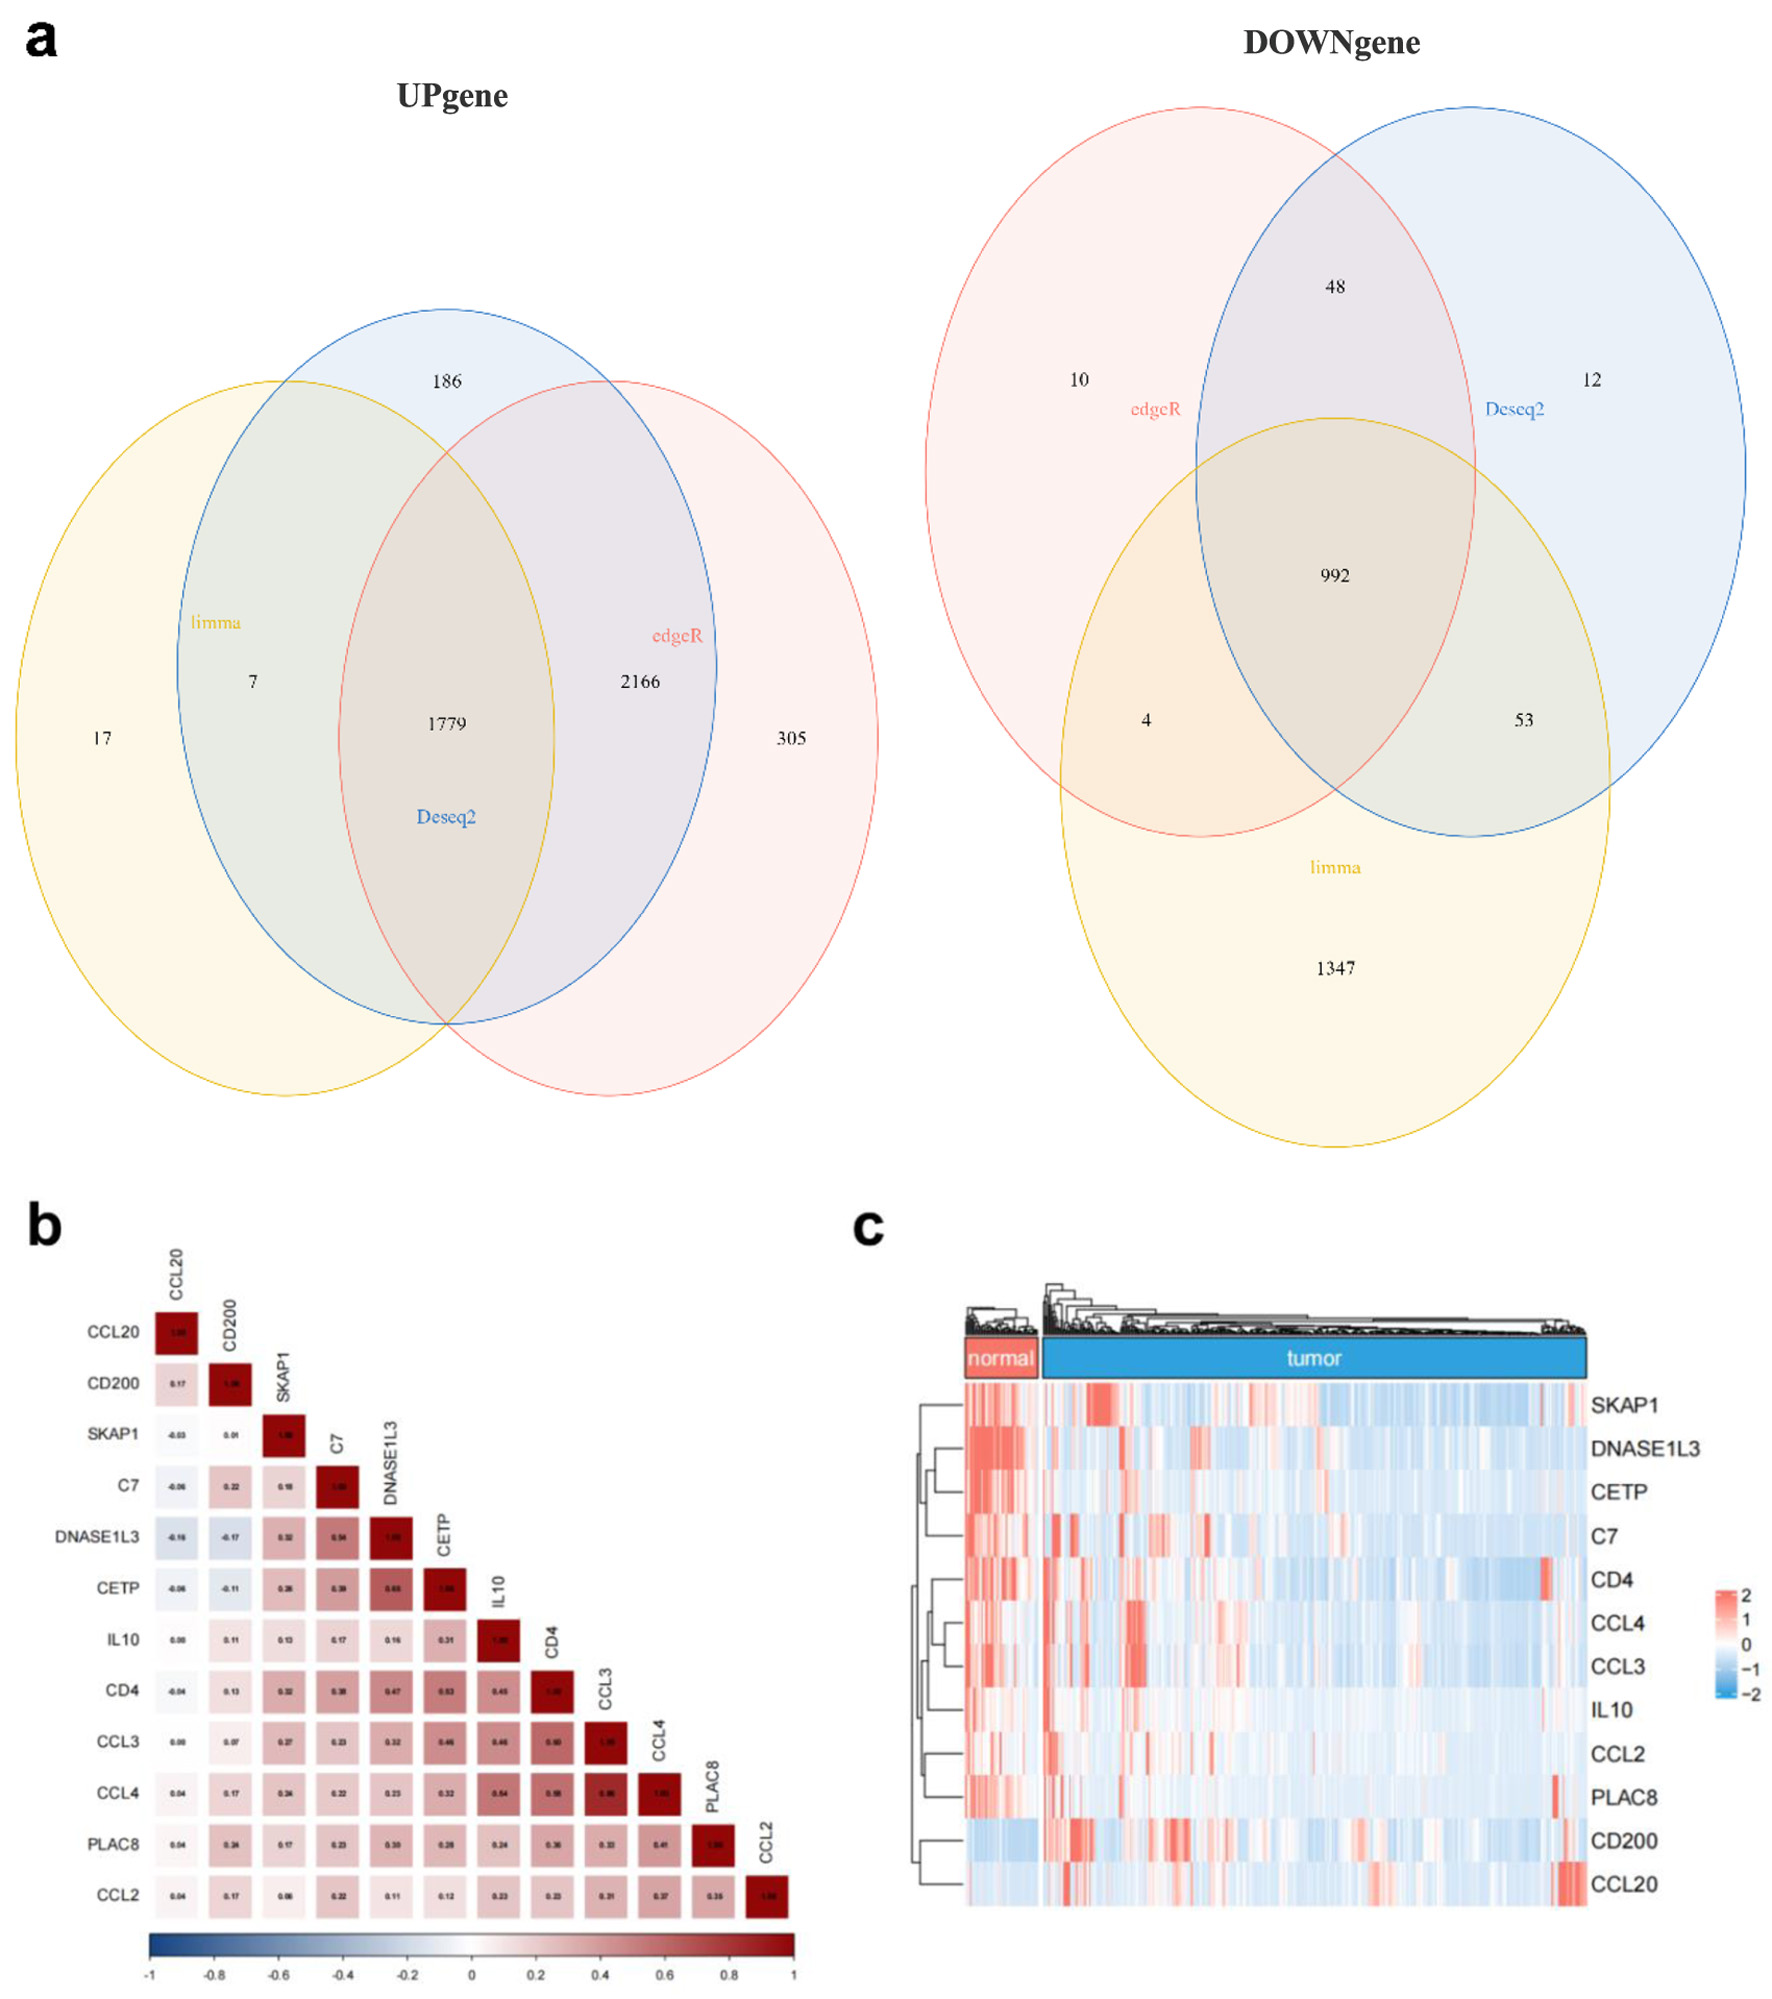 Click for large image | Figure 3. TLS-related gene expression differs between HCC and normal liver tissues. (a) Venn diagram showing the intersection of differentially expressed genes identified by Limma (yellow), DESeq2 (blue), and EdgeR (red). (b) Correlation matrix illustrating the relationships among the 12 candidate TLS-related genes. (c) Heatmap showing normal and malignant tissue expression of the 12 TLS-related genes. Red means high expression, blue means low expression, “normal” means normal liver tissues, and “tumor” means HCC tissues. |
Building an HCC prognostic model from candidate TLS genes
Using tumor samples from HCC patients, we constructed a predictive model based on TLS-related genes through LASSO-Cox regression analysis. The TLS score calculation included six genes (Fig. 4a, b). The TLS score was calculated with the accompanying formula: TLS score = Exp (CCL20) × 0.0825 + Exp (CD200) × 0.2005 + Exp (DNASE1L3) × (-0.1000) + Exp (PLAC8) × 0.1055 + Exp(C7) × (-0.0626) + Exp (SKAP1) × (-0.0900).
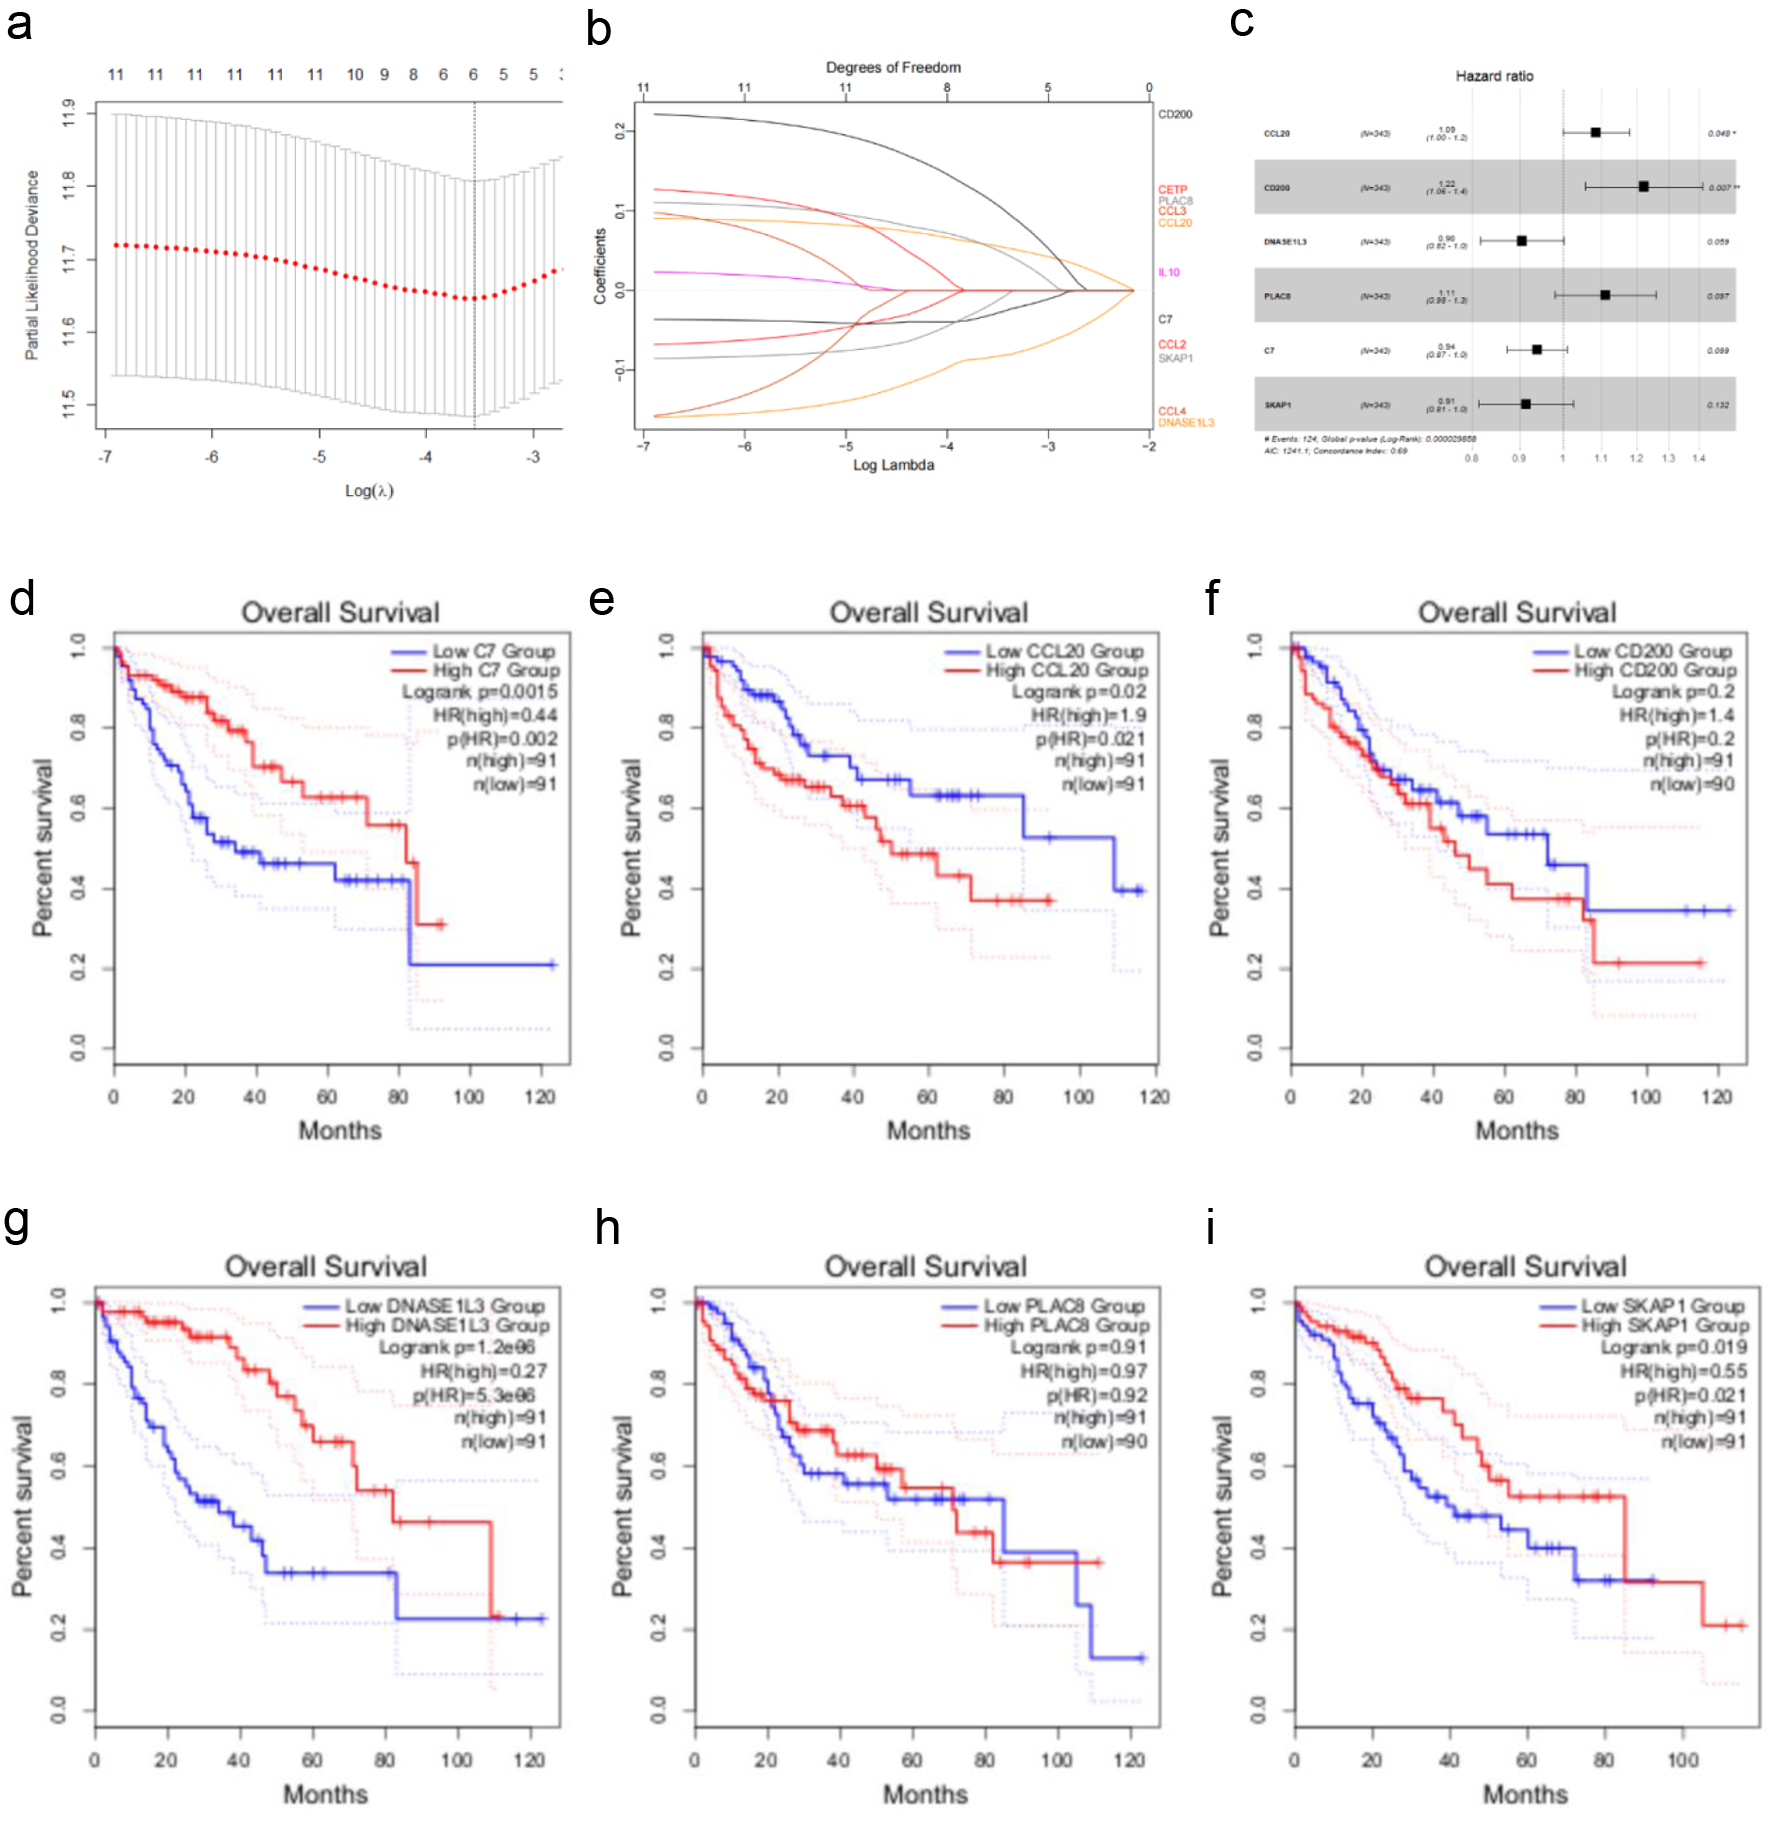 Click for large image | Figure 4. Creating a TCGA cohort TLS-related gene-based prognostic risk model. (a) LASSO regression analysis of 12 TLS-related genes. (b) Ten-fold cross-validation for selecting the optimal penalty parameter (λ) in the LASSO regression. (c) Forest plot showing the hazard ratios and 95% confidence intervals for multiple variables in the multivariate Cox regression model. (d-i) Kaplan-Meier survival curves illustrating the impact of low vs. high expression of C7, CCL20, CD200, DNASE1L3, PLAC8, and SKAP1 on overall survival in HCC patients. |
A multivariate Cox regression analysis confirmed the model’s robustness, with an Akaike Information Criterion of 1,241.1 and a C-index of 0.69 (P < 0.001), indicating good predictive performance. The risk forest plot (Fig. 4c) showed that CCL20 and CD200 were strongly linked to poor prognosis in HCC (P < 0.05, hazard ratio (HR) > 1). To evaluate each model gene’s prognostic value, we utilized the GEPIA 2 tool [16] to analyze the association between gene expression levels (quartile-based grouping) and OS in HCC patients. The findings indicated that high expression of C7, DNASE1L3, and SKAP1, as well as low expression of CCL20, were significantly associated with favorable OS (Fig. 4d-i). Notably, the HRs for CCL20 (HR = 1.9) and CD200 (HR = 1.4) were consistent with their classification as risk genes (HR > 1) in the multivariate model.
Initially, this research incorporated 374 HCC patients from the TCGA database. After data filtering - excluding three duplicate IDs and 28 cases with incomplete survival information or OS less than 30 days - 343 valid samples were kept for subsequent analysis. Patients were divided into two groups based on their median TLS scores: those with high scores (n = 172) and those with low scores (n = 171).
The low TLS score group had a longer OS and reduced mortality rate (Fig. 5a, d). The Kaplan-Meier survival curve clearly demonstrated the association between a high TLS score and poor prognosis (Fig. 5a). This observation was further supported at the molecular level: tumors in the low-TLS showed higher expression of DNASE1L3 and C7, and lower expression of CCL20 and CD200 (Fig. 5e, Fig. 4b). Notably, elevated DNASE1L3 expression has previously been reported to correlate with better survival outcomes in HCC patients [17]. TLS scoring model AUC values for 1, 3, and 5-year OS were 0.77, 0.70, and 0.67 (Fig. 5b), indicating its predictive significance.
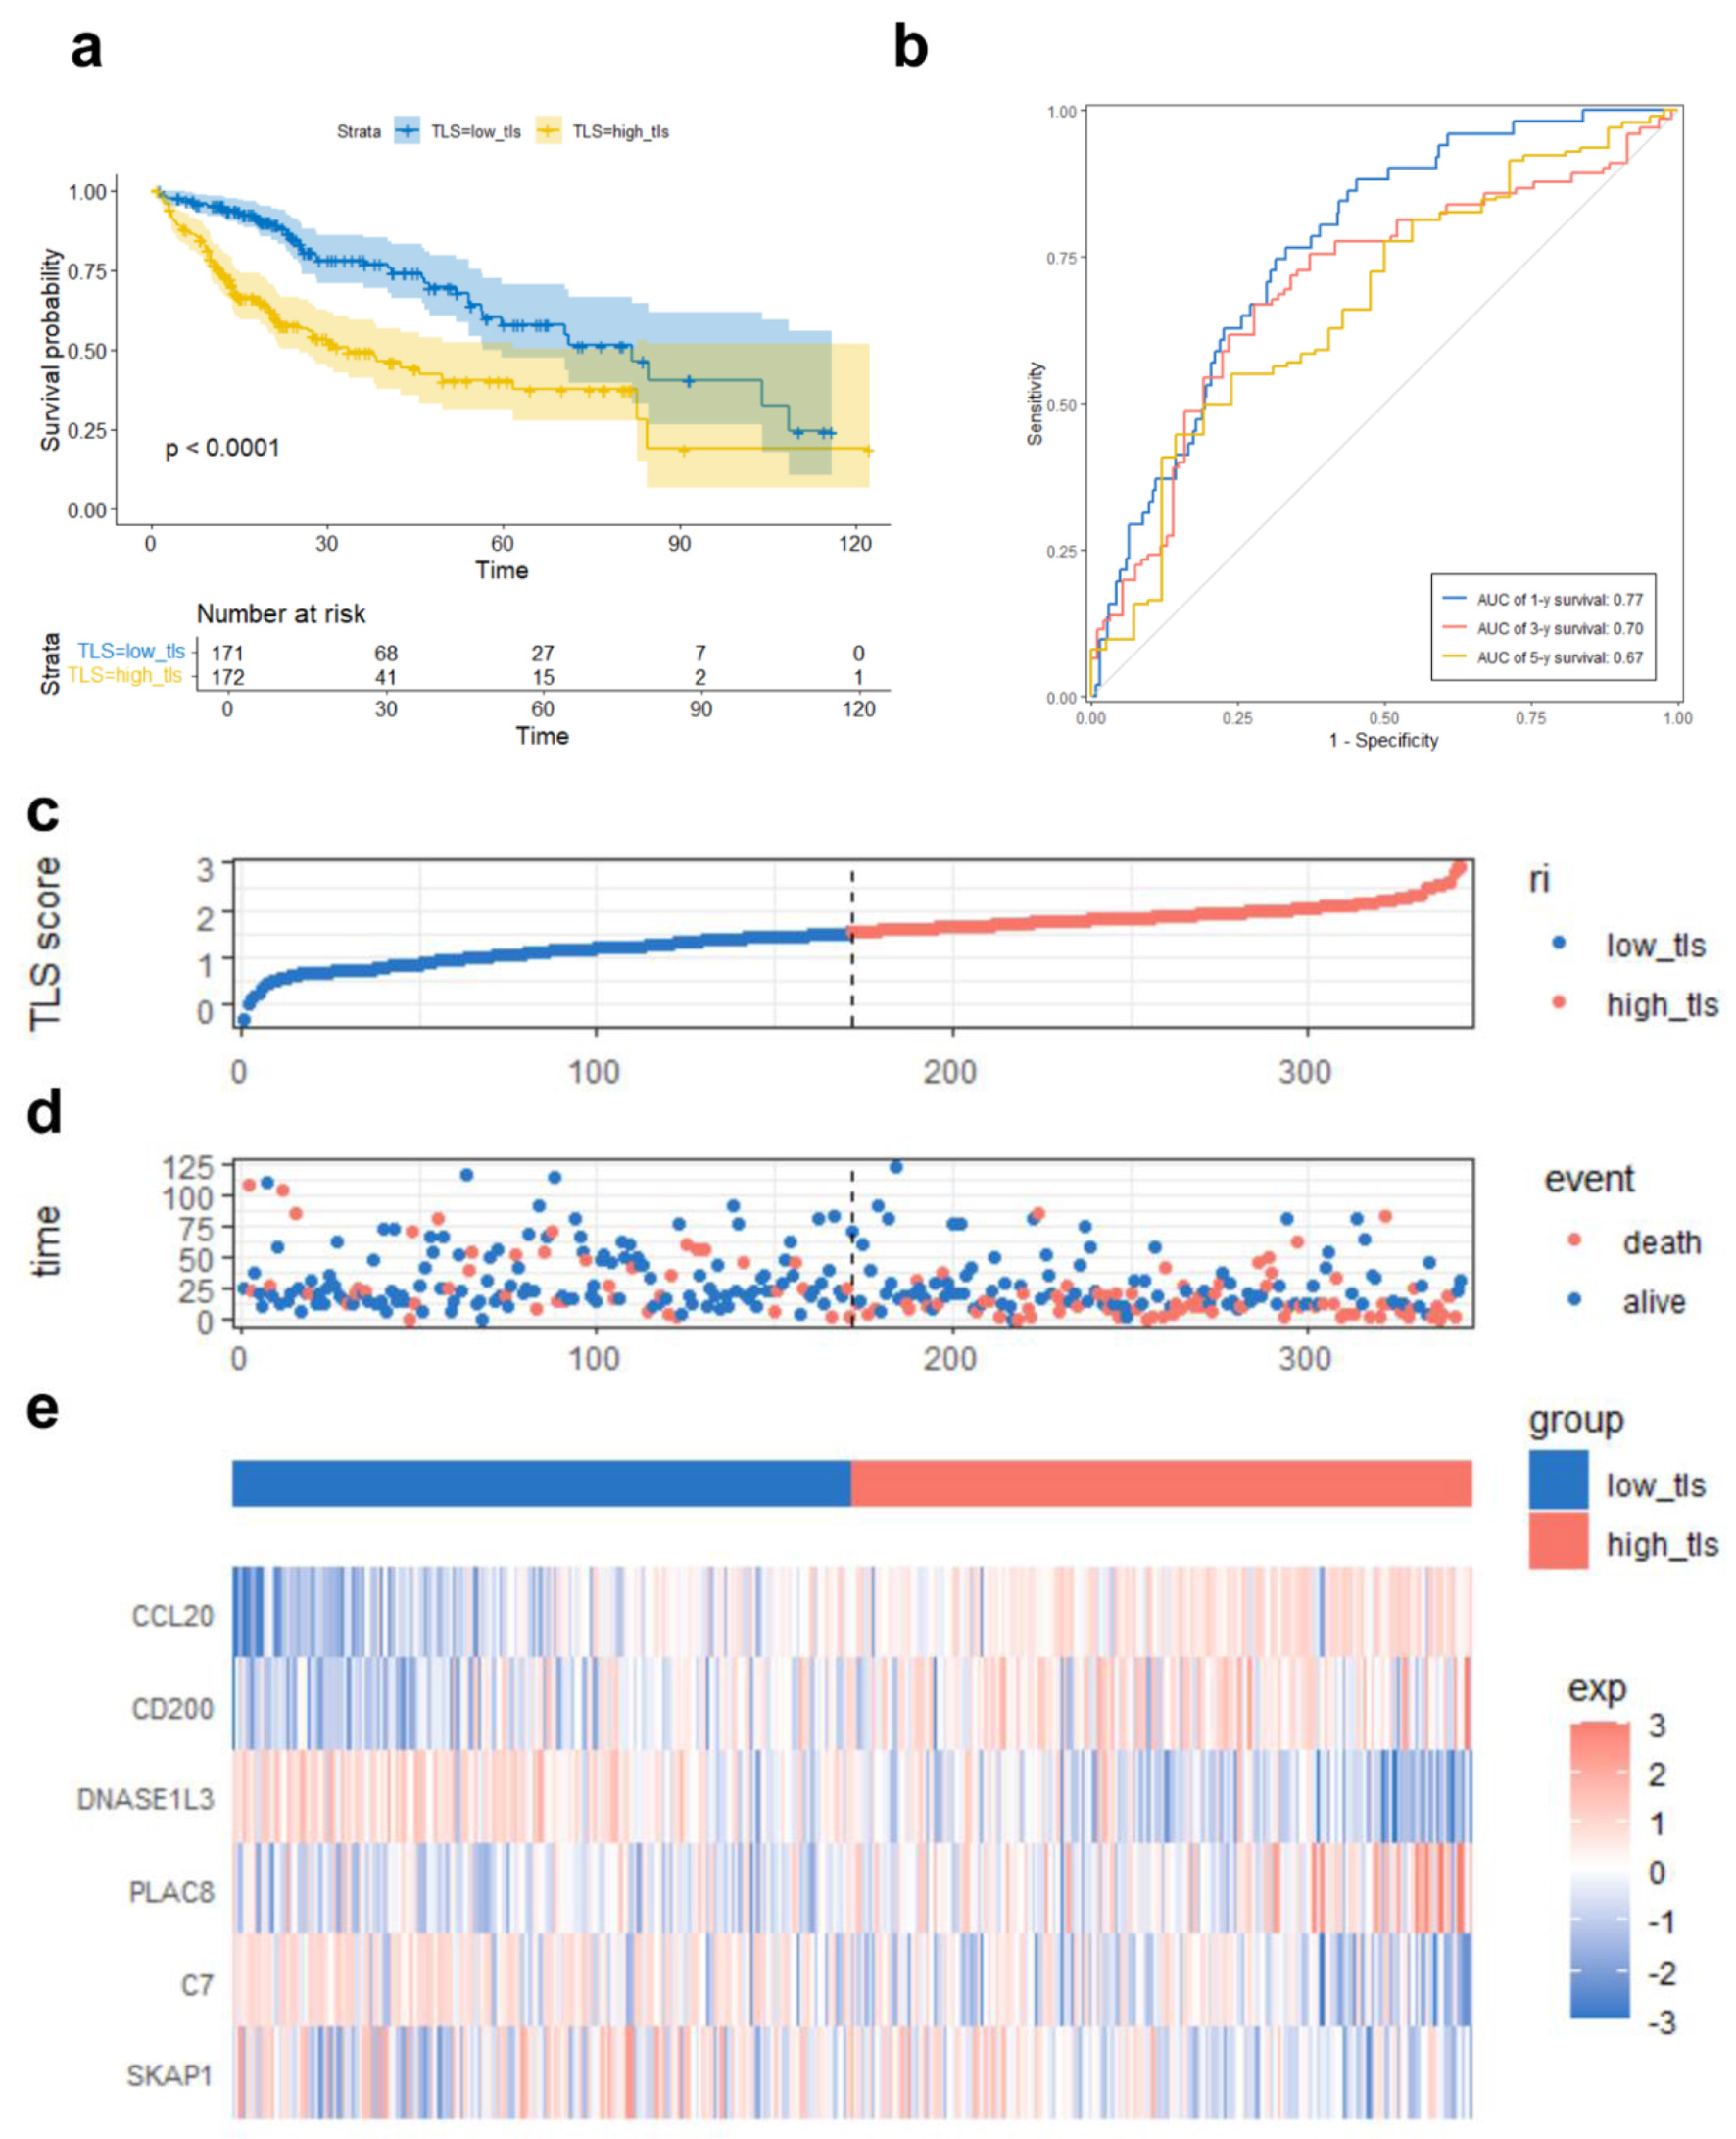 Click for large image | Figure 5. TLS score-based TCGA prognostic risk model performance. (a) Kaplan-Meier survival curve comparing overall survival between high and low TLS score groups. (b) ROC curves demonstrating the predictive accuracy of the TLS score for 1-, 3-, and 5-year OS. (c) Median TLS score threshold patient dispersion. The low TLS score group is blue, and the high group is red. (d) Survival rates of high-risk and low-risk HCC patients. Red means death; blue means survival. (e) Heatmap of six model gene expression patterns. Low expression is blue, high expression is red. Below is the TLS group classification: blue for low and red for high. |
Validation of the TLS model for prognosis and treatment response prediction in HCC
To test TLS scoring model robustness, we first evaluated its performance in an independent cohort of 221 HCC samples from the GSE14520 dataset. Patients were stratified into low-TLS (n = 109) and high-TLS (n = 112) groups. The results demonstrated that the low-TLS had a significant survival advantage (longer OS and lower mortality), along with gene expression patterns consistent with the TCGA cohort: higher expression of DNASE1L3 and C7, and lower expression of CCL20 and CD200 (Fig. 6a, c). Time-dependent ROC analysis confirmed the model’s prognostic capability, with AUCs of 0.62, 0.64, and 0.66 for 1-, 3-, and 5-year OS, respectively (Fig. 6b), further supporting the model’s reliability. In addition, we extended the validation using GSE202069, GSE104580, GSE279750, and GSE235863 datasets for evaluating the TLS score’s prognostic potential and treatment outcomes across diverse HCC patient cohorts. TIDE was utilized to examine the relationship between TLS score and ICI response. The analysis predicted a better response to immunotherapy for patients with low TLS scores (Fig. 6d). TIDE sub-score analysis revealed that high TLS score tumors were more closely associated with immune evasion mechanisms, exhibiting elevated levels of myeloid-derived suppressor cells (MDSCs), interferon-gamma (IFNG) expression, T-cell exclusion, and overall TIDE scores, while low TLS scores were more linked to T-cell dysfunction characteristics (Fig. 6e). These results show that tumors with high TLS scores may have increased immune evasion potential since the TIDE score measures T-cell inactivation and exclusion in the tumor microenvironment and is positively connected with immune escape capacity.
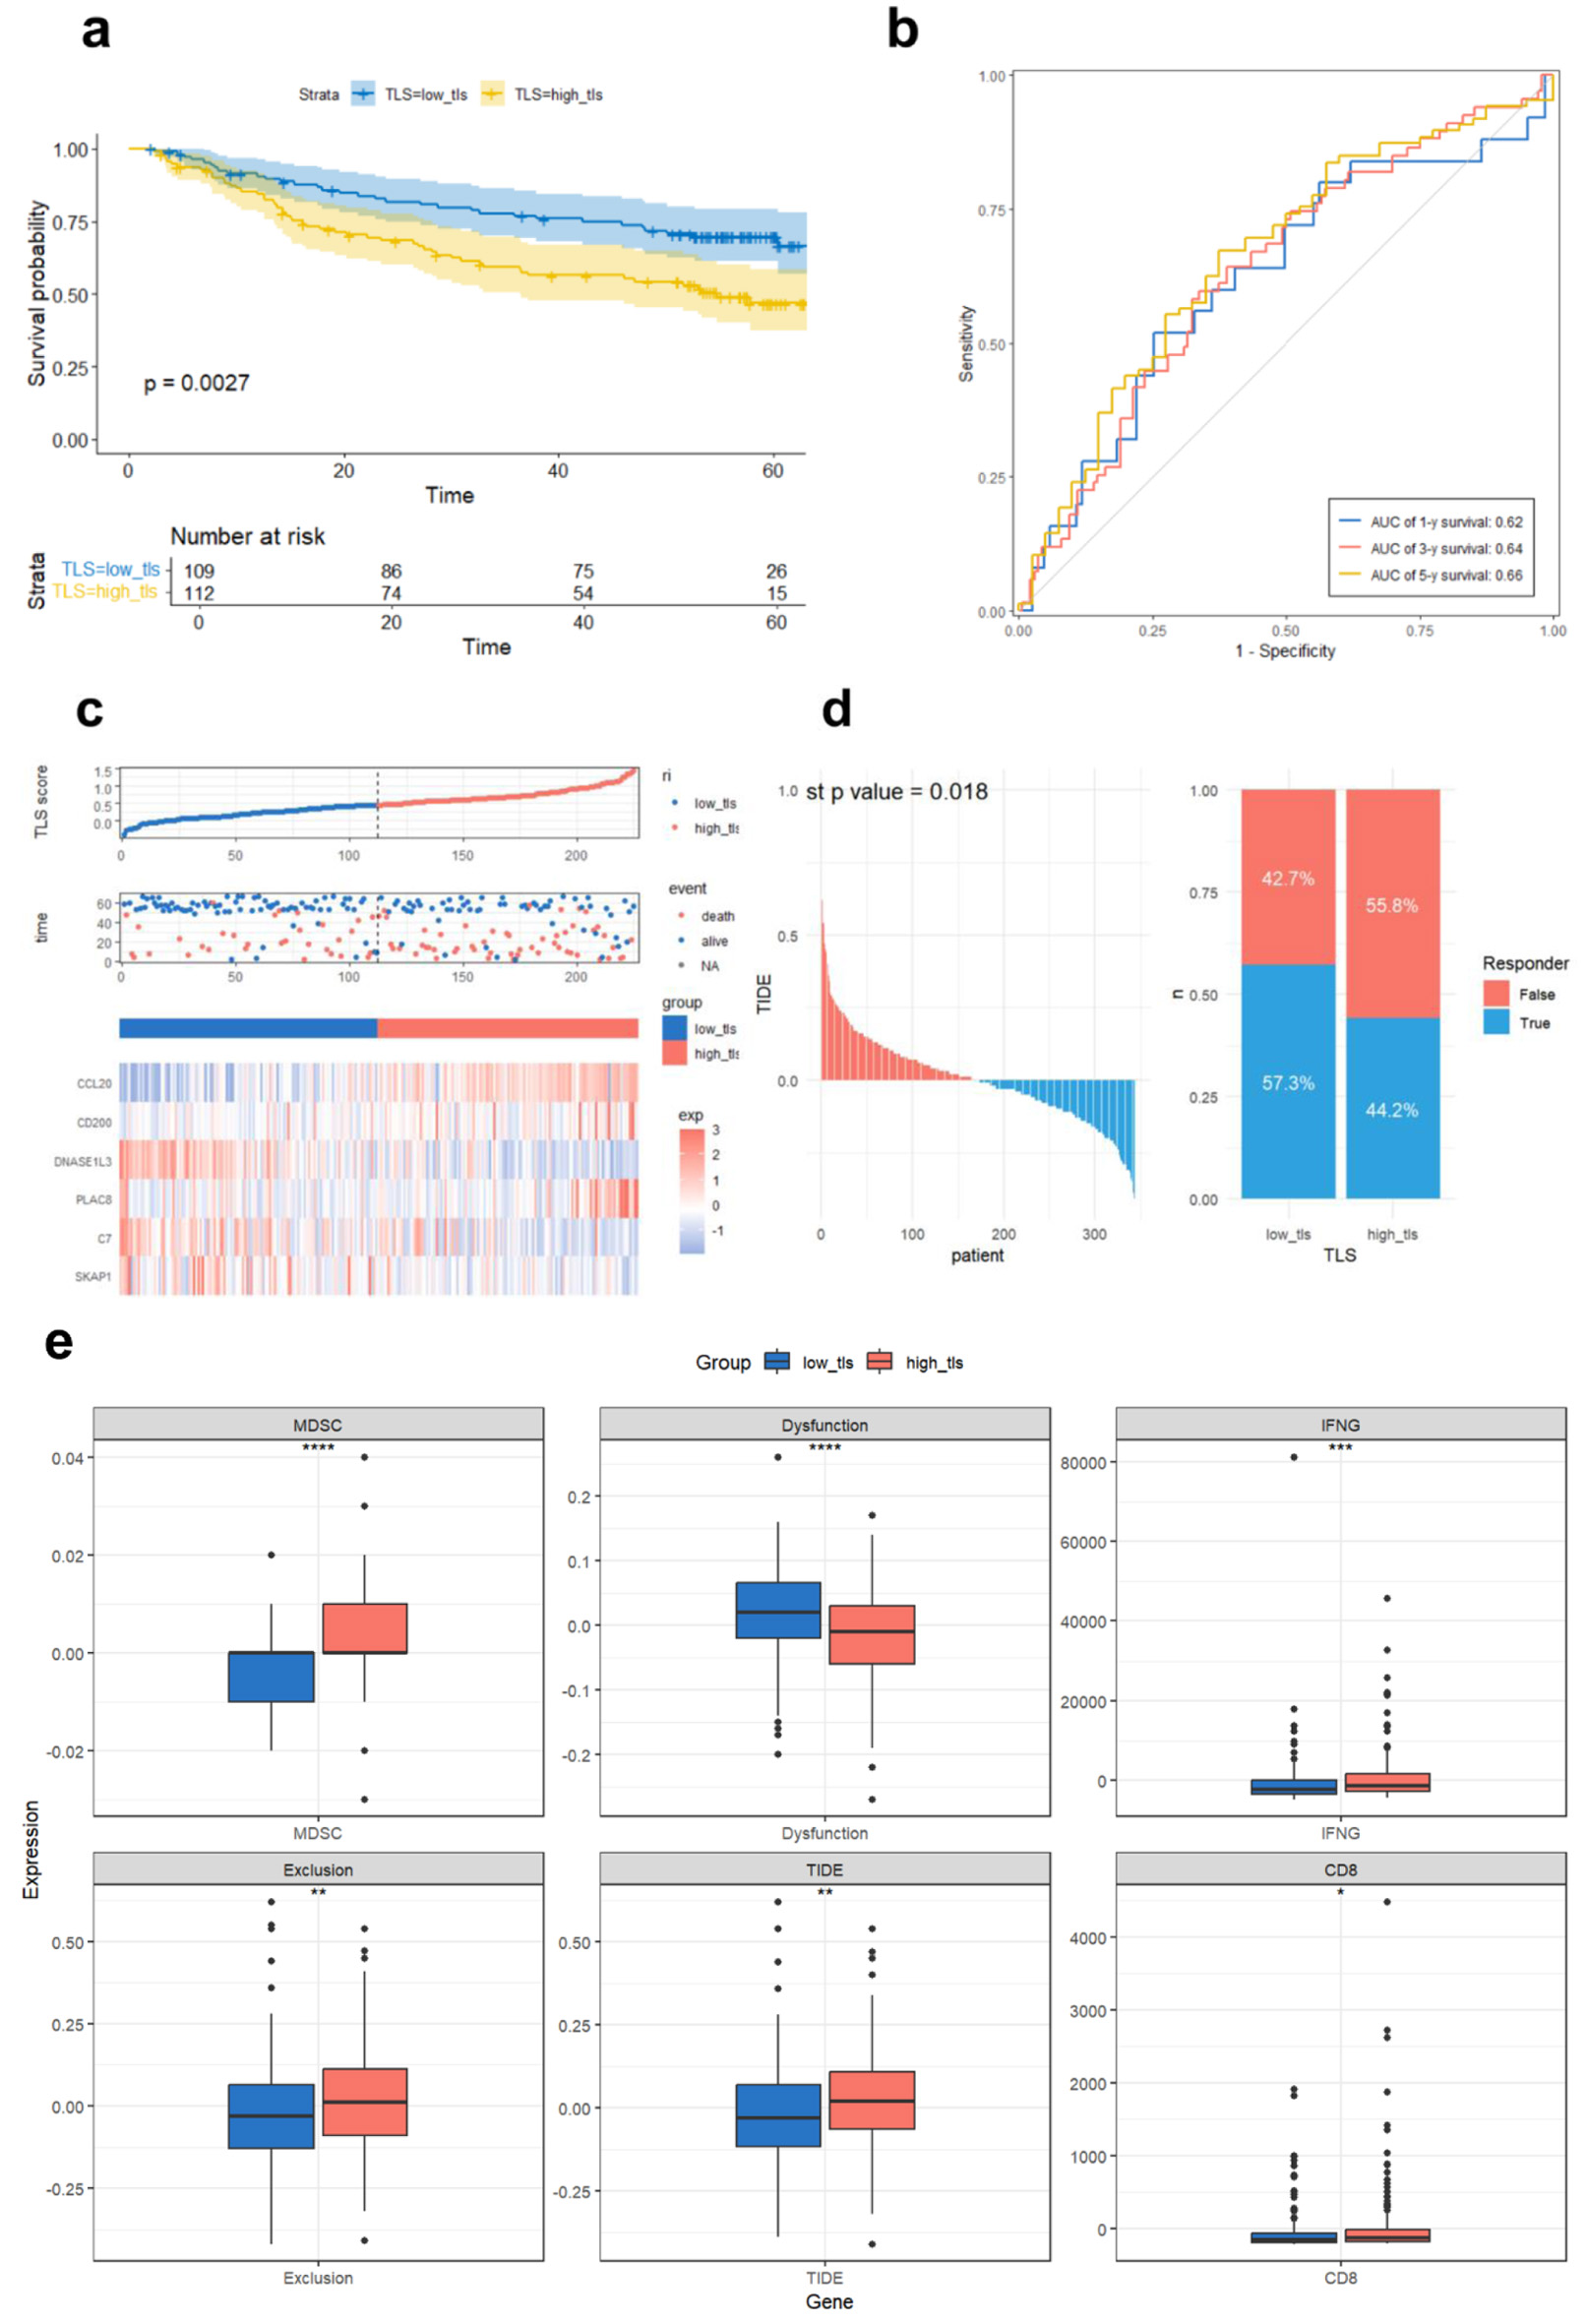 Click for large image | Figure 6. Validation of the prognostic TLS model in GSE14520 and TIDE immunotherapy response prediction in TCGA. (a) Compared overall survival of GSE14520 cohort high and low TLS score groups using Kaplan-Meier curves.(b) Time-dependent ROC curves assessing TLS score prediction power for 1-, 3-, and 5-year survival. (c) Median TLS score threshold patient dispersion. The low TLS score group is blue, and the high group is red. Blue indicates survival, red death. The heatmap shows six TLS-related gene expression levels. (d) TCGA sample immune checkpoint inhibitor sensitivity predicted by the TIDE platform, comparing TLS-defined subtypes. (e) Immunological differences between high and low TLS scores in TCGA cohort. Dysfunction (T-cell dysfunction score), MDSC (myeloid-derived suppressor cell infiltration), IFNG (interferon-gamma expression), exclusion (T-cell exclusion score), and TIDE score (a composite index reflecting tumor immune evasion via T-cell dysfunction and exclusion, associated with reduced ICI efficacy). CD8 indicates the expression level of CD8+ T cells. |
To assess the prediction efficacy of the TLS score regarding treatment response, we analyzed several HCC patient cohorts that received different therapeutic regimens. In the GSE202069 cohort (n = 17), which included patients treated with PD-1 inhibitors, patients were stratified into low-TLS (n = 8) and high-TLS (n = 9) groups. Although the low TLS group exhibited a trend toward improved survival, the difference was not statistically significant (P = 0.09, Fig. 7a), likely due to the small sample size. However, time-dependent ROC analysis corroborated the TLS score’s predictive efficacy, with AUCs of 0.68, 0.70, and 0.75 for 1.5-, 2-, and 2.5-year OS (Fig. 7b). In three additional cohorts - patients receiving TACE (GSE104580, n = 147), PD-L1 inhibitors (GSE279750, n = 10), and PD-1 combined with lenvatinib (GSE235863, n = 15) - low TLS scores were significantly associated with better therapeutic responses (Fig. 7c-e), with corresponding AUC values of 0.746, 0.875, and 0.727, correspondingly. To explore potential mechanisms underlying these associations, we used the “progeny” and “TCellSI” R packages to evaluate signaling pathway activity and T-cell status across the treatment cohorts.
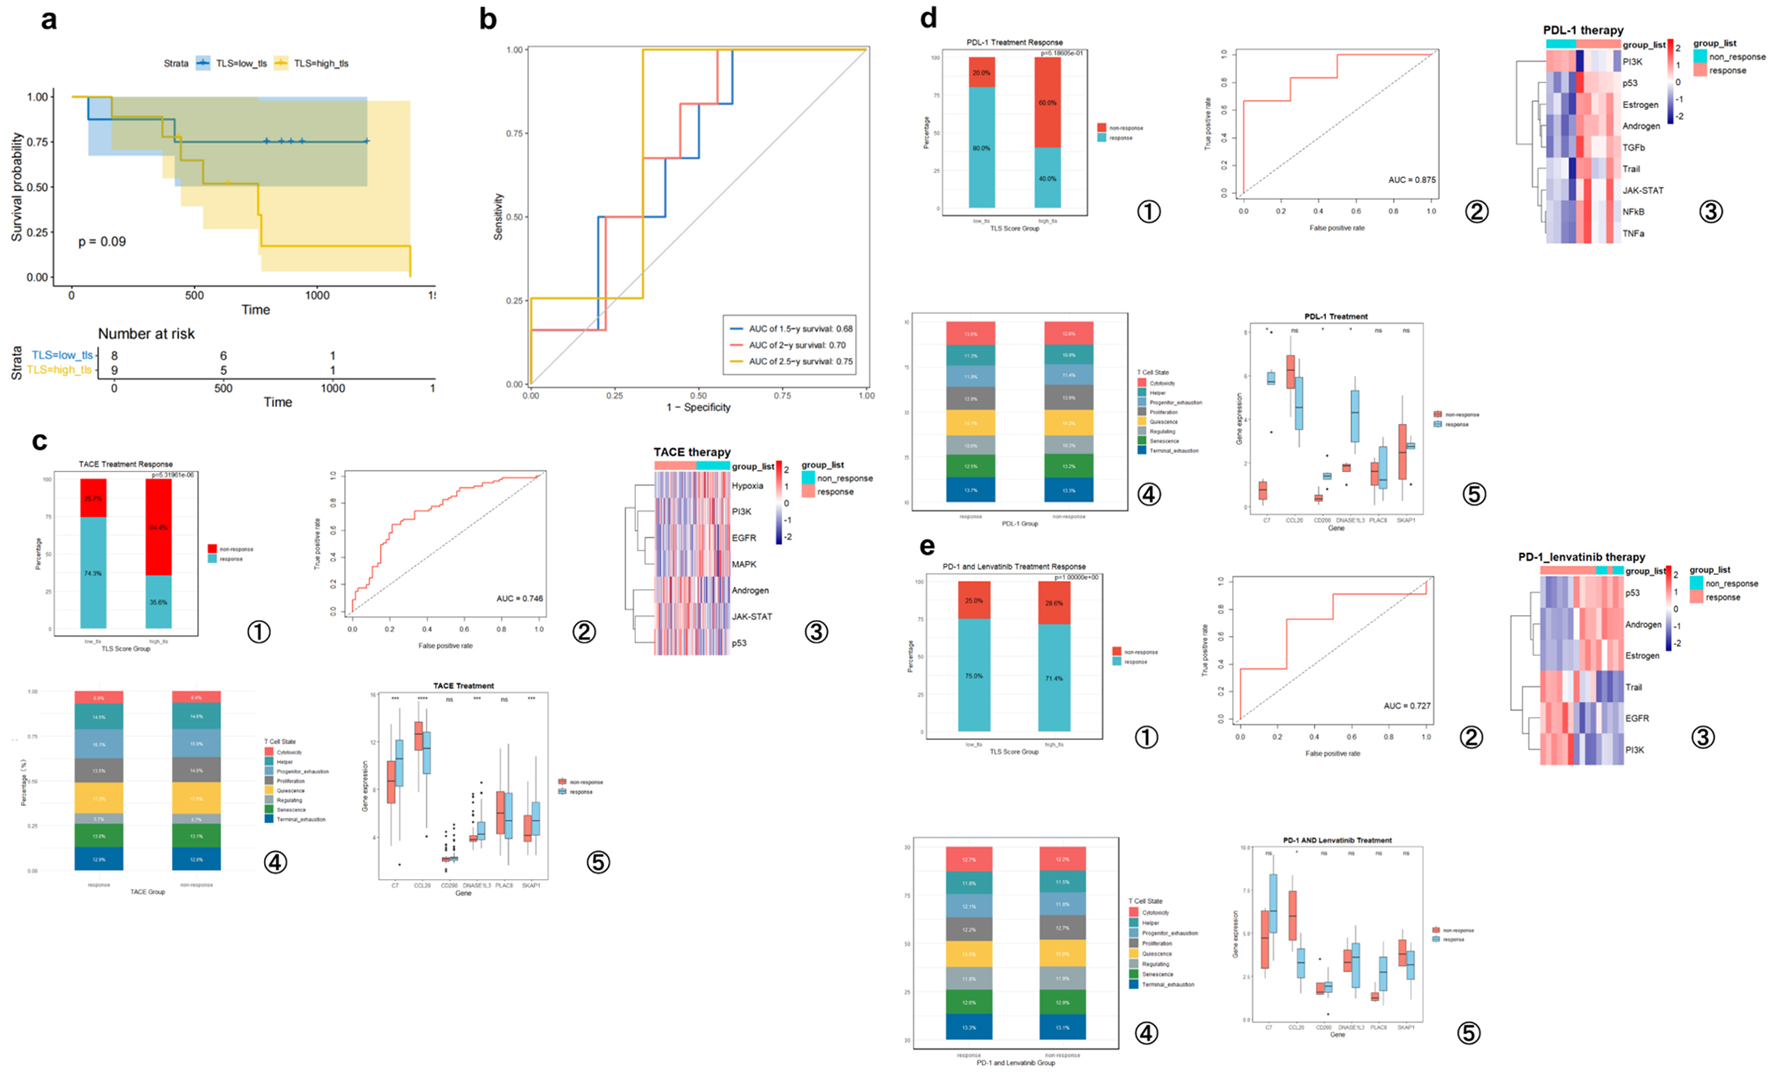 Click for large image | Figure 7. TLS score predicts hepatocellular carcinoma prognosis and treatment responsiveness. (a) High- and low-TLS score Kaplan-Meier survival curves for PD-1 treatment patients (GSE202069 cohort). (b) Time-dependent ROC curves analyzing this cohort’s TLS score predictiveness. (c) GSE104580 (TACE treatment). (d) GSE279750 (PD-L1 inhibitor treatment). (e) GSE235863 (PD-1 inhibitor + lenvatinib treatment). (c-e) Analysis of the TLS signature’s predictive value for treatment response in three independent cohorts. For each cohort, the panels display the following from left to right: the proportion of responders in high- and low-TLS score groups; the ROC curve for predicting therapeutic response; a heatmap of signaling pathway activity between responders and non-responders; a bar chart comparing T-cell functional state proportions; and box plots of the six model gene expression levels grouped by response. T-cell states include quiescence, regulating, proliferation, helper, cytotoxicity, progenitor exhaustion, terminal exhaustion, and senescence. |
Cross-cohort pathway analyses revealed distinct molecular signatures associated with treatment response. In the GSE104580 cohort (TACE responders), suppression of pro-survival pathways such as hypoxia, phosphatidylinositol 3-OH kinase (PI3K), epidermal growth factor receptor (EGFR), and mitogen-activated protein kinase (MAPK), alongside activation of immune and apoptotic pathways including androgen, JAK-STAT, and p53, was observed. In the GSE279750 cohort (PD-L1 inhibitor responders), activation of immune-related pathways (Janus kinase/signal transducers and activators of transcription (JAK-STAT), nuclear factor-κB (NF-κB), tumor necrosis factor-α (TNF-α)), apoptotic pathways (p53, TRAIL), and hormonal signaling (estrogen, androgen) was evident, while proliferative signaling (PI3K) was downregulated. In the GSE235863 cohort (PD-1 + lenvatinib combination therapy), responders showed activation of apoptotic (TRAIL) and selected growth-related pathways (EGFR, PI3K), but downregulation of p53 and hormone-related signaling (androgen, estrogen). These results suggest that distinct forms of pathway reprogramming may underlie treatment response in different therapeutic contexts. T-cell state analysis revealed a consistent trend across all three cohorts (GSE104580, GSE279750, and GSE235863): responders had more cytotoxic and early and terminally fatigued T cells, whereas non-responders exhibited a predominance of proliferative, quiescent, and senescent T-cell subsets (Fig. 7c-e). These findings suggest that effective treatment response may be accompanied by a shift toward an effector/exhausted T-cell phenotype within the TME. Taken together, analyses across multiple independent datasets and diverse treatment regimens support the notion that a low TLS score is a favorable indicator of treatment response in HCC. This association may be attributed to a unique immune microenvironmental context in responders, characterized by distinct pathway activity patterns and functionally competent T-cell infiltration.
Construction of a TLS-based nomogram and calibration curve
To promote the clinical translation of the TLS scoring system and provide a more precise, individualized prognostic assessment for HCC patients, a nomogram integrating the TLS score with clinicopathological variables was created, including age, sex, tumor stage, and TNM classification (Fig. 8a). This nomogram was designed to quantitatively estimate patient-specific survival probabilities. Calibration curve analysis (Fig. 8b) showed good concordance between projected survival probabilities and observed results, supporting the model’s predictive accuracy and therapeutic value.
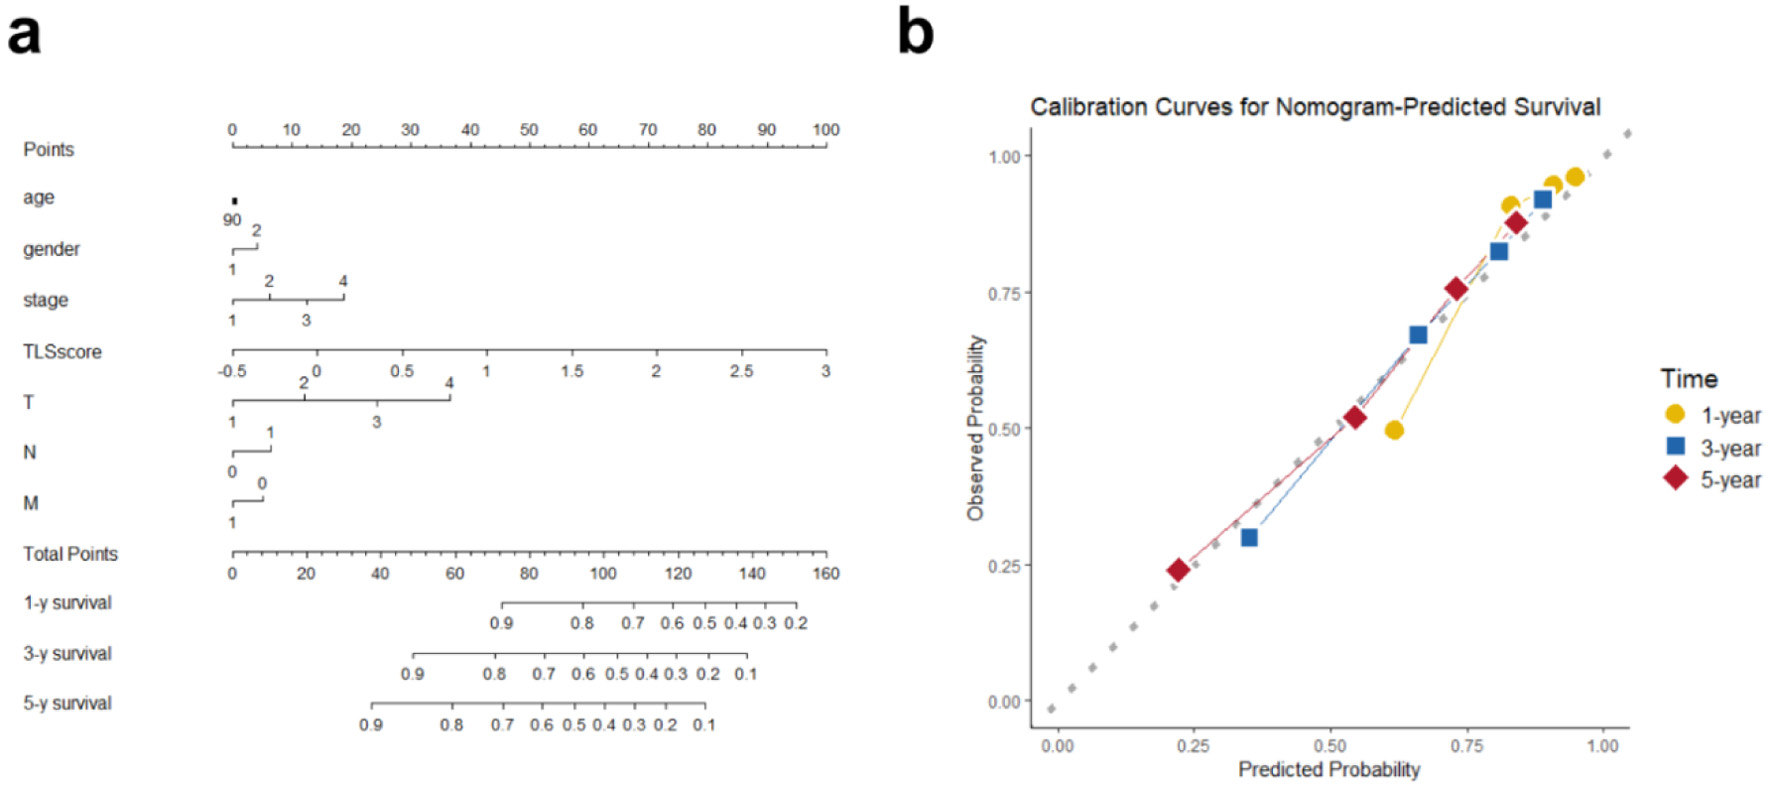 Click for large image | Figure 8. Overall survival nomogram for hepatocellular cancer patients. (a) Nomogram estimating individual survival odds using TLS score, clinical, and pathological variables. Any age stage scores 90 points, with gender coded (female as 1, male as 2). (b) Calibration plots showing high agreement between nomogram predictions and observed 1-, 3-, and 5-year overall survival. |
GSEA enrichment analysis
To elucidate the biological functional differences and potential regulatory pathways associated with varying TLS score levels in HCC, we first visualized used boxplots to depict model gene expression. Expression of CCL20, CD200, and PLAC8 was significantly elevated in high-TLS (Fig. 9a), consistent with the trends previously observed between tumor and normal tissues. Subsequently, we performed GSEA. Significant immune-related pathway enrichment was found, including immunoglobulin complex (circulating and tissue-resident), positive regulation of B-cell activation, and the inflammatory response (Fig. 9b). In addition, KEGG pathway enrichment analysis, visualized using a chord diagram (Fig. 9c), provided an intuitive overview of the associations between differential genes and key biological pathways. Notably, apart from immune-related functions, cytochrome P450-mediated xenobiotic metabolism, bile secretion, and drug metabolism differed. When combined, these functional analyses suggest that the low TLS score group’s improved prognosis may be due to a unique immune regulatory landscape and changed metabolic features, notably medication metabolism.
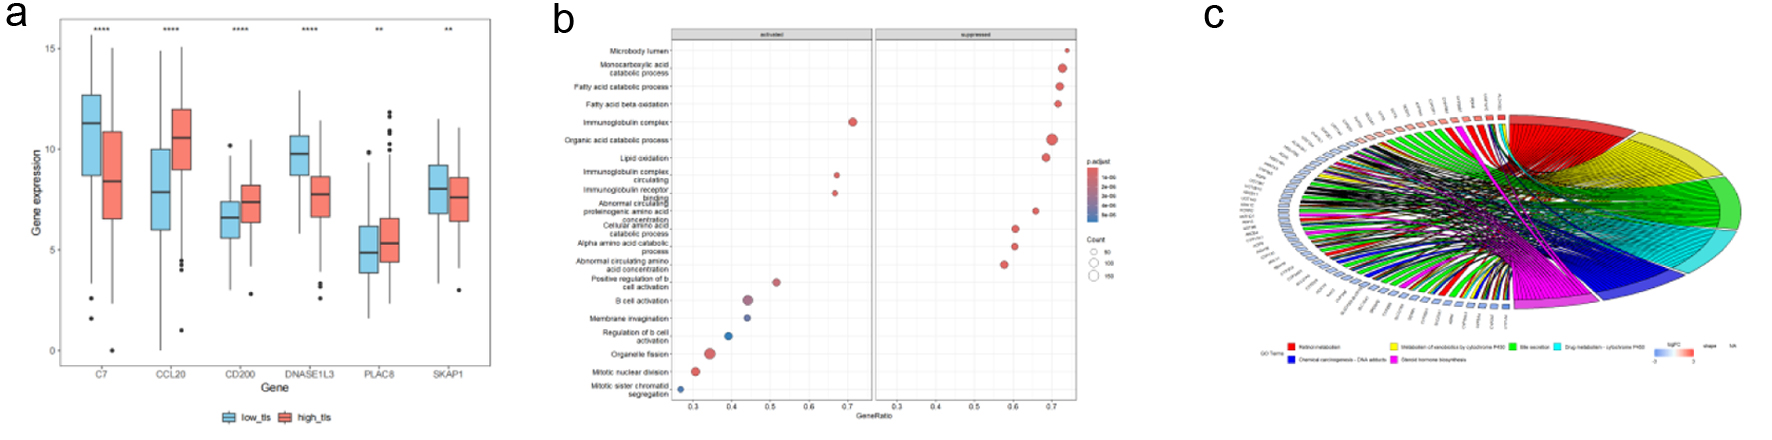 Click for large image | Figure 9. TCGA HCC patient TLS-based subgroup enrichment. (a) Boxplots demonstrating TLS-related model gene expression differences between high and low TLS scores. Red boxes mean high-TLS, blue boxes means low-TLS. (b) GSEA bubble plot showing differentially expressed genes in biological processes between groups. (c) In high and low TLS score groups, KEGG chord diagrams reveal links between differentially expressed genes (left) and their enriched pathways (right). |
Genomic alterations and drug sensitivity associated with TLS score
We performed a mutational landscape analysis and visualized the top 30 most frequently mutated genes in the high- and low-TLS (Fig. 10a, b). The two groups had different mutational patterns. Most mutated genes in the low TLS score group were CTNNB1 (33%), TTN (27%), and TP53 (19%). In contrast, in high-TLS, TP53 mutations were most prevalent (41%), followed by TTN (28%) and CTNNB1 (19%). Additionally, we assessed the predicted drug sensitivity of tumors across TLS score groups. The analysis predicted a higher sensitivity for tumors with low TLS scores to commonly used chemotherapeutic agents, including oxaliplatin, sorafenib (Sorafenib_1085), and gemcitabine (Fig. 10c).
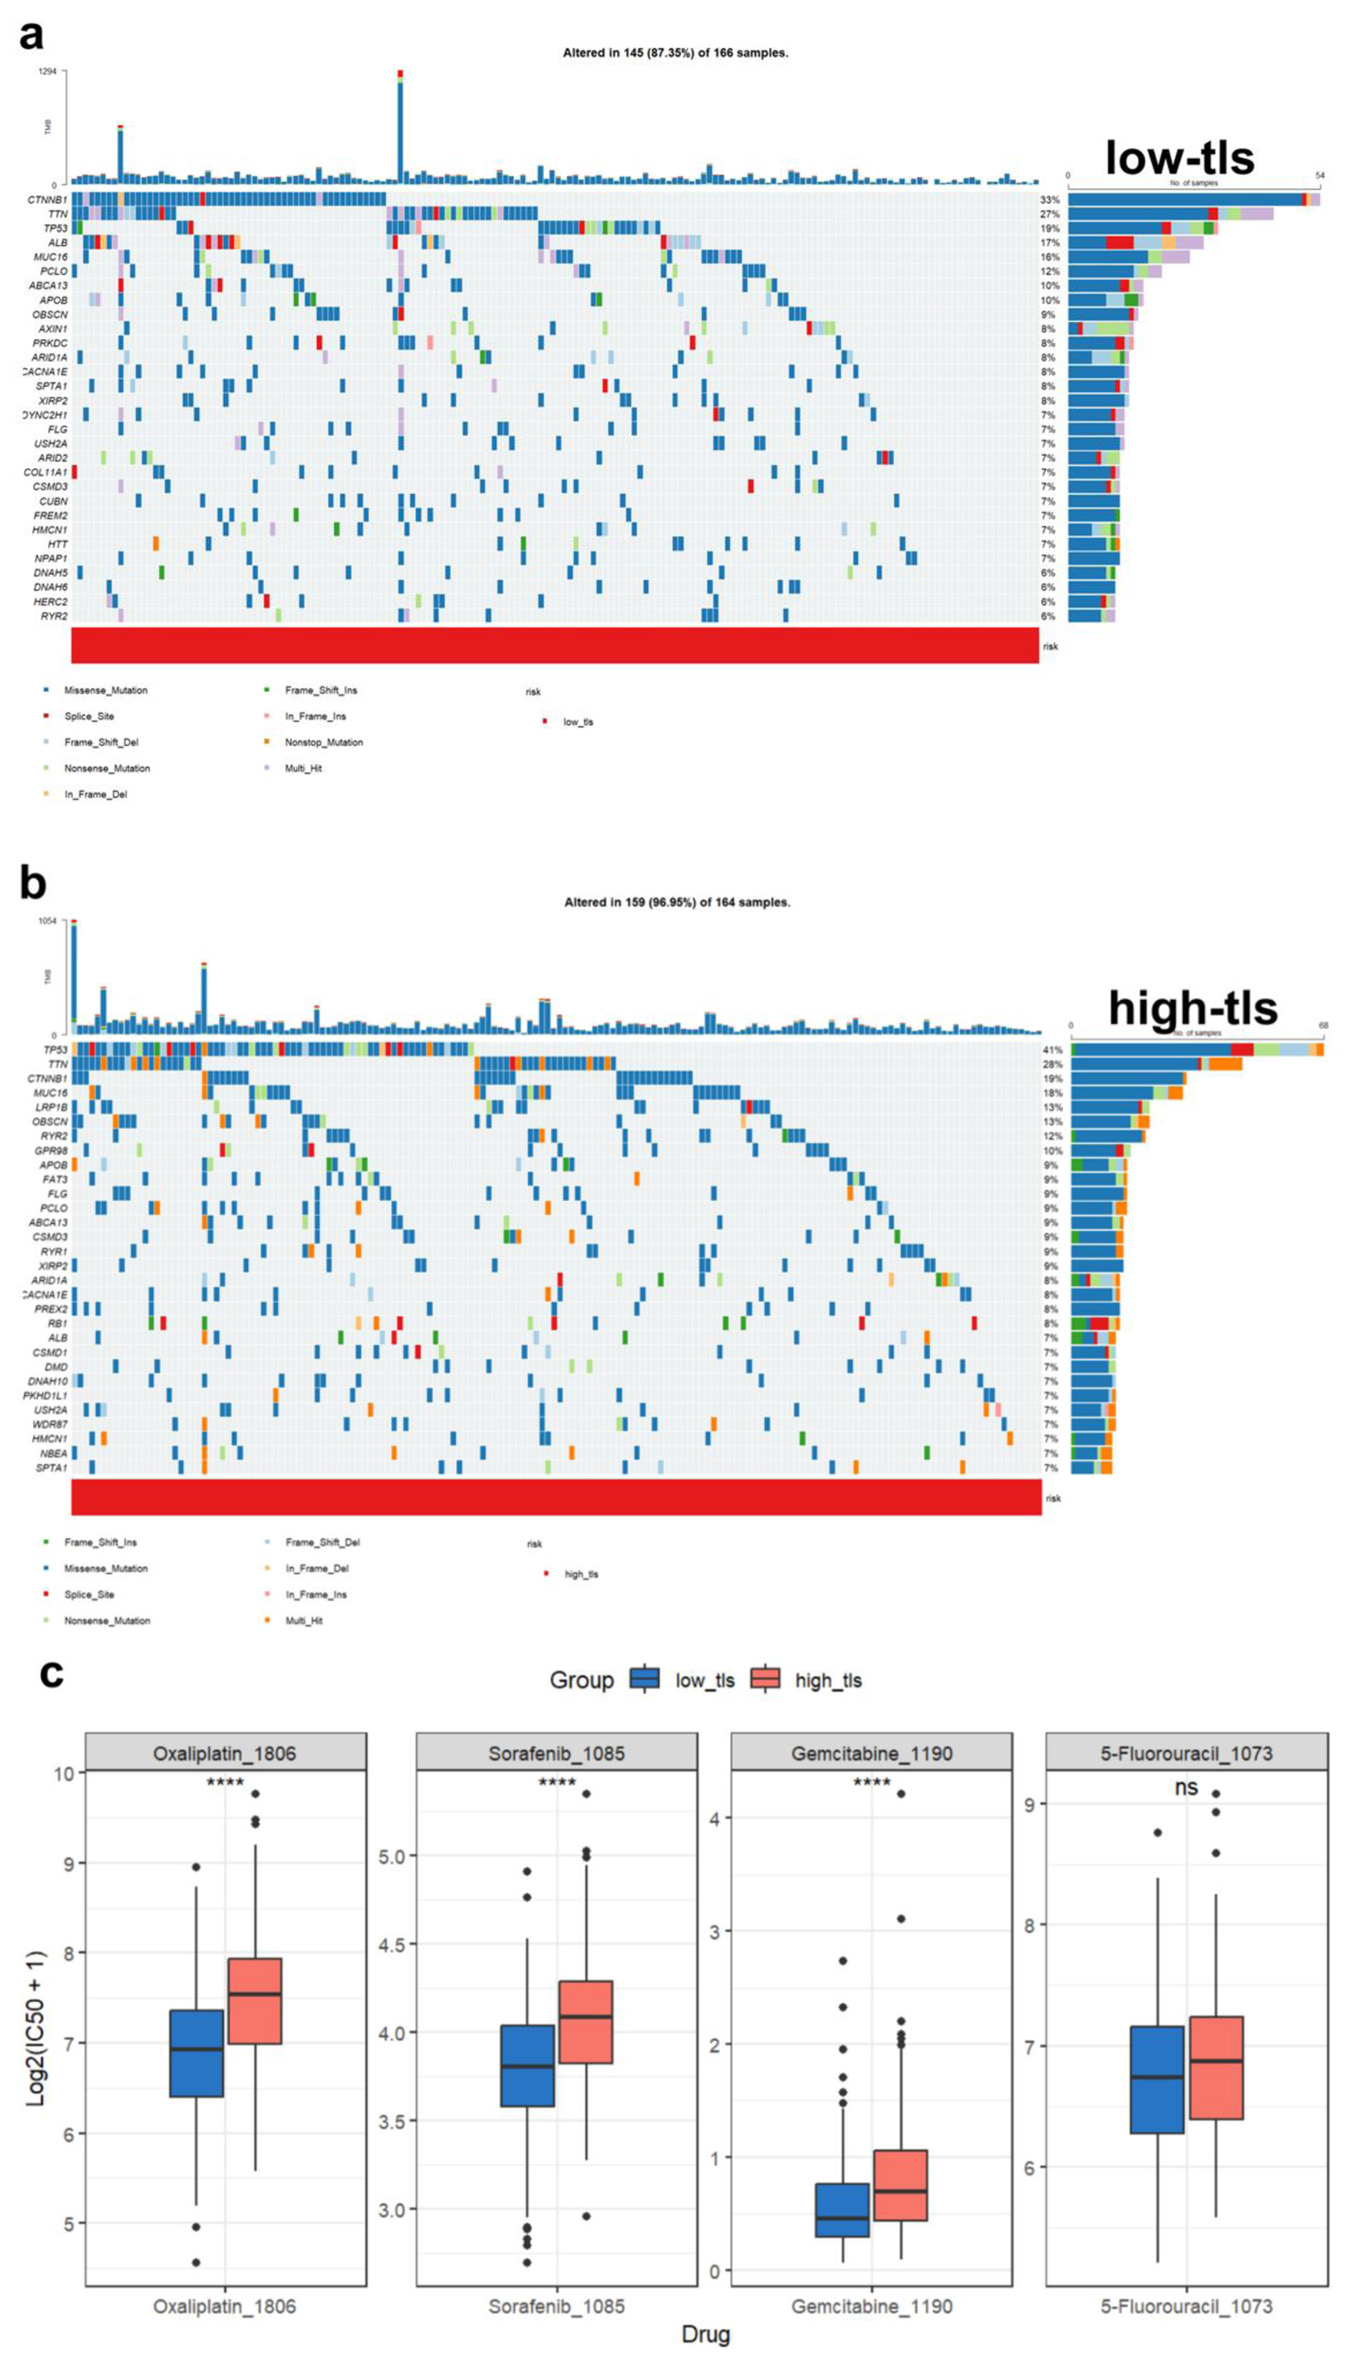 Click for large image | Figure 10. Tumor mutation landscape and drug sensitivity analysis. (a) Waterfall plot of low TLS score HCC patients’ most commonly altered genes. Mutation kinds are colored. (b) Waterfall plot of high TLS score HCC patients’ most commonly altered genes. Mutation kinds are colored. (c) Different TLS score groups’ HCC medication sensitivity predictions. Oxaliplatin, sorafenib (Sorafenib_1085), gemcitabine, and 5-fluorouracil are sensitive. |
Immune cell infiltration characteristics associated with TLS in HCC
To determine how TLS-related genes affect HCC TIME, we employed a multi-scale data analysis strategy. First, using bulk mRNA expression patterns from the TCGA HCC cohort, we estimated 22 immune cell subtype abundances using the CIBERSORT method.
We then evaluated the connections between TLS model gene expression and immune cell infiltration patterns and critical immunological checkpoint gene expression (Fig. 11a, b). The results demonstrated that TLS model gene expression was significantly associated with the abundance of multiple immune cell types and the expression of ICI-related genes, suggesting that TLS-related genes may modulate immune infiltration and regulation in the HCC microenvironment.
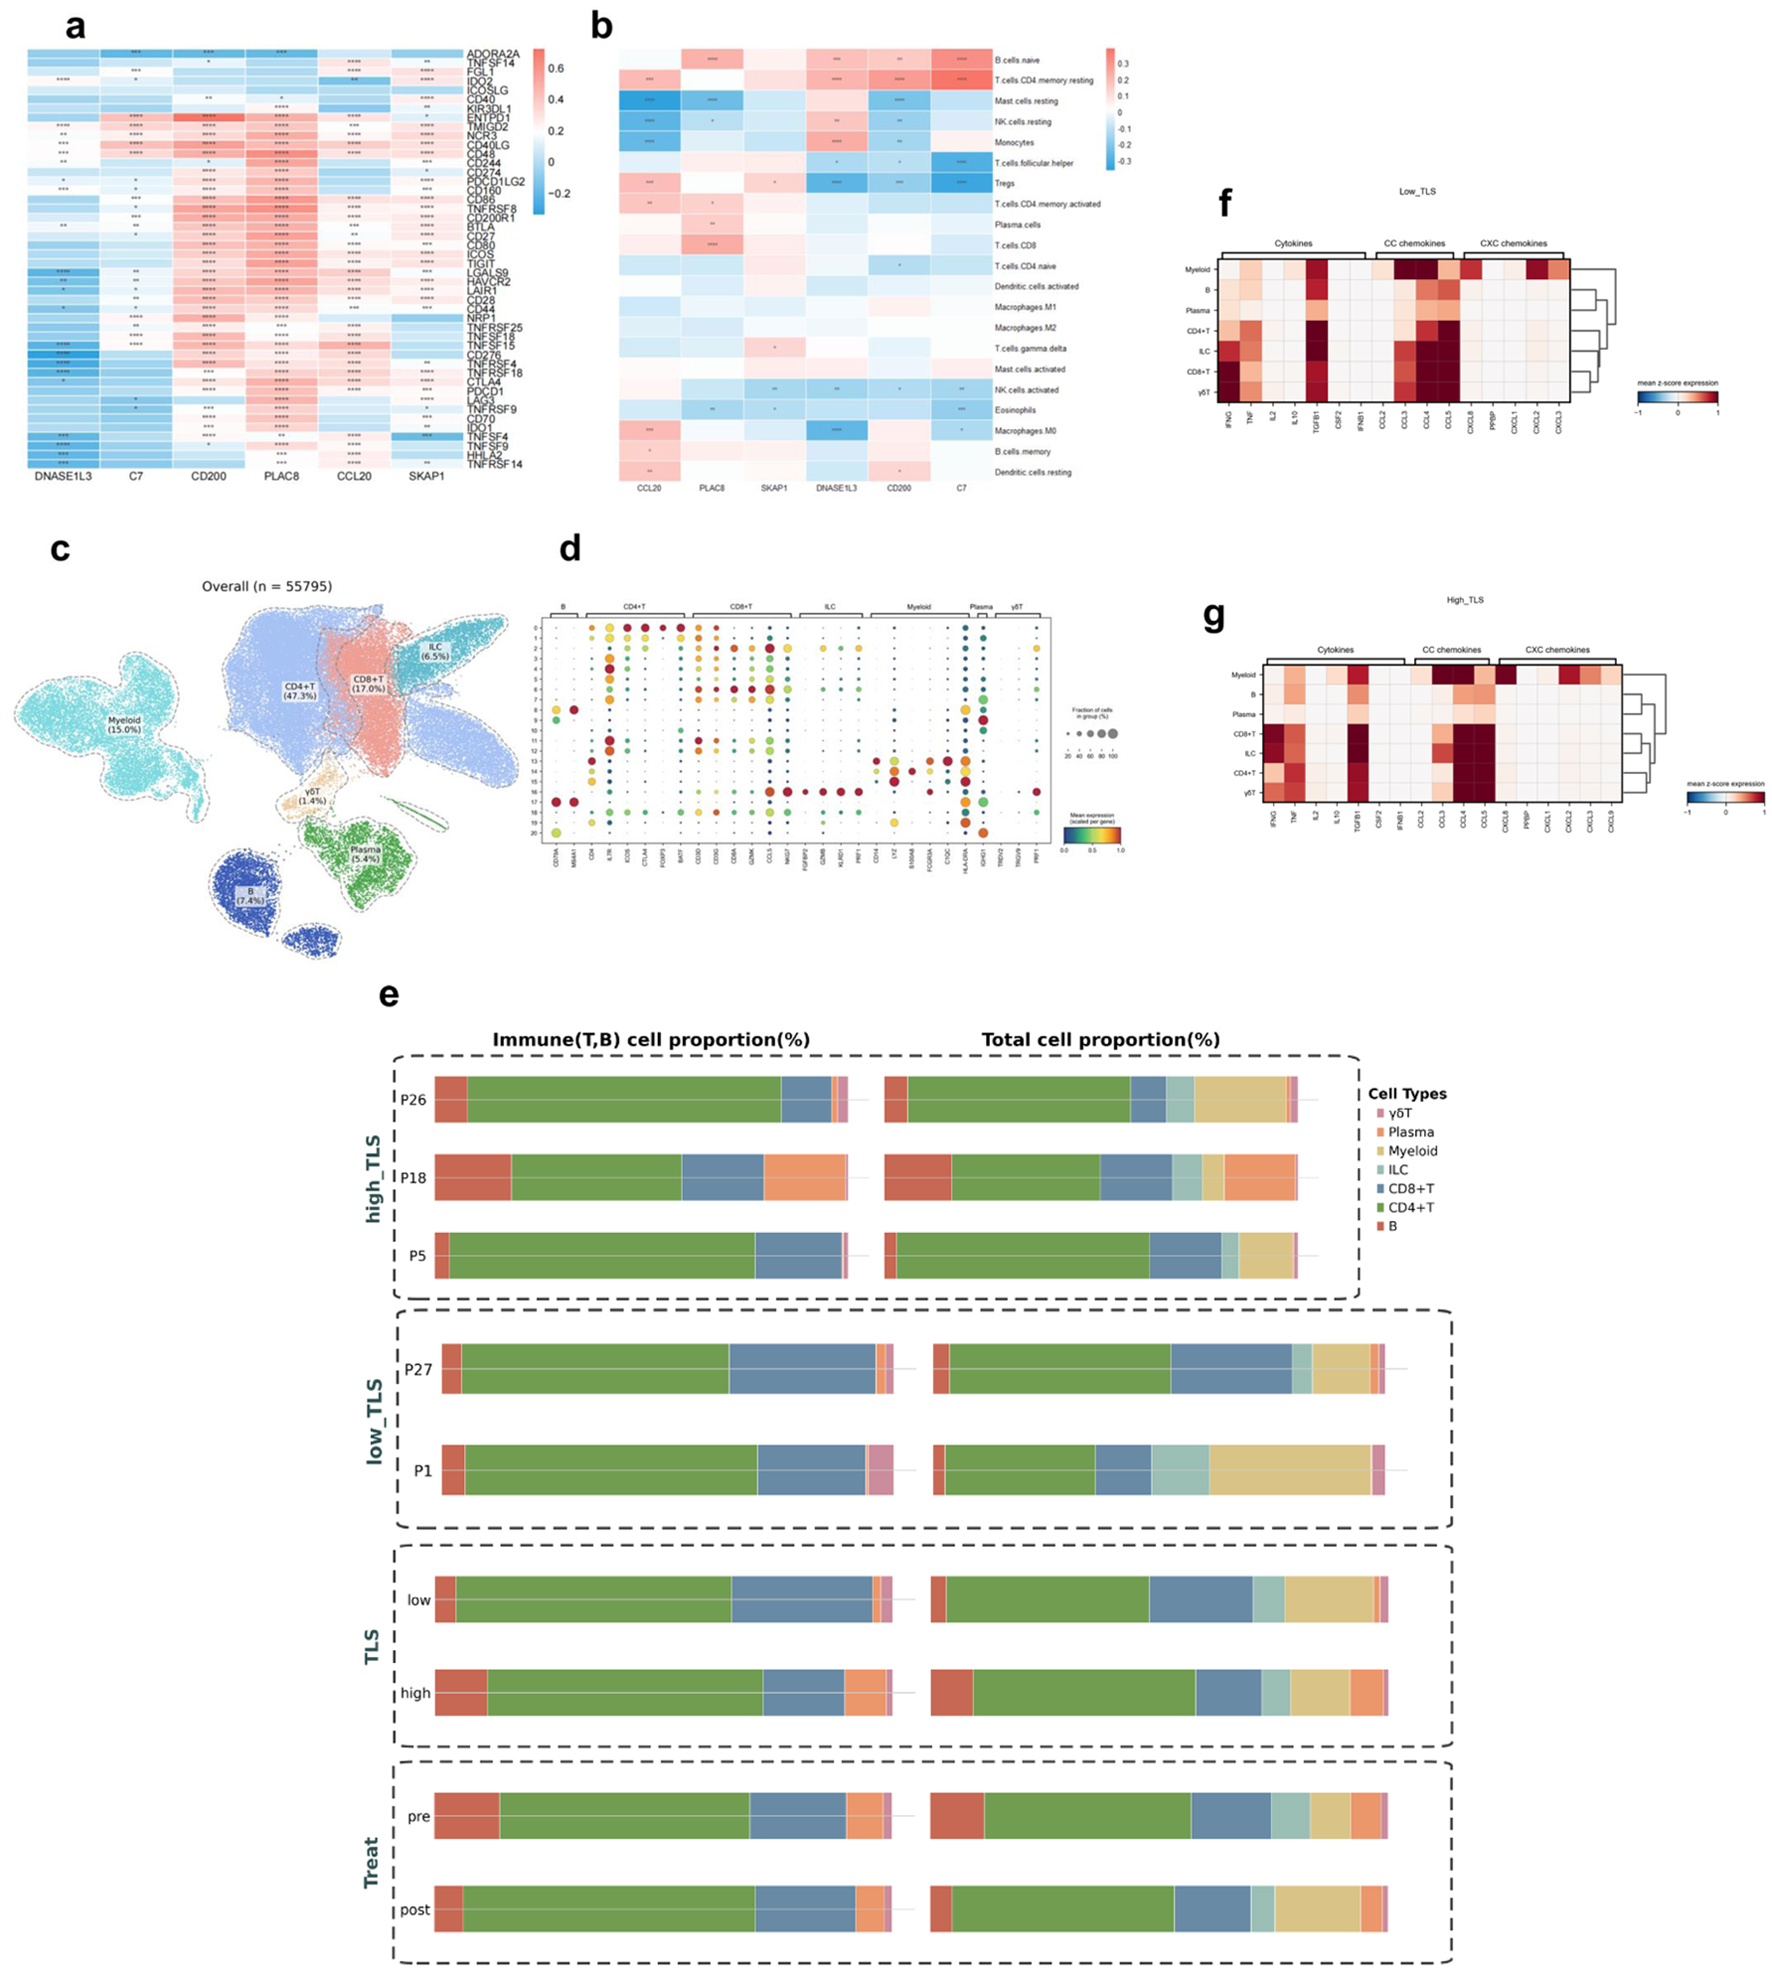 Click for large image | Figure 11. Immune cell infiltration analysis in HCC. Asterisks indicate statistical significance: *P < 0.05; **P < 0.01; ***P < 0.001. (a) Heatmap of TLS model gene-immune checkpoint inhibitor gene associations. Positive correlation is red, negative correlation is blue. (b) Immune cell type abundance and TLS model gene association heatmap. Positive correlation is red, negative correlation is blue. (c) UMAP map of GSE235863 tumor-derived immune cells (n = 55,795). (d) Signature gene expression bubble heatmap across immune cell types. Bubble size indicates cell proportions. (e) Immune cell composition bar graphs. Left panel: T/B cell proportions; right panel: T/B cell, myeloid, ILC ratio. TLS: overall group comparison; high_TLS: three high-score samples; low_TLS: two low-score samples; pre- and post-treatment proportions. (f) Low-TLS score group cytokines, CC chemokines, and CXC chemokines heatmap. (g) High-TLS score group cytokines, CC chemokines, and CXC chemokines heatmap. |
To conduct an exploratory analysis at the single-cell level and gain preliminary insights into TIME characteristics under therapeutic conditions, we analyzed scRNA-seq data from the GSE235863 cohort, which includes HCC patients treated with PD-1 inhibitors and lenvatinib. A subset of patients in this cohort also had matched bulk mRNA expression data. From this dataset, we selected five samples that had both scRNA-seq and mRNA data for this pilot investigation. It should be noted that, given the small sample size (n = 5), this single-cell analysis is exploratory in nature and serves to generate hypotheses for future validation. These five samples were divided into high (n = 3) and low (n = 2) TLS score groups based on bulk mRNA expression patterns. We identified seven major immune cell populations (Fig. 11c) by performing clustering and annotation of all single cells in the GSE235863 dataset, using previously reported cell type marker genes (Fig. 11d). We then compared and visualized the proportional composition of immune cell subsets before and after treatment, as well as between the high- and low-TLS (Fig. 11e), aiming to reveal differences in TIME composition under different TLS states. Low TLS score tumors were enriched for CD8+ T cells, γδ T cells, and myeloid cells, whereas high TLS score tumors were dominated by B cells and plasma cells. The post-treatment dynamic alterations showed a reduction in B and plasma cells and an increase in CD4+ T, CD8+ T, and myeloid cells in the TME. The cytokine expression profiles, CC chemokines (primarily involved in monocyte/T-cell recruitment), and CXC chemokines (primarily involved in neutrophil recruitment) showed similar patterns across TLS groups, with no notable differences observed (Fig. 11f, g).
Single-cell analysis of T- and B-cell subsets
To explore the potential mechanisms of TIME’s dynamic renovation - particularly the effects of therapy in patients with different TLS risk profiles - our exploratory single-cell analysis focused on T- and B-cell subgroups. Based on the CIBERSORT-derived heatmap illustrating correlations between TLS model genes and immune cell populations (Fig. 12a), we performed secondary clustering of T cells. We then compared the proportional changes in T-cell subsets before and after treatment in the high- and low-TLS (Fig. 12c, d).Analysis of T-cell subsets revealed distinct compositions and dynamic changes between the high- and low-TLS groups before and after treatment (Fig. 12c, d). In the low-TLS group, the pre-treatment TIME was composed largely of exhausted T cells (Tex, 57%) and effector memory T cells (Tem, 21%). Following treatment, a significant shift was observed: the proportion of Tex cells decreased to 8%, while Tem cells expanded to 60%. Concurrently, proportions of Treg and mucosal-associated invariant T (MAIT) cells increased to 15% and 12%, respectively. Conversely, the high-TLS group exhibited a different baseline profile, which was dominated by MAIT cells (45%), Tregs (25%), and Tex cells (15%). Post-treatment, this group also showed an increase in Tem cells and a reduction in MAIT and Treg populations. However, the magnitude of these changes was less pronounced compared to the low-TLS group.
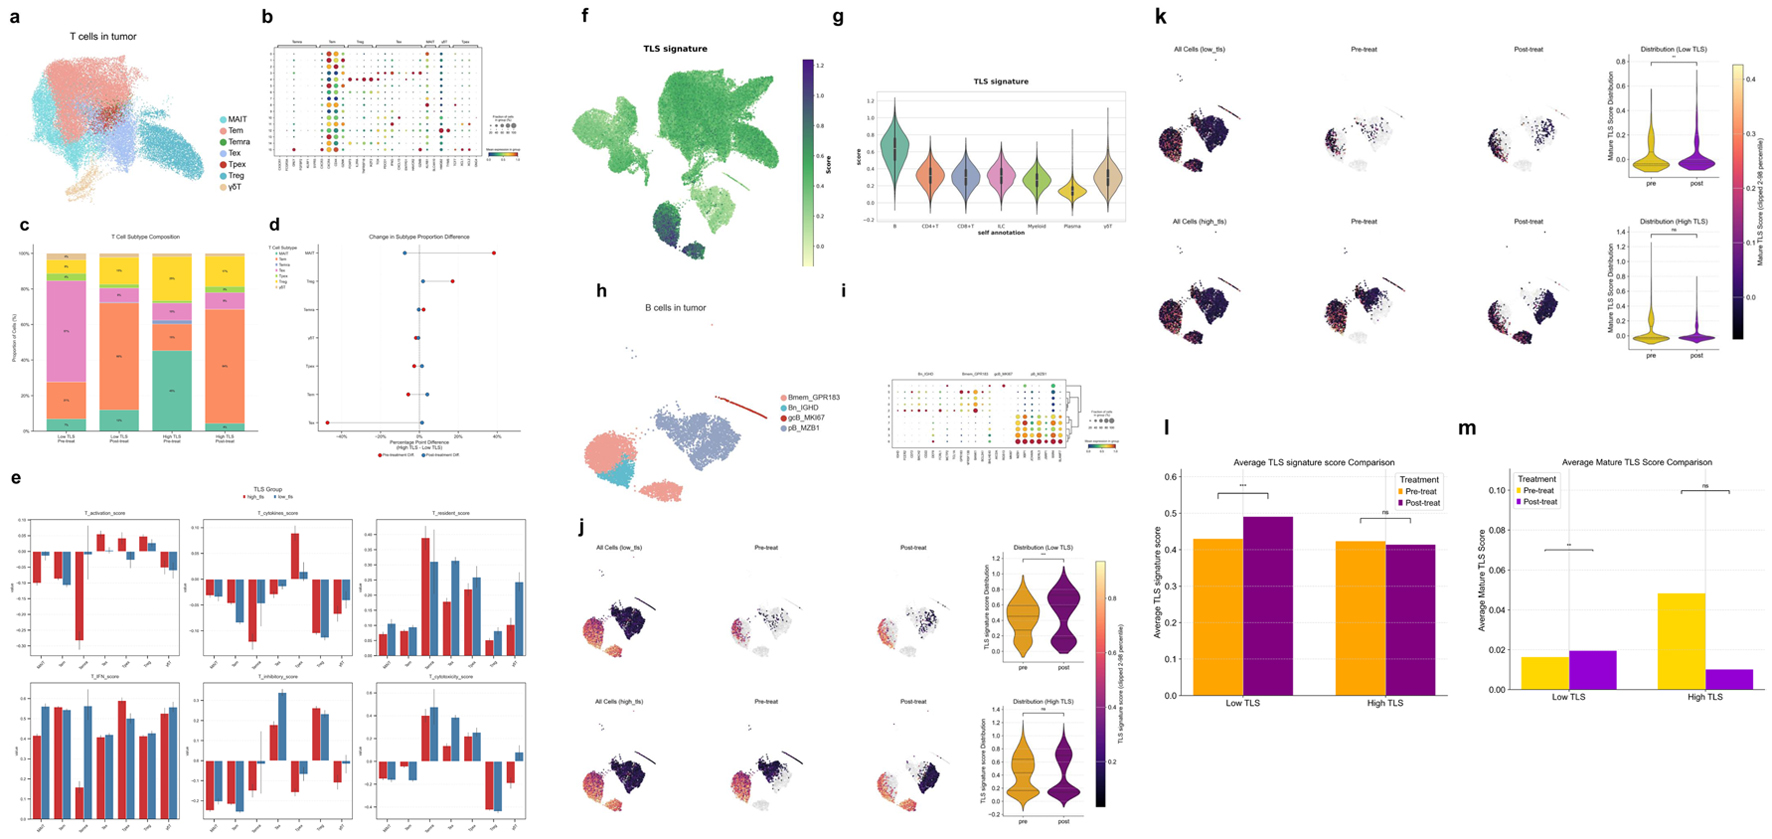 Click for large image | Figure 12. Characterization of T- and B-cell subsets and TLS-associated features in the HCC tumor microenvironment. (a) UMAP visualization of T-cell subsets derived from HCC tumor samples. (b) Bubble heatmap of hallmark gene expression in T-cell subsets. Bubble size shows cell proportion. (c) Stacked bar graphs of high and low TLS score T-cell subsets before and after therapy. (d) Dumbbell plot showing differences in T-cell subset proportions before (red) and after (blue) treatment. (e) Functional scoring of T-cell subsets across groups using various gene sets: T activation score (T-cell activation), T cytokines score (cytokine secretion), T resident score (tissue residency), T IFN score (interferon response), T inhibitory score (inhibitory function), T cytotoxicity set (cytotoxic potential). (f) UMAP plot showing TLS signature scores across different cell populations. (g) Violin plot displaying TLS signature scores across major immune cell subsets. (h) UMAP visualization of B-cell subsets derived from HCC tumors. (i) Bubble heatmap showing signature gene expression across B cell subsets. (j) UMAP and violin plots of B-cell subset TLS signature scores before and after therapy in different TLS score groups. (k) UMAP and violin plots of mature TLS scores in B-cell subsets before and after treatment in different TLS score groups. (l) Bar plots showing average TLS signature scores in B-cell subsets across treatment groups. (m) Bar plots showing average mature TLS scores in B cell subsets across treatment groups. |
To assess the functional states of T-cell subsets, we applied several T-cell gene signatures (Fig. 12e). In the high-TLS group, Tex and Treg cells exhibited higher T activation scores. In contrast, the low-TLS group was characterized by higher T resident scores at baseline. Following treatment, the low-TLS group showed a greater increase in T IFN scores. Furthermore, Tex cells from the low-TLS group had elevated T inhibitory scores. Finally, T cytotoxicity scores were significantly higher among cytotoxic T-cell subsets (Temra, Tex, progenitor exhausted T cells (Tpex), γδT) in the low-TLS group.
By projecting the TLS signature gene set onto the UMAP of HCC tumor single cells, we observed that its expression was primarily enriched in the B-cell compartment (Fig. 12f, g). Consequently, we performed a detailed subclustering and analysis of B-cell populations to further characterize these cells (Fig. 12h, i).To further investigate the effects of treatment on TLS structure and maturation within the TIME, we evaluated the dynamic changes in two distinct gene signature scores. The TLS signature score, derived from a 50-gene set (including FDCSP, MS4A1, CXCL13, CCL19; Supplementary Material 1, wjon.elmerpub.com) was used to identify and quantify the overall presence of TLS regions. Concurrently, the mature TLS score, based on an eight-gene set indicative of germinal center activity (AICDA, MKI67, CR2; Supplementary Material 2, wjon.elmerpub.com), was employed to assess the functional maturity and developmental state of these structures. In the low-TLS group, the TLS signature score significantly increased post-treatment (P < 0.001), whereas no significant change was observed in the high-TLS group (Fig. 12j, l). Similarly, the mature TLS score also showed a significant post-treatment increase in the low-TLS group (P < 0.01). Conversely, the high-TLS group exhibited a slight, non-significant downward trend in the mature TLS score after treatment (Fig. 12k, m).
| Discussion | ▴Top |
HCC remains a major clinical challenge due to its high mortality and limited therapeutic options [1, 18]. While TLS are increasingly recognized as pivotal hubs for anti-tumor immunity, their prognostic role in HCC is debated [9, 19, 20]. This inconsistency likely arises from the profound heterogeneity of TLS in terms of their location (e.g., intra-tumoral versus the invasive margin), maturation state (from early aggregates to fully formed structures with germinal centers), and cellular density. Such variability can lead to functionally distinct immune microenvironments. Therefore, a biomarker that captures a functionally relevant aspect of the TLS landscape, rather than merely their presence, is urgently needed.
Our work, like that of Liu et al [12], also focuses on the prognostic significance of TLS genes associated with HCC, sharing a four-gene backbone (PLAC8, DNASE1L3, C7, SKAP1) within a six-gene TLS signature. However, our model diverges critically by including the immunosuppressive genes CCL20 and CD200, leading to an opposing prognostic conclusion: a high-risk score in our model correlates with poorer outcomes. This design allows our signature to specifically identify a dysfunctional, “pro-tumor” TLS phenotype. We further extended the clinical relevance of this framework by validating its power to predict responses to contemporary therapies such as ICIs and lenvatinib. Mechanistically, our single-cell analysis provided a direct link between the high-risk signature and the accumulation of Tregs and Tex, offering a high-resolution explanation for the heterogeneous role of TLS in HCC.
The biological functions of the six signature genes provide strong mechanistic rationale for the model’s prognostic power. The high-risk factors CCL20 and CD200 are known promoters of immune evasion, with CCL20 directly implicated in HCC progression [21-23]. Conversely, DNASE1L3 acts as a protective tumor suppressor in HCC by inhibiting the PI3K/AKT pathway [24]. While studied in other contexts, the remaining genes have clear oncogenic relevance: PLAC8 enhances chemoresistance via PD-L1 and promotes tumorigenesis [25, 26], while the T-cell adaptor SKAP1 and complement component C7 have established prognostic roles in cancer [27, 28]. By integrating these diverse signals - spanning immune evasion, tumor suppression, and oncogenic signaling - the model effectively captures the multifaceted biology of HCC.
Our study validates the clinical usefulness of the TLS score in HCC through testing. In survival analyses across four independent cohorts, the score effectively stratified patients, with a low TLS score consistently predicting longer OS. Despite a lack of statistical significance in the small GSE202069 cohort, the model’s prognostic accuracy was upheld by time-dependent ROC curves. Beyond prognosis, the TLS score predicted therapeutic outcomes. A low score was significantly associated with better treatment response in three separate cohorts (TACE, PD-L1 blockade, and combination therapy), evidenced by high AUCs (0.746, 0.875, 0.727). Further support came from TIDE analysis, which predicted a better response to immunotherapy for patients with low-TLS scores (P = 0.018, Fig. 6d) and who exhibited lower TIDE scores, indicative of reduced immune evasion potential [15]. Mechanistic investigation revealed that this predictive power stems from the underlying T-cell states; responders showed a notable enrichment of cytotoxic and progenitor exhausted T cells (Tpex), which are critical for anti-tumor immunity [29]. Pathway analysis further elucidated distinct regulatory patterns in responders across different treatment modalities. Ultimately, by integrating the TLS score with clinical characteristics in a nomogram, we confirmed its robust and independent prognostic value, highlighting its readiness for clinical implementation.
In conclusion, our multi-cohort, multi-dimensional analysis suggests that the TLS score may be a promising and independent predictive biomarker for HCC. It appears to hold potential for risk stratification, potentially informing treatment decision-making, and guiding future immunotherapeutic strategies in the context of precision oncology.
To explore the biological mechanisms underlying the TLS score, we analyzed pathway enrichments in patient subgroups. High-TLS score patients showed significant enrichment in B-cell activation and immunoglobulin complex pathways. This aligns with the function of TLS as sites for antibody production, where plasma cells can enhance anti-tumor responses through antibody-dependent cellular cytotoxicity [30]. Conversely, the low-TLS score group, associated with a superior prognosis, was characterized by the upregulation of metabolic and detoxification pathways, such as bile secretion and drug metabolism. These comparative functions indicate that the prognostic ability of TLS scores reflects the relationship between active humoral immune response and metabolic capacity.
Analysis of the HCC mutational landscape confirmed the prevalence of key driver mutations, including TP53, CTNNB1, and ARID1A [31, 32]. Crucially, we identified a significant enrichment of TP53 and LRP1B mutations within the high-TLS score group, suggesting these alterations are linked to the underlying tumor immunobiology. The association with TP53 mutations is particularly noteworthy, as they not only promote tumorigenesis [33] but also actively shape an immunosuppressive microenvironment via the interleukin-34 (IL-34)/tumor-associated macrophage (TAM) axis, which inhibits CD8+ T cell function [34]. In contrast to other common mutations such as CTNNB1 and ARID1A, which have complex and sometimes conflicting roles in prognosis and therapy response [35-38], our analysis highlights a more specific signature. Concurrently, the enrichment of LRP1B mutations, previously identified as an independent prognostic risk factor in HCC [39], may further impair anti-tumor immunity by altering immune cell infiltration patterns [40]. Together, these findings highlight that a specific mutational signature (TP53 and LRP1B) correlates with a high TLS score and likely contributes to the immunosuppressive phenotype and poor prognosis in these patients.
The enrichment of mutations like TP53 and LRP1B in the high-TLS group, which are linked to therapeutic resistance pathways [40], prompted us to assess the TLS score’s potential in predicting drug response. In line with this hypothesis, our in silico analysis revealed that a low TLS score was associated with a higher predicted sensitivity to several standard agents, including oxaliplatin, sorafenib, and gemcitabine. While these computational predictions require rigorous clinical validation, they suggest that the TLS score may capture a biological state that influences sensitivity to chemotherapy and targeted therapies, highlighting a potential avenue for patient stratification in future studies.
Our study reveals that the expression patterns of TLS-related genes, particularly CCL20, CD200, PLAC8, and SKAP1, are closely linked to the immunoregulatory state of the HCC TME. These genes positively correlated with immune checkpoints like PD-1/PD-L1 and were associated with T- and B-cell abundance (Fig. 11a, b), linking the TLS signature directly to an immune-active TME. At single-cell resolution (GSE235863), we further elucidated the distinct immune compositions defined by the TLS score in patients undergoing combination therapy (anti-PD-1 + lenvatinib). High-TLS score tumors were dominated by B and plasma cells, whereas low-TLS score tumors were enriched for CD8+ T cells, γδ T cells, and myeloid cells (Fig. 11c, e). Post-treatment, the TME composition shifted towards a more T-cell and myeloid-infiltrated state, with a corresponding reduction in B and plasma cells. Intriguingly, despite these substantial differences in cellular composition between TLS groups and the dynamic shifts post-therapy, we observed no significant changes in the T-cell cytokine profiles or the broader CC/CXC chemokine landscape (Fig. 11f, g). This suggests that while the TLS score effectively captures distinct immune infiltration patterns and their response to therapy, the underlying mechanisms driving TME remodeling are complex and may not be directly governed by broad alterations in the chemokine signaling milieu.
To elucidate the differential therapeutic responses between TLS groups, we dissected T- and B-cell subsets at high resolution (Fig. 12a, h). Our analysis revealed that the two TLS subtypes possessed starkly different immunological starting points. The low-TLS group was characterized by a high proportion of Tex cells (57%), representing an ideal reservoir of targets for PD-1 blockade. In contrast, the high-TLS group presented a profoundly immunosuppressive microenvironment, dominated by Tregs (25%) and MAIT cells (45%), with a much smaller population of reinvigoratable Tex cells (15%). This pre-existing landscape, defined by potent suppressive elements [41] and an atypical MAIT-cell infiltration [42], likely underpins primary resistance to therapy. Following treatment, these divergent baselines led to distinct immunological trajectories (Fig. 12c, d). Low-TLS tumors underwent a robust reprogramming, with Tex cells plummeting to 8% as Tem cells dramatically expanded to 60%, signifying a successful shift from an exhausted to an effector-dominant state. The response in the high-TLS group, however, was far more attenuated. Their blunted therapeutic efficacy appears to stem from a combination of factors: strong baseline immunosuppression, a limited pool of targetable Tex cells for PD-1 blockade [43], and a non-classical immune milieu dominated by MAIT cells. To functionally validate these shifts in T-cell states, we applied signature gene sets to assess their functional profiles [44] (Fig. 12e).
Our analysis revealed fundamental differences in the TIME between high- and low-TLS groups. The TIME of the low-TLS group was enriched for T-cell subsets with superior cytotoxicity, tissue residency, and a stronger IFN response to therapy. Notably, elevated checkpoint expression within their Tex cells implied greater responsiveness to ICI therapy. Conversely, the high-TLS group was characterized by an immunosuppressive TIME, consistent with its inferior clinical outcomes.
Further investigation showed that the TLS signature gene set was primarily enriched in the B-cell compartment, suggesting a central role for B cells in TLS formation and maintenance [45]. Crucially, treatment significantly induced or promoted the maturation of TLS in the low-TLS group, reflected by increased TLS signature and mature TLS scores [46]. In contrast, TLS structures in the high-TLS group showed no significant change and even a regressive trend. This differential structural remodeling in response to therapy may partly explain the disparate immune responses and clinical outcomes observed between the two groups.
While our findings are compelling, several limitations must be acknowledged. First, this study is retrospective and relies on publicly available datasets, which introduces inherent variability and potential confounding factors. It is critical to acknowledge that our signature was derived from bulk RNA-sequencing, thus representing a TLS-associated context rather than a TLS-specific program. Bulk sequencing data cannot distinguish signals from TLS-resident cells from the surrounding heterogeneous microenvironment, which may limit the biological specificity of our findings. Second, the cohorts used to validate treatment response were small, particularly for immunotherapy, which limits the statistical power and generalizability of these specific findings. Third, our analyses are correlational and lack direct functional validation; in vitro and in vivo experiments are needed to confirm the mechanistic roles of the signature genes. Finally, as noted, the single-cell analysis was exploratory due to its small sample size (n = 5) and requires validation in larger, prospective cohorts.
In conclusion, the six-gene TLS scoring model proposed in this study may serve as a potential biomarker for prognosis and therapeutic response in HCC. It could also offer further insights into the complex interplay between tumor-intrinsic mutations, the TIME - particularly the balance between Tregs and Tex cells, and T-cell functional states - and clinical outcomes. This model shows promise for improving the precision of HCC patient stratification and could help inform personalized treatment decisions, as well as shed light on TLS’ potential immunoregulatory involvement in HCC. Furthermore, it offers a valuable framework for exploring novel immunotherapeutic strategies.
Acknowledgments
We would like to thank Dr. Jianming Zeng from the University of Macau and all members of his bioinformatics team (biotrainee) for generously sharing their experience and code.
Financial Disclosure
This work was supported by the Key Talent Support Program of the Jilin Provincial Department of Finance (2022SC202).
Conflict of Interest
The authors declare that there is no conflict of interest in the publication of this article.
Informed Consent
All subjects provided written informed consent.
Author Contributions
Xiang Yin Kong and Xiao Hao Li wrote the main article as well as drew the main graphics. Xing Long Qiu, Ming Yu Ma, Jin Hao Liu, and Zi Chun Wang were responsible for optimizing the graphics and correcting the errors in statement. Zi Hui Meng and Shang Wei Ji were responsible for the overall instruction of the article and the optimization of the graphics.
Data Availability
The datasets analyzed in this study are publicly available from the TCGA database (https://portal.gdc.cancer.gov/analysis_page?app=Projects, TCGA-LIHC project) and the GEO repository (https://www.ncbi.nlm.nih.gov/geo/) under accession numbers GSE14520, GSE202069, GSE104580, GSE279750, and GSE235863.
| References | ▴Top |
- Rumgay H, Arnold M, Ferlay J, Lesi O, Cabasag CJ, Vignat J, Laversanne M, et al. Global burden of primary liver cancer in 2020 and predictions to 2040. J Hepatol. 2022;77(6):1598-1606.
doi pubmed - Rafaqat S, Noshair I, Shahid M, Bibi S, Hafeez R, Hamid H. Correlation between prognostic markers and clinical parameters in hepatocellular carcinoma: Pathophysiological aspects to therapeutic targets. World J Gastrointest Oncol. 2025;17(5):106278.
doi pubmed - Shang ZK, Zhang JH, Zhu JH, Deng CS, Chen XY, Ran X, Sun CQ. Potential of neoadjuvant hepatic artery perfusion chemotherapy in improving surgical outcomes in hepatocellular carcinoma: a systematic review and meta-analysis. World J Surg Oncol. 2025;23(1):207.
doi pubmed - Jiang N, Zhong B, Huang J, Li W, Zhang S, Zhu X, Ni C, et al. Transarterial chemoembolization combined with molecularly targeted agents plus immune checkpoint inhibitors for unresectable hepatocellular carcinoma: a retrospective cohort study. Front Immunol. 2023;14:1205636.
doi pubmed - Zhang Z, Huang W, Hu D, Jiang J, Zhang J, Wu Z, Wen J, et al. E-twenty-six-specific sequence variant 5 (ETV5) facilitates hepatocellular carcinoma progression and metastasis through enhancing polymorphonuclear myeloid-derived suppressor cell (PMN-MDSC)-mediated immunosuppression. Gut. 2025;74(7):1137-1149.
doi pubmed - Gago da Graca C, van Baarsen LGM, Mebius RE. Tertiary lymphoid structures: diversity in their development, composition, and role. J Immunol. 2021;206(2):273-281.
doi pubmed - Barone F, Gardner DH, Nayar S, Steinthal N, Buckley CD, Luther SA. Stromal fibroblasts in tertiary lymphoid structures: a novel target in chronic inflammation. Front Immunol. 2016;7:477.
doi pubmed - Schumacher TN, Thommen DS. Tertiary lymphoid structures in cancer. Science. 2022;375(6576):eabf9419.
doi pubmed - Pu L, Zhang X, Pu C, Zhou J, Li J, Wang X, Xi C, et al. Genetic association of tertiary lymphoid structure-related gene signatures with HCC based on Mendelian randomization and machine learning and construction of prognosis model. Int Immunopharmacol. 2025;144:113594.
doi pubmed - Yan C, Niu Y, Li F, Zhao W, Ma L. System analysis based on the pyroptosis-related genes identifies GSDMC as a novel therapy target for pancreatic adenocarcinoma. J Transl Med. 2022;20(1):455.
doi pubmed - Cabrita R, Lauss M, Sanna A, Donia M, Skaarup Larsen M, Mitra S, Johansson I, et al. Tertiary lymphoid structures improve immunotherapy and survival in melanoma. Nature. 2020;577(7791):561-565.
doi pubmed - Liu Y, Li CB, Zhai YP, Zhang SK, Li DY, Gao ZQ, Liang RP. Identification and validation of a novel tertiary lymphoid structures-related prognostic gene signature in hepatocellular carcinoma. World J Oncol. 2024;15(4):695-710.
doi pubmed - Subramanian A, Tamayo P, Mootha VK, Mukherjee S, Ebert BL, Gillette MA, Paulovich A, et al. Gene set enrichment analysis: a knowledge-based approach for interpreting genome-wide expression profiles. Proc Natl Acad Sci U S A. 2005;102(43):15545-15550.
doi pubmed - Yang JM, Zhang N, Luo T, Yang M, Shen WK, Tan ZL, Xia Y, et al. TCellSI: A novel method for T cell state assessment and its applications in immune environment prediction. Imeta. 2024;3(5):e231.
doi pubmed - Jiang P, Gu S, Pan D, Fu J, Sahu A, Hu X, Li Z, et al. Signatures of T cell dysfunction and exclusion predict cancer immunotherapy response. Nat Med. 2018;24(10):1550-1558.
doi pubmed - Tang Z, Kang B, Li C, Chen T, Zhang Z. GEPIA2: an enhanced web server for large-scale expression profiling and interactive analysis. Nucleic Acids Res. 2019;47(W1):W556-W560.
doi pubmed - Fu Z, Cai W, LONG Q, Lu W. DNASE1L3 expression and its impact on prognosis in hepatocellular carcinoma based on bioinformatics. Medical Journal of Wuhan University. 2024;45(08):939-945.
doi - European Association for the Study of the Liver. EASL clinical practice guidelines: management of hepatocellular carcinoma. J Hepatol. 2018;69(1):182-236.
doi pubmed - Calderaro J, Petitprez F, Becht E, Laurent A, Hirsch TZ, Rousseau B, Luciani A, et al. Intra-tumoral tertiary lymphoid structures are associated with a low risk of early recurrence of hepatocellular carcinoma. J Hepatol. 2019;70(1):58-65.
doi pubmed - Feng H, Yang F, Qiao L, Zhou K, Wang J, Zhang J, Tian T, et al. Prognostic significance of gene signature of tertiary lymphoid structures in patients with lung adenocarcinoma. Front Oncol. 2021;11:693234.
doi pubmed - Zhang R, Dong M, Tu J, Li F, Deng Q, Xu J, He X, et al. PMN-MDSCs modulated by CCL20 from cancer cells promoted breast cancer cell stemness through CXCL2-CXCR2 pathway. Signal Transduct Target Ther. 2023;8(1):97.
doi pubmed - Nip C, Wang L, Liu C. CD200/CD200R: Bidirectional Role in Cancer Progression and Immunotherapy. Biomedicines. 2023;11(12):3326.
doi pubmed - Huang F, Geng XP. Chemokines and hepatocellular carcinoma. World J Gastroenterol. 2010;16(15):1832-1836.
doi pubmed - Chen QY, Li L, Suo DQ. DNase1L3 suppresses hepatocellular carcinoma growth via inhibiting complement autocrine effect. Neoplasma. 2021;68(4):683-691.
doi pubmed - Gong K, Gong ZJ, Lu PX, Ni XL, Shen S, Liu H, Wang JW, et al. PLAC8 overexpression correlates with PD-L1 upregulation and acquired resistance to chemotherapies in gallbladder carcinoma. Biochem Biophys Res Commun. 2019;516(3):983-990.
doi pubmed - Kinsey C, Balakrishnan V, O'Dell MR, Huang JL, Newman L, Whitney-Miller CL, Hezel AF, et al. Plac8 links oncogenic mutations to regulation of autophagy and is critical to pancreatic cancer progression. Cell Rep. 2014;7(4):1143-1155.
doi pubmed - Raab M, Strebhardt K, Rudd CE. Immune adaptor SKAP1 acts a scaffold for Polo-like kinase 1 (PLK1) for the optimal cell cycling of T-cells. Sci Rep. 2019;9(1):10462.
doi pubmed - Ying L, Zhang F, Pan X, Chen K, Zhang N, Jin J, Wu J, et al. Complement component 7 (C7), a potential tumor suppressor, is correlated with tumor progression and prognosis. Oncotarget. 2016;7(52):86536-86546.
doi pubmed - Waibl Polania J, Hoyt-Miggelbrink A, Tomaszewski WH, Wachsmuth LP, Lorrey SJ, Wilkinson DS, Lerner E, et al. Antigen presentation by tumor-associated macrophages drives T cells from a progenitor exhaustion state to terminal exhaustion. Immunity. 2025;58(1):232-246.e236.
doi pubmed - Meylan M, Petitprez F, Becht E, Bougouin A, Pupier G, Calvez A, Giglioli I, et al. Tertiary lymphoid structures generate and propagate anti-tumor antibody-producing plasma cells in renal cell cancer. Immunity. 2022;55(3):527-541.e525.
doi pubmed - Pinyol R, Sia D, Llovet JM. Immune Exclusion-Wnt/CTNNB1 Class Predicts Resistance to Immunotherapies in HCC. Clin Cancer Res. 2019;25(7):2021-2023.
doi pubmed - Wang S, Shi H, Liu T, Li M, Zhou S, Qiu X, Wang Z, et al. Mutation profile and its correlation with clinicopathology in Chinese hepatocellular carcinoma patients. Hepatobiliary Surg Nutr. 2021;10(2):172-179.
doi pubmed - Calderaro J, Couchy G, Imbeaud S, Amaddeo G, Letouze E, Blanc JF, Laurent C, et al. Histological subtypes of hepatocellular carcinoma are related to gene mutations and molecular tumour classification. J Hepatol. 2017;67(4):727-738.
doi pubmed - Nian Z, Dou Y, Shen Y, Liu J, Du X, Jiang Y, Zhou Y, et al. Interleukin-34-orchestrated tumor-associated macrophage reprogramming is required for tumor immune escape driven by p53 inactivation. Immunity. 2024;57(10):2344-2361.e2347.
doi pubmed - Spranger S, Bao R, Gajewski TF. Melanoma-intrinsic beta-catenin signalling prevents anti-tumour immunity. Nature. 2015;523(7559):231-235.
doi pubmed - Cleary SP, Jeck WR, Zhao X, Chen K, Selitsky SR, Savich GL, Tan TX, et al. Identification of driver genes in hepatocellular carcinoma by exome sequencing. Hepatology. 2013;58(5):1693-1702.
doi pubmed - Kim YB, Ahn JM, Bae WJ, Sung CO, Lee D. Functional loss of ARID1A is tightly associated with high PD-L1 expression in gastric cancer. Int J Cancer. 2019;145(4):916-926.
doi pubmed - Hu C, Li W, Tian F, Jiang K, Liu X, Cen J, He Q, et al. Arid1a regulates response to anti-angiogenic therapy in advanced hepatocellular carcinoma. J Hepatol. 2018;68(3):465-475.
doi pubmed - Liu F, Hou W, Liang J, Zhu L, Luo C. LRP1B mutation: a novel independent prognostic factor and a predictive tumor mutation burden in hepatocellular carcinoma. J Cancer. 2021;12(13):4039-4048.
doi pubmed - Zhai X, Xia Z, Du G, Zhang X, Xia T, Ma D, Li X, et al. LRP1B suppresses HCC progression through the NCSTN/PI3K/AKT signaling axis and affects doxorubicin resistance. Genes Dis. 2023;10(5):2082-2096.
doi pubmed - Goswami TK, Singh M, Dhawan M, Mitra S, Emran TB, Rabaan AA, Mutair AA, et al. Regulatory T cells (Tregs) and their therapeutic potential against autoimmune disorders - Advances and challenges. Hum Vaccin Immunother. 2022;18(1):2035117.
doi pubmed - Sugimoto C, Fujita H, Wakao H. Harnessing the power of mucosal-associated invariant T (MAIT) cells in cancer cell therapy. Biomedicines. 2022;10(12):3160.
doi pubmed - Liu R, Li HF, Li S. PD-1-mediated inhibition of T cell activation: Mechanisms and strategies for cancer combination immunotherapy. Cell Insight. 2024;3(2):100146.
doi pubmed - Zhu A, Chen Z, Yan Q, Jiang M, Liu X, Li Z, Li N, et al. Robust mucosal SARS-CoV-2-specific T cells effectively combat COVID-19 and establish polyfunctional resident memory in patient lungs. Nat Immunol. 2025;26(3):459-472.
doi pubmed - Bao X, Lin X, Xie M, Yao J, Song J, Ma X, Zhang X, et al. Mature tertiary lymphoid structures: important contributors to anti-tumor immune efficacy. Front Immunol. 2024;15:1413067.
doi pubmed - Tang Z, Bai Y, Fang Q, Yuan Y, Zeng Q, Chen S, Xu T, et al. Spatial transcriptomics reveals tryptophan metabolism restricting maturation of intratumoral tertiary lymphoid structures. Cancer Cell. 2025;43(6):1025-1044.e1014.
doi pubmed
This article is distributed under the terms of the Creative Commons Attribution Non-Commercial 4.0 International License, which permits unrestricted non-commercial use, distribution, and reproduction in any medium, provided the original work is properly cited.
World Journal of Oncology is published by Elmer Press Inc.