| World Journal of Oncology, ISSN 1920-4531 print, 1920-454X online, Open Access |
| Article copyright, the authors; Journal compilation copyright, World J Oncol and Elmer Press Inc |
| Journal website https://wjon.elmerpub.com |
Original Article
Volume 000, Number 000, July 2025, pages 000-000

Metabolic Reprogramming-Related Genes in Lung Adenocarcinoma: Identification and Prognostic Model Construction
Ling Zhi Liana, Fang Huanga, Jia Langa, Jing Fang Yuana, Ping Ping Hua, b, c ![]()
aDepartment of Pathology, Putuo Hospital, Shanghai University of Traditional Chinese Medicine, Shanghai 200062, China
bDepartment of Pathology, Zhenjiang Hospital of Chinese Traditional and Western Medicine, Zhenjiang, China
cCorresponding Author: Ping Ping Hu, Department of Pathology, Putuo Hospital, Shanghai University of Traditional Chinese Medicine, Shanghai 200062, China
Manuscript submitted May 2, 2025, accepted June 11, 2025, published online July 8, 2025
Short title: Metabolic Genes and Prognosis in LUAD
doi: https://doi.org/10.14740/wjon2604
| Abstract | ▴Top |
Background: Lung adenocarcinoma (LUAD), the predominant histological subtype of lung cancer, persists in presenting a dismally low 5-year overall survival (OS) rate, notwithstanding advancements in treatment modalities. There exists a pressing necessity for the identification of innovative biomarkers that can enhance prognostic assessments and facilitate individualized therapeutic strategies. The objective of this investigation was to clarify the involvement of genes associated with metabolic reprogramming in the progression of LUAD and to evaluate their viability as prognostic indicators.
Methods: An analysis of differential gene expression was performed utilizing The Cancer Genome Atlas (TCGA)-LUAD dataset, supplemented by a weighted gene co-expression network analysis (WGCNA). Through intersection analysis focusing on metabolic reprogramming genes (MRGs), pivotal differentially expressed metabolic reprogramming genes (hub DEMRGs) were identified. Consensus clustering categorized patients into subtypes based on these genes. Functional enrichment analysis and immune microenvironment characterization were conducted, followed by Cox and least absolute shrinkage and selection operator (LASSO) regression analyses to construct a prognostic risk model.
Results: A total of 31 hub DEMRGs were identified. Patients were classified into two distinct subtypes (C1 and C2), with the C2 subtype exhibiting a markedly reduced OS rate. Functional enrichment revealed significant activation of nuclear division and cell cycle pathways in C2. Immune profiling demonstrated an immunosuppressive phenotype in C2, characterized by elevated M2 macrophage infiltration and reduced CD8+ T cells. The risk model based on five critical hub DEMRGs showed robust predictive performance (area under the curve (AUC): 0.68 - 0.71), and high-risk patients displayed unique immune cell infiltration patterns.
Conclusions: This research highlights the critical role of MRGs in LUAD prognosis and their potential for clinical application. The identified subtypes and risk model provide insights into tumor heterogeneity and immunosuppressive mechanisms, offering potential targets for individualized therapy.
Keywords: Lung adenocarcinoma; Metabolic reprogramming genes; Weighted gene co-expression network analysis; Consensus clustering; Prognostic model
| Introduction | ▴Top |
Lung adenocarcinoma (LUAD), recognized as the most common histological variant of non-small cell lung cancer (NSCLC) [1], represents a considerable public health concern. The World Health Organization (WHO) reported that in 2020, there were around 2.2 million newly diagnosed lung cancer cases and 1.8 million fatalities worldwide, with an observable increase in LUAD cases particularly among non-smoking individuals in Asia [2]. In China, the age-adjusted incidence of LUAD continues to escalate; however, the 5-year survival rate remains alarmingly below 20%, especially among patients diagnosed at advanced stages [3]. This situation highlights the pressing necessity to elucidate the underlying molecular mechanisms of LUAD and to innovate effective therapeutic approaches.
The considerable variability observed in LUAD has catalyzed progress in molecular subtyping. Classifications that rely on mutations in driver genes, such as epidermal growth factor receptor (EGFR), anaplastic lymphoma kinase (ALK)/ROS proto-oncogene 1, receptor tyrosine kinase (ROS1), and Kirsten rat sarcoma viral oncogene homolog (KRAS), as well as transcriptomic characteristics have informed the development of targeted and immunotherapeutic approaches [4]. The Cancer Genome Atlas (TCGA) further revealed metabolic reprogramming features in LUAD, including enhanced glycolysis, glutamine addiction, and dysregulated lipid synthesis [5, 6]. These molecular subtypes not only influence tumor biology but also determine responses to targeted and immune therapies [7]. For instance, EGFR-mutant tumors are sensitive to tyrosine kinase inhibitors (TKIs), while KRAS-mutant tumors with high programmed death ligand-1 (PD-L1) expression may benefit from immune checkpoint inhibitors [8].
Current LUAD treatment strategies rely on staging and molecular profiling. Early-stage patients undergo surgical resection with adjuvant chemotherapy or third-generation TKIs (e.g., osimertinib) [9], whereas advanced patients receive platinum-based chemotherapy, immunotherapy (e.g., programmed death-1 (PD-1)/PD-L1 inhibitors), or targeted agents [10]. However, acquired resistance and tumor microenvironment (TME) heterogeneity lead to relapse or progression in approximately 70% of patients [11].
Metabolic reprogramming, a hallmark of cancer [12], refers to the process by which tumor cells alter normal metabolic pathways and regulatory networks to reallocate energy and biosynthetic resources, thereby supporting rapid proliferation, invasion, metastasis, and treatment resistance. This phenomenon represents an adaptive response to microenvironmental stressors such as hypoxia and nutrient deprivation, involving the coordinated remodeling of glucose, lipid, amino acid, and nucleotide metabolism. Studies indicate that LUAD cells adapt to hypoxic and nutrient-poor microenvironments through the Warburg effect [13], mitochondrial metabolic remodeling, and metabolite-mediated epigenetic regulation, thereby promoting immune evasion and distant metastasis [14]. Key metabolic enzymes such as hexokinase 2 (HK2) and glutaminase (GLS1) have emerged as potential therapeutic targets [5, 15].
Despite progress in metabolic research, systematic investigations into the prognostic value of metabolic reprogramming genes (MRGs) in LUAD remain limited. This study integrated multi-omics data to construct a metabolic gene-based risk model, aiming to uncover the metabolic heterogeneity of LUAD and its clinical implications, thereby providing a novel tool for personalized therapy.
| Materials and Methods | ▴Top |
Data collection and preprocessing
Figure 1 depicts the approach utilized in this study. Transcriptomic datasets along with clinical information pertaining to LUAD and corresponding normal tissues were sourced from the National Cancer Institute (NCI) Genomic Data Commons (GDC). The analysis encompassed a total of 503 LUAD samples that possessed comprehensive survival data, in addition to 59 normal tissue samples. Genes associated with MRGs were extracted from the GeneCards database, resulting in the identification of 1,468 protein-coding genes. Publicly available datasets were utilized in accordance with data access policies; thus, ethical approval was not required.
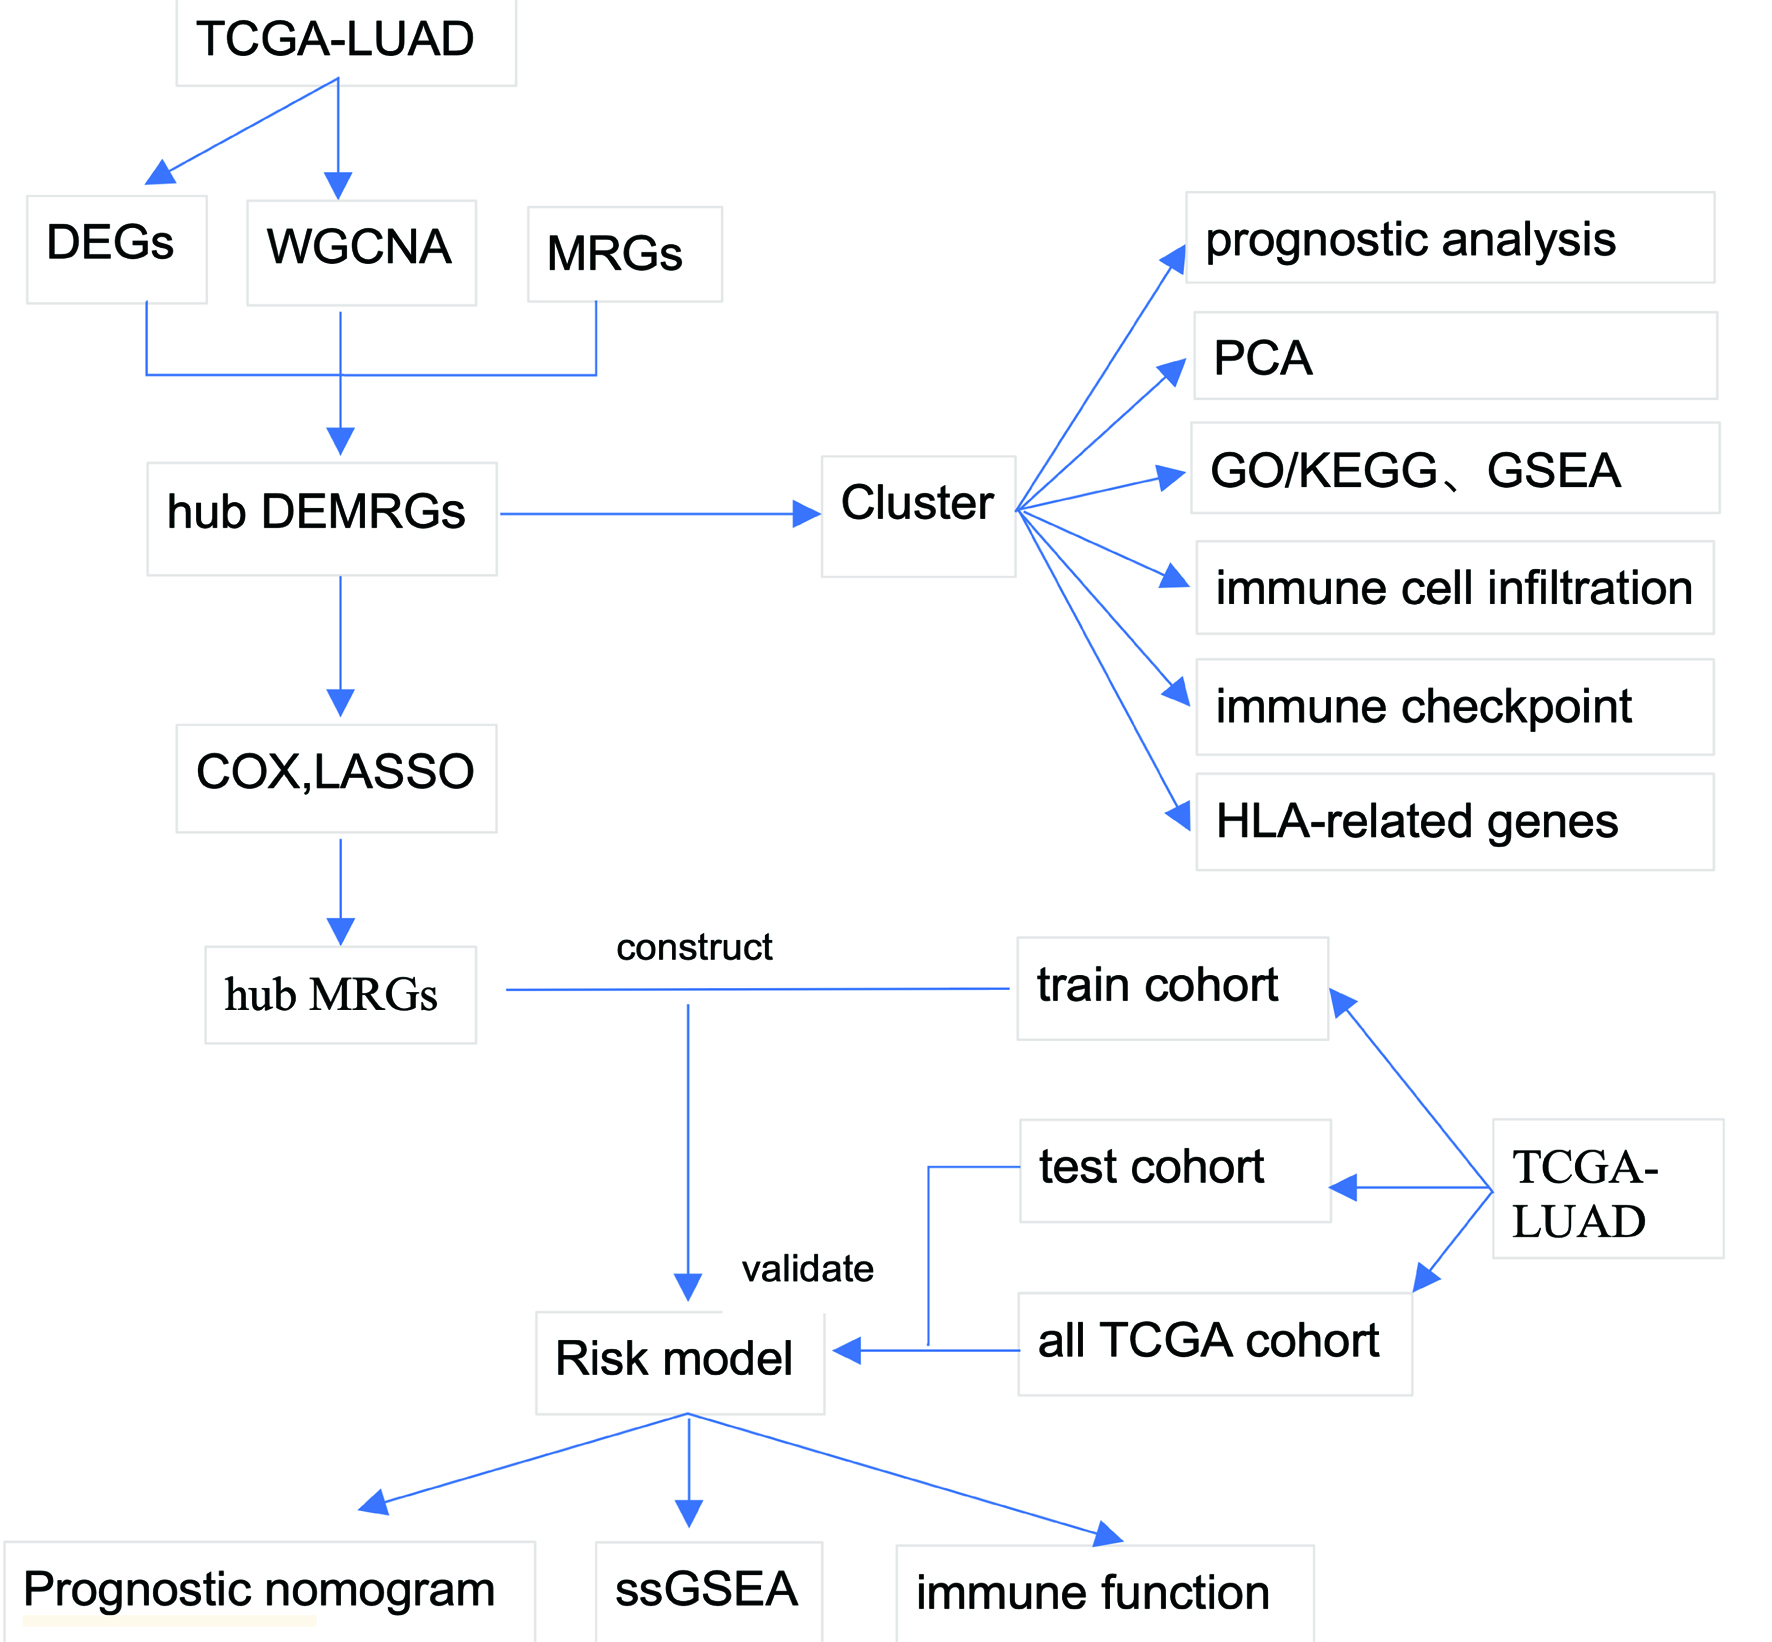 Click for large image | Figure 1. Study workflow. Schematic overview of the analytical pipeline. The workflow encompasses differential expression analysis, WGCNA, MRG integration, consensus clustering, functional enrichment, immune microenvironment characterization, prognostic model construction, and validation. MRG: metabolic reprogramming gene; WGCNA: weighted gene co-expression network analysis. |
Analysis of differential gene expression and identification of hub genes
Differentially expressed genes (DEGs) were discerned through the utilization of the DESeq2 package within RStudio (version 4.3.3), with thresholds set at |log2 fold change| ≥ 3 and P < 0.05. To perform weighted gene co-expression network analysis (WGCNA), the “WGCNA” package was employed. A soft threshold of β = 9 was determined, corresponding to a scale-free topology model fit of R2 = 0.9, to facilitate the construction of adjacency and topological overlap matrices (TOM). Hierarchical clustering identified nine modules, of which four (turquoise, blue, brown, and red) exhibited the highest correlation with LUAD. An intersection analysis involving DEGs, MRGs, and pivotal module genes yielded 31 hub differentially expressed marker-related genes (DEMRGs).
Consensus clustering and subtype characterization
Patient stratification was performed using consensus clustering via the R package ConsensusClusterPlus, with 100 iterations and Euclidean distance metrics. Cluster separation was validated through principal component analysis (PCA) and 3D scatter plots. To characterize subtype-specific molecular features, we conducted differential gene expression analysis between clusters using DESeq2, considering genes with |log2 fold change| ≥ 1.5 and adjusted P-value < 0.05 as significant. These DEGs were subsequently subjected to functional enrichment analysis, including Gene Ontology (GO), Kyoto Encyclopedia of Genes and Genomes (KEGG), and gene set enrichment analysis (GSEA), implemented in the clusterProfiler package with adjusted P-value thresholds of 0.05. Clinical relevance was assessed through survival analysis using Kaplan-Meier curves with log-rank tests and Cox proportional hazards models. Additionally, the TME was profiled using ESTIMATE algorithm-derived scores (stromal, immune, ESTIMATE, and tumor purity) and immune cell infiltration quantification via CIBERSORT, with inter-subtype comparisons performed using Wilcoxon rank-sum tests. Immune checkpoint and human leukocyte antigen (HLA)-related gene expression differences were similarly evaluated using Wilcoxon tests.
Prognostic model construction
Univariate Cox regression (P < 0.05) identified 19 prognosis-related genes. Least absolute shrinkage and selection operator (LASSO) regression (10-fold cross-validation) further refined the gene set to six key DEMRGs (CAV1, FOXM1, FAM83A, PTGES, RECQL4, and SFTPC). Subsequently, using the LASSO Cox regression method on the training subset (n = 252), a risk score model was developed with five genes (excluding PTGES). The coefficients for each gene in the risk score were derived from the LASSO Cox model at the optimal lambda value (lambda. min). The risk score was calculated as follows: Risk score = (0.1149 × CAV1 expression) + (0.1728 × FOXM1 expression) + (0.1428 × FAM83A expression) - (0.1566 × RECQL4 expression) - (0.0285 × SFTPC expression). Patients were categorized into high-risk and low-risk groups according to the median risk score. Model performance was validated via Kaplan-Meier analysis, receiver operating characteristic (ROC) curves (area under the curve (AUC): 0.68 - 0.71), and independent testing sets (n = 251).
Immune infiltration and nomogram analysis
Single-sample gene set enrichment analysis (ssGSEA) evaluated immune cell infiltration and pathway activity. A nomogram integrating the five hub MRGs and clinical parameters was constructed using the “rms” package. Calibration curves assessed the nomogram’s accuracy in predicting 1-, 3-, and 5-year survival probabilities.
| Results | ▴Top |
Analysis of differential expression and WGCNA
The differential expression analysis was conducted utilizing the TCGA-LUAD dataset. Compared with normal controls, LUAD tissues exhibited a distinct transcriptomic profile characterized by 1,952 upregulated genes and 206 downregulated genes (Fig. 2a, b). In the context of WGCNA, a soft threshold of β = 9 was established, yielding a scale-free topology fit with an R2 value of 0.9 for the co-expression network construction (Supplementary Material 1, wjon.elmerpub.com). This analytical approach resulted in the identification of nine distinct modules, among which the turquoise, blue, brown, and red modules exhibited the strongest correlation with LUAD, thereby being classified as key modules (Fig. 3a). Furthermore, an intersection analysis combining genes derived from WGCNA, DEGs, and MRGs revealed a total of 31 hub DEMRGs (Fig. 3b).
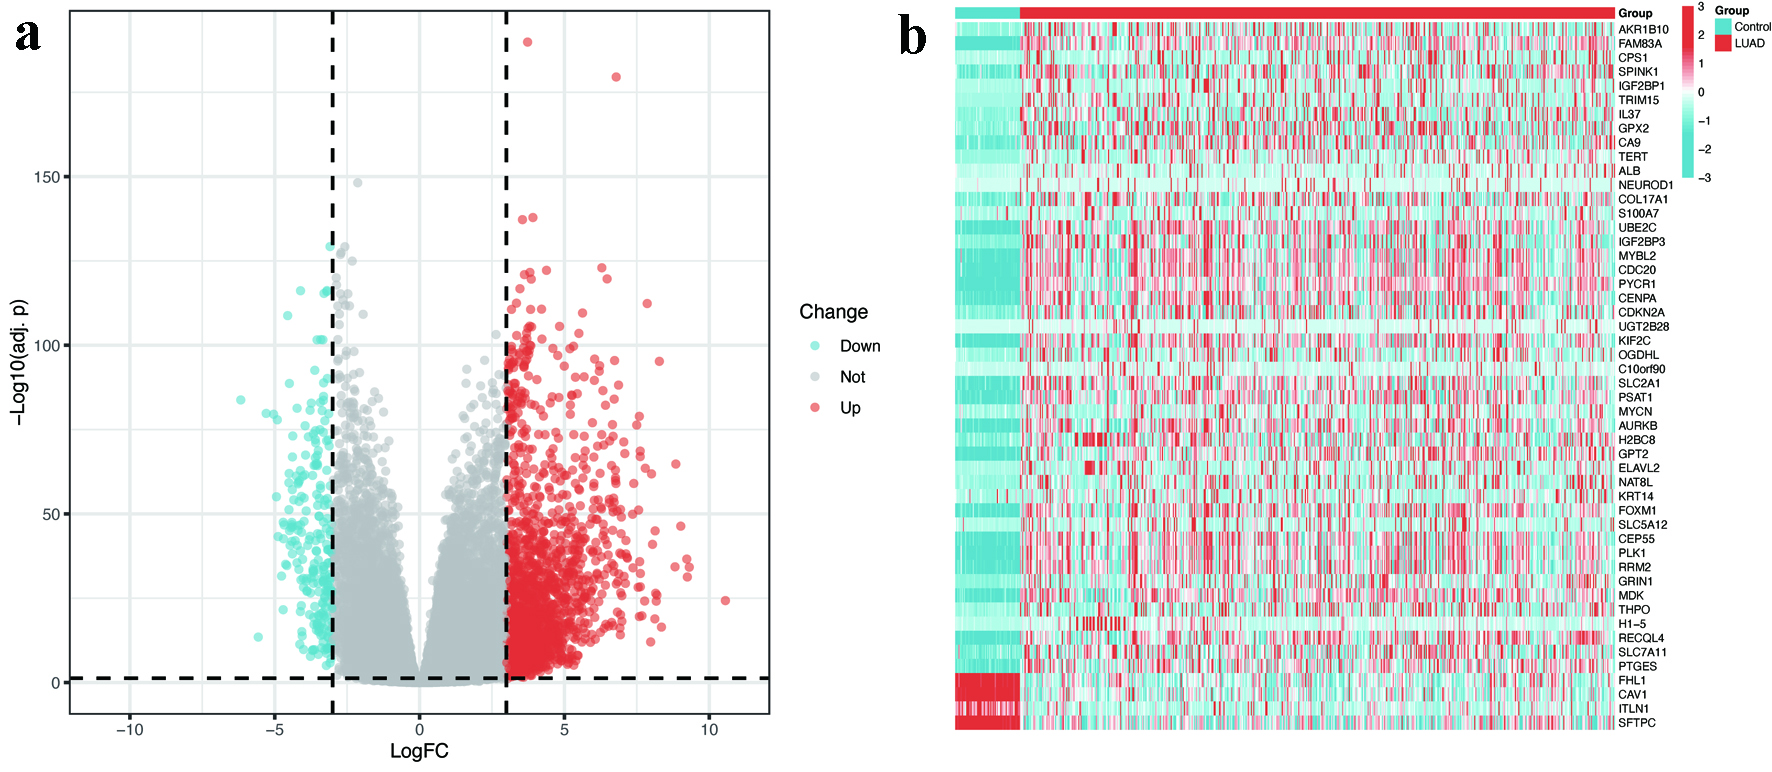 Click for large image | Figure 2. Identification of DEGs in LUAD. (a) Volcano plot illustrating 1,952 upregulated (red) and 206 downregulated (blue) genes in LUAD tissues compared to normal controls (|log2FC| > 3, FDR < 0.05). (b) Heatmap displaying the expression patterns of top 50 DEGs across LUAD and normal samples. The color scale represents Z-scores of normalized RNA expression levels (blue = low, red = high). DEGs: differentially expressed genes; FC: fold change; FDR: false discovery rate; LUAD: lung adenocarcinoma. |
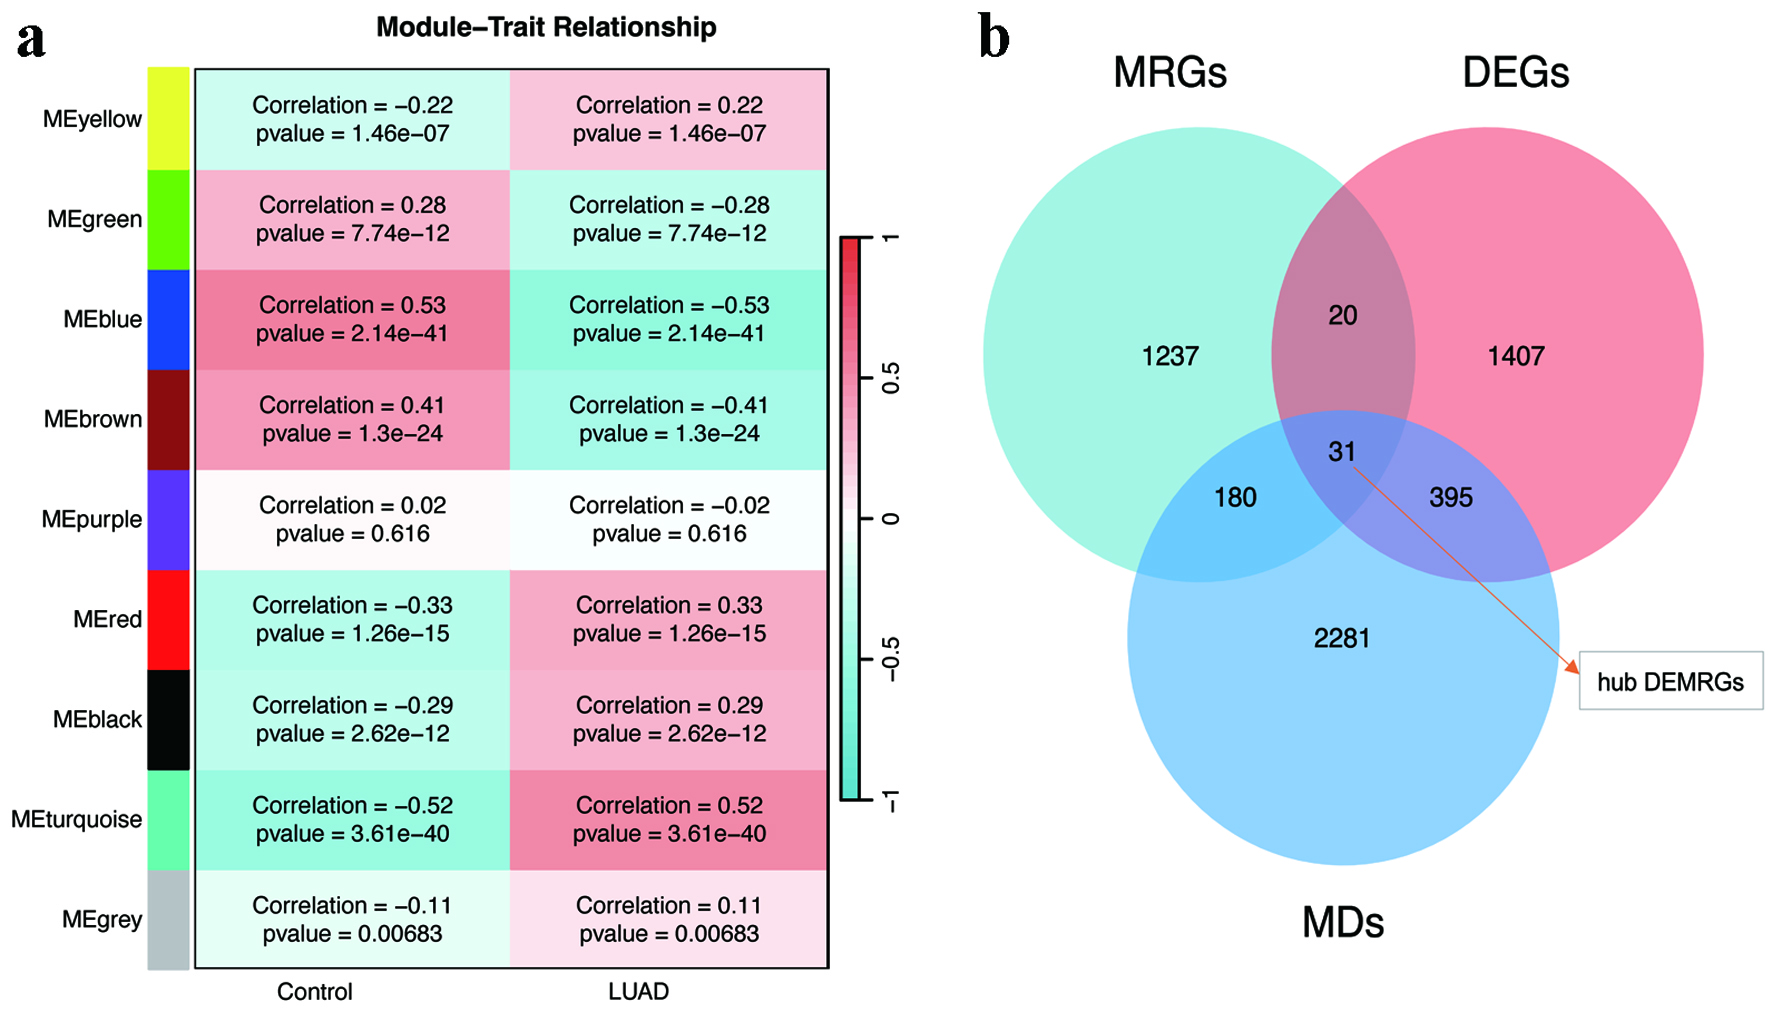 Click for large image | Figure 3. WGCNA and hub gene identification. (a) Module-trait correlation heatmap highlighting the turquoise, blue, brown, and red modules with the strongest associations to LUAD. (b) Venn diagram intersecting WGCNA-derived modules, DEGs, and MRGs to identify 31 hub DEMRGs. DEGs: differentially expressed genes; DEMRGs: differentially expressed metabolic reprogramming genes; LUAD: lung adenocarcinoma; MRG: metabolic reprogramming gene; WGCNA: weighted gene co-expression network analysis. |
Consensus clustering and subtype characterization
Consensus clustering based on hub DEMRGs expression divided patients into two subtypes: C1 (n = 242) and C2 (n = 261). The determination of the optimal number of clusters (k = 2) was achieved through a comprehensive analysis of consensus matrices alongside cumulative distribution function (CDF) plots, as illustrated in Supplementary Material 2 (wjon.elmerpub.com). PCA confirmed robust intergroup separation between C1 and C2 (Fig. 4a). Subsequent differential analysis identified 1,921 DEGs between subtypes. GO enrichment analysis indicated that these DEGs were significantly implicated in processes such as nuclear division, organelle fission, condensed chromosome organization, and hormone activity pathways, as shown in Figure 4b. Additionally, KEGG pathway analysis underscored their involvement in neuroactive ligand-receptor interactions and the regulation of the cell cycle, as presented in Figure 4c. GSEA further revealed that subtype C2 exhibited enrichment in pathways associated with cell cycle progression, DNA replication licensing, outer kinetochore organization, the unwinding of origins, and the formation of the pre-initiation complex (pre-IC), with a significance threshold of P < 0.05, as depicted in Figure 4d.
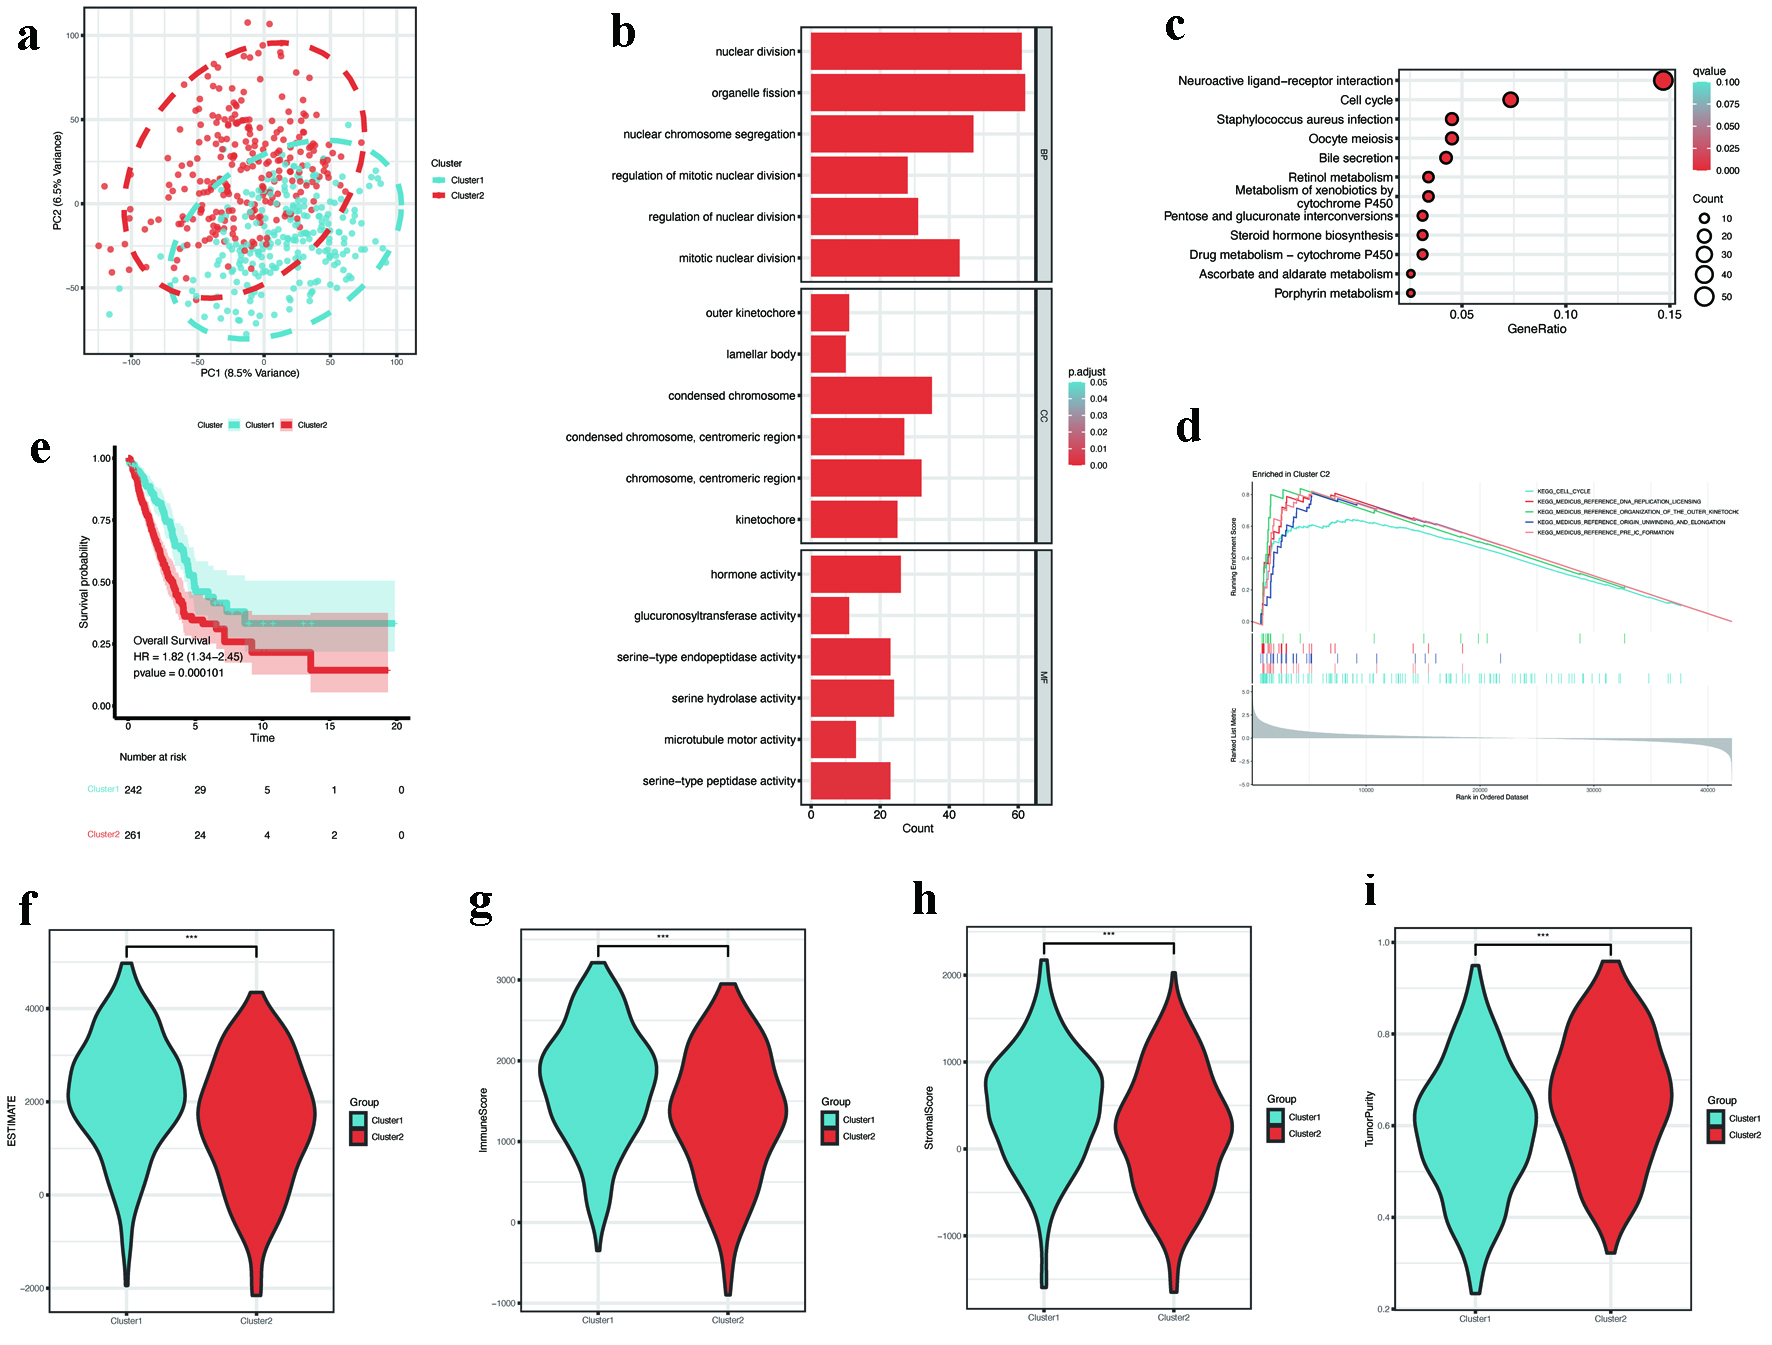 Click for large image | Figure 4. Consensus clustering and subtype characterization. (a) PCA showing distinct separation between consensus clusters C1 (n = 242) and C2 (n = 261). (b) GO enrichment of subtype-specific DEGs, emphasizing nuclear division and chromosome organization. (c) KEGG pathway analysis showing enrichment in cell cycle and neuroactive ligand-receptor interaction. (d) GSEA plot revealing activation of DNA replication pathways in C2 (FDR < 0.05). (e) Kaplan-Meier survival curves showing poorer overall survival in C2 (log-rank P < 0.001). (f-i) Tumor microenvironment scores: (f) ESTIMATE, (g) immune, (h) stromal, and (i) tumor purity (P < 0.001). DEGs: differentially expressed genes; FDR: discovery rate; GO: Gene Ontology; GSEA: gene set enrichment analysis; KEGG: Kyoto Encyclopedia of Genes and Genomes; PCA: principal component analysis. |
Survival analysis demonstrated that individuals categorized within the C2 subtype experienced a markedly reduced overall survival (OS) in comparison to those in the C1 subtype (Fig. 4e). TME assessment revealed lower ESTIMATE scores, immune scores, and stromal scores in C2, alongside higher tumor purity (Fig. 4f-i).
Immune landscape analysis
CIBERSORT analysis of immune cell infiltration demonstrated significant differences between clusters. In comparison to cluster 1 (C1), cluster 2 (C2) demonstrated a higher presence of T-follicular helper cells, M1 macrophages, M2 macrophages, and activated dendritic cells. Conversely, there was a decline in the levels of CD8+ T cells and regulatory T cells (Tregs) observed in C2 (Fig. 5a). Immune checkpoint analysis showed elevated expression of LAG3 and PDCD1LG2 (PD-L2) in C2, while HAVCR2 was downregulated (Fig. 5b). Additionally, a significant downregulation of most genes associated with HLA was noted in C2 (Fig. 5c). Despite increased M1 macrophage and dendritic cell infiltration, the coexistence of CD8+ T cell exhaustion (high LAG3, low HLA expression) and M2 macrophages suggested an overall immunosuppressive microenvironment in C2.
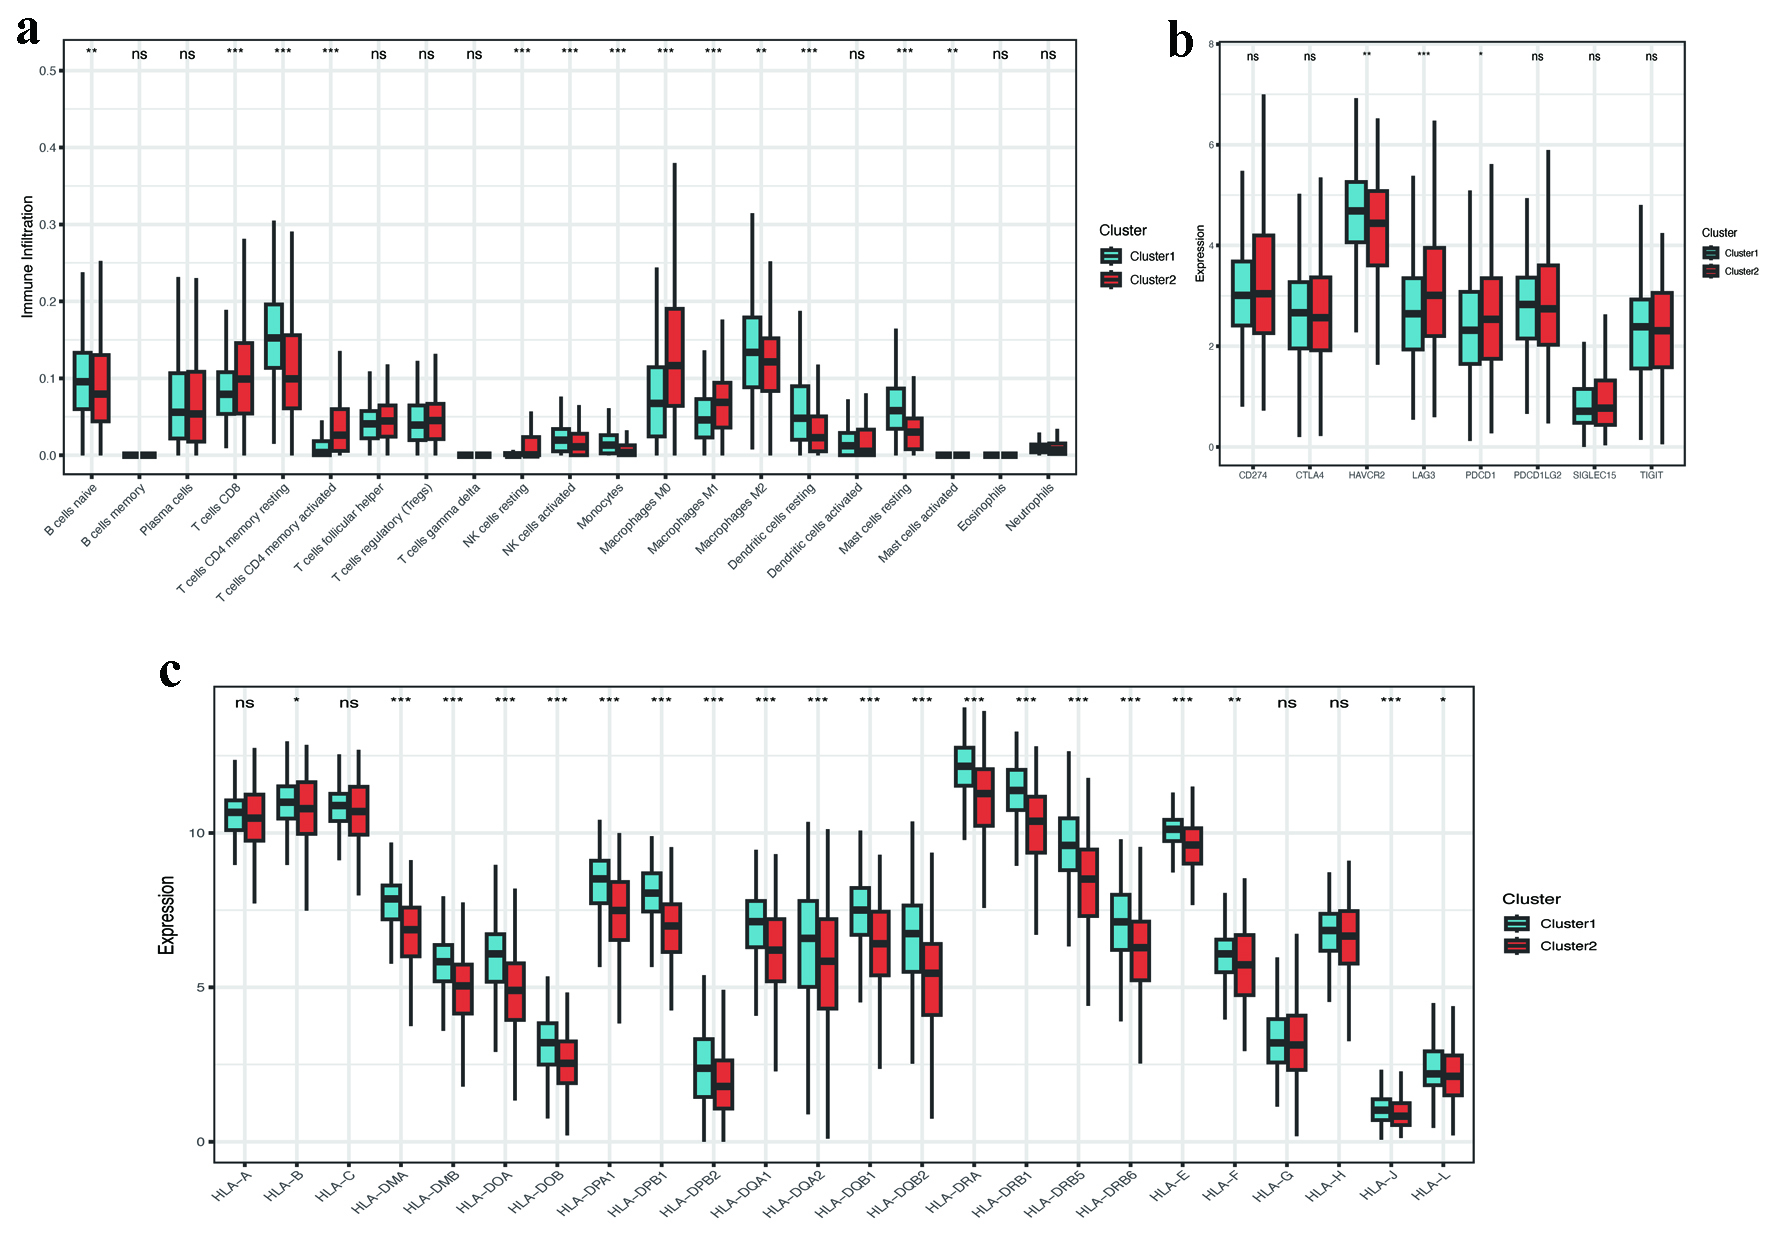 Click for large image | Figure 5. Immune microenvironment and checkpoint analysis. (a) CIBERSORT-derived immune cell infiltration profiles between clusters (P < 0.001). (b) Differential expression of immune checkpoint genes (LAG3, PDCD1LG2, HAVCR2; P < 0.05). (c) Reduced HLA-related gene expression in C2 (P < 0.001). HLA: human leukocyte antigen. |
Prognostic gene identification and risk model development
Univariate Cox regression analysis of 31 hub DEMRGs identified 19 genes significantly associated with prognosis (Fig. 6a). LASSO regression further refined these to six key DEMRGs: CAV1, FOXM1, FAM83A, PTGES, RECQL4, and SFTPC (Supplementary Material 3, wjon.elmerpub.com). Compared to controls, FOXM1, FAM83A, PTGES, and RECQL4 were upregulated in LUAD, whereas CAV1 and SFTPC were downregulated (Fig. 6b-g).
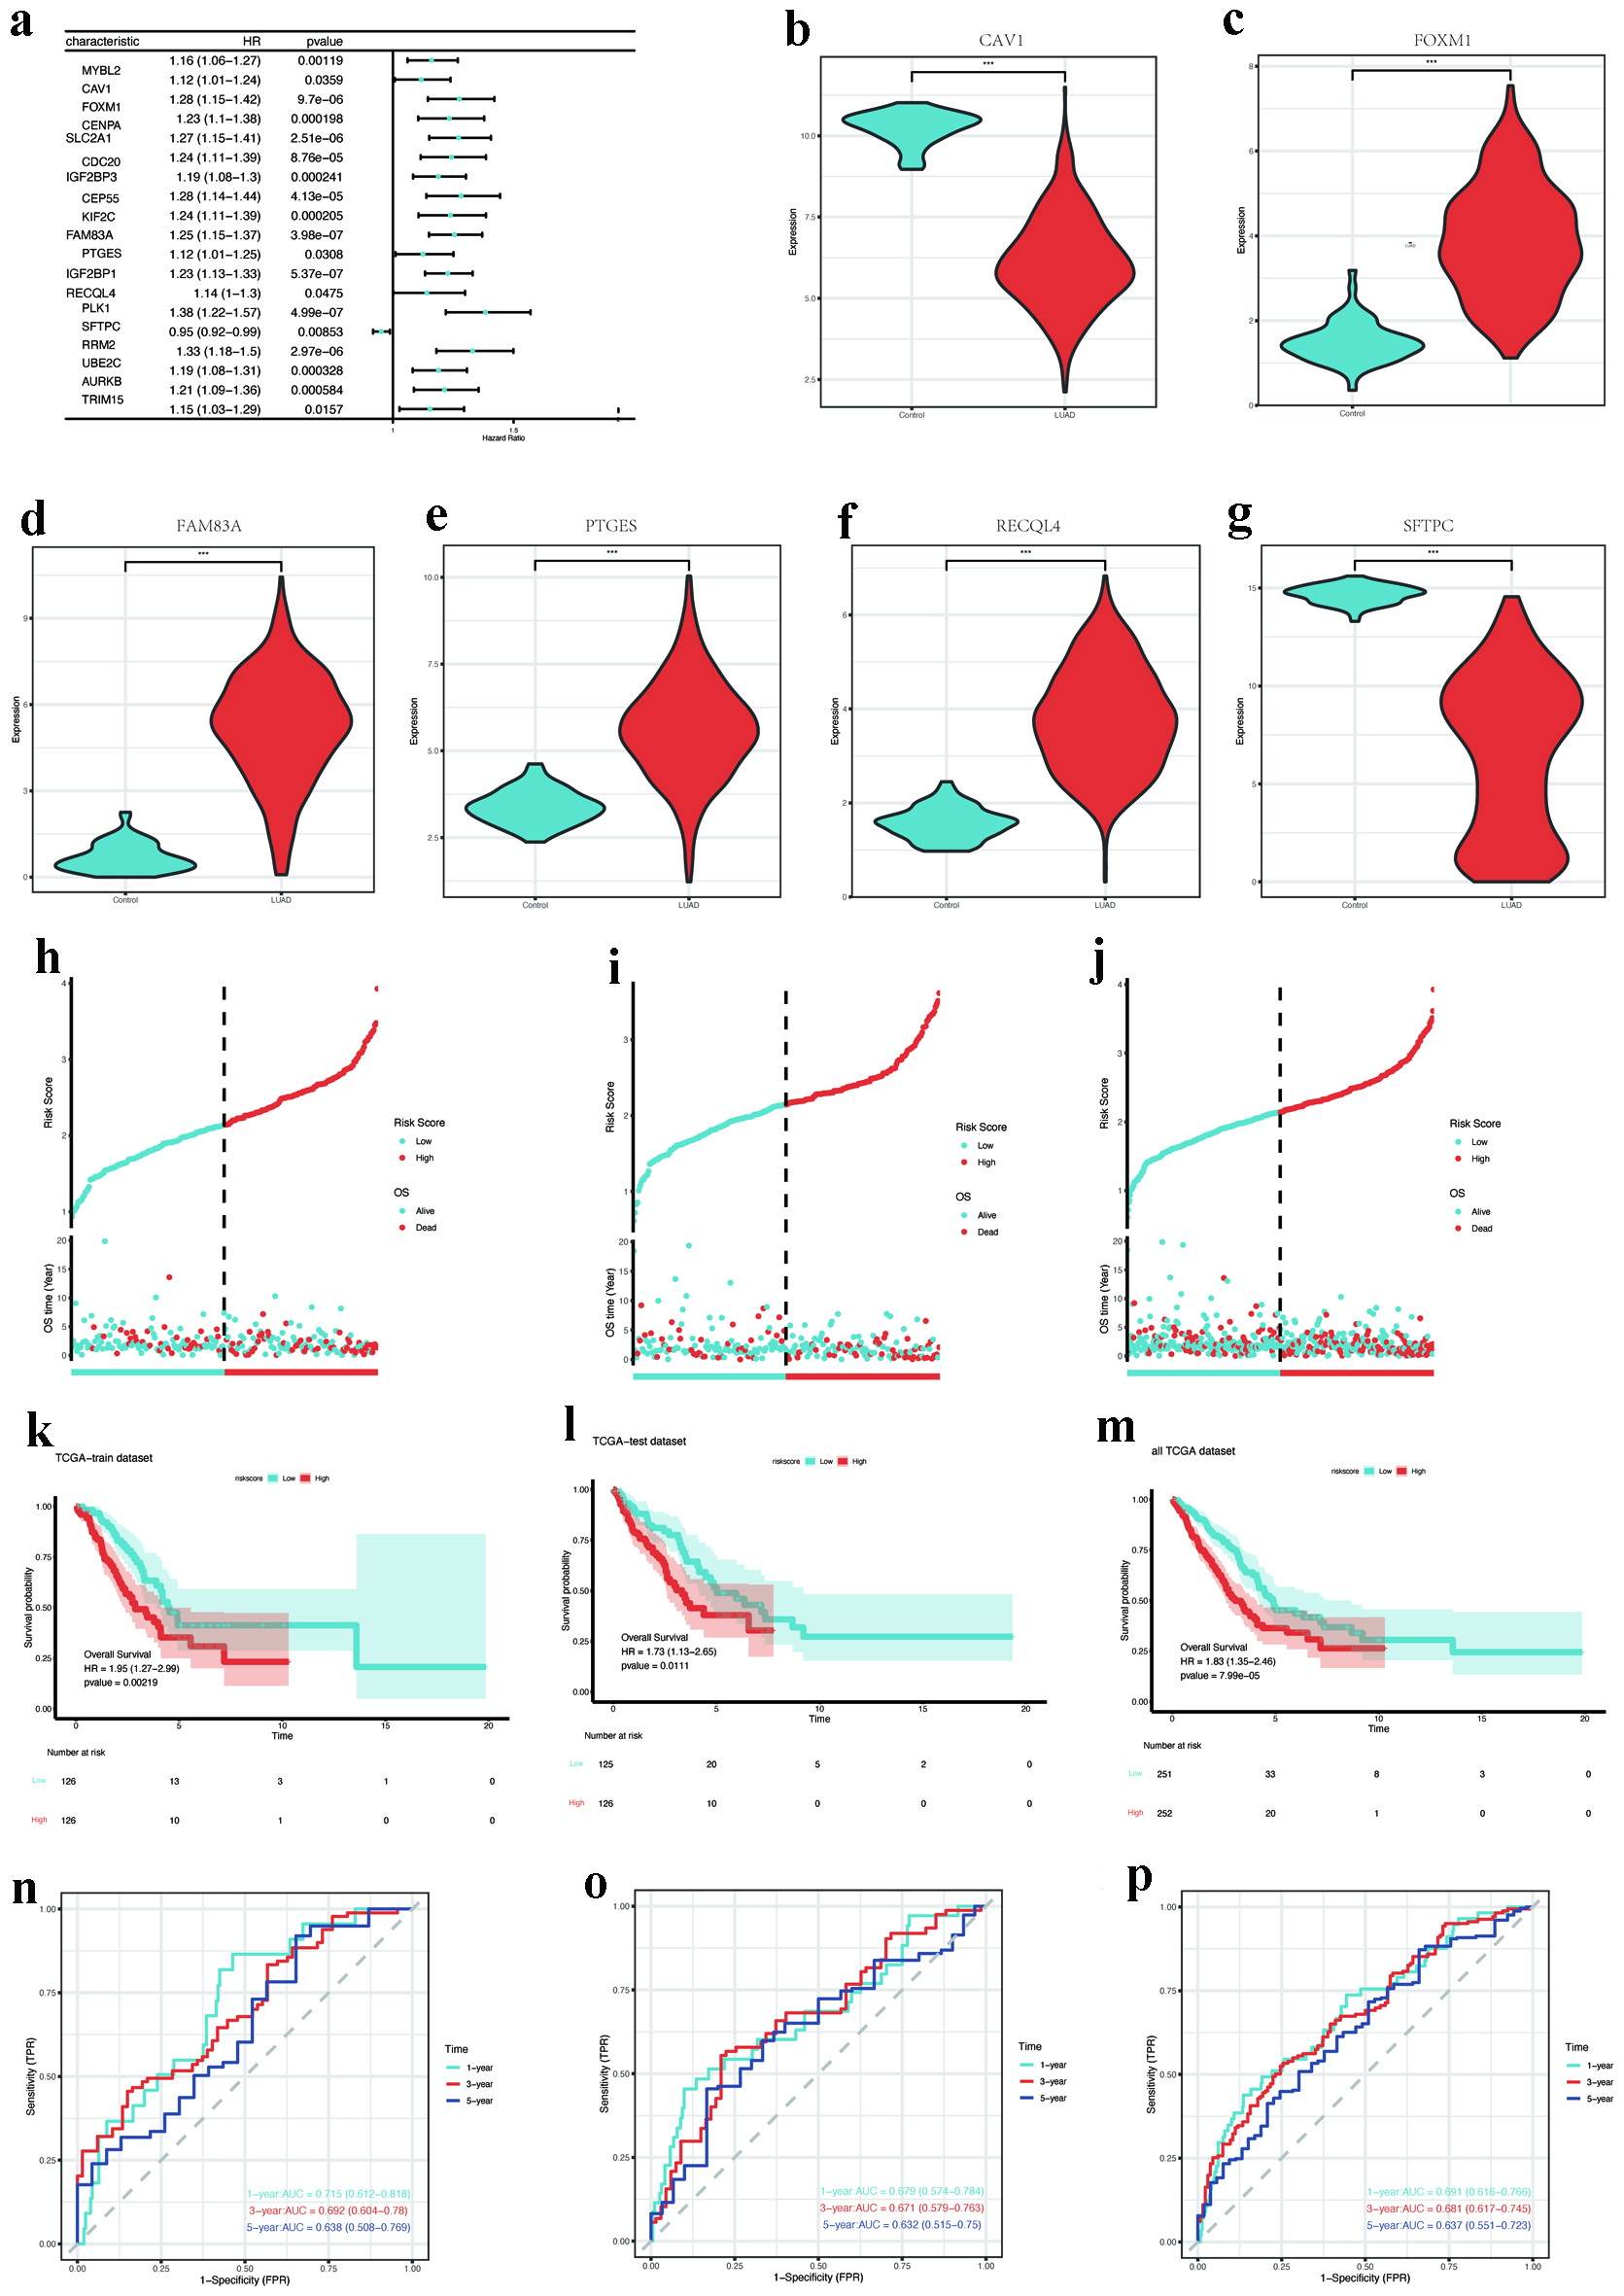 Click for large image | Figure 6. Prognostic gene screening and model validation. (a) Forest plot of univariate Cox regression for 19 hub DEMRGs with prognostic significance. (b-g) Expression validation of key DEMRGs (CAV1, FOXM1, FAM83A, PTGES, RECQL4, and SFTPC) in LUAD vs. normal tissues (P < 0.001). (h-j) Risk score distribution and survival status in training, testing, and entire TCGA cohorts. (k-m) Kaplan-Meier survival curves stratified by risk groups (log-rank P < 0.05). (n-p) ROC curves for 1-year survival prediction (AUC: 0.715 training, 0.679 testing, 0.691 overall). AUC: area under the curve; DEMRGs: differentially expressed metabolic reprogramming genes; LUAD: lung adenocarcinoma; ROC: receiver operating characteristic; TCGA: The Cancer Genome Atlas. |
Predictive performance assessment of the clinical risk signature
The TCGA cohort was randomly allocated into a training set (n = 252) and an independent validation set (n = 251) for model construction and evaluation. Using LASSO Cox regression with 10-fold cross-validation on the training set, we constructed a prognostic risk model. This model retained five genes (CAV1, FOXM1, FAM83A, RECQL4, and SFTPC) as PTGES was excluded due to its coefficient being shrunk to zero by the LASSO algorithm. The risk score for each patient was calculated using the following formula: Risk score = (0.1149 × CAV1 expression) + (0.1728 × FOXM1 expression) + (0.1428 × FAM83A expression) - (0.1566 × RECQL4 expression) - (0.0285 × SFTPC expression) (Supplementary Material 4, wjon.elmerpub.com). Patients were categorized into high-risk and low-risk groups according to the median risk scores. The distribution of risk scores and survival durations across the training, testing, and overall TCGA cohorts is illustrated in Figure 6h-j. Kaplan-Meier survival analysis indicated that patients classified as high risk exhibited a statistically significant reduction in OS across all cohorts (P < 0.05, as depicted in Fig. 6k-m). Additionally, time-dependent ROC curves evidenced the model’s strong predictive capability, yielding 1-year AUC values of 0.715, 0.679, and 0.691 for the training, testing, and complete cohorts, respectively (Fig. 6n-p).
Immune infiltration and nomogram analysis
ssGSEA identified distinct patterns of immune cell infiltration across different risk categories. Immunophenotypic analysis revealed predominant infiltration of activated CD4+ T lymphocytes, central memory CD4+/CD8+ T-cell subsets, γδ T lymphocytes, and memory B cells in high-risk patients, whereas activated B lymphocyte and mast cell populations were significantly expanded in low-risk individuals (Fig. 7a). Gene set variation analysis (GSVA) indicated enhanced activity of immunosuppressive pathways (e.g., antigen-presenting cell (APC) co-inhibition, chemokine receptors (CCR), macrophages, major histocompatibility complex (MHC) class I, natural killer (NK) cells, inflammation-promoting) in high-risk patients. Conversely, HLA pathways, immature dendritic cells (iDCs), and mast cell activity were more pronounced in low-risk patients, which suggests a more robust anti-tumor immune response (Fig. 7b).
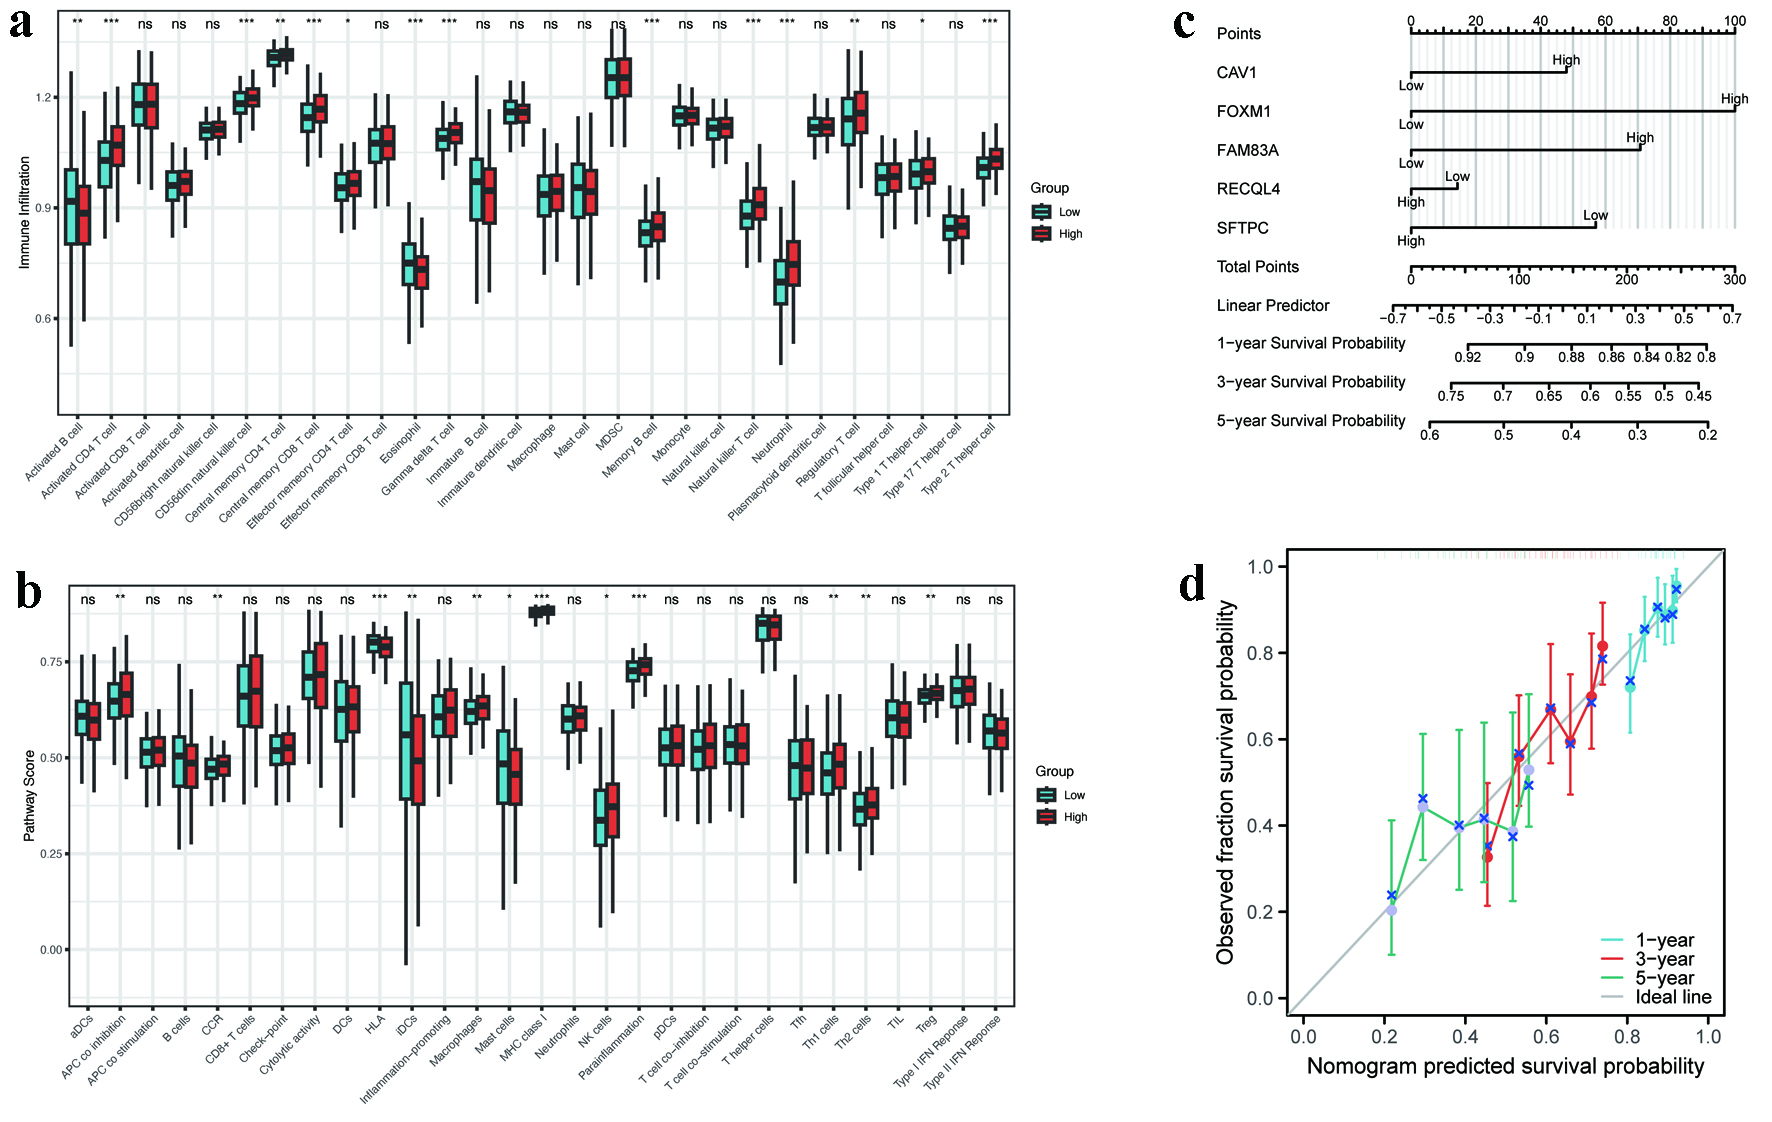 Click for large image | Figure 7. Immune landscape and nomogram performance. (a) ssGSEA scores of immune cell subsets in high- versus low-risk groups (P < 0.05). (b) GSVA enrichment of immune-related pathways (APC co-inhibition, MHC class I, etc.). (c) Nomogram integrating five hub MRGs for survival prediction (C-index = 0.623). (d) Calibration curves for 1-, 3-, and 5-year survival probability. APC: antigen-presenting cell; GSVA: gene set variation analysis; MHC: major histocompatibility complex; MRGs: metabolic reprogramming genes; ssGSEA: single-sample gene set enrichment analysis. |
Furthermore, a nomogram that integrates five pivotal genes was constructed to estimate survival probabilities at 1, 3, and 5 years (Fig. 7c). The model demonstrated moderate predictive accuracy (C-index: 0.623, 95% CI: 0.599 - 0.647). Calibration curves confirmed close alignment between predicted and observed survival outcomes (Fig. 7d), indicating high reliability.
| Discussion | ▴Top |
LUAD represents the predominant histological variant of lung cancer, exhibiting an increasing incidence worldwide, especially among individuals who do not smoke. The clinical presentation of LUAD is diverse, and the symptoms observed in the early stages are frequently nonspecific. This nonspecificity often contributes to delayed diagnosis, resulting in unfavorable prognoses in advanced stages of the disease. Although current therapeutic approaches, encompassing surgical intervention, chemotherapy, radiotherapy, and targeted treatment modalities, have improved outcomes; however, the overall 5-year survival rate remains low [16]. This underscores the urgent need to identify novel biomarkers for optimizing prognostic assessment and personalized therapeutic strategies.
Recent advancements in cancer metabolism research have highlighted the pivotal role of metabolic reprogramming in tumorigenesis and progression. Tumor cells rewire metabolic pathways to meet biosynthetic and energetic demands during rapid proliferation while adapting to microenvironmental stressors such as hypoxia and nutrient deprivation. Metabolic reprogramming not only fuels tumor growth but also facilitates immune evasion, invasion, and metastasis through remodeling the TME [17, 18].
This study systematically integrated multi-omics and clinical data to elucidate the prognostic significance of MRGs in LUAD. Five key DEMRGs (CAV1, FOXM1, FAM83A, RECQL4, and SFTPC) were identified, and a risk score model (AUC: 0.68 - 0.71) and nomogram (C-index: 0.623) were constructed, providing novel tools for clinical management.
Consensus clustering stratified LUAD patients into two subtypes: C1 (n = 242) and C2 (n = 261). Patients in the C2 subtype exhibited significantly shorter OS (P < 0.05). Functional enrichment analysis revealed that C2 was enriched in nuclear division, organelle fission, and condensed chromosome organization (Fig. 4e), with heightened activity in cell cycle and neuroactive ligand-receptor interaction pathways (Fig. 4f). GSEA further implicated C2 in DNA replication licensing and outer kinetochore organization (Fig. 4g). In contrast, C1 tumors were enriched in hormone activity pathways, potentially linked to steroid metabolism. These findings suggest that C2 patients may benefit from cell cycle inhibitors (e.g., CDK4/6 inhibitors), while C1 patients could respond to hormone pathway modulators.
Immune microenvironment analysis demonstrated significantly lower immune scores (ImmuneScore) and stromal scores (StromalScore) in C2 compared to C1 (Fig. 4i-l), indicative of an immunosuppressive phenotype. Specifically, C2 showed reduced infiltration of CD8+ T cells and Tregs but increased M2 macrophages and activated dendritic cells (Fig. 5a). M2 macrophages secreted interleukin (IL)-10 and transforming growth factor-beta (TGF-β) to suppress anti-tumor immunity, while diminished Tregs suggested immune exhaustion. Elevated expression of LAG3 and PDCD1LG2 (PD-L2) in C2 (Fig. 5b) correlated with T-cell dysfunction, and widespread downregulation of HLA class I/II molecules (Fig. 5c) implied immune escape mechanisms. These findings highlight the “immune-cold” nature of C2, necessitating combinatorial strategies (e.g., PD-1 inhibitors with LAG3 blockers) to enhance immunogenicity. Conversely, the immunologically active microenvironment of C1 may favor immune checkpoint inhibitor monotherapy.
The risk score model (AUC: 0.68 - 0.71) and nomogram (C-index: 0.623) demonstrated robust predictive accuracy, providing quantitative tools for personalized prognosis. Notably, the hub MRGs, i.e., CAV1, FOXM1, FAM83A, RECQL4, and SFTPC, exhibited distinct expression patterns in LUAD. FOXM1, FAM83A, and RECQL4 were upregulated, while CAV1 and SFTPC were downregulated compared to normal tissues.
FOXM1, a member of the Forkhead box (Fox) transcription factor family, plays a crucial role in regulating cell cycle advancement, cellular proliferation, DNA repair mechanisms, and the maintenance of genomic integrity [19-22]. The elevated expression of FOXM1 has been associated with various malignancies, including breast cancer [23, 24], colorectal cancer [25], gastric cancer [26], hepatocellular carcinoma [27], and ovarian cancer [28], where it contributes to tumor development, metastasis, and unfavorable clinical outcomes. In the context of NSCLC, the overexpression of FOXM1 has been linked to increased tumor size and diminished survival rates [29], highlighting its potential significance as a therapeutic target across multiple cancer types.
FAM83A, a member of the FAM83 family, facilitates tumor advancement through the activation of the Wnt/β-catenin signaling pathway, which triggers epithelial-mesenchymal transition (EMT) [30, 31]. It regulates mitochondrial function during adipocyte differentiation [32] and resistance to therapies in lung, breast, head and neck, and pancreatic malignancies [31, 33-36]. Despite its high expression in LUAD, the precise functional role of FAM83A remains unclear.
RECQL4, a RecQ helicase, is essential for nuclear DNA replication and genomic stability [37]. Cytoplasmic RECQL4 localizes to mitochondria, repairing oxidative DNA damage and maintaining oxidative phosphorylation (OXPHOS) [38]. While RECQL4 deficiency causes Rothmund-Thomson syndrome (RTS), characterized by chromosomal instability [38, 39], its overexpression promotes tumorigenesis in breast [40], prostate [41], and gastric cancers [42]. In LUAD, RECQL4 likely supports metabolic flexibility by sustaining mitochondrial function [38, 43], though its role requires further investigation.
CAV1, a membrane-associated protein involved in cholesterol transport and endocytosis, exhibits dual roles in cancer [44]. In the context of colorectal [45] and ovarian cancers [46], it functions as a tumor suppressor; however, in contrast, it facilitates the advancement of breast [47-49], bladder [50], endometrial [51], liver [52], and pancreatic cancers [53], among others. This context-dependent behavior, influenced by cell type and cancer stage, complicates its therapeutic targeting [47-49, 54]. In NSCLC, CAV1 expression patterns and functional impacts remain controversial [55-59], necessitating further study.
SFTPC, a surfactant protein critical for alveolar function, mitigates pulmonary fibrosis by suppressing TGF-β signaling [60-62]. Its downregulation in LUAD correlates with poor prognosis [63], highlighting its potential as a biomarker.
Limitations
This study lacks experimental validation of bioinformatics findings, limiting the clinical applicability of conclusions. Additionally, reliance on TCGA-LUAD data, while minimizing heterogeneity, restricts generalizability due to the absence of multi-center validation. Our future studies will focus on experimental verification of key DEMRGs (CAV1, FOXM1, FAM83A, RECQL4, and SFTPC) using qPCR and immunohistochemistry in our hospital’s LUAD tissue bank and mechanistic investigation of how these genes regulate metabolic reprogramming pathways.
Conclusion
In summary, this study comprehensively delineates the molecular features and prognostic genes of LUAD through comprehensive bioinformatics analysis. The constructed risk score and nomogram models demonstrate robust predictive accuracy, providing quantitative tools to guide prognosis and precision medicine strategies. Future research should prioritize multi-omics integration and experimental validation to enhance our mechanistic understanding of LUAD biology and to facilitate the development of targeted therapeutic interventions.
| Supplementary Material | ▴Top |
Suppl 1. WGCNA parameter selection. (A) Scale-free topology fit analysis for soft threshold selection (β = 9, R2 = 0.9). (B) Hierarchical clustering dendrogram of co-expression modules.
Suppl 2. Consensus clustering optimization. (A) Consensus matrix heatmap for optimal cluster configuration (k = 2; C1: n = 242, C2: n = 261). (B) Tracking plot demonstrating sample consensus across clustering iterations. (C) Cumulative distribution function (CDF) curves for cluster numbers.
Suppl 3. Diagnostic LASSO regression for feature selection. (A) LASSO coefficient profiles of candidate genes. (B) Cross-validation for optimal lambda selection (n = 6 genes).
Suppl 4. Prognostic LASSO Cox regression. (A) LASSO regression coefficient distribution. (B) Final risk model formula incorporating five genes.
Acknowledgments
We acknowledge the TCGA Research Network and GeneCards for providing critical genomic and functional genomics resources essential to this study.
Financial Disclosure
This work was supported by Talent Introduction Plan of Putuo District Central Hospital (2024-YJRC-06) and the Social Development Fund of Zhenjiang (SH2023067).
Conflict of Interest
The authors declare that they have no conflict of interest.
Informed Consent
Not applicable.
Author Contributions
The study was conceived and designed by Ping Ping Hu. Data collection was performed by Jia Lang and Jing fang Yuan. Data analysis was conducted by Fang Huang. Ling Zhi Lian drafted the manuscript. Ping Ping Hu supervised the research and critically revised the manuscript. All authors read and approved the final manuscript.
Data Availability
The datasets generated and/or analyzed during the current study are available in the public databases: NCI Genomic Data Commons (GDC, https://portal.gdc.cancer.gov/) (accessed October 25, 2024). GeneCards database (https://www.genecards.org/) (accessed October 25, 2024).
Abbreviations
DEGs: differentially expressed genes; DEMRGs: differentially expressed metabolic reprogramming genes; GSEA: gene set enrichment analysis; LUAD: lung adenocarcinoma; MRGs: metabolic reprogramming genes; NSCLC: non-small cell lung cancer; PCA: principal component analysis; ssGSEA: single-sample gene set enrichment analysis; TKIs: tyrosine kinase inhibitors; TOM: topological overlap matrices; WGCNA: weighted gene co-expression network analysis; WHO: World Health Organization
| References | ▴Top |
- Travis WD, Brambilla E, Nicholson AG, Yatabe Y, Austin JHM, Beasley MB, Chirieac LR, et al. The 2015 World Health Organization Classification of Lung Tumors: impact of genetic, clinical and radiologic advances since the 2004 classification. J Thorac Oncol. 2015;10(9):1243-1260.
doi pubmed - Sung H, Ferlay J, Siegel RL, Laversanne M, Soerjomataram I, Jemal A, Bray F. Global Cancer Statistics 2020: GLOBOCAN estimates of incidence and mortality worldwide for 36 cancers in 185 countries. CA Cancer J Clin. 2021;71(3):209-249.
doi pubmed - Chen W, Zheng R, Baade PD, Zhang S, Zeng H, Bray F, Jemal A, et al. Cancer statistics in China, 2015. CA Cancer J Clin. 2016;66(2):115-132.
doi pubmed - Cancer Genome Atlas Research Network. Comprehensive molecular profiling of lung adenocarcinoma. Nature. 2014;511(7511):543-550.
doi pubmed - Pavlova NN, Thompson CB. The emerging hallmarks of cancer metabolism. Cell Metab. 2016;23(1):27-47.
doi pubmed - Pavlova NN, Zhu J, Thompson CB. The hallmarks of cancer metabolism: Still emerging. Cell Metab. 2022;34(3):355-377.
doi pubmed - Herbst RS, Morgensztern D, Boshoff C. The biology and management of non-small cell lung cancer. Nature. 2018;553(7689):446-454.
doi pubmed - Reck M, Rodriguez-Abreu D, Robinson AG, Hui R, Csoszi T, Fulop A, Gottfried M, et al. Pembrolizumab versus chemotherapy for PD-L1-positive non-small-cell lung cancer. N Engl J Med. 2016;375(19):1823-1833.
doi pubmed - Wu YL, Tsuboi M, He J, John T, Grohe C, Majem M, Goldman JW, et al. Osimertinib in resected EGFR-mutated non-small-cell lung cancer. N Engl J Med. 2020;383(18):1711-1723.
doi pubmed - Mok TS, Wu YL, Thongprasert S, Yang CH, Chu DT, Saijo N, Sunpaweravong P, et al. Gefitinib or carboplatin-paclitaxel in pulmonary adenocarcinoma. N Engl J Med. 2009;361(10):947-957.
doi pubmed - Jamal-Hanjani M, Wilson GA, McGranahan N, Birkbak NJ, Watkins TBK, Veeriah S, Shafi S, et al. Tracking the evolution of non-small-cell lung cancer. N Engl J Med. 2017;376(22):2109-2121.
doi pubmed - Hanahan D, Weinberg RA. Hallmarks of cancer: the next generation. Cell. 2011;144(5):646-674.
doi pubmed - Warburg O. On the origin of cancer cells. Science. 1956;123(3191):309-314.
doi pubmed - Vander Heiden MG, Cantley LC, Thompson CB. Understanding the Warburg effect: the metabolic requirements of cell proliferation. Science. 2009;324(5930):1029-1033.
doi pubmed - Gross MI, Demo SD, Dennison JB, Chen L, Chernov-Rogan T, Goyal B, Janes JR, et al. Antitumor activity of the glutaminase inhibitor CB-839 in triple-negative breast cancer. Mol Cancer Ther. 2014;13(4):890-901.
doi pubmed - Siegel RL, Miller KD, Jemal A. Cancer statistics, 2018. CA Cancer J Clin. 2018;68(1):7-30.
doi pubmed - Tran Janco JM, Lamichhane P, Karyampudi L, Knutson KL. Tumor-infiltrating dendritic cells in cancer pathogenesis. J Immunol. 2015;194(7):2985-2991.
doi pubmed - He S, Cai T, Yuan J, Zheng X, Yang W. Lipid metabolism in tumor-infiltrating T cells. Adv Exp Med Biol. 2021;1316:149-167.
doi pubmed - Kalathil D, John S, Nair AS. FOXM1 and cancer: faulty cellular signaling derails homeostasis. Front Oncol. 2020;10:626836.
doi pubmed - Khan MA, Khan P, Ahmad A, Fatima M, Nasser MW. FOXM1: A small fox that makes more tracks for cancer progression and metastasis. Semin Cancer Biol. 2023;92:1-15.
doi pubmed - Laoukili J, Kooistra MR, Bras A, Kauw J, Kerkhoven RM, Morrison A, Clevers H, et al. FoxM1 is required for execution of the mitotic programme and chromosome stability. Nat Cell Biol. 2005;7(2):126-136.
doi pubmed - Zhu H. Forkhead box transcription factors in embryonic heart development and congenital heart disease. Life Sci. 2016;144:194-201.
doi pubmed - Yang TL, Tsai CH, Su YW, Chang YC, Lee F, Huang TY, Li FY, et al. Combining KPNA2 and FOXM1 expression as prognostic markers and therapeutic targets in hormone receptor-positive, HER2-negative breast cancer. Cancers (Basel). 2025;17(4):671.
doi pubmed - Wonsey DR, Follettie MT. Loss of the forkhead transcription factor FoxM1 causes centrosome amplification and mitotic catastrophe. Cancer Res. 2005;65(12):5181-5189.
doi pubmed - Song IS, Jeong YJ, Jeong SH, Heo HJ, Kim HK, Bae KB, Park YH, et al. FOXM1-induced PRX3 regulates stemness and survival of colon cancer cells via maintenance of mitochondrial function. Gastroenterology. 2015;149(4):1006-1016.e1009.
doi pubmed - Ma J, Qi G, Xu J, Ni H, Xu W, Ru G, Zhao Z, et al. Overexpression of forkhead box M1 and urokinase-type plasminogen activator in gastric cancer is associated with cancer progression and poor prognosis. Oncol Lett. 2017;14(6):7288-7296.
doi pubmed - Kopanja D, Pandey A, Kiefer M, Wang Z, Chandan N, Carr JR, Franks R, et al. Essential roles of FoxM1 in Ras-induced liver cancer progression and in cancer cells with stem cell features. J Hepatol. 2015;63(2):429-436.
doi pubmed - Liu C, Barger CJ, Karpf AR. FOXM1: a multifunctional oncoprotein and emerging therapeutic target in ovarian cancer. Cancers (Basel). 2021;13(12):3065.
doi pubmed - Li R, Wang X, Zhao X, Zhang X, Chen H, Ma Y, Liu Y. Centromere protein F and Forkhead box M1 correlation with prognosis of non-small cell lung cancer. Oncol Lett. 2020;19(2):1368-1374.
doi pubmed - Zhao C, Li X, Zhang R, Lyu H, Xiao S, Guo D, Ali DW, et al. Sense and anti-sense: role of FAM83A and FAM83A-AS1 in Wnt, EGFR, PI3K, EMT pathways and tumor progression. Biomed Pharmacother. 2024;173:116372.
doi pubmed - Ji H, Song H, Wang Z, Jiao P, Xu J, Li X, Du H, et al. FAM83A promotes proliferation and metastasis via Wnt/beta-catenin signaling in head neck squamous cell carcinoma. J Transl Med. 2021;19(1):423.
doi pubmed - Huang K, Jia Z, Li H, Peng Y, Chen X, Luo N, Song T, et al. Proto-oncogene FAM83A contributes to casein kinase 1-mediated mitochondrial maintenance and white adipocyte differentiation. J Biol Chem. 2022;298(10):102339.
doi pubmed - Lee SY, Meier R, Furuta S, Lenburg ME, Kenny PA, Xu R, Bissell MJ. FAM83A confers EGFR-TKI resistance in breast cancer cells and in mice. J Clin Invest. 2012;122(9):3211-3220.
doi pubmed - Chen S, Huang J, Liu Z, Liang Q, Zhang N, Jin Y. FAM83A is amplified and promotes cancer stem cell-like traits and chemoresistance in pancreatic cancer. Oncogenesis. 2017;6(3):e300.
doi pubmed - Snijders AM, Lee SY, Hang B, Hao W, Bissell MJ, Mao JH. FAM83 family oncogenes are broadly involved in human cancers: an integrative multi-omics approach. Mol Oncol. 2017;11(2):167-179.
doi pubmed - Richtmann S, Wilkens D, Warth A, Lasitschka F, Winter H, Christopoulos P, Herth FJF, et al. FAM83A and FAM83B as prognostic biomarkers and potential new therapeutic targets in NSCLC. Cancers (Basel). 2019;11(5):652.
doi pubmed - Sangrithi MN, Bernal JA, Madine M, Philpott A, Lee J, Dunphy WG, Venkitaraman AR. Initiation of DNA replication requires the RECQL4 protein mutated in Rothmund-Thomson syndrome. Cell. 2005;121(6):887-898.
doi pubmed - Chi Z, Nie L, Peng Z, Yang Q, Yang K, Tao J, Mi Y, et al. RecQL4 cytoplasmic localization: implications in mitochondrial DNA oxidative damage repair. Int J Biochem Cell Biol. 2012;44(11):1942-1951.
doi pubmed - Dietschy T, Shevelev I, Pena-Diaz J, Huhn D, Kuenzle S, Mak R, Miah MF, et al. p300-mediated acetylation of the Rothmund-Thomson-syndrome gene product RECQL4 regulates its subcellular localization. J Cell Sci. 2009;122(Pt 8):1258-1267.
doi pubmed - Luong TT, Li Z, Priedigkeit N, Parker PS, Bohm S, Rapchak K, Lee AV, et al. Hrq1/RECQL4 regulation is critical for preventing aberrant recombination during DNA intrastrand crosslink repair and is upregulated in breast cancer. PLoS Genet. 2022;18(9):e1010122.
doi pubmed - Su Y, Meador JA, Calaf GM, Proietti De-Santis L, Zhao Y, Bohr VA, Balajee AS. Human RecQL4 helicase plays critical roles in prostate carcinogenesis. Cancer Res. 2010;70(22):9207-9217.
doi pubmed - Mo D, Fang H, Niu K, Liu J, Wu M, Li S, Zhu T, et al. Human helicase RECQL4 drives cisplatin resistance in gastric cancer by activating an AKT-YB1-MDR1 signaling pathway. Cancer Res. 2016;76(10):3057-3066.
doi pubmed - Duan S, Han X, Akbari M, Croteau DL, Rasmussen LJ, Bohr VA. Interaction between RECQL4 and OGG1 promotes repair of oxidative base lesion 8-oxoG and is regulated by SIRT1 deacetylase. Nucleic Acids Res. 2020;48(12):6530-6546.
doi pubmed - Quest AF, Lobos-Gonzalez L, Nunez S, Sanhueza C, Fernandez JG, Aguirre A, Rodriguez D, et al. The caveolin-1 connection to cell death and survival. Curr Mol Med. 2013;13(2):266-281.
doi pubmed - Torrejon B, Cristobal I, Rojo F, Garcia-Foncillas J. Caveolin-1 is markedly downregulated in patients with early-stage colorectal cancer. World J Surg. 2017;41(10):2625-2630.
doi pubmed - Saeed-Vafa D, Marchion DC, McCarthy SM, Hakam A, Lopez A, Wenham RM, Apte SM, et al. Utilizing digital pathology to quantify stromal caveolin-1 expression in malignant and benign ovarian tumors: Associations with clinicopathological parameters and clinical outcomes. PLoS One. 2021;16(11):e0256615.
doi pubmed - Sloan EK, Ciocca DR, Pouliot N, Natoli A, Restall C, Henderson MA, Fanelli MA, et al. Stromal cell expression of caveolin-1 predicts outcome in breast cancer. Am J Pathol. 2009;174(6):2035-2043.
doi pubmed - Koo JS, Park S, Kim SI, Lee S, Park BW. The impact of caveolin protein expression in tumor stroma on prognosis of breast cancer. Tumour Biol. 2011;32(4):787-799.
doi pubmed - Witkiewicz AK, Dasgupta A, Sammons S, Er O, Potoczek MB, Guiles F, Sotgia F, et al. Loss of stromal caveolin-1 expression predicts poor clinical outcome in triple negative and basal-like breast cancers. Cancer Biol Ther. 2010;10(2):135-143.
doi pubmed - Raja SA, Shah STA, Tariq A, Bibi N, Sughra K, Yousuf A, Khawaja A, et al. Caveolin-1 and dynamin-2 overexpression is associated with the progression of bladder cancer. Oncol Lett. 2019;18(1):219-226.
doi pubmed - Diaz-Valdivia N, Bravo D, Huerta H, Henriquez S, Gabler F, Vega M, Romero C, et al. Enhanced caveolin-1 expression increases migration, anchorage-independent growth and invasion of endometrial adenocarcinoma cells. BMC Cancer. 2015;15:463.
doi pubmed - Moreno-Caceres J, Caballero-Diaz D, Nwosu ZC, Meyer C, Lopez-Luque J, Malfettone A, Lastra R, et al. The level of caveolin-1 expression determines response to TGF-beta as a tumour suppressor in hepatocellular carcinoma cells. Cell Death Dis. 2017;8(10):e3098.
doi pubmed - Demirci NS, Dogan M, Erdem GU, Kacar S, Turhan T, Kilickap S, Cigirgan LC, et al. Is plasma caveolin-1 level a prognostic biomarker in metastatic pancreatic cancer? Saudi J Gastroenterol. 2017;23(3):183-189.
doi pubmed - Goetz JG, Lajoie P, Wiseman SM, Nabi IR. Caveolin-1 in tumor progression: the good, the bad and the ugly. Cancer Metastasis Rev. 2008;27(4):715-735.
doi pubmed - Chen D, Shen C, Du H, Zhou Y, Che G. Duplex value of caveolin-1 in non-small cell lung cancer: a meta analysis. Fam Cancer. 2014;13(3):449-457.
doi pubmed - Leiser D, Samanta S, Eley J, Strauss J, Creed M, Kingsbury T, Staats PN, et al. Role of caveolin-1 as a biomarker for radiation resistance and tumor aggression in lung cancer. PLoS One. 2021;16(11):e0258951.
doi pubmed - Kato T, Miyamoto M, Kato K, Cho Y, Itoh T, Morikawa T, Okushiba S, et al. Difference of caveolin-1 expression pattern in human lung neoplastic tissue. Atypical adenomatous hyperplasia, adenocarcinoma and squamous cell carcinoma. Cancer Lett. 2004;214(1):121-128.
doi pubmed - Duregon E, Senetta R, Bertero L, Bussolati B, Annaratone L, Pittaro A, Papotti M, et al. Caveolin 1 expression favors tumor growth and is associated with poor survival in primary lung adenocarcinomas. Tumour Biol. 2017;39(2):1010428317694311.
doi pubmed - Shi YB, Li J, Lai XN, Jiang R, Zhao RC, Xiong LX. Multifaceted Roles of Caveolin-1 in lung cancer: a new investigation focused on tumor occurrence, development and therapy. Cancers (Basel). 2020;12(2):291.
doi pubmed - Lawson WE, Polosukhin VV, Stathopoulos GT, Zoia O, Han W, Lane KB, Li B, et al. Increased and prolonged pulmonary fibrosis in surfactant protein C-deficient mice following intratracheal bleomycin. Am J Pathol. 2005;167(5):1267-1277.
doi pubmed - Glasser SW, Senft AP, Maxfield MD, Ruetschilling TL, Baatz JE, Page K, Korfhagen TR. Genetic replacement of surfactant protein-C reduces respiratory syncytial virus induced lung injury. Respir Res. 2013;14(1):19.
doi pubmed - Ota C, Yamada M, Fujino N, Motohashi H, Tando Y, Takei Y, Suzuki T, et al. Histone deacetylase inhibitor restores surfactant protein-C expression in alveolar-epithelial type II cells and attenuates bleomycin-induced pulmonary fibrosis in vivo. Exp Lung Res. 2015;41(8):422-434.
doi pubmed - Li B, Meng YQ, Li Z, Yin C, Lin JP, Zhu DJ, Zhang SB. MiR-629-3p-induced downregulation of SFTPC promotes cell proliferation and predicts poor survival in lung adenocarcinoma. Artif Cells Nanomed Biotechnol. 2019;47(1):3286-3296.
doi pubmed
This article is distributed under the terms of the Creative Commons Attribution Non-Commercial 4.0 International License, which permits unrestricted non-commercial use, distribution, and reproduction in any medium, provided the original work is properly cited.
World Journal of Oncology is published by Elmer Press Inc.