Figures
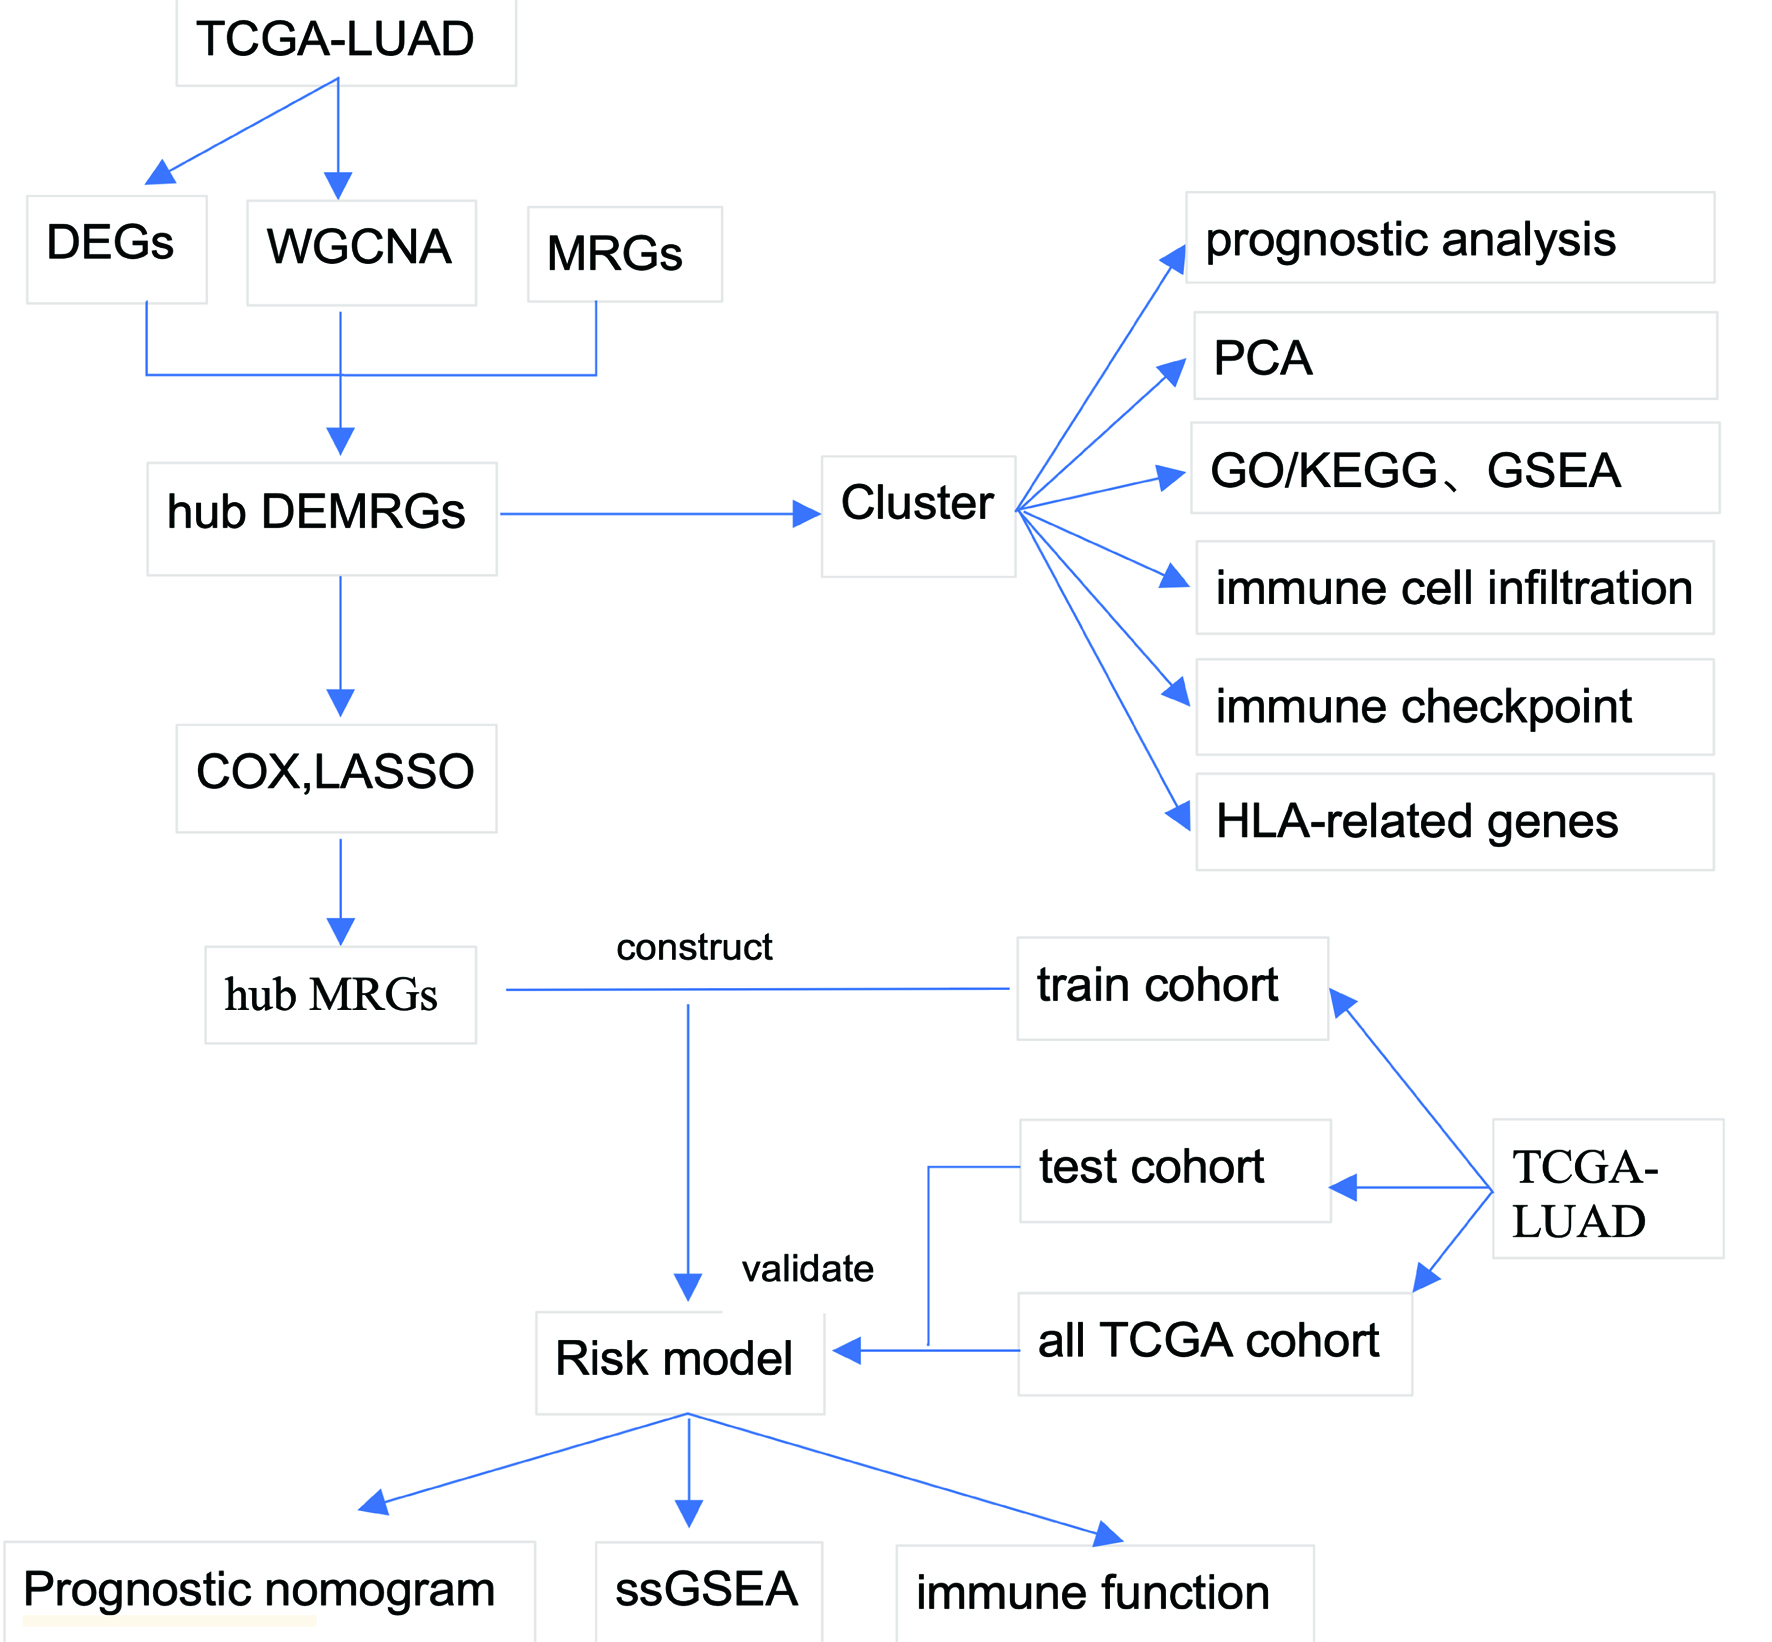
↓ Figure 1. Study workflow. Schematic overview of
the analytical pipeline. The workflow encompasses differential expression analysis, WGCNA, MRG
integration, consensus clustering, functional enrichment, immune microenvironment characterization,
prognostic model construction, and validation. MRG: metabolic reprogramming gene; WGCNA: weighted gene
co-expression network analysis.
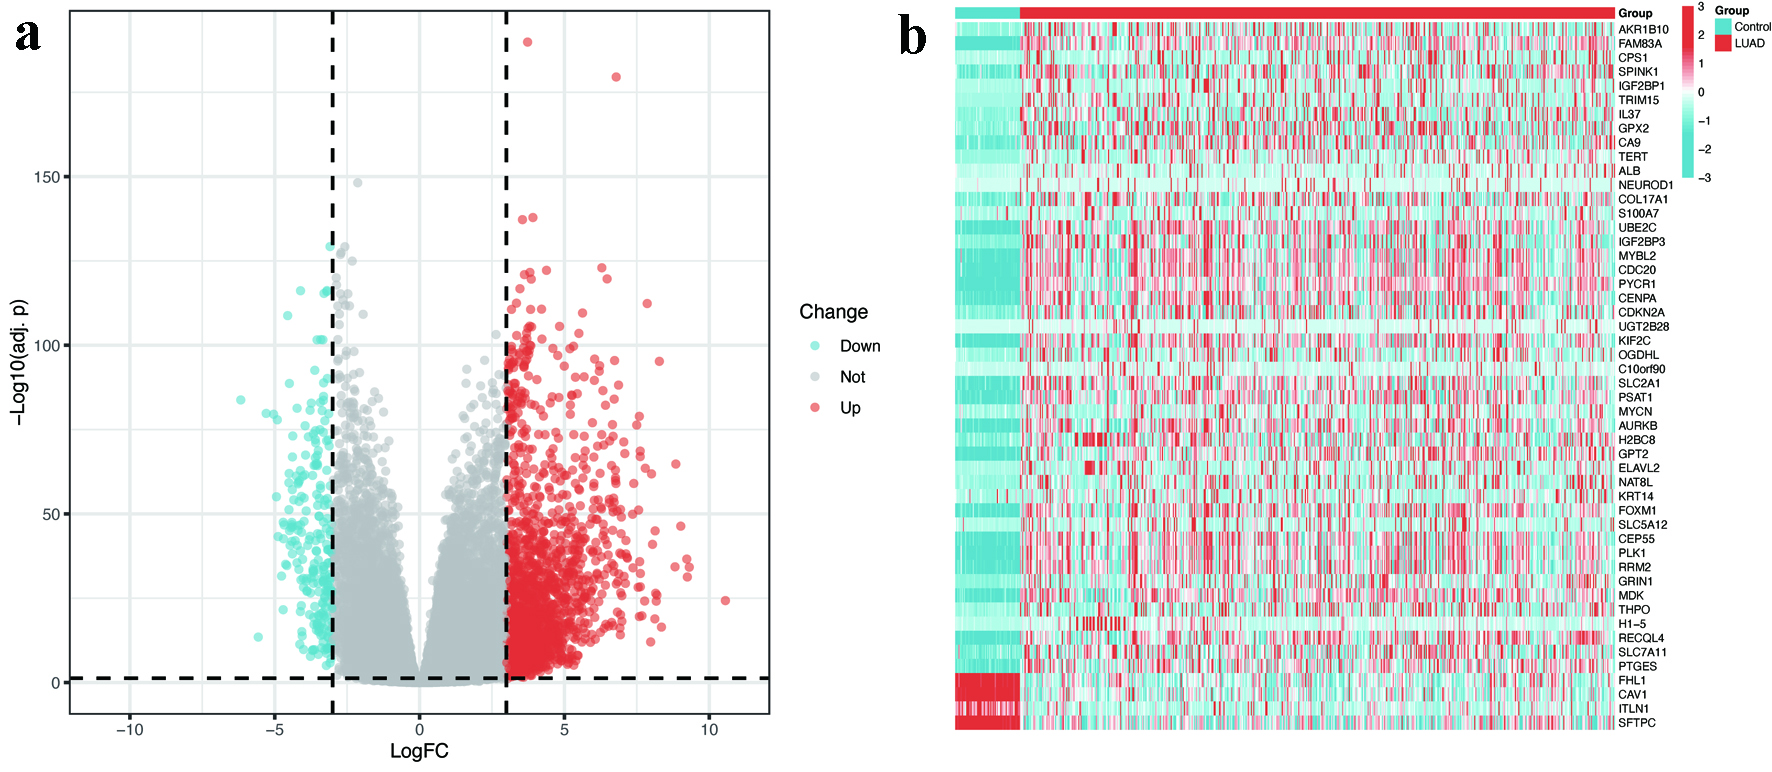
↓ Figure 2. Identification of DEGs in LUAD. (a)
Volcano plot illustrating 1,952 upregulated (red) and 206 downregulated (blue) genes in LUAD tissues
compared to normal controls (|log2FC| > 3, FDR < 0.05). (b) Heatmap displaying the expression
patterns of top 50 DEGs across LUAD and normal samples. The color scale represents Z-scores of
normalized RNA expression levels (blue = low, red = high). DEGs: differentially expressed genes; FC:
fold change; FDR: false discovery rate; LUAD: lung adenocarcinoma.
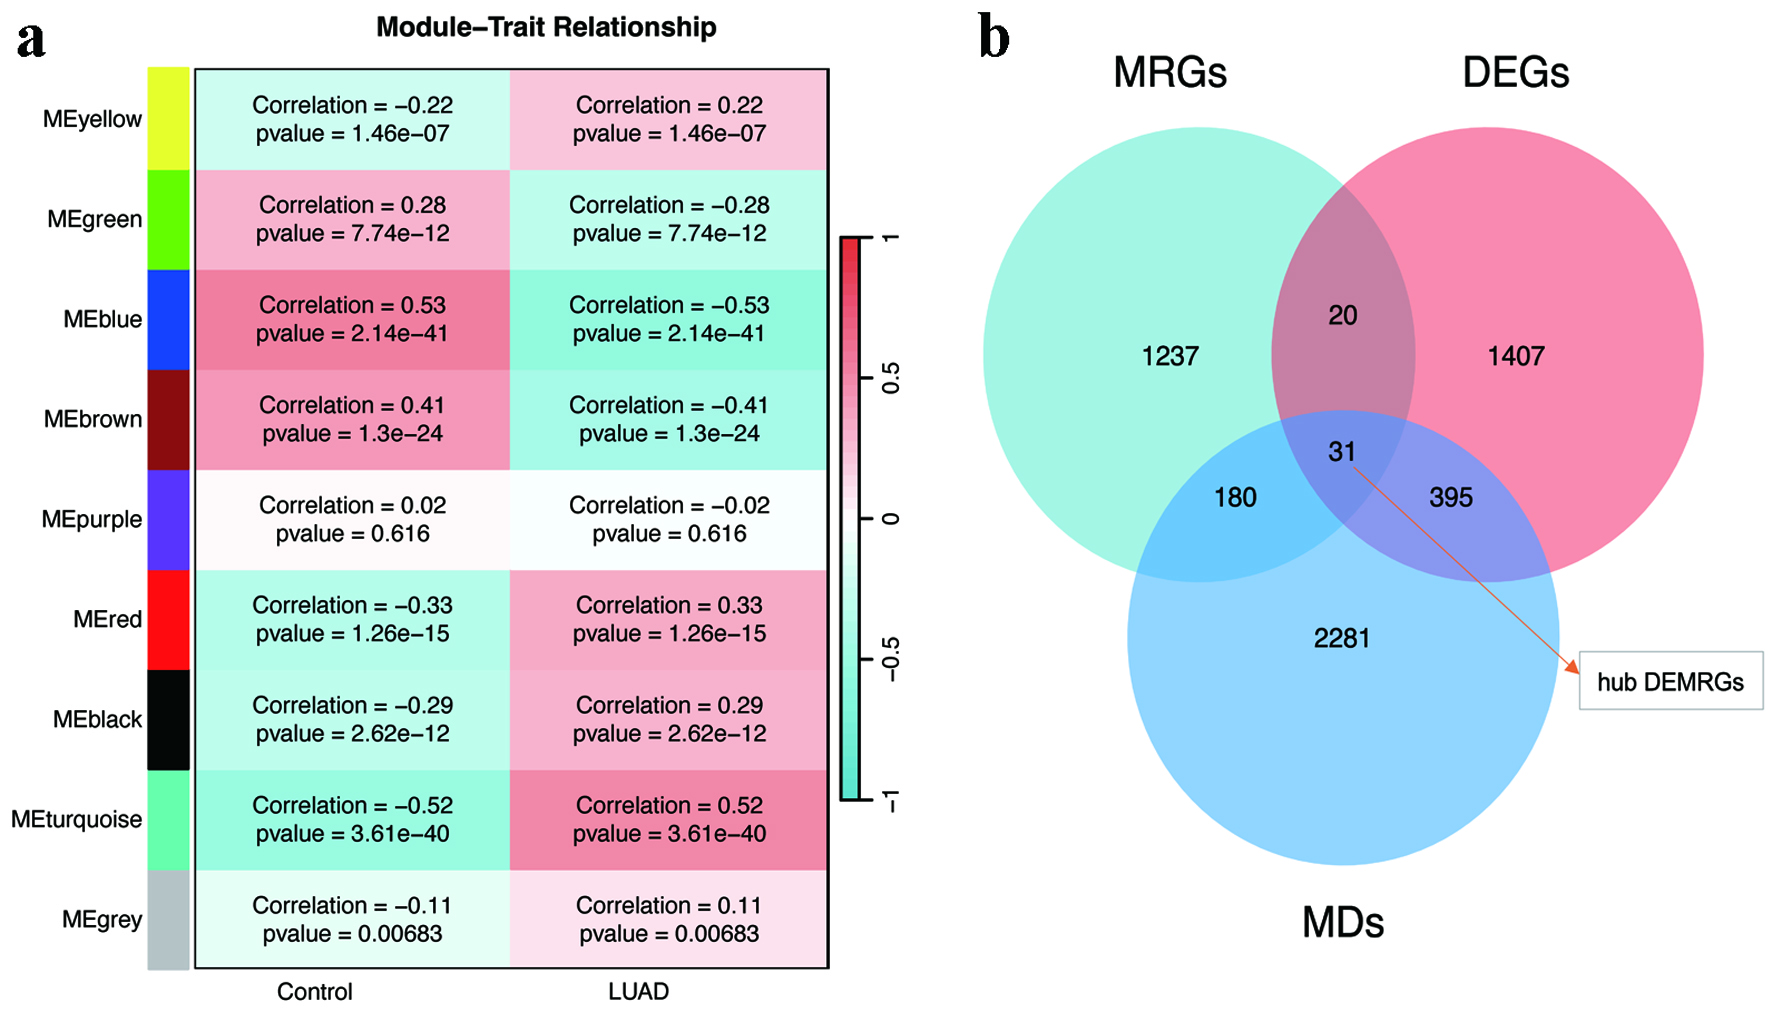
↓ Figure 3. WGCNA and hub gene identification.
(a) Module-trait correlation heatmap highlighting the turquoise, blue, brown, and red modules with the
strongest associations to LUAD. (b) Venn diagram intersecting WGCNA-derived modules, DEGs, and MRGs to
identify 31 hub DEMRGs. DEGs: differentially expressed genes; DEMRGs: differentially expressed metabolic
reprogramming genes; LUAD: lung adenocarcinoma; MRG: metabolic reprogramming gene; WGCNA: weighted gene
co-expression network analysis.
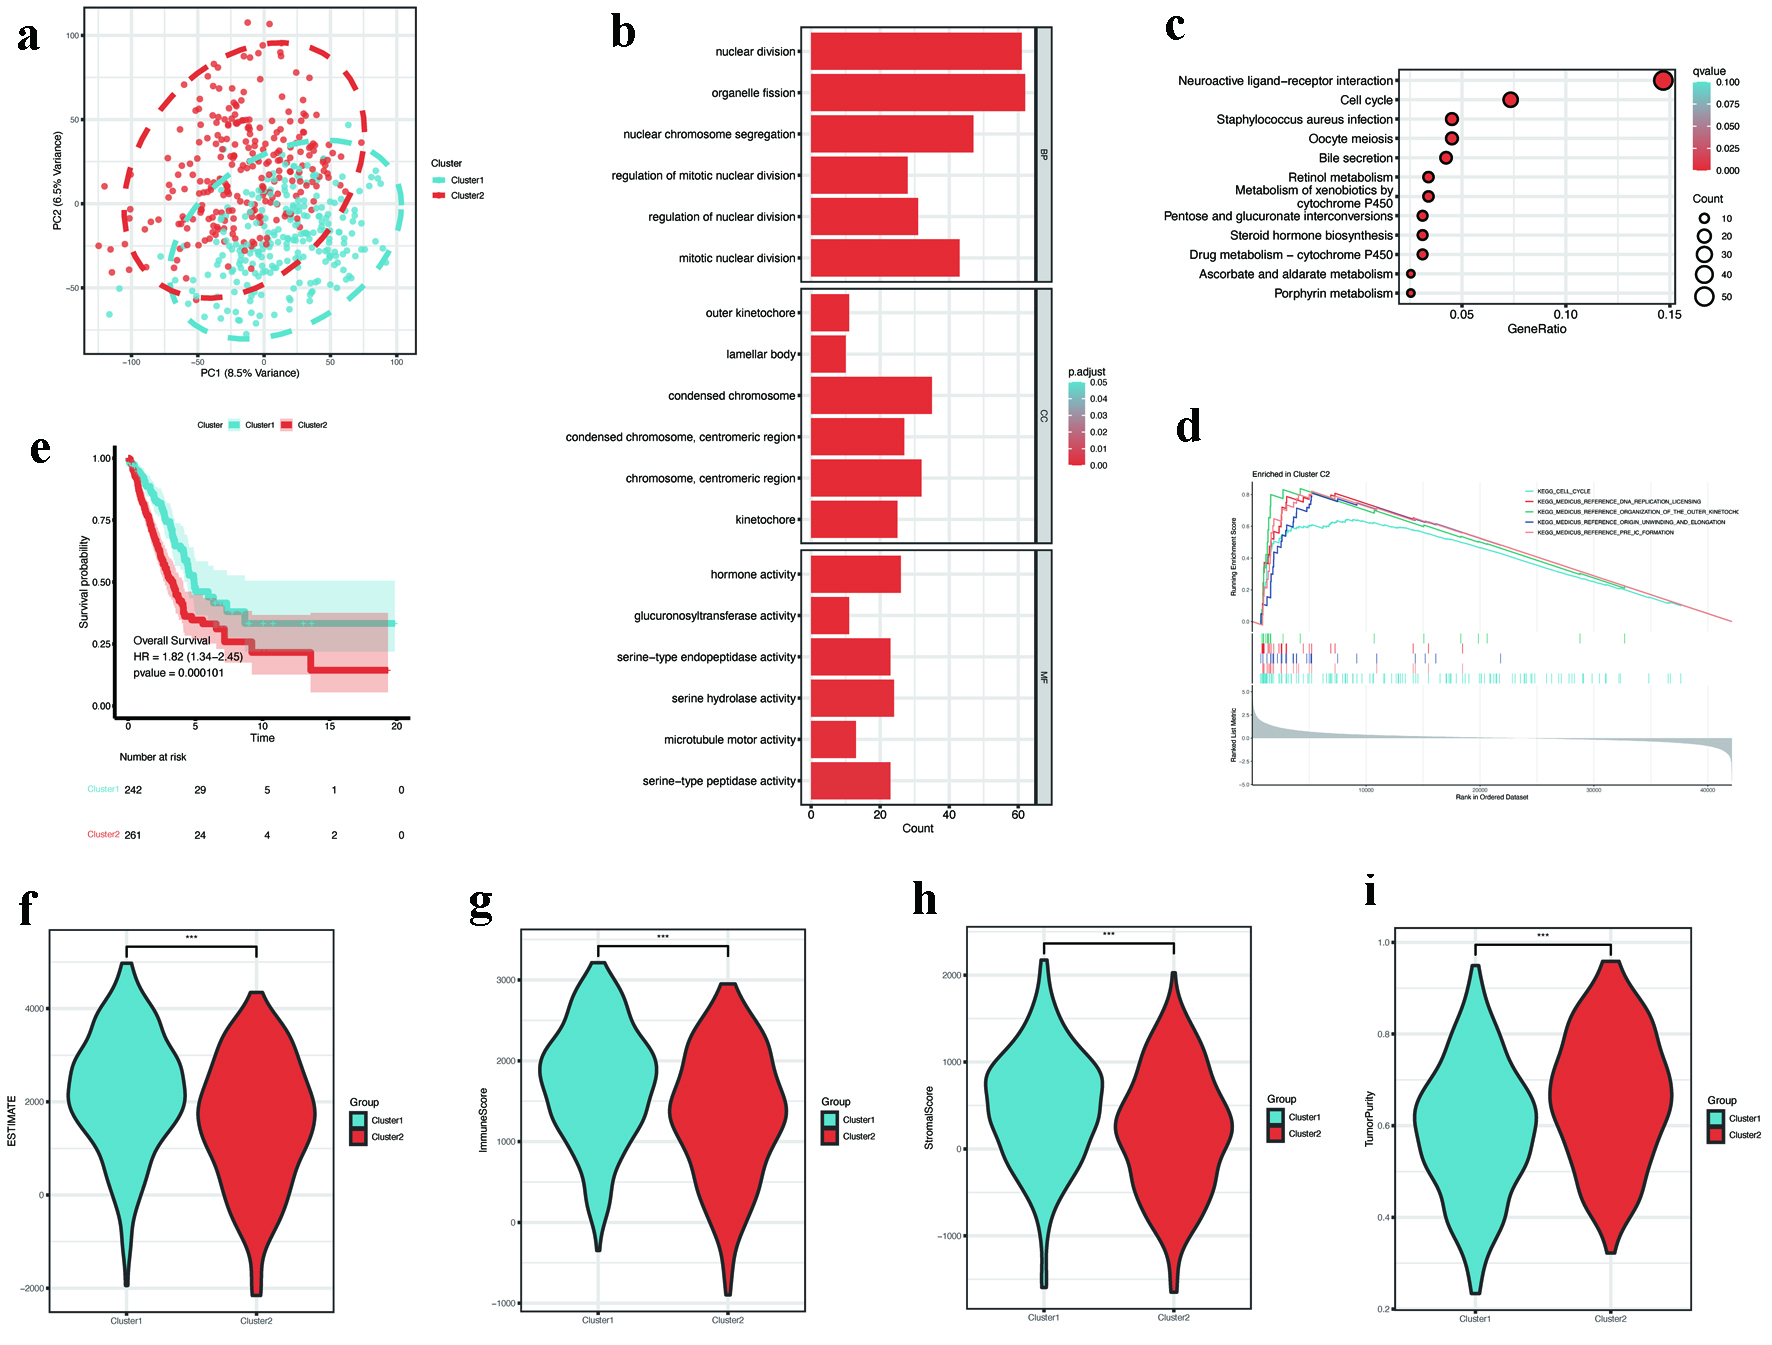
↓ Figure 4. Consensus clustering and subtype
characterization. (a) PCA showing distinct separation between consensus clusters C1 (n = 242) and C2 (n
= 261). (b) GO enrichment of subtype-specific DEGs, emphasizing nuclear division and chromosome
organization. (c) KEGG pathway analysis showing enrichment in cell cycle and neuroactive ligand-receptor
interaction. (d) GSEA plot revealing activation of DNA replication pathways in C2 (FDR < 0.05). (e)
Kaplan-Meier survival curves showing poorer overall survival in C2 (log-rank P < 0.001). (f-i) Tumor
microenvironment scores: (f) ESTIMATE, (g) immune, (h) stromal, and (i) tumor purity (P < 0.001).
DEGs: differentially expressed genes; FDR: discovery rate; GO: Gene Ontology; GSEA: gene set enrichment
analysis; KEGG: Kyoto Encyclopedia of Genes and Genomes; PCA: principal component analysis.
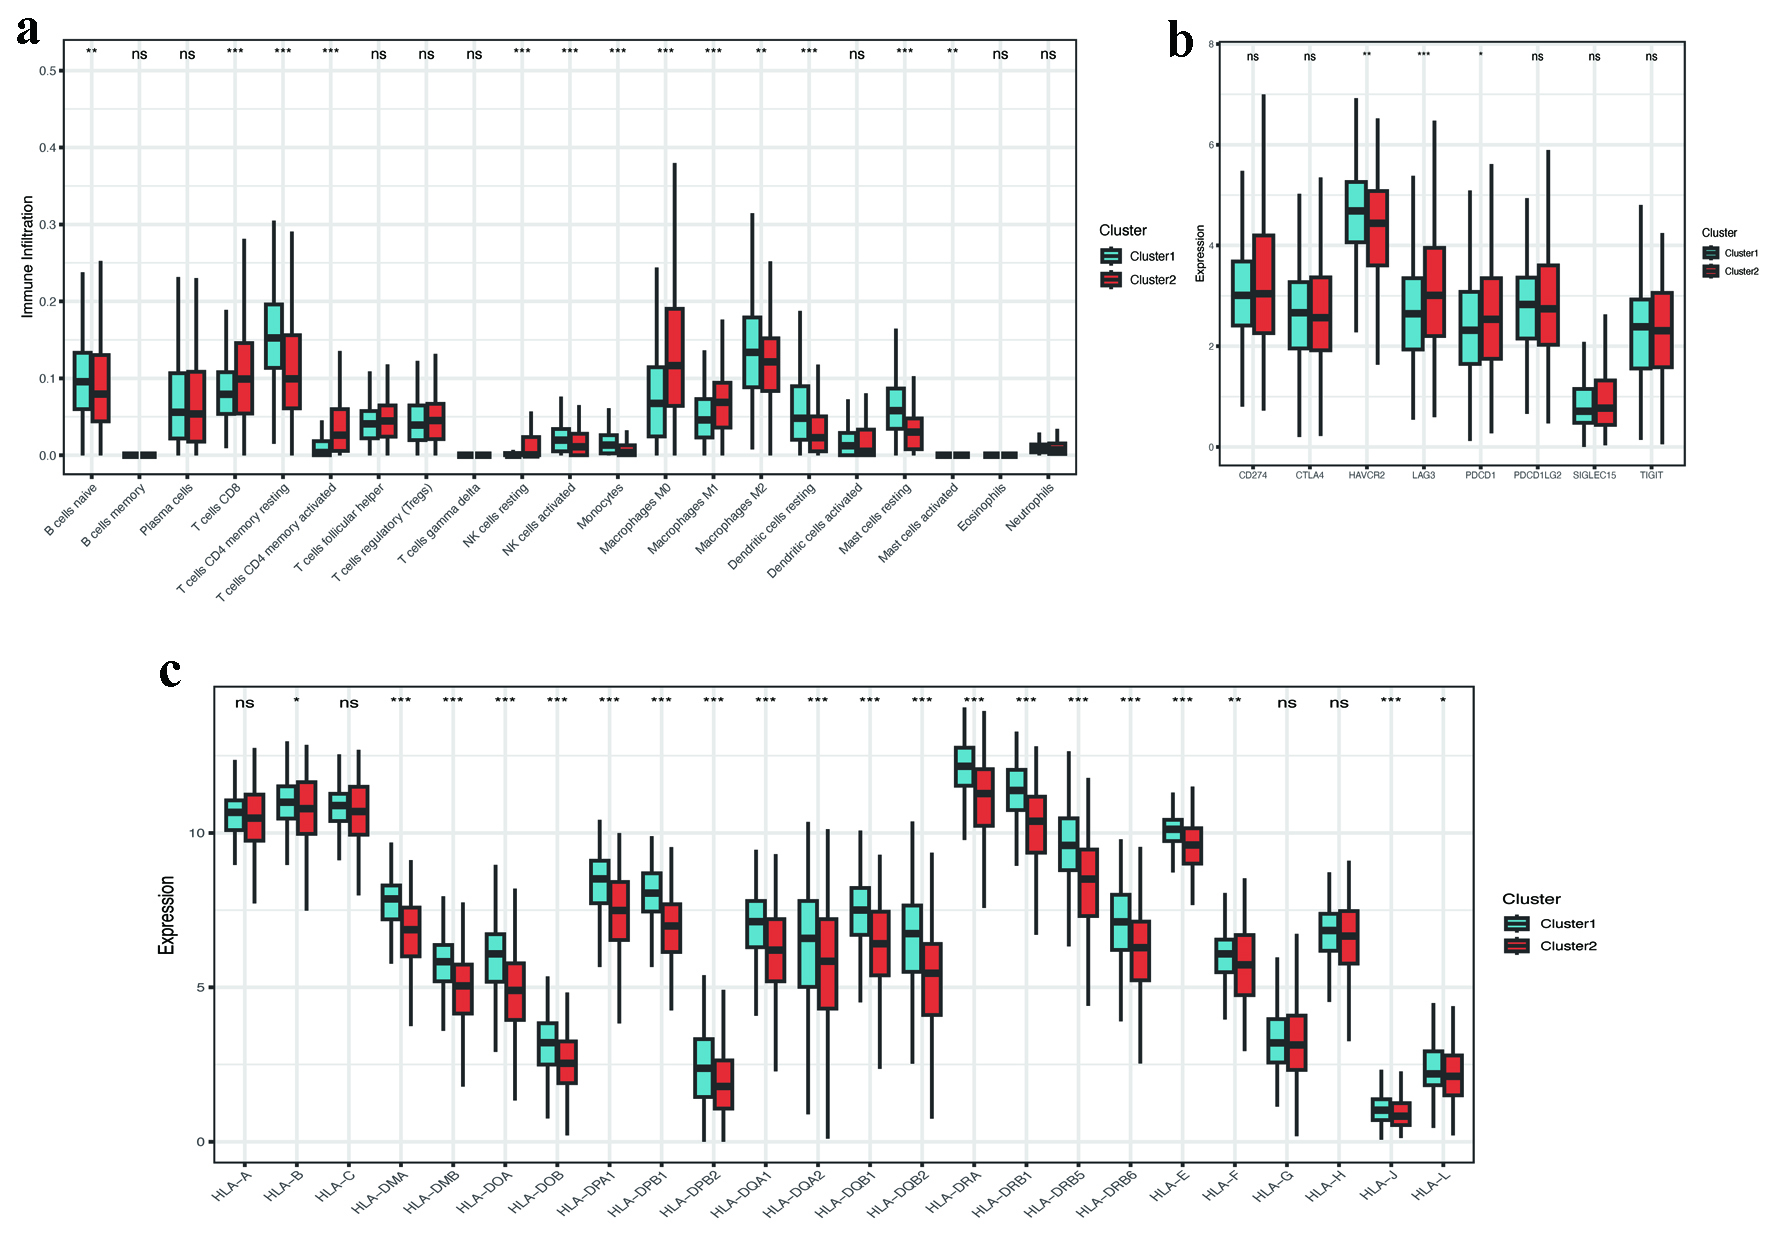
↓ Figure 5. Immune microenvironment and
checkpoint analysis. (a) CIBERSORT-derived immune cell infiltration profiles between clusters (P <
0.001). (b) Differential expression of immune checkpoint genes (LAG3, PDCD1LG2, HAVCR2; P
< 0.05). (c) Reduced HLA-related gene expression in C2 (P < 0.001). HLA: human leukocyte
antigen.
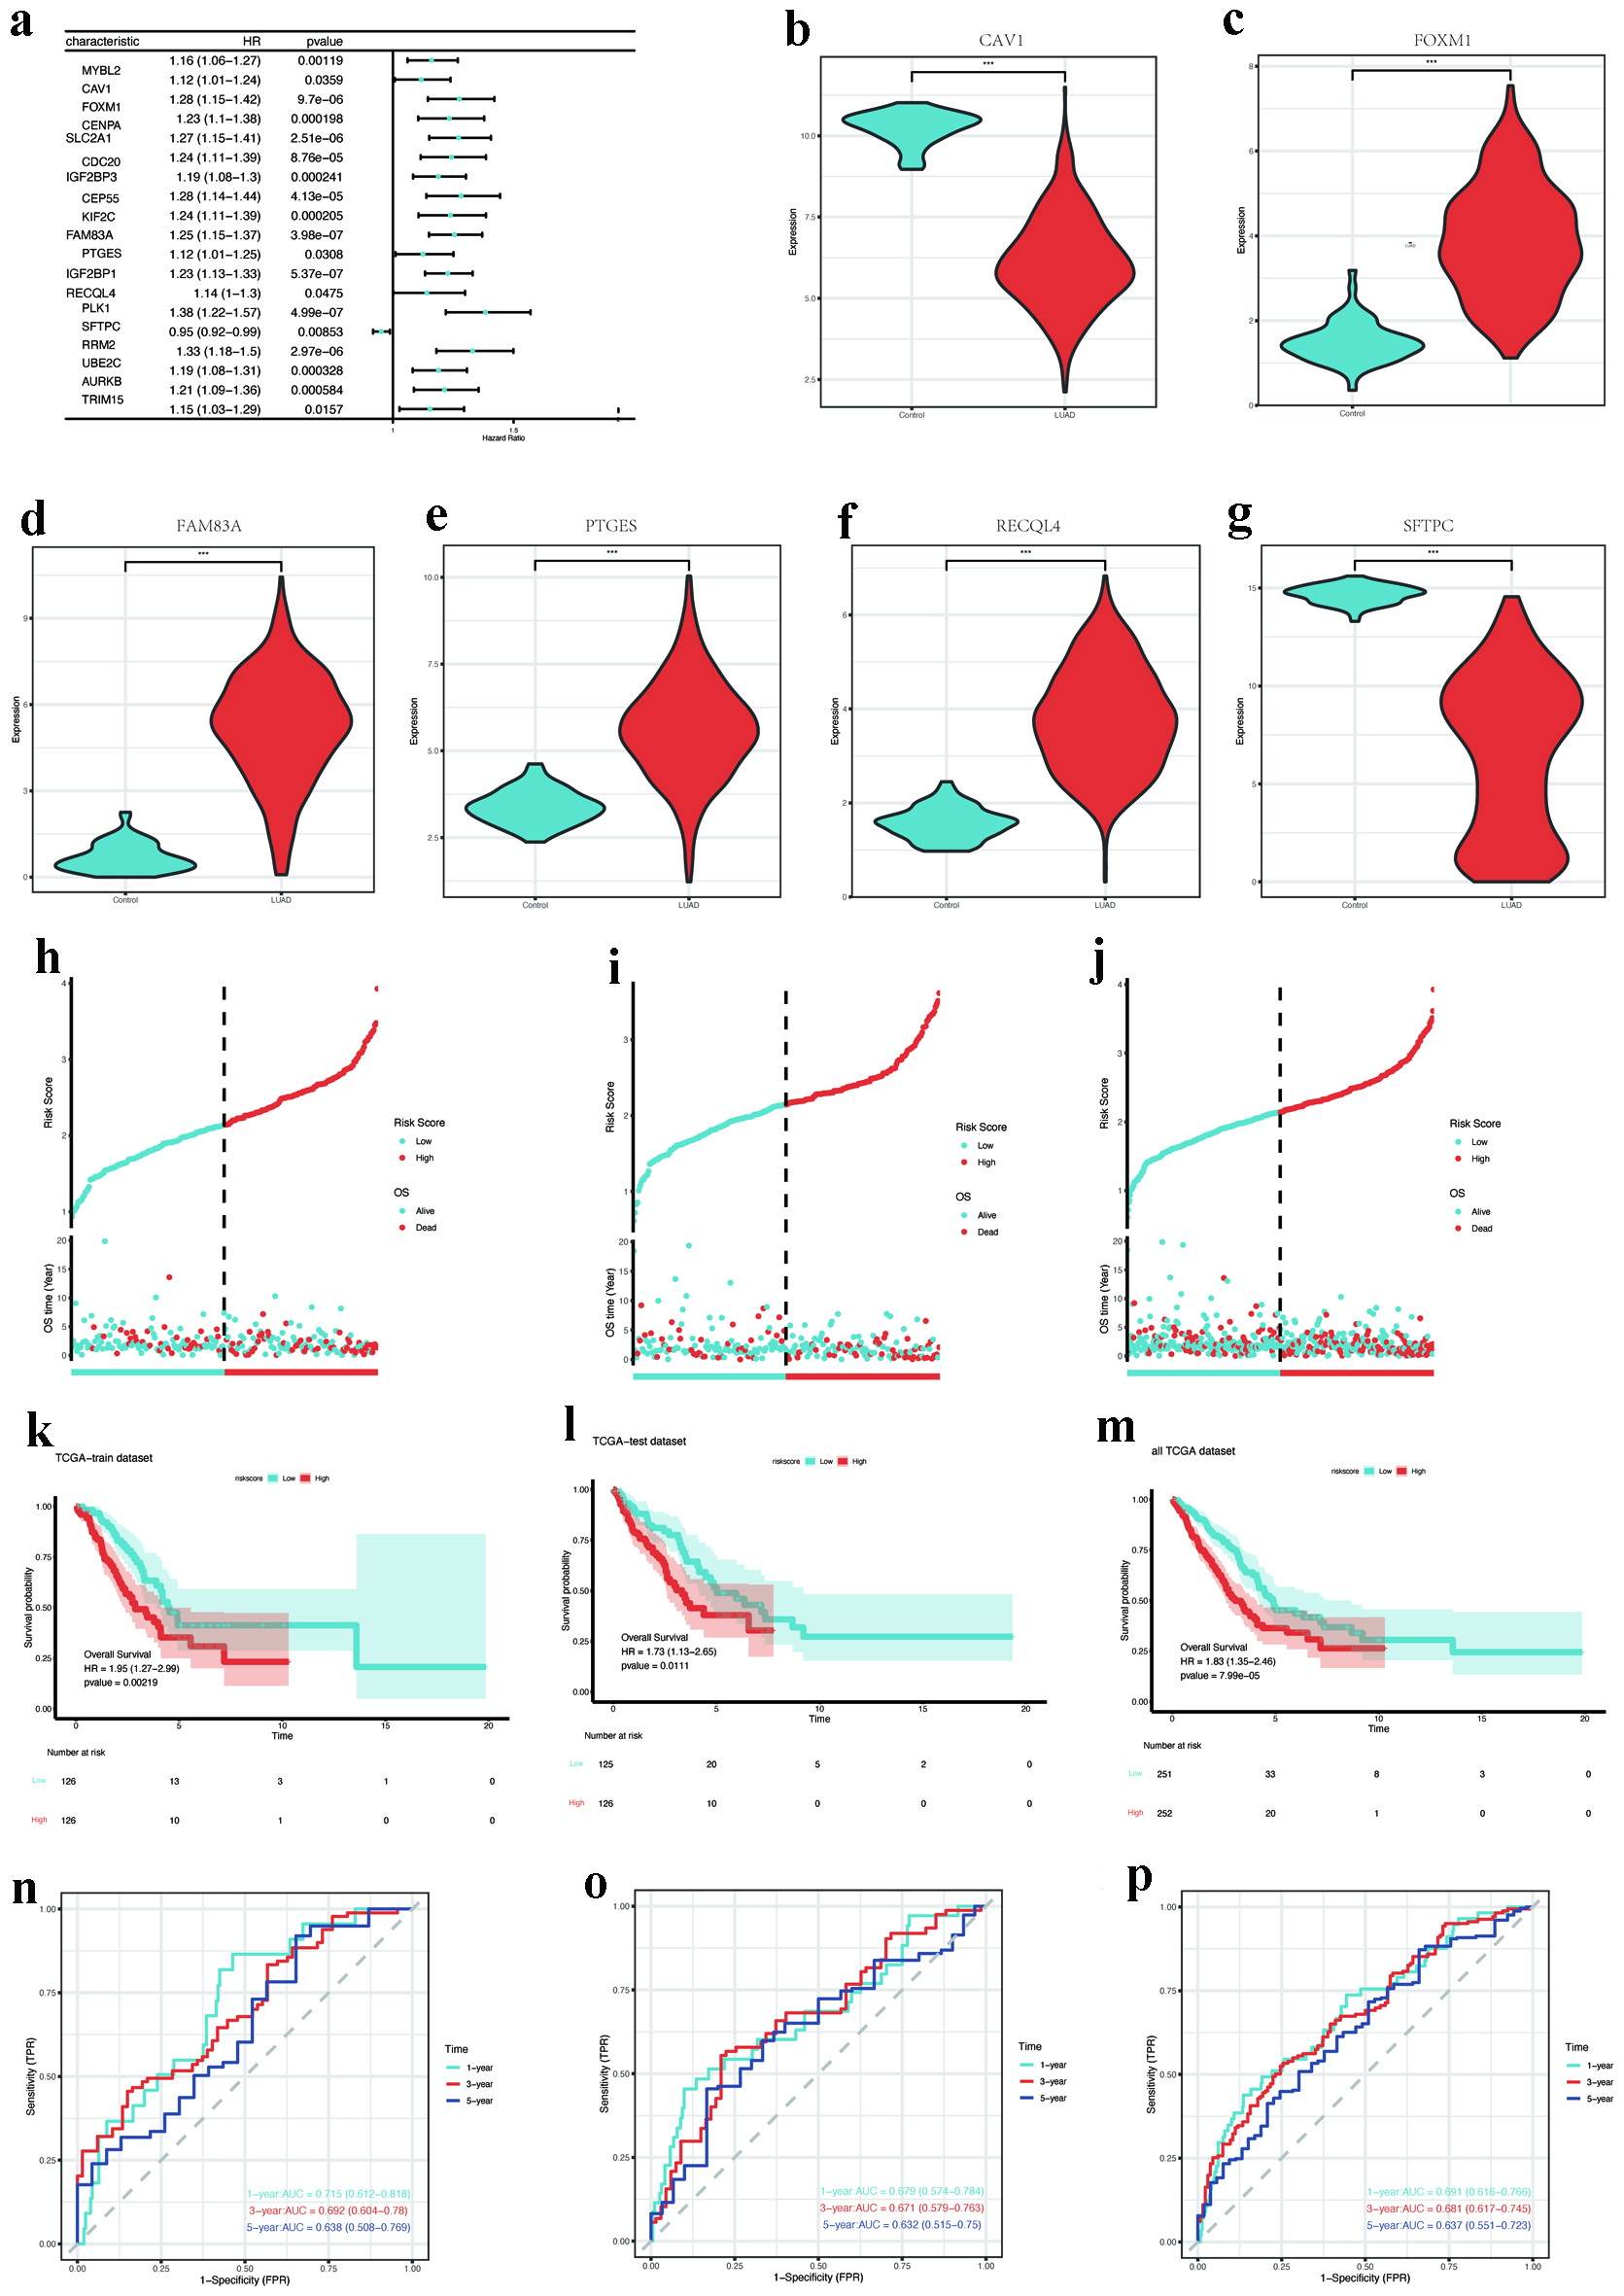
↓ Figure 6. Prognostic gene screening and model
validation. (a) Forest plot of univariate Cox regression for 19 hub DEMRGs with prognostic significance.
(b-g) Expression validation of key DEMRGs (CAV1, FOXM1, FAM83A, PTGES, RECQL4, and SFTPC)
in LUAD vs. normal tissues (P < 0.001). (h-j) Risk score distribution and survival status in
training, testing, and entire TCGA cohorts. (k-m) Kaplan-Meier survival curves stratified by risk groups
(log-rank P < 0.05). (n-p) ROC curves for 1-year survival prediction (AUC: 0.715 training, 0.679
testing, 0.691 overall). AUC: area under the curve; DEMRGs: differentially expressed metabolic
reprogramming genes; LUAD: lung adenocarcinoma; ROC: receiver operating characteristic; TCGA: The Cancer
Genome Atlas.
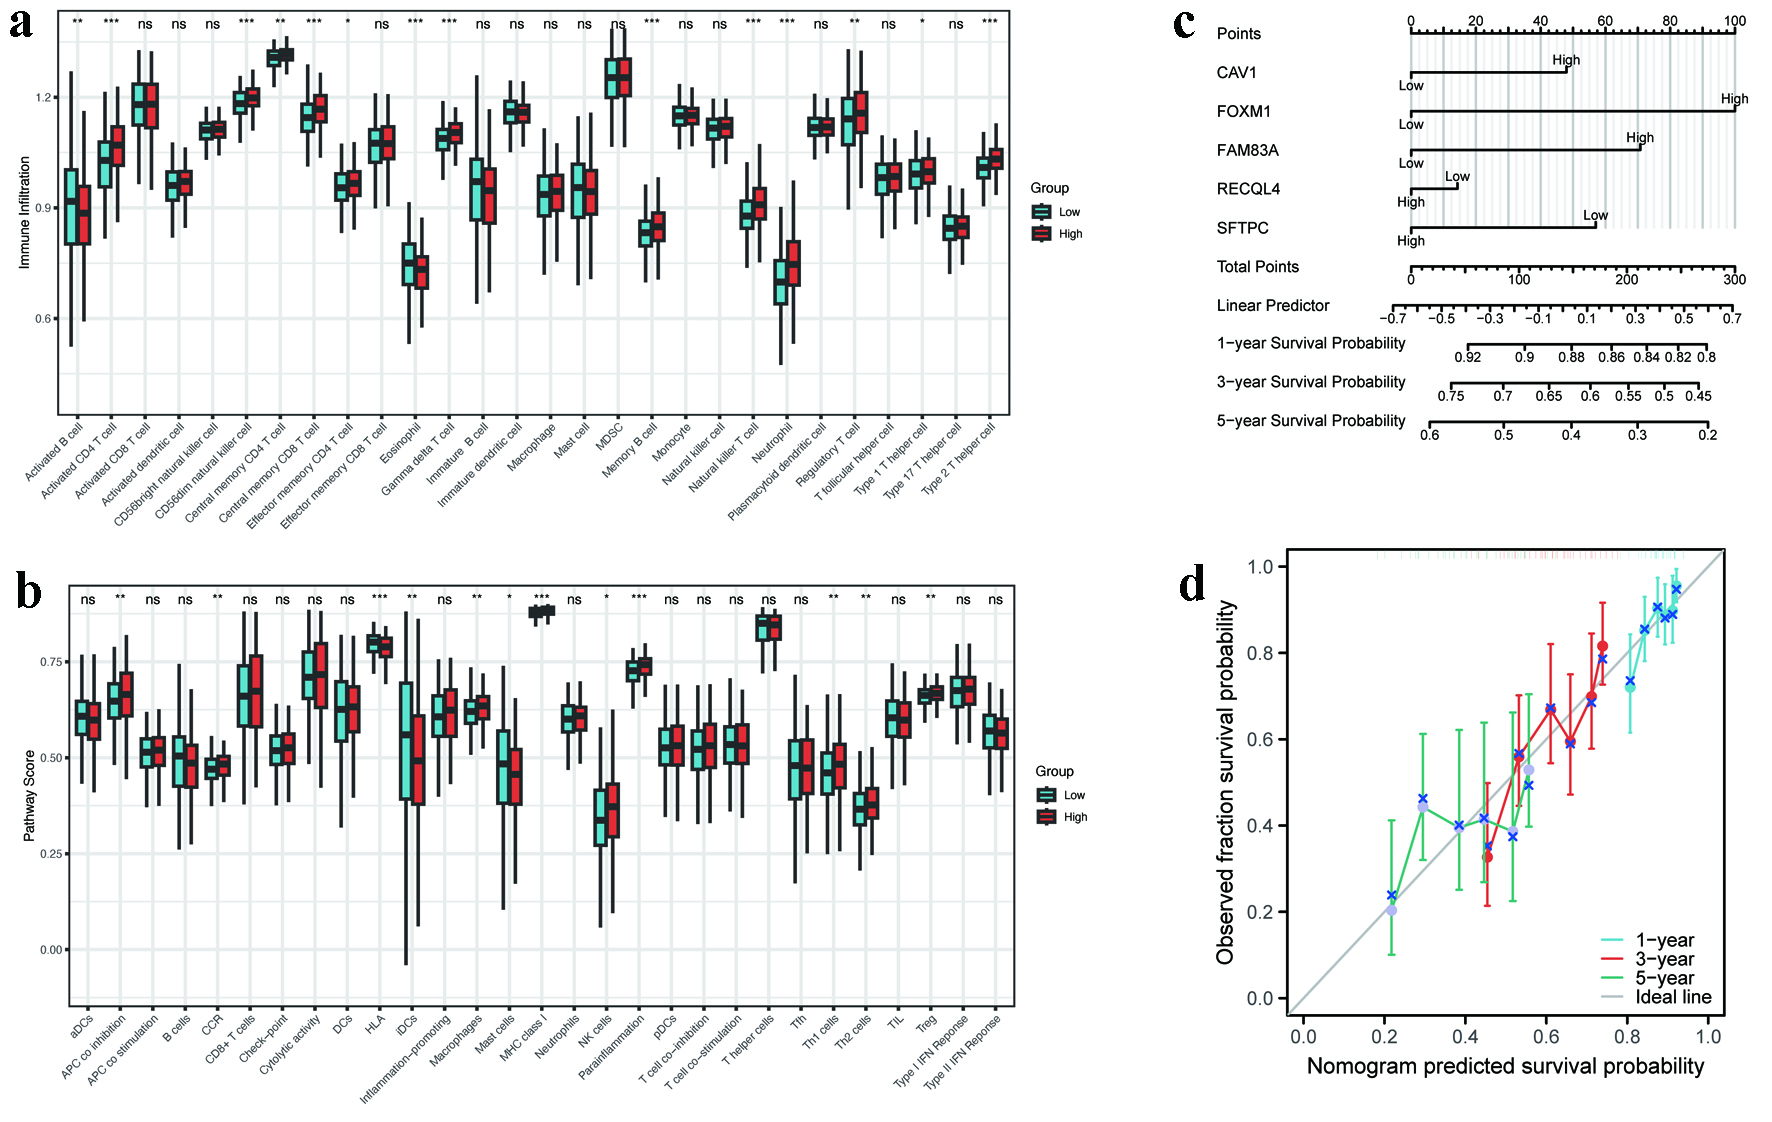
↓ Figure 7. Immune landscape and nomogram
performance. (a) ssGSEA scores of immune cell subsets in high- versus low-risk groups (P < 0.05). (b)
GSVA enrichment of immune-related pathways (APC co-inhibition, MHC class I, etc.). (c) Nomogram
integrating five hub MRGs for survival prediction (C-index = 0.623). (d) Calibration curves for 1-, 3-,
and 5-year survival probability. APC: antigen-presenting cell; GSVA: gene set variation analysis; MHC:
major histocompatibility complex; MRGs: metabolic reprogramming genes; ssGSEA: single-sample gene set
enrichment analysis.