| World Journal of Oncology, ISSN 1920-4531 print, 1920-454X online, Open Access |
| Article copyright, the authors; Journal compilation copyright, World J Oncol and Elmer Press Inc |
| Journal website https://wjon.elmerpub.com |
Original Article
Volume 000, Number 000, August 2025, pages 000-000

Association Between Platelet-to-Lymphocyte Ratio and Insulin Resistance in Cancer Survivors: A Cross-Sectional Study Based on the NHANES 2005 - 2018
Jiao Wanga, b ![]() , Tao Lia
, Tao Lia
aDepartment of Oncology, Qilu Hospital of Shandong University Dezhou Hospital, Dezhou 253000, Shandong, China
bCorresponding Author: Jiao Wang, Department of Oncology, Qilu Hospital of Shandong University Dezhou Hospital, Dezhou 253000, Shandong, China
Manuscript submitted April 29, 2025, accepted July 24, 2025, published online August 7, 2025
Short title: Association Between PLR and IR in Cancer Survivors
doi: https://doi.org/10.14740/wjon2603
| Abstract | ▴Top |
Background: The incidence of insulin resistance (IR) among cancer survivors is significantly higher than that in the general population. Current diagnostic methods for IR are complex, often requiring fasting blood samples, specialized laboratory tests, and sometimes invasive procedures, which limit their routine clinical application. This study investigated the association between platelet-to-lymphocyte ratio (PLR), a readily available marker from routine blood tests, and IR in cancer survivors, aiming to find a more straightforward predictor of IR that could potentially simplify screening and monitoring processes in this high-risk population.
Methods: This cross-sectional study analyzed data from 1,418 cancer survivors from the NHANES 2005-2018 database. IR was assessed by three indicators: homeostasis model assessment of insulin resistance (HOMA-IR), quantitative insulin sensitivity check index (QUICKI), and the triglyceride-glucose (TyG) index. Multivariable logistic regression models were used to examine the relationship between PLR quartiles and IR, with restricted cubic spline (RCS) analyses to evaluate non-linear relationships. Covariates included demographic (age, gender, race/ethnicity), socioeconomic (marital status, education, family poverty income ratio), lifestyle (smoking status, alcohol consumption, sleep duration, physical activity) and health status variables (body mass index (BMI), history of cardiovascular disease, hypertension status). Subgroup analyses were conducted to identify sensitive populations.
Results: The 1,418 cancer survivors (weighted population: 20,233,847; median age 69.0 years; 58.4% female) with low HOMA-IR (< 2.5), high QUICKI (≥ 0.33) and low TyG index (< 4.68) demonstrated more favorable metabolic profiles, including lower PLR values, better socioeconomic status, better lifestyle, and lower chronic disease burden. Compared to the lowest PLR quartile (Q1), individuals in the highest quartile (Q4) showed significantly increased IR risk when assessed by QUICKI (hazard ratio (HR) = 1.61, 95% confidence interval (CI): 1.02 - 2.53, P = 0.040) and the TyG index (HR = 1.56, 95% CI: 1.02 - 2.45, P = 0.035). Each increment in PLR quartile was associated with a 19% (QUICKI) and 15% (TyG) increased risk of IR. Receiver operating characteristic (ROC) analysis results indicated that PLR cutoff values in the range of 124 - 137 can serve as screening thresholds for IR in cancer survivors. In the subgroup analysis, the PLR and IR showed no significant interaction across all examined subgroup characteristics in both the HOMA-IR and QUICKI models (P > 0.05). However, in the TyG index model, individuals in the Q4 compared to the Q1 demonstrated greater susceptibility to IR in those with physical activity < 600 metabolic equivalent of task (MET)-mins/week (odds ratio (OR) = 2.28, 95% CI: 1.12 - 4.61); and those with a history of hypertension (OR = 1.95, 95% CI: 1.05 - 3.63), with P values for interaction of 0.007 and 0.036, respectively.
Conclusions: Higher PLR levels indicated a significantly increased risk of IR in cancer survivors, especially when assessed by QUICKI and the TyG index. This relationship showed no significant interaction between subgroups in the HOMA-IR and QUICKI models, but in the TyG index model, and the association was more pronounced among individuals with low physical activity and those with a history of hypertension. As a simple, cost-effective biomarker derived from routine blood tests, PLR offers potential clinical value for the assessment of IR risk in cancer survivors, especially in high-risk subgroups.
Keywords: Platelet-to-lymphocyte ratio; Insulin resistance; Cancer survivors; NHANES
| Introduction | ▴Top |
The rising incidence of cancer, combined with significant treatment breakthroughs, has led to a marked increase in the number of cancer survivors worldwide. In 2022, the International Agency for Research on Cancer (IARC) reported nearly 20 million new cancer cases globally [1]. In the United States, the number of cancer survivors - individuals diagnosed with cancer and still alive - has surpassed 18 million [2]. Insulin resistance (IR) is a condition in which insulin target tissues, such as skeletal muscle, adipose tissue, and the liver, becomes less responsive to insulin, requires a higher level of insulin secretion to maintain normal blood glucose levels. IR is a major component of type 2 diabetes and metabolic syndrome, with a significantly higher incidence among cancer patients compared to the general population [3, 4]. However, the underlying mechanisms and predictive markers of IR in this population remain poorly understood.
The platelet-to-lymphocyte ratio (PLR) is an inflammation-based hematologic marker calculated as the ratio of platelet count to lymphocyte count in routine blood tests. PLR reflects both systemic inflammation and immunological suppression [5, 6] and has been identified as a critical prognostic factor for various diseases.
The association between the PLR and IR remains inconclusive and somewhat controversial. According to some research, increased PLR levels might considerably raise the risk of IR via inflammation-related pathways [7, 8]. Conversely, other studies argue that PLR might only act as an indirect indicator of metabolic dysregulation rather than a direct causal factor for IR [9]. Additionally, existing studies often suffer from limitations such as small sample sizes and inadequate control for confounding factors, which make the interpretation of results even more difficult. Furthermore, there is a lack of research specifically exploring the association between IR and related factors in cancer survivors.
This study is based on cross-sectional data from cancer survivors in the NHANES database between 2005 and 2018, with the objective of analyzing the relationship between the PLR and IR indicators (including homeostasis model assessment of insulin resistance (HOMA-IR), quantitative insulin sensitivity check index (QUICKI), and the triglyceride-glucose (TyG) index). Cancer survivors represent a population at high risk of metabolic dysfunction, and exploring the correlation between specific metabolic biomarkers in this group is crucial for comprehending the underlying mechanisms and optimizing management strategies. The findings of this study not only enhance the clinical utility of PLR in cancer survivors but also provide new perspectives for the diagnosis and treatment strategies of IR.
| Materials and Methods | ▴Top |
Study population
This cross-sectional study utilized data from the National Health and Nutrition Examination Survey (NHANES), a nationally representative surveillance program that employs a complex multistage probability sampling design to track population health in the United States. NHANES systematically combines standardized interviews, physical examinations, and laboratory diagnostics to collect comprehensive health data across diverse demographic groups. Data from seven consecutive survey cycles spanning from 2005 to 2018 were used in our analysis.
This study included participants from NHANES who were identified as cancer survivors. Cancer survivor status was operationalized through affirmative responses to the medical history questionnaire item: “Has a doctor or other health professional ever told you that you had cancer or a malignancy of any kind?” (Variable MCQ220 in NHANES documentation). We excluded participants with: 1) missing exposure data (platelet or lymphocyte counts); 2) missing outcome measures (fasting glucose, insulin, or triglyceride data); 3) incomplete covariate information (including race/ethnicity, marital status, alcohol and tobacco use, and history of cardiovascular disease, diabetes, or hypertension); 4) records with implausible values or duplications. All data were collected following standardized NHANES protocols, with trained personnel conducting laboratory assessments and administering questionnaires to maintain data integrity and representativeness. A total of 1,418 participants were included in the final sample. Figure 1 presents the complete participant selection process.
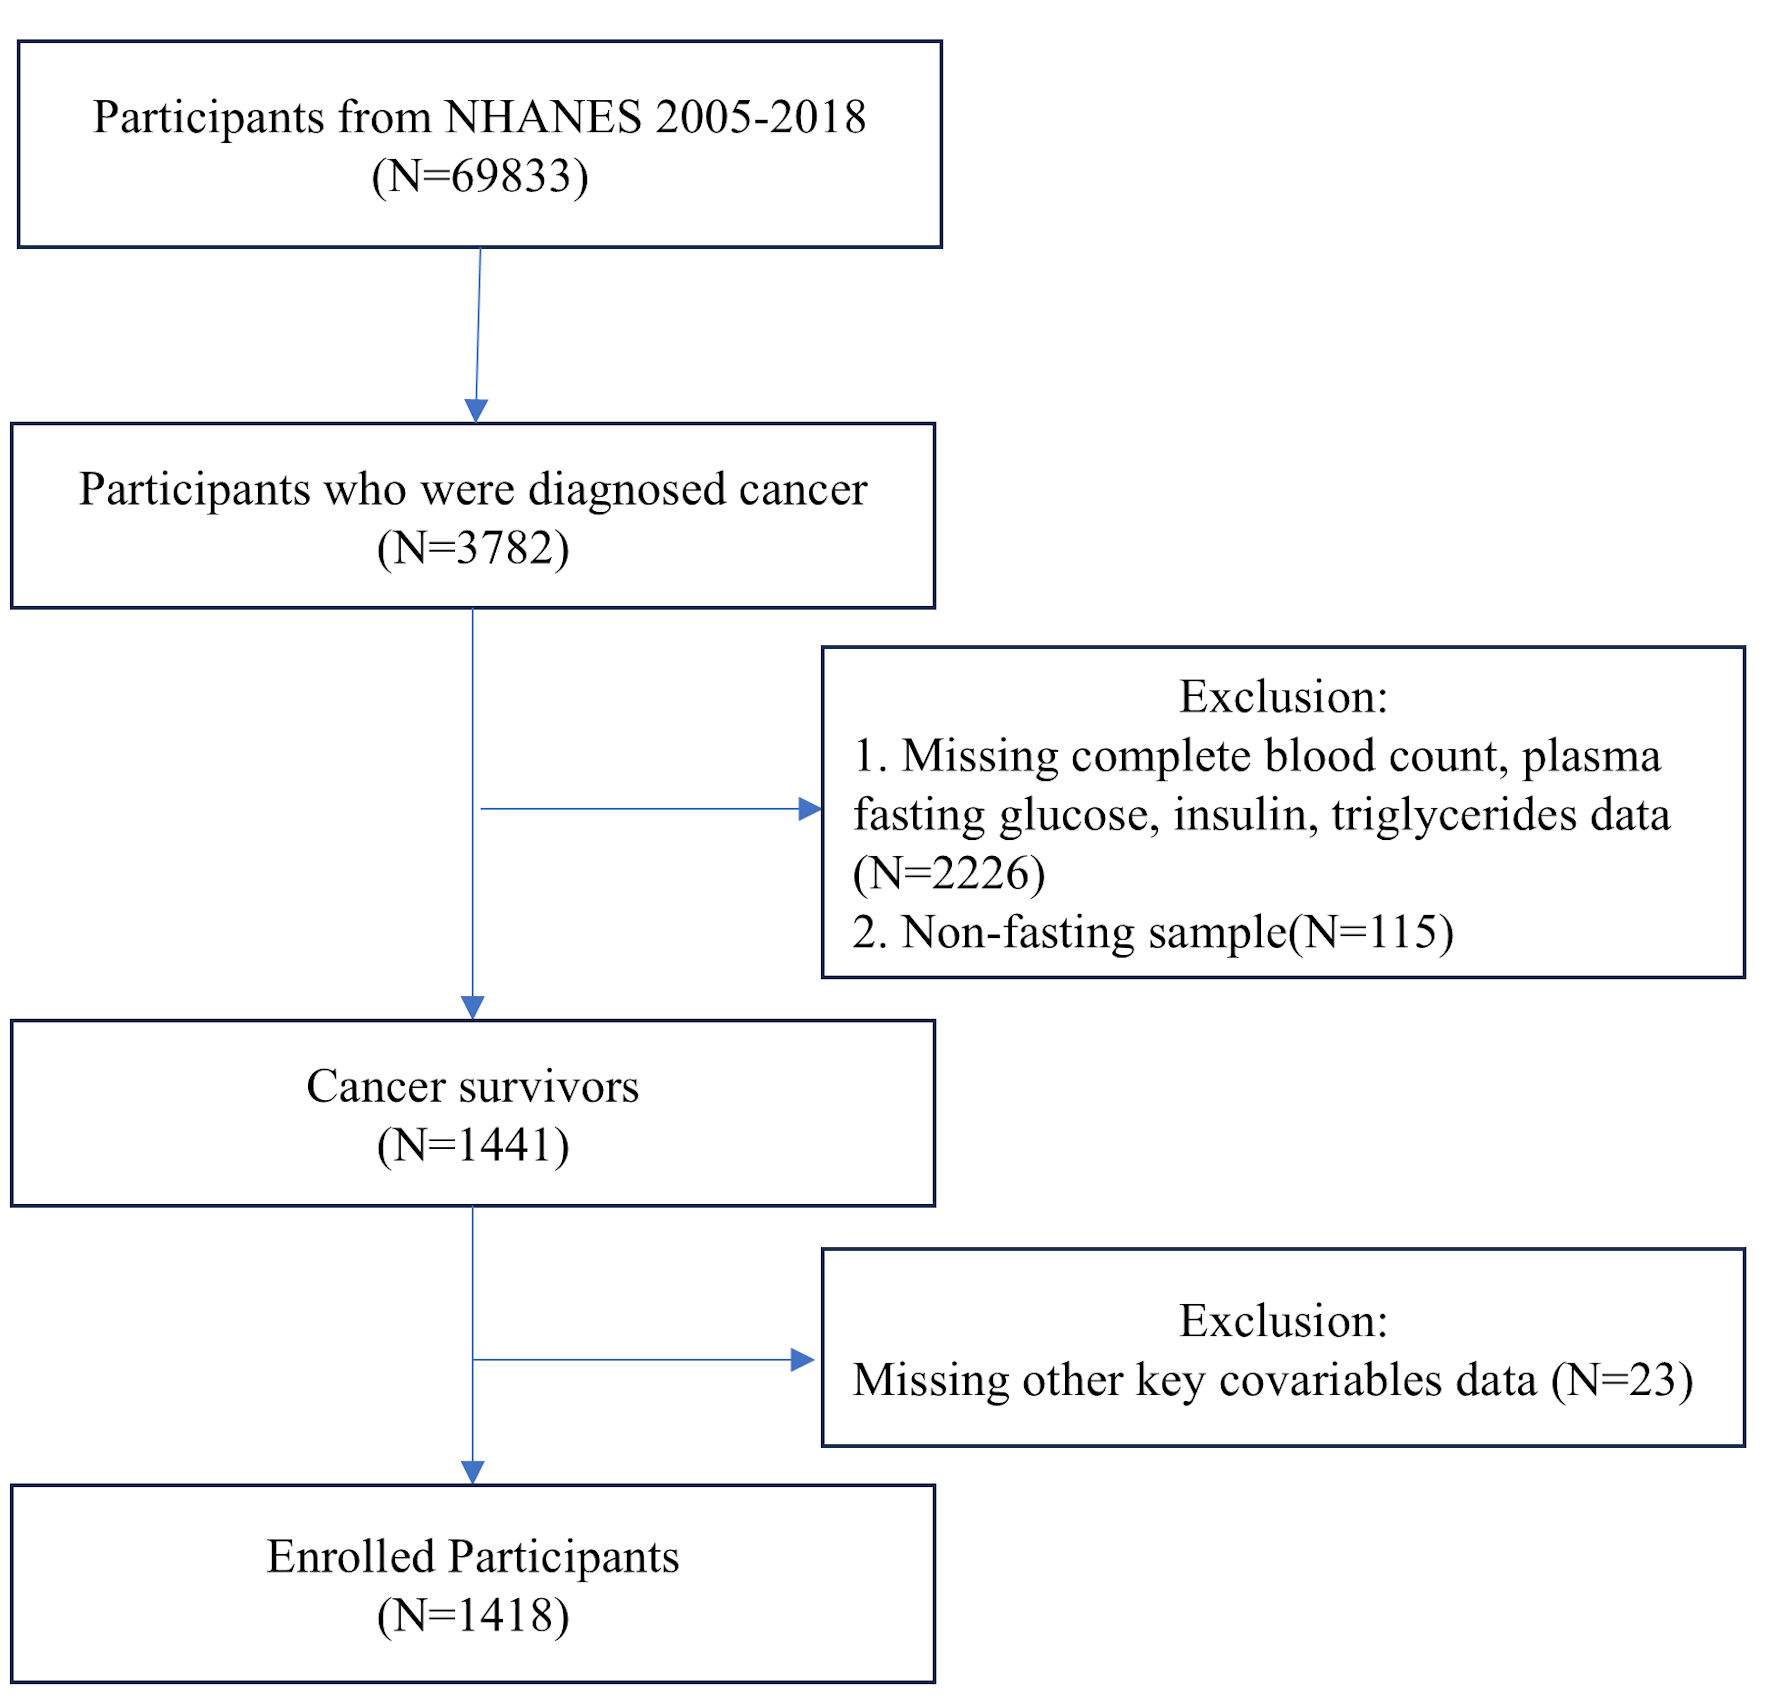 Click for large image | Figure 1. Flowchart of the systematic selection process. |
Variables
Exposure variables
In this study design, the exposure variable was the PLR, calculated as: PLR = platelet count (109/L)/lymphocyte count (109/L). These data were provided by the NHANES database, with blood samples collected and analyzed at the time of participants’ health examination interviews. PLR was recorded as a continuous variable and, after testing, was found to have a non-normal distribution. It was therefore categorized into quartiles (Q1, Q2, Q3, Q4) to examine stratified effects across different PLR levels.
Outcome variables
The outcome variables in this study were three commonly used metabolic indicators of IR: HOMA-IR, QUICKI and the TyG index. Biological samples for analysis were processed following standardized protocols from the NHANES, adhering to international laboratory standards. Fasting blood samples were routinely obtained for the measurement of plasma glucose and serum insulin concentrations, with all biochemical analyses done under strict quality control procedures: 1) HOMA-IR = fasting glucose (mmol/L) × fasting insulin (µU/mL)/22.5. HOMA-IR is a widely recognized method for IR measurement. A cutoff value of 2.5 was established, values exceeding this threshold are indicative of the presence of IR. 2) QUICKI = 1/(log (fasting insulin (µU/mL)) + log (fasting glucose (mmol/L))). QUICKI is used for quantitative assessment of insulin sensitivity, serves as a complementary method to HOMA-IR for evaluating IR. Higher QUICKI values indicate better insulin sensitivity. Based on the clinical guidelines of the Endocrine Society, a cutoff value of 0.33 was established, with values below this threshold indicating the presence of IR. 3) TyG Index = ln (fasting triglycerides (mg/dL) × fasting glucose (mg/dL))/2. This index estimates IR based on fasting triglycerides and fasting blood glucose (FBG). The TyG Index serves as a surrogate marker for IR based on glucose and lipid metabolism and is particularly suitable for assessing IR in metabolic syndrome research. A cutoff value of 4.68 was established, with values above this threshold indicating the presence of IR.
Covariates
The selection of covariates was founded on theoretical rationale, literature support, statistical validity, and the specific context of the study. To ensure model stability, we first analyzed potential multicollinearity among covariates using variance inflation factor (VIF), excluding variables with VIF > 10. Although diabetes was initially considered as a potential covariate in preliminary analysis due to its VIF < 10, we ultimately excluded it from our final models. This decision was based on the mechanistic relationship between IR and diabetes, where type 2 diabetes is generally understood to be a clinical manifestation or outcome of progressive IR rather than an independent confounding factor [10, 11]. Including diabetes as a covariate could potentially lead to over-adjustment and underestimation of associations between PLR and IR. For covariates with missing values, we assessed the missing data mechanism: multiple imputation was applied for data missing completely at random (MCAR), while complete case analysis was used for minimal missing data (proportion of missing values < 2%). The final selection of covariates included: demographic variables: age (years), gender (male/female), race/ethnicity (Mexican American, other Hispanic, non-Hispanic white, non-Hispanic black, and other race). Socioeconomic variables: marital status (never married, married/living with partner, widowed/divorced/separated), education (less than high school, above high school), family poverty income ratio (< 1.3, 1.3 - 3.5, ≥ 3.5). Lifestyle variables: smoking status (no/yes), alcohol consumption (no/yes), sleep duration (hours/night, < 7, 7 - 9, ≥ 9), physical activity (metabolic equivalent of task (MET)-min/week, < 600/≥ 600). Health status variables: body mass index (BMI) (kg/m2, < 18.5, 18.5 - 25, 25 - 30, ≥ 30), history of cardiovascular disease (no/yes), hypertension status (no/yes).
Statistical analysis
All continuous variables were found to be non-normally distributed and therefore presented as median with interquartile range (Q1, Q3). Categorical variables were expressed as frequencies with weighted percentages. For between-group comparisons, the Chi-square test was used for categorical variables, while the Mann-Whitney U test was applied for non-normally distributed continuous variables.
To examine the association between PLR and IR indicators (HOMA-IR, QUICKI, and the TyG index), we conducted a stepwise analytical approach. First, we employed univariate and multivariate logistic regression models to examine the relationship between PLR quartiles and IR indicators. Three models were constructed with different levels of adjustment: Model 1 included no covariates; Model 2 adjusted for sociodemographic characteristics only; and Model 3 further adjusted for relevant covariates presented in Table 1 in addition to Model 2 variables (except diabetes status). By comparing the changes in effect estimates of PLR across these differently adjusted models, we assessed the stability of our findings. Trend tests were performed across PLR quartiles in relation to IR indicators to determine whether a linear trend existed between these variables. Additionally, to explore the association between PLR and different IR indicators, we employed restricted cubic spline (RCS) regression models for nonlinear relationship analysis. We selected the median PLR value of 130.53 as the reference point and evaluated the relationship between PLR and three IR indicators. Each model was assessed using two key statistical tests: the nonlinearity test (to determine whether the relationship significantly deviates from linearity) and the overall association test (to evaluate the statistical significance of the overall relationship). All analyses calculated odds ratios (ORs) with their 95% confidence intervals (CIs), and dose-response relationships between PLR and each index were presented as curve graphs. This approach allowed for the visualization of the complex associations between PLR and various metabolic parameters across the continuum of PLR values.
 Click to view | Table 1. Characteristics of Study Participants Stratified by Insulin Resistance Indicators |
To explore potential effect modification by key clinical characteristics on the association between PLR and IR indicators, we conducted prespecified stratified analyses. Within each subgroup, we employed multivariable logistic regression models to calculate odds ratios (ORs) and their 95% confidence intervals for the association between PLR and IR indicators, with adjustment for potential confounders according to Model 3. We visualized the effect estimates, 95% confidence intervals, and p-values for the association between PLR and each IR indicator across different subgroups using forest plots, allowing for assessment of the statistical significance of between-subgroup differences.
Finally, to evaluate the discriminative ability of PLR for IR, we plotted receiver operating characteristic (ROC) curves for each IR assessment method (HOMA-IR, QUICKI, and the TyG index) and calculated the area under the curve (AUC) with 95% confidence intervals. The optimal PLR cutoff value for each indicator was determined by maximizing the Youden index (sensitivity + specificity - 1), and the corresponding sensitivity and specificity at the cutoff points were reported.
All statistical analyses were performed using R statistical software, and a two-sided P value of less than 0.05 was considered statistically significant.
Ethic statement
This study was conducted using publicly available data from the NHANES database and did not involve any additional interventions or direct contact with participants. Data collection and usage were approved by the Ethics Committee of the National Center for Health Statistics (NCHS). All research data were anonymized, and individuals in the database survey had already signed informed consent forms at the time of recruitment. This study fully adhered to the ethical principles of the Declaration of Helsinki and complied with the regulatory requirements of the US government’s health research policies. Therefore, no additional ethical review or informed consent was required.
| Results | ▴Top |
Baseline characteristics
This study enrolled 1,418 participants, representing a weighted population of 20,233,847 US adults. The median age of the study population was 69.0 years (interquartile range: 58.0 - 78.0), with females comprising 58.4% of participants. Non-Hispanic Whites represented the predominant racial/ethnic group (85.2%). Among the study population, 35.8% were obese (BMI ≥ 30 kg/m2), 23.6% had diabetes mellitus, 20.0% had cardiovascular disease, and 51.8% had hypertension.
Comparison of population characteristics across IR categories revealed that participants with high HOMA-IR (≥ 2.5) exhibited significantly higher PLR values compared to those with low HOMA-IR (< 2.5) (137.14 vs. 125.28, P < 0.001). Regarding sociodemographic characteristics, the low HOMA-IR group had a higher proportion of females (61.0% vs. 55.7%, P = 0.046) and non-Hispanic Whites (88.8% vs. 81.6%), while Mexican Americans and non-Hispanic Blacks were more prevalent in the low HOMA-IR group (P = 0.002). Individuals with lower HOMA-IR were more likely to have higher educational attainment (89.0% vs. 85.2%, P = 0.033) and higher income levels (family poverty income ratio (PIR) ≥ 3.5: 55.1% vs. 43.3%, P < 0.001). With respect to lifestyle factors, alcohol consumption was more prevalent in the low HOMA-IR group (83.1% vs. 76.0%, P = 0.001). Optimal sleep duration (7 - 9 h per night) was more common among individuals with low HOMA-IR (64.4% vs. 57.1%, P = 0.017), as was high physical activity level (≥ 600 MET-min/week) (61.5% vs. 51.0%, P < 0.001). The proportion of normal weight individuals (18.5 ≤ BMI < 25 kg/m2) was markedly higher in the low HOMA-IR group compared to the high HOMA-IR group (45.0% vs. 11.1%), while obesity (BMI ≥ 30 kg/m2) was substantially less prevalent (14.2% vs. 58.0%, P < 0.001). Regarding chronic disease burden, the prevalence of diabetes mellitus was significantly lower in the low HOMA-IR group compared to the high HOMA-IR group (9.2% vs. 38.4%, P < 0.001). Similarly, cardiovascular disease (CVD) (16.2% vs. 23.8%, P < 0.001) and hypertension (41.6% vs. 62.3%, P < 0.001) were less common among individuals with lower IR.
Similar trends were observed when comparing groups by QUICKI and TyG Index. Participants with high QUICKI (≥ 0.33) and low TyG (< 4.68) demonstrated more favorable metabolic profiles, including lower PLR values, better socioeconomic status, better lifestyle, and lower chronic disease burden.
Overall, these findings demonstrate significant associations between IR and PLR levels, socioeconomic status, lifestyle choices, and chronic disease burden in this nationally representative sample. Detailed characteristics are shown in Table 1.
Association between PLR and IR across different assessment methods
Table 2 shows the association between PLR quartiles and IR as assessed by three different indicators.
Click to view | Table 2. The Association Between PLR and Insulin Resistance Stratified by HOMA-IR, QUICKI and TyG Index |
Assessed by HOMA-IR
When using HOMA-IR as the assessment tool, participants in the highest PLR quartile (Q4, ≥ 168.18) demonstrated a 64% higher risk of IR compared to those in the lowest quartile (Q1, < 101.33) in the unadjusted model (hazard ratio (HR) = 1.64, 95% CI: 1.11 - 2.13, P = 0.013). This association was attenuated and no longer statistically significant in Model 2 and Model 3 (Model 2: HR = 1.58, 95% CI: 1.07 - 2.35, P = 0.223; Model 3: HR = 1.40, 95% CI: 0.90 - 2.14, P = 0.140). Trend analysis revealed that each increment in PLR quartile was associated with an 18% increase in IR risk in the unadjusted model (HR = 1.18, 95% CI: 1.04 - 1.34, P = 0.008); however, this trend was weakened after full adjustment (HR = 1.13, 95% CI: 0.98 - 1.30, P = 0.091).
Assessed by QUICKI
The QUICKI assessment demonstrated more robust associations across all adjustment models. Compared to the reference group, all higher PLR quartiles showed significantly increased IR risk. The association was strongest for the highest PLR quartile (Q4), with an 80% increased risk in the unadjusted model (HR = 1.80, 95% CI: 1.21 - 2.68, P = 0.003), which remained significant even after full adjustment (Model 3: HR = 1.61, 95% CI: 1.02 - 2.53, P = 0.040). Similarly, participants in the third PLR quartile (Q3) exhibited a 60% higher risk in the fully adjusted model (HR = 1.62, 95% CI: 1.05 - 2.51, P = 0.030). The dose-response relationship was confirmed by the significant trend test across all models, with each increment in PLR quartile associated with a 19% increase in IR risk in the fully adjusted model (HR = 1.19, 95% CI: 1.03 - 1.38, P = 0.021).
Assessed by the TyG index
The TyG index yielded consistent results, with all higher PLR quartiles showing significantly increased IR risk. The third PLR quartile (Q3) demonstrated the strongest association, with a 69% higher risk after full adjustment (Model 3: HR = 1.69, 95% CI: 1.09 - 2.62, P = 0.017). Participants in the second quartile (Q2) and highest quartile (Q4) also showed significantly elevated risks in the fully adjusted model, with HRs of 1.61 (95% CI: 1.02 - 2.46, P = 0.027) and 1.56 (95% CI: 1.02 - 2.45, P = 0.035), respectively. The trend analysis further supported the dose-dependent nature of this relationship, with each increment in PLR quartile associated with a 15% increase in IR risk after full adjustment (HR = 1.15, 95% CI: 1.01 - 1.31, P = 0.039).
Collectively, these results demonstrate a consistent positive association between elevated PLR levels and increased IR risk. This association was most robust when assessed using the QUICKI and the TyG index, where the associations remained statistically significant even after comprehensive adjustment for demographic characteristics, lifestyle factors, and relevant comorbidities. The magnitude of risk increase ranged from approximately 56% to 61% for individuals in the higher PLR quartiles compared to those in the lowest quartile. The significant trend analyses further support a dose-response association between PLR and IR risk, suggesting that PLR may serve as a potentially useful clinical indicator for IR prediction.
Figure 2 shows the non-linear associations between PLR and IR assessed by three different methods. Significant non-linear relationships were observed when using QUICKI (P for non-linearity=0.02) and the TyG index (P for non-linearity=0.04) as IR indicators, with risk increasing substantially at PLR values above the reference point. The relationship with HOMA-IR showed a similar pattern but did not reach statistical significance (P for non-linearity=0.11). The overall associations were statistically significant for QUICKI (P=0.025) and TyG index (P=0.04), but not for HOMA-IR (P=0.146).
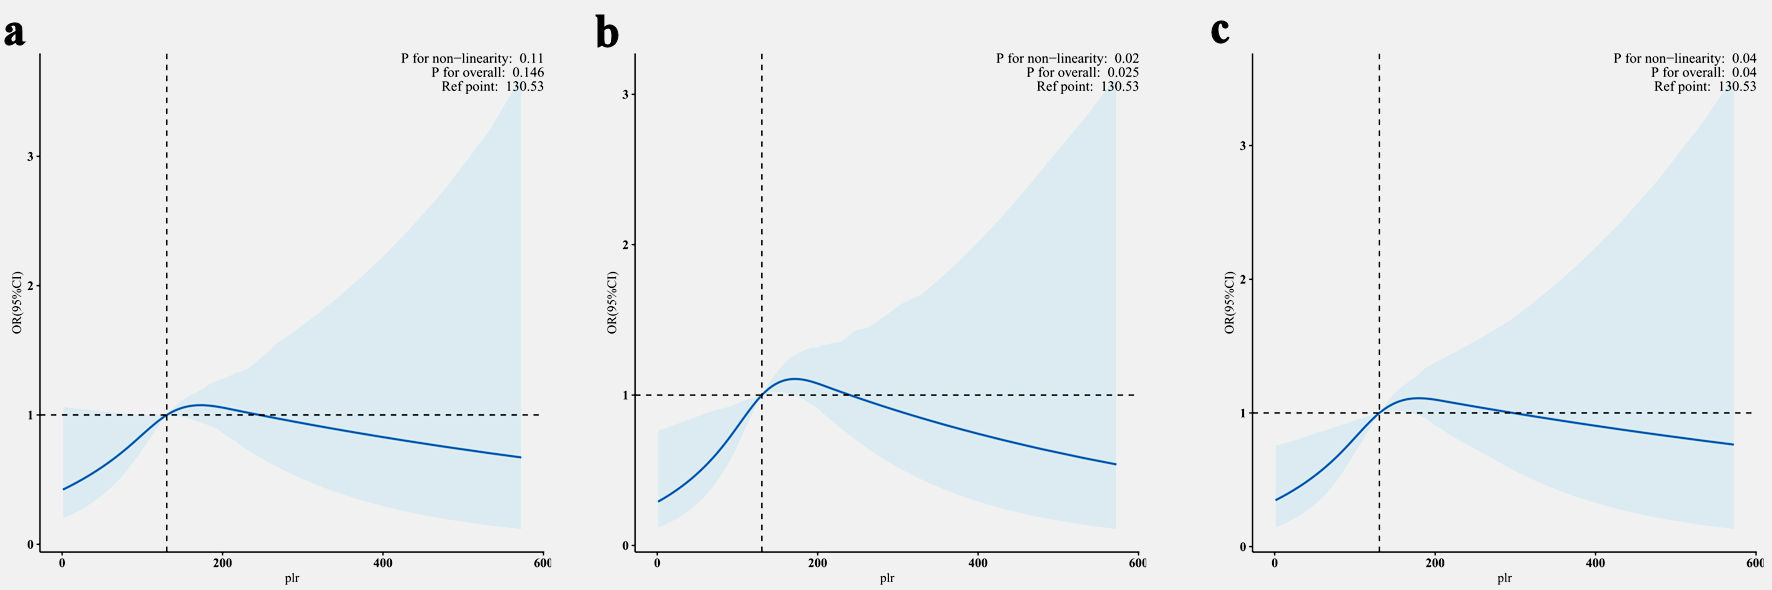 Click for large image | Figure 2. Non-linear association between PLR and IR assessed by HOMR-IR (a), QuICKI (b) and TyG index (c). The solid line represents adjusted ORs, and light blue area represents the 95% CI. The reference point was set at a PLR value of 130.53 across all analyses. All models were adjusted for age, gender, race/ethnicity, marital status, education, family PIR, smoking status, alcohol consumption, sleep duration, physical activity, BMI, history of diabetes status, CVD and hypertension. PLR: platelet-to-lymphocyte ratio; IR: insulin resistance; HOMA-IR: homeostatic model assessment for insulin resistance; QUICKI: quantitative insulin sensitivity check index; TyG: triglyceride-glucose; PIR: poverty income ratio; BMI: body mass index; CVD: cardiovascular disease; OR: odds ratio; CI: confidence interval. |
Subgroup analysis of PLR and IR in cancer survivors
To further explore the population heterogeneity in the association between PLR and IR, we conducted extensive subgroup analyses to identify specific sensitive populations, including age, gender, race/ethnicity, marital status, education level, family PIR, smoking status, alcohol consumption, sleep duration, physical activity, BMI, and history of CVD and hypertension. Figure 3 illustrated the comparison between the highest PLR quartile (Q4) and the lowest quartile (Q1) across these subgroups.
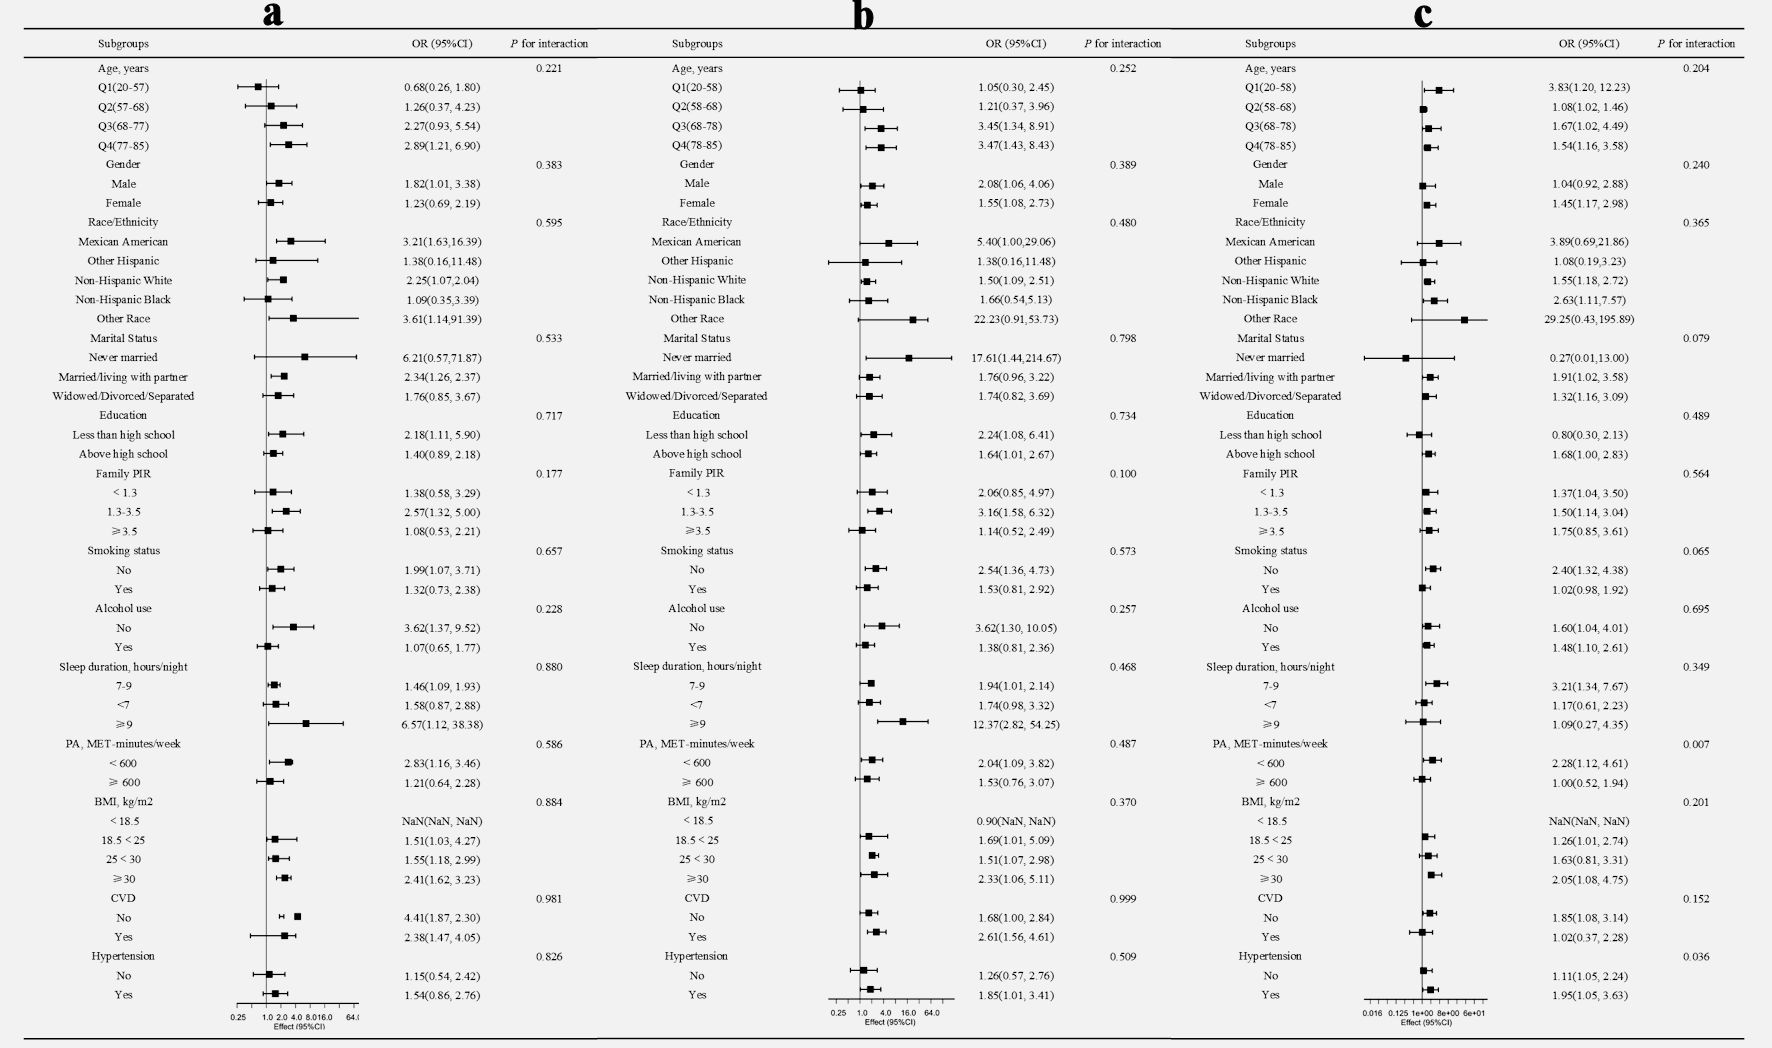 Click for large image | Figure 3. Subgroup analysis of the association between PLR and IR assessed by HOMA-IR (a), QUICKI (b), and the TyG index (c). For quartile analysis, odds ratios (ORs) with 95% confidence intervals (CI) represent the comparison of the highest quartile (Q4) versus the lowest quartile (Q1). All OR and interaction measures were adjusted for age, sex, race/ethnicity, marital status, education level, family PIR, smoking status, alcohol use, sleep duration, physical activity, BMI, and comorbidities (CVD and hypertension), with the stratification component in question being excluded. PLR: platelet-to-lymphocyte ratio; IR: insulin resistance; HOMA-IR: homeostatic model assessment for insulin resistance; QUICKI: quantitative insulin sensitivity check index; TyG: triglyceride-glucose; PIR: poverty income ratio; BMI: body mass index; CVD: cardiovascular disease. |
Interaction effect analysis revealed no significant interactions between PLR and IR across the examined subgroup characteristics in both HOMA-IR and QUICKI models (P > 0.05). However, in the TyG index model, significant interactions were observed. Specifically, individuals in the highest PLR quartile (Q4) compared to the lowest quartile (Q1) demonstrated higher susceptibility to IR among those with physical activity < 600 MET-min/week (OR = 2.28, 95% CI: 1.12, 4.61) and those with a history of hypertension (OR = 1.95, 95% CI: 1.05, 3.63), with P for interaction values of 0.007 and 0.036, respectively.
ROC curve analysis
To determine the optimal cutoff values of PLR for clinically detecting IR in cancer survivors, ROC curve analyses were performed for three IR indicators (Fig. 4). The ROC analysis results indicated that PLR cutoff values in the range of 124 - 137 can serve as screening thresholds for IR in cancer survivors, depending on the chosen IR assessment method. The TyG index-based cut-off (137) demonstrated the strongest discriminative ability, followed by QUICKI (132) and HOMA-IR (124) (Table 3).
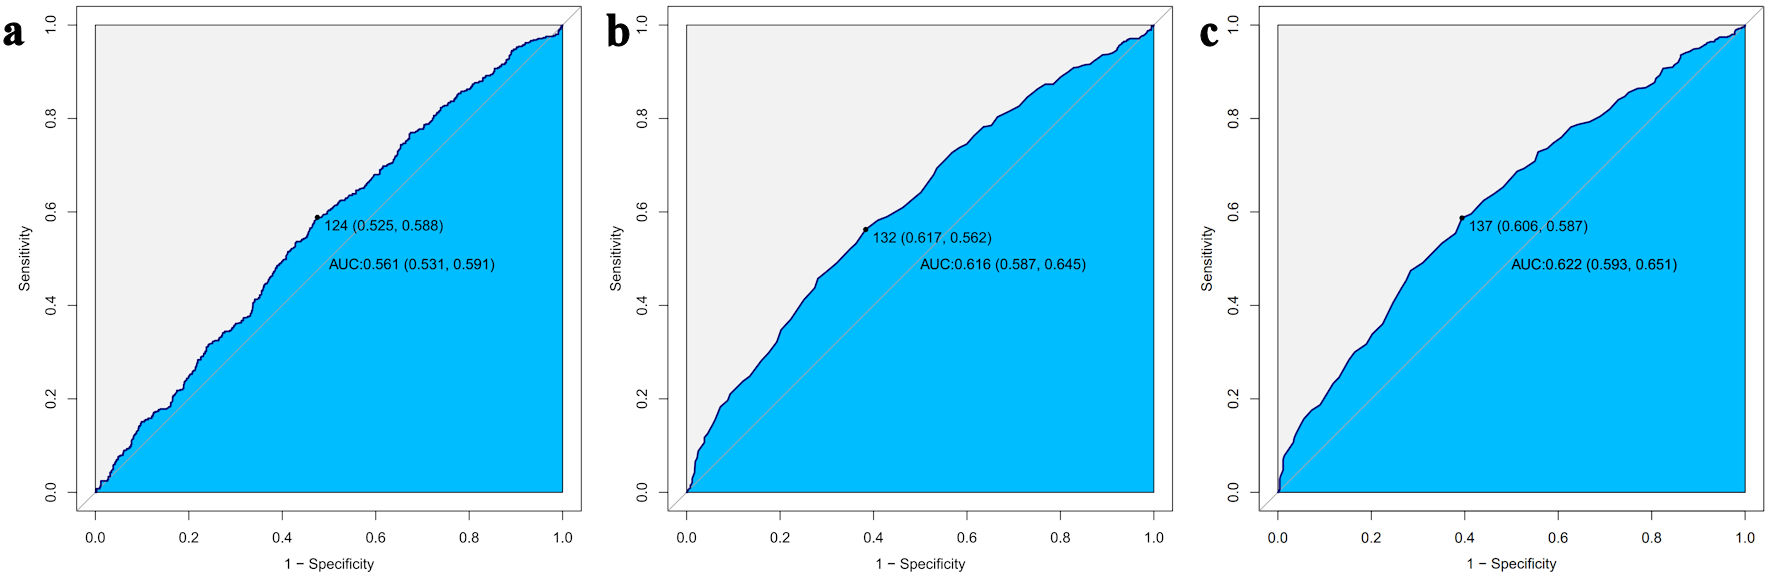 Click for large image | Figure 4. ROC curve analysis of PLR for predicting IR assessed by HOMA-IR (a), QUICKI (b), and the TyG index (c). PLR: platelet-to-lymphocyte ratio; IR: insulin resistance; HOMA-IR: homeostatic model assessment for insulin resistance; QUICKI: quantitative insulin sensitivity check index; TyG: triglyceride-glucose; ROC: receiver operating characteristic; AUC: area under the curve. |
Click to view | Table 3. ROC Curve Analysis of PLR for Predicting Insulin Resistance Assessed by HOMA-IR, QUICKI, and the TyG Index |
IR and other composite inflammatory indicators based on complete blood count
To thoroughly evaluate the utility of complete blood count-derived inflammatory markers in predicting IR among cancer survivors, we analyzed several composite inflammatory indicators calculated from routine blood tests, including neutrophil-to-lymphocyte ratio (NLR, NLR= neutrophil count/lymphocyte count), lymphocyte-to-monocyte ratio (LMR, LMR = lymphocyte count/monocyte count), systemic immune-inflammation index (SII, SII = platelet count × neutrophil count/lymphocyte count), and systemic inflammation response index (SIRI, SIRI = neutrophil count × monocyte count/lymphocyte count).
Results indicated that although these indicators showed varying degrees of correlation with IR measures in univariate analyses, most of them demonstrated limited predictive value after adjusting for potential confounding factors in our fully adjusted models. When using HOMA-IR as the IR measurement index, only SII showed a statistically significant association (P = 0.016) in the fully adjusted model. Similarly, when using the TyG as the IR index, only LMR demonstrated significant correlation (P = 0.002). All other inflammatory indicators failed to show significant associations with IR (all P > 0.05).
The complete results of these analyses are presented in the accompanying file (Supplementary Material 1, wjon.elmerpub.com), which includes the regression coefficients, confidence intervals, and P values for all tested inflammatory indicators across different models and IR indicators.
| Discussion | ▴Top |
In this study, we assessed IR using three different indicators: HOMA-IR, QUICKI, and the TyG index. Our findings revealed that higher PLR levels were significantly associated with increased risk of IR in cancer survivors, particularly when assessed using QUICKI and the TyG index. Compared to the lowest PLR quartile (Q1), individuals in the highest quartile (Q4) showed significantly increased IR risk when assessed by QUICKI (HR = 1.61, 95% CI: 1.02 - 2.53, P = 0.040) and TyG index (HR = 1.56, 95% CI: 1.02 - 2.45, P = 0.035). Each increment in PLR quartile was associated with a 19% (QUICKI) and 15% (TyG) increased risk of IR. The ROC analysis results indicated that PLR cutoff values in the range of 124 - 137 can serve as screening thresholds for IR in cancer survivors. In the subgroup analysis, the PLR and IR showed no significant interaction across all examined subgroup characteristics in both the HOMA-IR and QUICKI models (P > 0.05). However, in the TyG index model, individuals in the Q4 compared to the Q1 demonstrated greater susceptibility to IR in those with physical activity < 600 MET-min/week (OR = 2.28, 95% CI: 1.12 - 4.61); and those with a history of hypertension (OR = 1.95, 95% CI: 1.05 - 3.63), with P values for interaction of 0.007 and 0.036, respectively.
Recent studies revealed that different cancer types showed varied degrees of association with IR, with pancreatic and hepatic carcinomas showing the most pronounced correlation [4, 12]. Within the first year after cancer diagnosis, IR risk reaches its peak, with levels as high as 2.09 times that of the general population [13]. Although this significant metabolic dysregulation risk attenuates over time, cancer survivors continue to exhibit elevated IR risk compared to the general population [13]. IR in cancer survivors leads to several serious consequences: 1) Increased recurrence rates and reduced overall survival [4, 12]; 2) Elevated all-cause mortality [14]; 3) Enhanced tumor growth and progression [4, 15]; 4) Diminishes sensitivity to chemotherapy and targeted therapies, resulting in reduced treatment efficacy [16-18]; 5) Increased risk of comorbidities such as hypertension, CVD, and kidney disease, along with potential development of hyperglycemia, dyslipidemia, and other metabolic disturbances [4, 14]; and 6) Elevated incidence of treatment-related complications, including chemotherapy-associated toxicities and treatment-related infections [19, 20]. Therefore, early identification and management of IR in cancer survivors is crucial for improving long-term prognosis and quality of life.
Current methods for assessing IR primarily include: 1) The Glucose Clamp technique, which involves continuous intravenous insulin infusion while adjusting glucose infusion rates to maintain stable blood glucose levels, measuring insulin sensitivity. This is recognized as the gold standard for measuring insulin sensitivity, directly assessing insulin action with high reliability. However, this test is time-consuming, technically complex, costly, and unsuitable for routine clinical use or large-scale epidemiological studies. 2) Clinical surrogate indicators such as HOMA-IR, fasting insulin measurement, HOMA-β (pancreatic β-cell function index), QUICKI, Matsuda index, and the TyG index, reduce the assessment costs and simplify the testing procedures, and enhance practicality and accessibility. However, the accuracy of most indicators relies on strict fasting conditions [21-23] and is influenced by various factors, including age [24, 25], ethnicity [23, 26, 27], BMI [23, 27], underlying medical conditions, and recent dietary patterns.
The PLR reflects the dual changes of increased platelets and decreased lymphocytes. During acute inflammation and prothrombotic conditions, proinflammatory cytokines (such as interleukin (IL)-6, IL-10) stimulate megakaryocyte proliferation, leading to elevated platelet counts [28, 29]; simultaneously, lymphocyte counts may decrease in inflammatory states [30, 31]. These inflammation-mediated changes make PLR an effective indicator for assessing systemic inflammation. PLR has been proven to have significant value in the diagnosis, treatment monitoring, and prognostic evaluation of various diseases, including cardiovascular disorders [32, 33], autoimmune diseases [34, 35], and malignancies [36-38]. As a practical biomarker, PLR offers multiple advantages: 1) Cost-effectiveness - it can be derived from routine blood cell counts without additional testing expenses; 2) Universal availability - nearly all healthcare facilities can perform basic blood cell analysis, making it an ideal tool for resource-limited settings; 3) Early warning - in the early stages of certain diseases, PLR may be more sensitive than traditional inflammatory markers, facilitating timely intervention [39, 40].
Our findings align with several studies investigating the relationship between PLR and IR. In a study of 405 patients with type 2 diabetes, Zhang et al found that PLR level was independently and positively correlated with IR risk (OR: 1.011, 95% CI: 1.002 - 1.019, P = 0.014). Higher PLR levels were significantly associated with IR, and the higher the PLR value, the more severe the degree of IR, which suggested that PLR can be used as an effective marker to evaluate IR risk [41]. In a study targeting overweight/obese schoolchildren, an elevation in PLR was similarly found to be associated with IR [42]. In pregnant women, the same phenomenon was observed, that patients with gestational diabetes had significantly higher PLR than those with normal glucose tolerance pregnancy, and the QUICKI was significantly reduced. This low-grade inflammation was associated with maternal blood glucose and IR in patients with gestational diabetes [43]. According to our research, we found that the association between PLR and IR was more significant when using QUICKI and the TyG index, while the association was comparatively weaker when using HOMA-IR. The TyG index is particularly adept at reflecting lipid metabolism-related IR, while QUICKI demonstrates better sensitivity to overall IR. This discrepancy may be related to the differences in capabilities of various assessment methods in capturing different aspects of IR, as pointed out by Guerrero-Romero et al [44].
The mechanistic connection between PLR-indicated systemic inflammation and IR involves multiple interconnected pathways. Elevated PLR reflects a state of chronic inflammation characterized by enhanced platelet activation and relative lymphopenia. This inflammatory milieu creates a complex network of molecular interactions that directly impairs insulin signaling efficiency. First, proinflammatory cytokines (such as tumor necrosis factor (TNF)-α, IL-6, and IL-1β) promote serine phosphorylation of insulin receptor substrates (IRSs), particularly IRS-1, activate signaling pathways including JNK, ERK, and p38, interfere with insulin signal transduction, downregulate GLUT4 transporter expression, reduce glucose uptake, and directly inhibit effective insulin signaling, thereby decreasing insulin sensitivity [45-48]. Additionally, these proinflammatory factors affect insulin signaling pathways through multiple interference mechanisms: TNF-α stimulates transmembrane transport of palmitic acid in endothelial cells, leading to endothelial dysfunction, which in turn affects glucose uptake and insulin signaling [49]; it reduces the activity of the Akt/eNOS/NO signaling pathway, inhibiting vasodilation and exacerbating IR [50]; TNF-α receptors activate the NF-κB pathway, upregulating the expression of inflammatory factors, further disrupting insulin signal transduction [50]. Reduced lymphocyte counts reflect immune suppression, further exacerbating the chronic inflammatory state [30, 51]. Second, activated platelets release proinflammatory mediators, including thromboxane A2 (TXA2) [52], platelet-derived growth factor (PDGF) [53], and various chemokines, thereby further amplifying the inflammatory cascade [54]. Simultaneously, the relative lymphopenia accompanying elevated PLR indicates compromised immune surveillance and adaptive immune dysfunction, providing a “breeding ground” for persistent inflammation. Furthermore, cancer survivors may experience increased chronic inflammation and metabolic dysregulation due to previous treatments (such as chemotherapy, radiation) and underlying disease, making the association between PLR and IR more pronounced in this population [3, 13].
To our knowledge, this is the first large-scale, nationally representative study to specifically investigate the association between PLR and IR in cancer survivors, addressing a critical gap in the existing literature. Unlike previous studies that focused on general populations or specific disease groups, our research recognizes cancer survivors as a unique population with distinct metabolic vulnerabilities due to their treatment history and underlying inflammatory burden. This study reveals the significant clinical value of the association between PLR and IR in cancer survivors. First, PLR, as a readily available indicator from routine blood tests, offers a simple, cost-effective, and noninvasive tool for assessing IR risk and screening for metabolic complications in cancer survivors. Second, our research is the first to confirm the association between PLR and various IR indicators in a nationally representative sample, identifying physical activity, and hypertension as important effect modifiers. This provides a basis for developing individualized monitoring strategies for cancer survivors. Finally, we established clinically applicable PLR cutoff values (124 - 137) that can be immediately implemented in routine clinical practice for IR screening.
This study has several advantages that ensure the reliability and broad applicability of our findings. First, we utilized the NHANES 2005-2018 database, a large representative sample that enhances the external validity and statistical robustness of our results. Second, we employed a multidimensional assessment strategy, comprehensively evaluating the association between PLR and IR through three different IR indicators (HOMA-IR, QUICKI, and the TyG index), overcoming the limitations that might exist with a single indicator. Third, in our analytical approach, we constructed three-level stepwise adjustment models from simple to complex, systematically controlling for potential confounding factors, and revealed the non-linear relationship between PLR and IR through RCS regression analysis. Fourth, this study conducted detailed subgroup analyses, providing a theoretical foundation for clinical precision risk assessment. Fifth, we strictly adhered to NHANES standardized sample collection and laboratory testing procedures, ensuring data quality. Finally, this study is the first to focus on cancer survivors as a special high-risk population, filling a gap in existing literature in this field and providing new perspectives for understanding the potential mechanisms of metabolic complications in cancer survivors.
This study has several limitations. First, as a cross-sectional study, we can only establish the association between PLR and IR, not a causal relationship. Second, our research is based on the US population, and caution should be exercised when generalizing these findings to other racial or regional populations. Third, despite adjusting for multiple known confounding factors, unmeasured confounders may still exist, such as specific cancer types, treatment regimens (chemotherapy, radiotherapy), and disease staging, which could influence the relationship between PLR and IR. Fourth, although HOMA-IR, QUICKI, and the TyG index are effective surrogate markers for assessing IR, they may have certain limitations compared to the glucose clamp technique (the gold standard). Fifth, our study sample included a high proportion of elderly participants (median age 69 years), which may limit the applicability of the results to younger cancer survivors. Finally, in the present study dataset, participants with extreme PLR values (such as > 400) were very few (only nine cases), making it difficult to draw definitive conclusions about the diagnostic performance in this extreme range. Based on the results of this study, we only recommend the use of PLR for IR screening within the routine range (50 - 300).
In the future, we can pursue the following research directions. First, comparative studies between cancer survivors and non-cancer populations are needed to distinguish between general risk factors for IR and cancer-specific inflammatory pathways that may exacerbate metabolic dysregulation. Such comparisons would help determine whether the observed associations between PLR and IR are unique to the post-cancer state or reflect general inflammatory mechanisms. Second, longitudinal studies tracking PLR and IR markers from pre-diagnosis through cancer treatment and into survivorship would provide valuable insights into the temporal relationship between inflammation and metabolic changes. This could help establish whether elevated PLR is a cause or consequence of IR in this population and identify optimal intervention windows. Third, mechanistic studies investigating the biological pathways connecting platelet activation, lymphocyte dynamics, and insulin signaling in cancer survivors are warranted. Such research could reveal novel therapeutic targets for preventing or managing IR in this growing population. Fourth, intervention studies targeting inflammatory pathways in high-risk subgroups identified in our analysis (particularly physically inactive individuals and those with hypertension) would help determine whether reducing inflammation could improve insulin sensitivity in cancer survivors. Special attention should be paid to interventions appropriate for these sensitive populations. Finally, studies examining how cancer type, stage, status, treatment modalities, and time since diagnosis modify the PLR-IR relationship would help refine risk assessment and personalize monitoring and intervention strategies. This is particularly important given the heterogeneity of cancer survivorship experiences and the varying metabolic effects of different cancer treatments. These future research directions could significantly advance our understanding of inflammation-related metabolic dysfunction in cancer survivors and ultimately lead to improved clinical guidance for this growing population with unique health needs.
Conclusions
Higher PLR levels significantly increase the risk of IR in cancer survivors, particularly when assessed through QUICKI and the TyG index. In the TyG index model, this association was more pronounced in individuals with lower physical activity and a history of hypertension. PLR, as an easily accessible biomarker, provides potential clinical value for assessing IR risk in cancer survivors, offering a scientific foundation for developing individualized monitoring and intervention strategies.
PLR: platelet-to-lymphocyte ratio; HOMA-IR: homeostatic model assessment for insulin resistance; QUICKI: quantitative insulin sensitivity check index; TyG: triglyceride-glucose; ROC: receiver operating characteristic; AUC: area under the curve; CI: confidence interval.
| Supplementary Material | ▴Top |
Suppl 1. The association between NLR, LMR, SII, SIRI and IR stratified by HOMA-IR, QUICKI and TyG index.
Acknowledgments
None to declare.
Financial Disclosure
None to declare.
Conflict of Interest
The authors have no conflict of interest to declare.
Informed Consent
All research data were anonymized, and individuals in the database survey had already signed informed consent forms at the time of recruitment. This study fully adhered to the ethical principles of the Declaration of Helsinki and complied with the regulatory requirements of the US government’s health research policies. Therefore, no additional ethical review or informed consent was required.
Author Contributions
Jiao Wang: data curation; formal analysis; investigation; project administration; writing - original draft. Tao Li: project administration; writing - review and editing.
Date Availability
The data supporting the findings of this study are available from the corresponding author upon reasonable request.
| References | ▴Top |
- Bray F, Laversanne M, Sung H, Ferlay J, Siegel RL, Soerjomataram I, Jemal A. Global cancer statistics 2022: GLOBOCAN estimates of incidence and mortality worldwide for 36 cancers in 185 countries. CA Cancer J Clin. 2024;74(3):229-263.
doi pubmed - Tonorezos E, Devasia T, Mariotto AB, Mollica MA, Gallicchio L, Green P, Doose M, et al. Prevalence of cancer survivors in the United States. J Natl Cancer Inst. 2024;116(11):1784-1790.
doi pubmed - Marmol JM, Carlsson M, Raun SH, Grand MK, Sorensen J, Lang Lehrskov L, Richter EA, et al. Insulin resistance in patients with cancer: a systematic review and meta-analysis. Acta Oncol. 2023;62(4):364-371.
doi pubmed - Szablewski L. Insulin resistance: the increased risk of cancers. Curr Oncol. 2024;31(2):998-1027.
doi pubmed - Rayes J, Bourne JH, Brill A, Watson SP. The dual role of platelet-innate immune cell interactions in thrombo-inflammation. Res Pract Thromb Haemost. 2020;4(1):23-35.
doi pubmed - Nording H, Langer HF. Complement links platelets to innate immunity. Semin Immunol. 2018;37:43-52.
doi pubmed - Halim M, Halim A. The effects of inflammation, aging and oxidative stress on the pathogenesis of diabetes mellitus (type 2 diabetes). Diabetes Metab Syndr. 2019;13(2):1165-1172.
doi pubmed - Chen G, Tan C, Liu X, Chen Y. Association between the neutrophil-to-lymphocyte ratio and diabetes secondary to exocrine pancreatic disorders. Front Endocrinol (Lausanne). 2022;13:957129.
doi pubmed - van de Vyver M. Immunology of chronic low-grade inflammation: relationship with metabolic function. J Endocrinol. 2023;257(1):e220271.
doi pubmed - Freeman AM, Acevedo LA, Pennings N. Insulin resistance. In: StatPearls. Treasure Island (FL) ineligible companies. 2025.
pubmed - Wang L, Li L, Liu J, Sheng C, Yang M, Hu Z, Yue R. Associated factors and principal pathophysiological mechanisms of type 2 diabetes mellitus. Front Endocrinol (Lausanne). 2025;16:1499565.
doi pubmed - Kim SS, Kim HS. The impact of the association between cancer and diabetes mellitus on mortality. J Pers Med. 2022;12(7):1099.
doi pubmed - Xiao Y, Wang H, Tang Y, Yan J, Cao L, Chen Z, Shao Z, et al. Increased risk of diabetes in cancer survivors: a pooled analysis of 13 population-based cohort studies. ESMO Open. 2021;6(4):100218.
doi pubmed - Harborg S, Larsen HB, Elsgaard S, Borgquist S. Metabolic syndrome is associated with breast cancer mortality: A systematic review and meta-analysis. J Intern Med. 2025;297(3):262-275.
doi pubmed - Zhang YY, Li YJ, Xue CD, Li S, Gao ZN, Qin KR. Effects of T2DM on cancer progression: pivotal precipitating factors and underlying mechanisms. Front Endocrinol (Lausanne). 2024;15:1396022.
doi pubmed - Fang TZ, Wu XQ, Zhao TQ, Wang SS, Fu GM, Wu QL, Zhou CW. Influence of blood glucose fluctuations on chemotherapy efficacy and safety in type 2 diabetes mellitus patients complicated with lung carcinoma. World J Diabetes. 2024;15(4):645-653.
doi pubmed - Kounatidis D, Vallianou NG, Karampela I, Rebelos E, Kouveletsou M, Dalopoulos V, Koufopoulos P, et al. Anti-diabetic therapies and cancer: from bench to bedside. Biomolecules. 2024;14(11):1479.
doi pubmed - Malaguarnera R, Belfiore A. The insulin receptor: a new target for cancer therapy. Front Endocrinol (Lausanne). 2011;2:93.
doi pubmed - Trehan S, Singh G, Singh A, Bector G, Jain A, Antil P, Kalpana F, et al. Chemotherapy and metabolic syndrome: a comprehensive review of molecular pathways and clinical outcomes. Cureus. 2024;16(8):e66354.
doi pubmed - Cosmin Stan M, Paul D. Diabetes and cancer: a twisted bond. Oncol Rev. 2024;18:1354549.
doi pubmed - Lewandowski KC, Plusajska J, Horzelski W, Bieniek E, Lewinski A. Limitations of insulin resistance assessment in polycystic ovary syndrome. Endocr Connect. 2018;7(3):403-412.
doi pubmed - Muniyappa R, Lee S, Chen H, Quon MJ. Current approaches for assessing insulin sensitivity and resistance in vivo: advantages, limitations, and appropriate usage. Am J Physiol Endocrinol Metab. 2008;294(1):E15-26.
doi pubmed - Yurchishin ML, Fowler LA, Goss AM, Garvey WT, Gower BA. Predictability of genetic risk score for insulin resistance is influenced by both BMI and race. Obesity (Silver Spring). 2025;33(4):788-795.
doi pubmed - Joo HJ, Kim GR, Park EC, Jang SI. Association between frequency of breakfast consumption and insulin resistance using triglyceride-glucose index: a cross-sectional study of the Korea National Health and Nutrition Examination Survey (2016-2018). Int J Environ Res Public Health. 2020;17(9):3322.
doi pubmed - Porchia LM, Ochoa-Precoma R, Reyes-Albarracin Y, Gonzalez-Mejia ME, Lopez-Bayghen E. Age-related differences in fluctuations in insulin resistance evaluated with HOMA-IR and triglyceride and glucose-based indices during the menstrual cycle, as determined using the NHANES cross-sectional dataset. Maturitas. 2024;188:108085.
doi pubmed - Araneta MR, Barrett-Connor E. Ethnic differences in visceral adipose tissue and type 2 diabetes: Filipino, African-American, and white women. Obes Res. 2005;13(8):1458-1465.
doi pubmed - Palaniappan LP, Carnethon MR, Fortmann SP. Heterogeneity in the relationship between ethnicity, BMI, and fasting insulin. Diabetes Care. 2002;25(8):1351-1357.
doi pubmed - Rokkam VR, Killeen RB, Kotagiri R. Secondary thrombocytosis. In: StatPearls. Treasure Island (FL) ineligible companies. 2025.
pubmed - Huang M, Wang L, Zhang Q, Zhou L, Liao R, Wu A, Wang X, et al. Interleukins in platelet biology: unraveling the complex regulatory network. Pharmaceuticals (Basel). 2024;17(1):109.
doi pubmed - Wang Z, Zhang W, Chen L, Lu X, Tu Y. Lymphopenia in sepsis: a narrative review. Crit Care. 2024;28(1):315.
doi pubmed - Doeleman SE, Reijnders TDY, Joosten SCM, Schuurman AR, van Engelen TSR, Verhoeff J, Leopold V, et al. Lymphopenia is associated with broad host response aberrations in community-acquired pneumonia. J Infect. 2024;88(4):106131.
doi pubmed - Jang HJ, Schellingerhout D, Kim J, Chung J, Kim DE. Towards a biomarker for acute arterial thrombosis using complete blood count and white blood cell differential parameters in mice. Sci Rep. 2023;13(1):4043.
doi pubmed - Tudurachi BS, Anghel L, Tudurachi A, Sascau RA, Statescu C. Assessment of inflammatory hematological ratios (NLR, PLR, MLR, LMR and monocyte/HDL-cholesterol ratio) in acute myocardial infarction and particularities in young patients. Int J Mol Sci. 2023;24(18):14378.
doi pubmed - Cheng JH, Cai WX, Xiang XH, Zhou MY, Sun X, Ye H, Li R. Platelet-to-lymphocyte ratios as a haematological marker of synovitis in rheumatoid arthritis with normal acute phase reactant level. Ann Med. 2024;56(1):2346546.
doi pubmed - Gasparyan AY, Ayvazyan L, Mukanova U, Yessirkepov M, Kitas GD. The platelet-to-lymphocyte ratio as an inflammatory marker in rheumatic diseases. Ann Lab Med. 2019;39(4):345-357.
doi pubmed - Mandaliya H, Jones M, Oldmeadow C, Nordman II. Prognostic biomarkers in stage IV non-small cell lung cancer (NSCLC): neutrophil to lymphocyte ratio (NLR), lymphocyte to monocyte ratio (LMR), platelet to lymphocyte ratio (PLR) and advanced lung cancer inflammation index (ALI). Transl Lung Cancer Res. 2019;8(6):886-894.
doi pubmed - Racz JM, Cleghorn MC, Jimenez MC, Atenafu EG, Jackson TD, Okrainec A, Venkat Raghavan L, et al. Predictive ability of blood neutrophil-to-lymphocyte and platelet-to-lymphocyte ratios in gastrointestinal stromal tumors. Ann Surg Oncol. 2015;22(7):2343-2350.
doi pubmed - Azab B, Shah N, Radbel J, Tan P, Bhatt V, Vonfrolio S, Habeshy A, et al. Pretreatment neutrophil/lymphocyte ratio is superior to platelet/lymphocyte ratio as a predictor of long-term mortality in breast cancer patients. Med Oncol. 2013;30(1):432.
doi pubmed - Fang T, Wang Y, Yin X, Zhai Z, Zhang Y, Yang Y, You Q, et al. Diagnostic sensitivity of NLR and PLR in early diagnosis of gastric cancer. J Immunol Res. 2020;2020:9146042.
doi pubmed - Peng HX, Yang L, He BS, Pan YQ, Ying HQ, Sun HL, Lin K, et al. Combination of preoperative NLR, PLR and CEA could increase the diagnostic efficacy for I-III stage CRC. J Clin Lab Anal. 2017;31(5):e22075.
doi pubmed - Zhang Y, Liu H. Correlation between insulin resistance and the rate of neutrophils-lymphocytes, monocytes-lymphocytes, platelets-lymphocytes in type 2 diabetic patients. BMC Endocr Disord. 2024;24(1):42.
doi pubmed - Rodriguez-Rodriguez E, Salas-Gonzalez MD, Ortega RM, Lopez-Sobaler AM. Leukocytes and neutrophil-lymphocyte ratio as indicators of insulin resistance in overweight/obese school-children. Front Nutr. 2021;8:811081.
doi pubmed - Xuan Nguyen K, Bui Minh T, Dinh HT, Viet Tran T, Dinh Le T, Phi Thi Nguyen N, Tran TTH, et al. Low-grade inflammation in gestational diabetes mellitus and its correlation with maternal insulin resistance and fetal growth indices. Int J Gen Med. 2023;16:1429-1436.
doi pubmed - Guerrero-Romero F, Simental-Mendia LE, Gonzalez-Ortiz M, Martinez-Abundis E, Ramos-Zavala MG, Hernandez-Gonzalez SO, Jacques-Camarena O, et al. The product of triglycerides and glucose, a simple measure of insulin sensitivity. Comparison with the euglycemic-hyperinsulinemic clamp. J Clin Endocrinol Metab. 2010;95(7):3347-3351.
doi pubmed - Huang Y, Gao P, Young LH, Qi D. Targeting white adipose tissue to combat insulin resistance. Trends Pharmacol Sci. 2024;45(10):868-871.
doi pubmed - Yan H, He L, Lv D, Yang J, Yuan Z. The role of the dysregulated JNK signaling pathway in the pathogenesis of human diseases and its potential therapeutic strategies: a comprehensive review. Biomolecules. 2024;14(2):243.
doi pubmed - Okuma H, Tsuchiya K. Tissue-specific activation of insulin signaling as a potential target for obesity-related metabolic disorders. Pharmacol Ther. 2024;262:108699.
doi pubmed - Aye IL, Jansson T, Powell TL. Interleukin-1beta inhibits insulin signaling and prevents insulin-stimulated system A amino acid transport in primary human trophoblasts. Mol Cell Endocrinol. 2013;381(1-2):46-55.
doi pubmed - Li W, Yang X, Zheng T, Xing S, Wu Y, Bian F, Wu G, et al. TNF-alpha stimulates endothelial palmitic acid transcytosis and promotes insulin resistance. Sci Rep. 2017;7:44659.
doi pubmed - da Costa RM, Neves KB, Mestriner FL, Louzada-Junior P, Bruder-Nascimento T, Tostes RC. TNF-alpha induces vascular insulin resistance via positive modulation of PTEN and decreased Akt/eNOS/NO signaling in high fat diet-fed mice. Cardiovasc Diabetol. 2016;15(1):119.
doi pubmed - Elcioglu ZC, Errington L, Metes B, Sendama W, Powell J, Simpson AJ, Rostron AJ, et al. Pooled prevalence of lymphopenia in all-cause hospitalisations and association with infection: a systematic review and meta-analysis. BMC Infect Dis. 2023;23(1):848.
doi pubmed - Martinez Bravo G, Annarapu G, Carmona E, Nawarskas J, Clark R, Novelli E, Mota Alvidrez RI. Platelets in thrombosis and atherosclerosis: a double-edged sword. Am J Pathol. 2024;194(9):1608-1621.
doi pubmed - Contursi A, Tacconelli S, Di Berardino S, De Michele A, Patrignani P. Platelets as crucial players in the dynamic interplay of inflammation, immunity, and cancer: unveiling new strategies for cancer prevention. Front Pharmacol. 2024;15:1520488.
doi pubmed - Greaves J, Pula G. Hyperactivity and pro-inflammatory functions of platelets in diabetes. Front Biosci (Landmark Ed). 2025;30(1):26190.
doi pubmed
This article is distributed under the terms of the Creative Commons Attribution Non-Commercial 4.0 International License, which permits unrestricted non-commercial use, distribution, and reproduction in any medium, provided the original work is properly cited.
World Journal of Oncology is published by Elmer Press Inc.