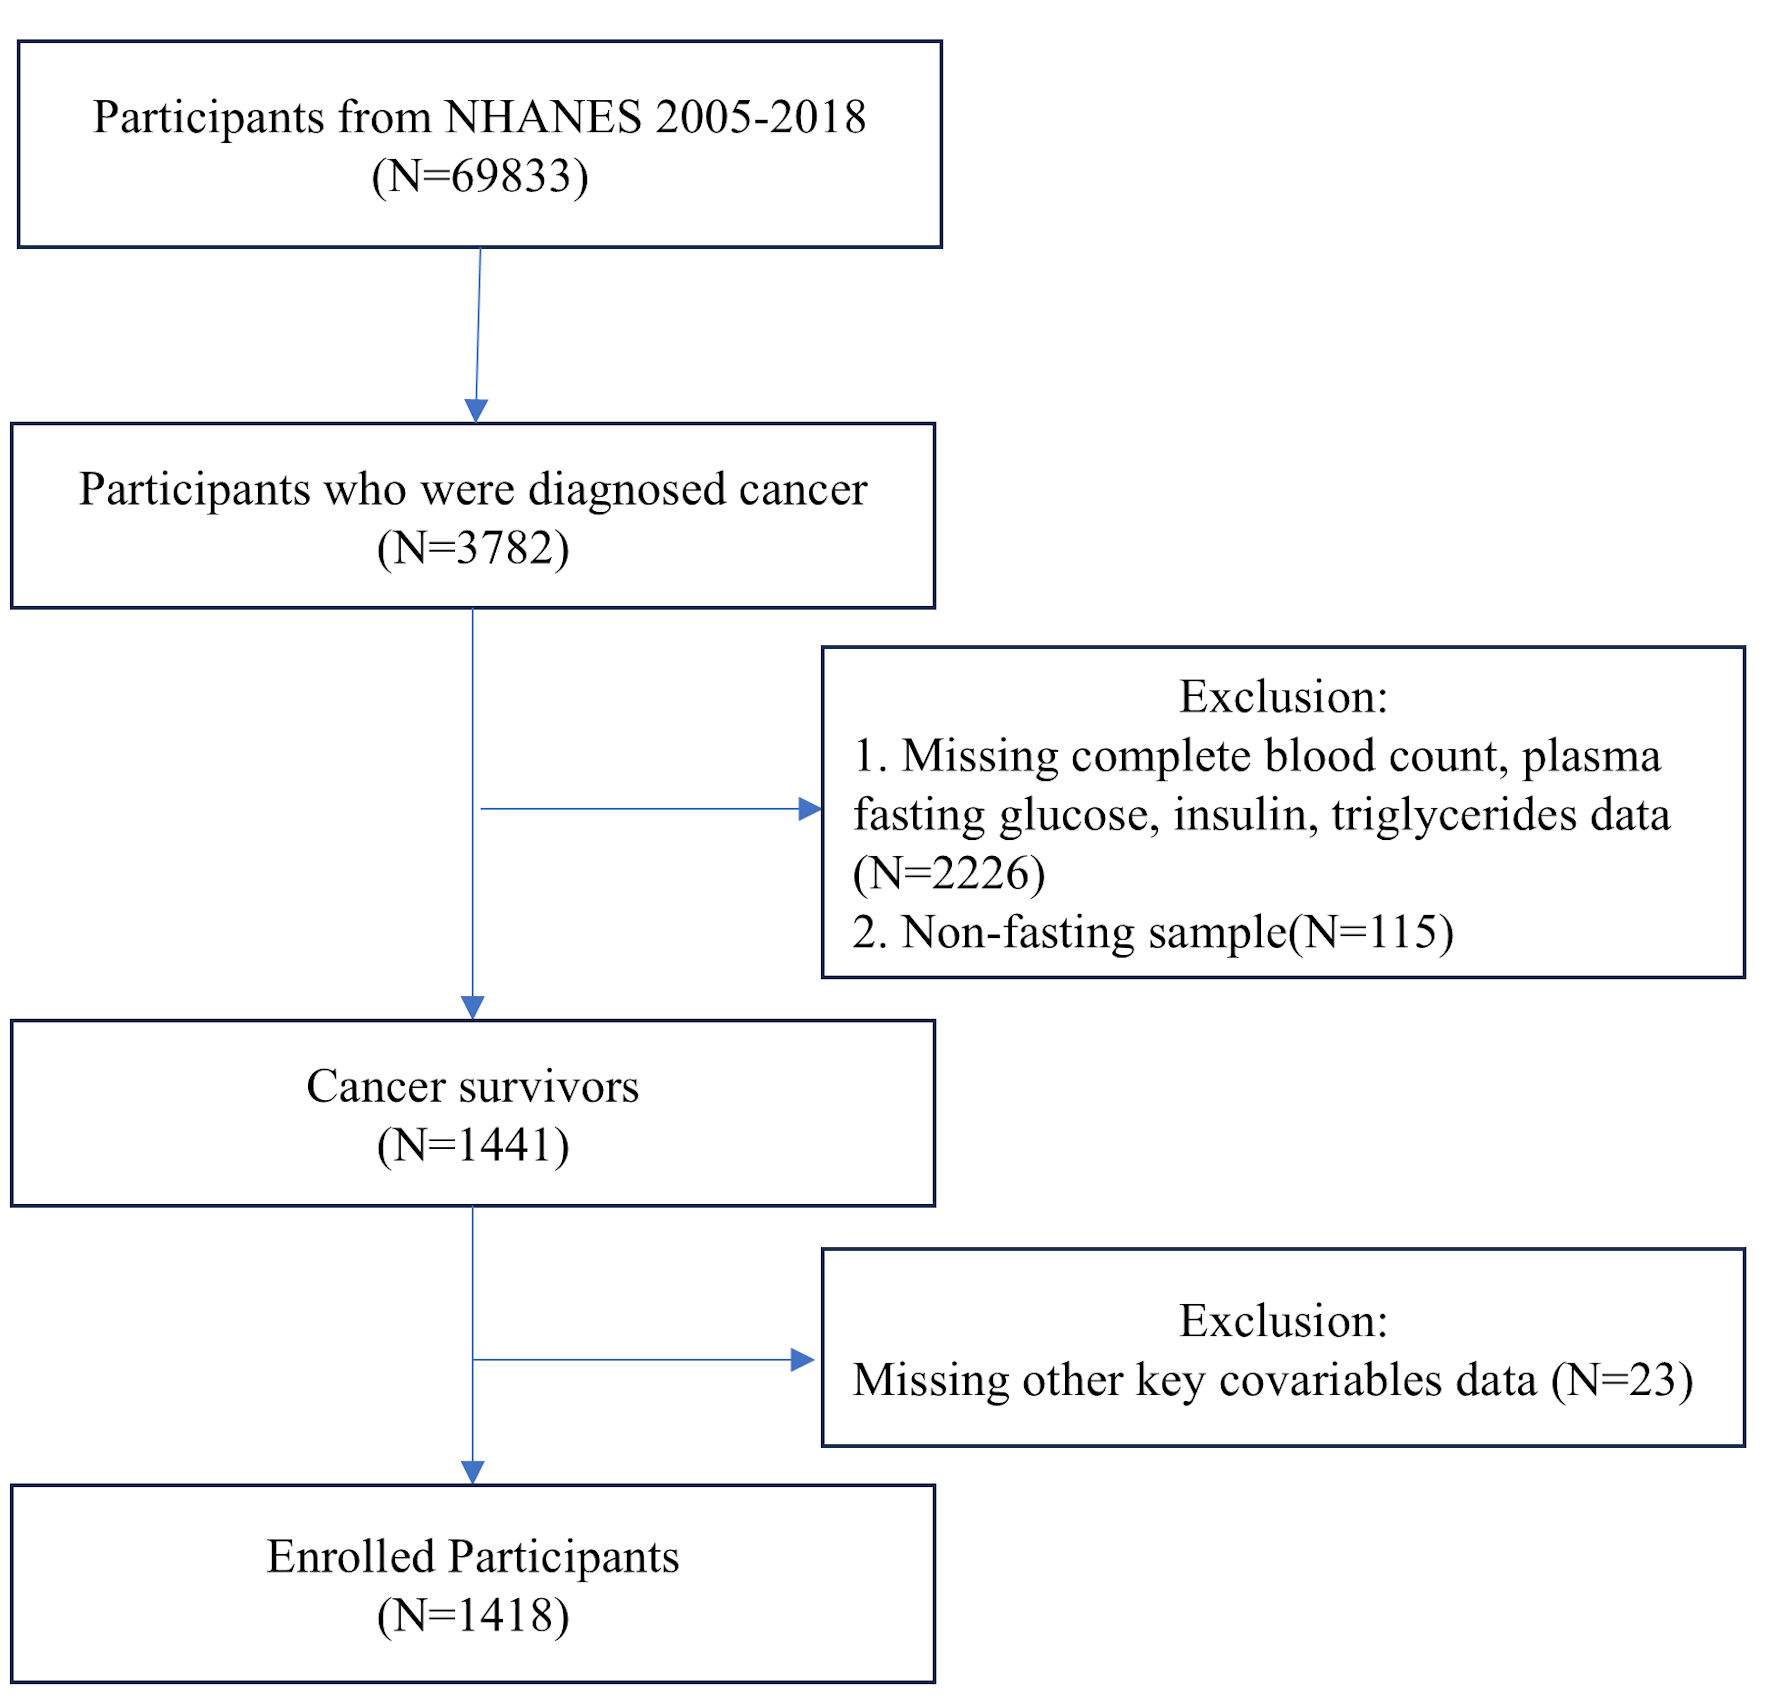
↓ Figure 1. Flowchart of the systematic selection
process.
| World Journal of Oncology, ISSN 1920-4531 print, 1920-454X online, Open Access |
| Article copyright, the authors; Journal compilation copyright, World J Oncol and Elmer Press Inc |
| Journal website https://wjon.elmerpub.com |
Original Article
Volume 16, Number 5, October 2025, pages 509-524
Association Between Platelet-to-Lymphocyte Ratio and Insulin Resistance in Cancer Survivors: A Cross-Sectional Study Based on the NHANES 2005 - 2018
Figures
Tables
| Characteristics | Total (n = 1,418) | HOMA-IR | QUICKI | TyG index | ||||||
|---|---|---|---|---|---|---|---|---|---|---|
| < 2.5 (n = 762) | ≥ 2.5 (n = 626) | P value | ≥ 0.33 (n = 710) | < 0.33 (n = 708) | P value | < 4.68 (n = 718) | ≥ 4.68 (n = 700) | P value | ||
| Non-normally distributed continuous variables are presented as median (Q1, Q3), and categorical variables are reported as n (weighted %). P values are calculated using one-way ANOVA for continuous variables and Chi-square test for categorical variables. PLR: platelet-to-lymphocyte ratio; HOMA-IR: homeostatic model assessment for insulin resistance; QUICKI: quantitative insulin sensitivity check index; TyG: triglyceride-glucose; PIR: poverty income ratio; PA: physical activity; BMI: body mass index; CVD: cardiovascular disease; ANOVA: analysis of variance. | ||||||||||
| PLR, median (Q1, Q3) | 130.5 (101.3, 168.1) | 125.28 (96.93, 162.97) | 137.14 (107.03, 173.33) | < 0.001 | 123.51 (96.22, 161.42) | 137.74 (108.22, 174.30) | < 0.001 | 126.00 (96.32, 163.28) | 135.13 (106.39, 172.36) | 0.002 |
| Age, years, median (Q1, Q3) | 69.0 (58.0, 78.0) | 69.00 (57.00, 79.00) | 68.00 (58.00, 76.00) | 0.891 | 70.00 (57.75, 79.00) | 68.00 (58.00, 76.00) | 0.849 | 68.00 (56.75, 78.00) | 69.00 (59.25, 78.00) | 0.004 |
| Gender, n (%) | 0.046 | 0.064 | 0.222 | |||||||
| Male | 654 (41.6) | 296 (39.1) | 358 (44.3) | 322 (39.4) | 332 (44.3) | 328 (40.1) | 326 (43.3) | |||
| Female | 764 (58.4) | 360 (61.0) | 404 (55.7) | 386 (60.6) | 378 (55.8) | 372 (59.9) | 392 (56.7) | |||
| Race/ethnicity, n (%) | 0.002 | 0.003 | 0.253 | |||||||
| Mexican American | 106 (2.8) | 32 (1.6) | 74 (4.1) | 34 (1.7) | 72 (4.21) | 40 (2.3) | 66 (3.4) | |||
| Other Hispanic | 98 (2.8) | 35 (2.6) | 54 (3.0) | 35 (2.4) | 54 (3.2) | 44 (3.1) | 45 (2.4) | |||
| Non-Hispanic White | 964 (85.2) | 489 (88.8) | 475 (81.6) | 533 (88.5) | 44 (81.4) | 459 (84.2) | 505 (86.3) | |||
| Non-Hispanic Black | 181 (5.3) | 65 (3.9) | 116 (6.6) | 77 (4.2) | 104 (6.5) | 119 (6.3) | 64 (4.1) | |||
| Other race | 78 (3.9) | 35 (3.1) | 43 (4.7) | 39 (3.2) | 39 (4.8) | 40 (4.0) | 38 (3.8) | |||
| Marital status, n (%) | 0.656 | 0.307 | 0.091 | |||||||
| Never married | 81 (4.9) | 37 (5.4) | 44 (4.4) | 43 (5.7) | 38 (4.0) | 47 (5.4) | 34 (4.4) | |||
| Married/living with partner | 892 (68.3) | 408 (67.5) | 484 (69.1) | 441 (67.6) | 451 (69.1) | 441 (70.2) | 451 (66.3) | |||
| Widowed/divorced/separated | 445 (26.8) | 211 (27.1) | 234 (26.5) | 224 (26.7) | 221 (27.0) | 212 (24.4) | 233 (29.4) | |||
| Education, n (%) | 0.033 | 0.029 | 0.005 | |||||||
| Less than high school | 301 (12.9) | 124 (11.0) | 177 (14.8) | 133 (11.1) | 168 (15.0) | 125 (10.5) | 176 (15.4) | |||
| Above high school | 1,117 (87.1) | 532 (89.0) | 585 (85.2) | 575 (88.9) | 542 (85.0) | 575 (89.5) | 542 (84.6) | |||
| Family PIR, n (%) | < 0.001 | < 0.001 | < 0.001 | |||||||
| < 1.3 | 331 (14.7) | 127 (11.4) | 204 (18.0) | 137 (11.6) | 194 (18.2) | 143 (12.6) | 188 (17.0) | |||
| 1.3 - 3.5 | 572 (36.1) | 261 (33.6) | 311 (38.7) | 289 (34.6) | 283 (37.8) | 276 (31.3) | 305 (41.2) | |||
| ≥ 3.5 | 515 (49.2) | 268 (55.1) | 247 (43.3) | 282 (53.8) | 233 (44.0) | 290 (56.1) | 225 (41.9) | |||
| Smoking status, n (%) | 0.697 | 0.956 | 0.025 | |||||||
| No | 663 (48.7) | 314 (49.3) | 349 (48.2) | 334 (48.8) | 329 (48.7) | 344 (51.6) | 319 (45.7) | |||
| Yes | 755 (51.3) | 342 (50.8) | 413 (51.8) | 374 (51.2) | 381 (51.3) | 356 (48.4) | 399 (54.4) | |||
| Alcohol use, n (%) | 0.001 | < 0.001 | 0.204 | |||||||
| No | 354 (20.4) | 141 (16.9) | 232 (24.0) | 150 (16.8) | 204 (24.6) | 161 (19.1) | 193 (21.8) | |||
| Yes | 1,064 (79.6) | 515 (83.1) | 549 (76.0) | 558 (83.2) | 506 (75.4) | 539 (80.9) | 525 (78.2) | |||
| Sleep duration, h/night, n (%) | 0.017 | 0.006 | 0.042 | |||||||
| < 7 | 428 (27.3) | 182 (24.6) | 246 (30.1) | 194 (24.1) | 234 (31.1) | 193 (24.5) | 235 (30.3) | |||
| 7.0 - 9.0 | 793 (60.8) | 388 (64.4) | 405 (57.1) | 418 (64.4) | 375 (56.5) | 408 (63.6) | 385 (57.8) | |||
| ≥ 9 | 197 (11.9) | 86 (11.0) | 111 (12.8) | 96 (11.5) | 101 (12.4) | 99 (11.9) | 98 (11.9) | |||
| PA, MET-min/week, n (%) | < 0.001 | < 0.001 | < 0.001 | |||||||
| < 600 | 698 (43.7) | 296 (38.5) | 402 (49.0) | 319 (38.4) | 379 (49.9) | 318 (37.8) | 380 (50.0) | |||
| ≥ 600 | 720 (56.3) | 360 (61.5) | 360 (51.0) | 389 (61.6) | 331 (50.1) | 382 (62.2) | 338 (50.0) | |||
| BMI, kg/m2, n (%) | < 0.001 | < 0.001 | < 0.001 | |||||||
| < 18.5 | 20 (1.8) | 18 (3.2) | 2 (0.3) | 19 (3.2) | 1 (0.1) | 17 (3.1) | 3 (0.4) | |||
| 18.5 < 25 | 377 (28.3) | 292 (45.0) | 85 (11.1) | 303 (43.8) | 74 (10.1) | 261 (38.6) | 116 (17.1) | |||
| 25 < 30 | 486 (34.1) | 243 (37.6) | 243 (30.6) | 270 (37.9) | 216 (29.7) | 231 (33.3) | 255 (35.0) | |||
| ≥ 30 | 535 (35.8) | 103 (14.2) | 432 (58.0) | 116 (15.2) | 419 (60.1) | 191 (25.0) | 344 (47.5) | |||
| Diabetes mellitus, n (%) | < 0.001 | < 0.001 | < 0.001 | |||||||
| No | 979 (76.4) | 559 (90.8) | 420 (61.6) | 599 (90.3) | 380 (60.1) | 589 (88.3) | 390 (63.6) | |||
| Yes | 439 (23.6) | 97 (9.2) | 342 (38.4) | 109 (9.7) | 330 (39.9) | 111 (11.7) | 328 (36.4) | |||
| CVD, n (%) | < 0.001 | < 0.001 | 0.002 | |||||||
| No | 1,066 (80.0) | 516 (83.8) | 550 (76.2) | 559 (83.9) | 507 (75.5) | 553 (83.2) | 513 (76.7) | |||
| Yes | 352 (20.0) | 140 (16.2) | 212 (23.8) | 149 (16.1) | 203 (24.5) | 147 (16.8) | 205 (23.4) | |||
| Hypertension, n (%) | < 0.001 | < 0.001 | < 0.001 | |||||||
| No | 596 (48.2) | 339 (58.4) | 257 (37.7) | 363 (58.2) | 233 (36.4) | 340 (56.2) | 256 (39.6) | |||
| Yes | 822 (51.8) | 317 (41.6) | 257 (62.3) | 345 (41.8) | 477 (63.6) | 360 (43.8) | 462 (60.4) | |||
| PLR quartiles | By HOMA-IR | By QUICKI | By TyG index | |||||||||||||||
|---|---|---|---|---|---|---|---|---|---|---|---|---|---|---|---|---|---|---|
| Model 1 | Model 2 | Model 3 | Model 1 | Model 2 | Model 3 | Model 1 | Model 2 | Model 3 | ||||||||||
| HR (95% CI) | P value | HR (95% CI) | P value | HR (95% CI) | P value | HR (95% CI) | P value | HR (95% CI) | P value | HR (95% CI) | P value | HR (95% CI) | P value | HR (95% CI) | P value | HR (95% CI) | P value | |
| Model 1: non-adjusted model; Model 2: adjusted for age, sex, race/ethnicity, marital status, and family PRI; Model 3: adjusted for Model 1 covariates plus smoking status, alcohol use, sleep duration, physical activity, BMI, CVD and hypertension. PLR: platelet-to-lymphocyte ratio; HOMA-IR: homeostatic model assessment for insulin resistance; QUICKI: quantitative insulin sensitivity check index; TyG: triglyceride-glucose; BMI: body mass index; CVD: cardiovascular disease; HR: hazard ratio; CI: confidence interval; Ref: reference. | ||||||||||||||||||
| Q1 (< 101.33) | Ref | Ref | Ref | Ref | Ref | Ref | Ref | Ref | Ref | |||||||||
| Q2 (101.33 - 130.51) | 1.19 (0.81, 1.75) | 0.375 | 1.18 (0.81, 1.73) | 0.393 | 1.11 (0.75, 1.83) | 0.476 | 1.22 (0.84, 1.79) | 0.298 | 1.23 (0.84, 1.79) | 0.296 | 1.25 (0.81, 1.95) | 0.326 | 1.57 (1.07, 2.31) | 0.021 | 1.54 (1.05, 2.28) | 0.029 | 1.61 (1.05, 2.46) | 0.027 |
| Q3 (130.51 - 168.18) | 1.43 (0.96, 2.13) | 0.075 | 1.37 (0.93, 2.03) | 0.111 | 1.39 (0.89, 2.15) | 0.144 | 1.56 (1.05, 2.32) | 0.026 | 1.51 (1.03, 2.23) | 0.037 | 1.62 (1.05, 2.51) | 0.030 | 1.70 (1.15, 2.53) | 0.008 | 1.65 (1.11, 2.46) | 0.013 | 1.69 (1.09, 2.62) | 0.017 |
| Q4 (≥ 168.18) | 1.64 (1.11, 2.13) | 0.013 | 1.58 (1.07, 2.35) | 0.223 | 1.40 (0.90, 2.14) | 0.140 | 1.80 (1.21, 2.68) | 0.003 | 1.75 (1.17, 2.60) | 0.006 | 1.61 (1.02, 2.53) | 0.040 | 1.67 (1.13, 2.47) | 0.010 | 1.67 (1.12, 2.49) | 0.012 | 1.56 (1.02, 2.45) | 0.035 |
| P for trend | 1.18 (1.04, 1.34) | 0.008 | 1.16 (1.03, 1.32) | 0.017 | 1.13 (0.98, 1.30) | 0.091 | 1.22 (1.08, 1.39) | 0.002 | 1.21 (1.06, 1.37) | 0.003 | 1.19 (1.03, 1.38) | 0.021 | 1.17 (1.04, 1.33) | 0.012 | 1.17 (1.03, 1.33) | 0.014 | 1.15 (1.01, 1.31) | 0.039 |
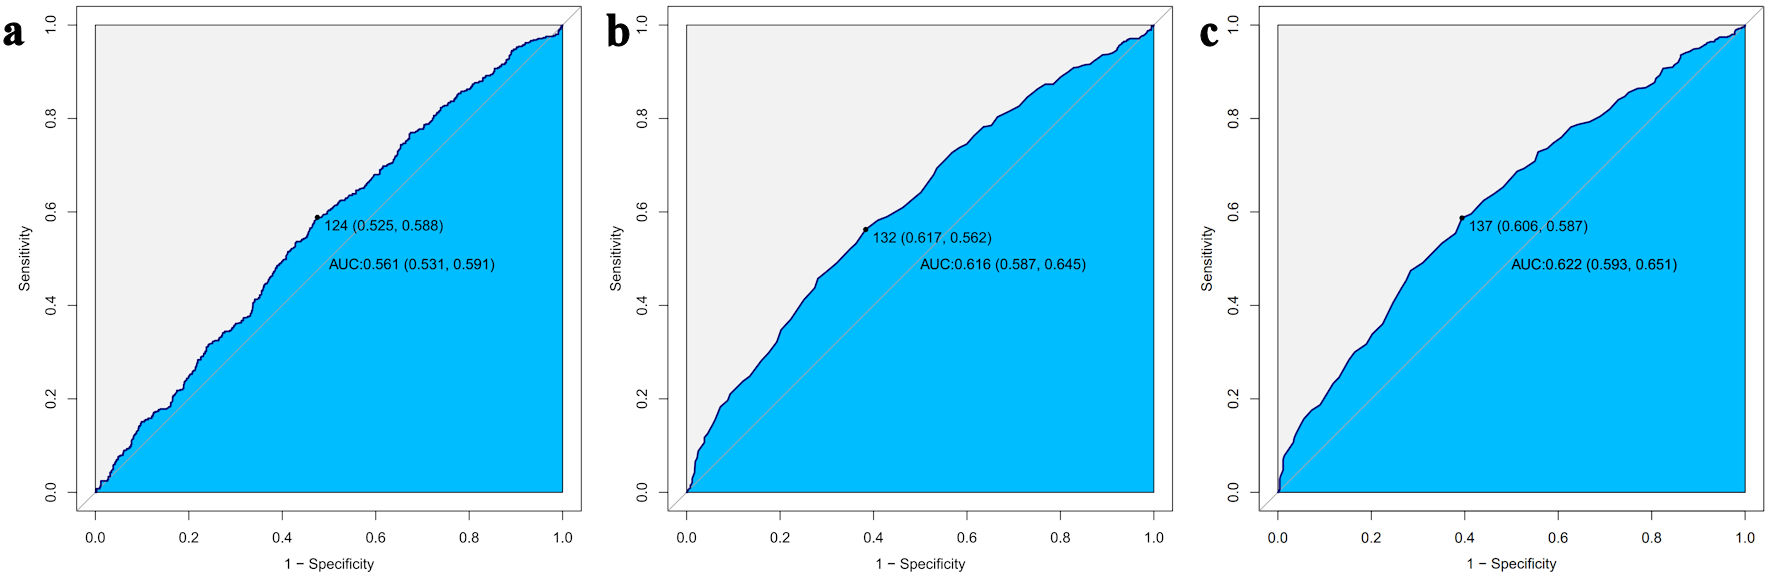
| IR indicator | Variable | Cutoff value | Sensitivity | Specificity | AUC (95% CI) |
|---|---|---|---|---|---|
| HOMA-IR | PLR | 124 | 0.525 | 0.588 | 0.561 (0.531, 0.591) |
| QUICKI | PLR | 132 | 0.617 | 0.562 | 0.616 (0.587, 0.645) |
| TyG index | PLR | 137 | 0.606 | 0.587 | 0.622 (0.593, 0.651) |