| World Journal of Oncology, ISSN 1920-4531 print, 1920-454X online, Open Access |
| Article copyright, the authors; Journal compilation copyright, World J Oncol and Elmer Press Inc |
| Journal website https://wjon.elmerpub.com |
Original Article
Volume 16, Number 1, February 2025, pages 83-94

Proliferation Inhibited by Genipin in Human Leukemia K562 Cells: Involvement of Uncoupling Protein 2 in Mitochondrial Damage
Ying Zhoua, Rui Suna, Zi Wen Zhanga, Xin Yi Hea, Lin Lia, Chun Jing Zhanga, Ying Liua, c, Hai Tao Yub, c
aDepartment of Biochemistry and Molecular Biology, Qiqihar Medical University,
Qiqihar, Heilongjiang, China
bDepartment of Cell Biology and Genetics, Qiqihar
Medical University, Qiqihar, Heilongjiang, China
cCorresponding Author: Ying
Liu, Department of Biochemistry and Molecular Biology, Qiqihar Medical University, Qiqihar,
Heilongjiang, China; Hai Tao Yu, Department of Cell Biology and Genetics, Qiqihar Medical
University, Qiqihar, Heilongjiang, China
Manuscript submitted September 21, 2024, accepted December 16, 2024, published online December
31, 2024
Short title: GEN Inhibits the Proliferation of K562 Cells
doi:
https://doi.org/10.14740/wjon1975
| Abstract | ▴Top |
Background: Uncoupling protein 2 (UCP2) is essential for maintaining redox homeostasis and regulating energy metabolism. Abnormal expression of UCP2 has been associated with various tumors, including leukemia. Genipin (GEN), a specific inhibitor of UCP2, has a long history of use in traditional Chinese medicine. However, the precise role and underlying mechanisms of UCP2 in the inhibition of leukemia cells by GEN remain inadequately understood. This study focuses on the expression levels of UCP2 in myeloid leukemia (ML) and investigates the effects of GEN on the proliferation, mitochondrial function, and energy metabolism of the chronic myeloid leukemia (CML) cell line K562.
Methods: The expression of UCP2 in clinical samples and cell lines (HL-60, U937, and K562) was confirmed using real-time quantitative polymerase chain reaction (qPCR) and western blot. The effects of GEN on K562 cell viability, morphology, and apoptosis were assessed through a cell counting kit-8 (CCK-8), Wright-Giemsa staining, and an annexin V-fluorescein isothiocyanate/propidium iodide (FITC/PI) apoptosis detection kit. Additionally, the impact of GEN on mitochondrial function and energy metabolism, including reactive oxygen species (ROS), mitochondrial membrane permeability transition pore (MPTP), lactic acid (LA), oxygen consumption rate (OCR), and adenosine triphosphate (ATP) levels in K562 cells, was also examined.
Results: The results showed that UCP2 was differentially expressed in clinical samples from patients with ML. Among the three cell lines examined, K562 cells exhibited a significantly higher expression level of UCP2. Functionally, GEN markedly inhibited K562 cell viability while promoting K562 cell differentiation and apoptosis. Mechanistically, UCP2 mRNA and protein expression levels were inhibited by GEN in K562 cells in a concentration- and time-dependent manner. Additionally, GEN dramatically increased ROS generation and induced mitochondrial MPTP opening in K562 cells. Furthermore, GEN significantly reduced LA production in K562 cells and markedly increased OCR and ATP production.
Conclusion: The results suggest that UCP2 is differentially expressed in ML patients and cell lines; GEN, a UCP2 inhibitor, induces mitochondrial damage and metabolic remodeling, thereby inhibiting proliferation and promoting apoptosis in K562 cells, and thus could be suggested as an adjuvant of an antitumor metabolic therapy.
Keywords: GEN; K562 cells; UCP2; Mitochondrial damage; Energy metabolism
| Introduction | ▴Top |
Leukemia is a malignant clonal hematopoietic stem cell disease characterized by disorders in cell differentiation, uncontrolled proliferation, and inhibited apoptosis. Effective prevention and control of leukemia are essential components of disease management [1, 2]. In clinical practice, leukemia is classified into acute leukemia and chronic leukemia based on the onset of the disease. Additionally, it can be categorized into myeloid and lymphocytic leukemia according to the type of cells involved [3]. Chronic myeloid leukemia (CML) accounts for approximately 15% of adult leukemia cases, with an annual incidence rate of 2 per 100,000 individuals [4]. CML is classified as a myeloproliferative neoplasm resulting from a reciprocal translocation [t(9; 22) (q34; q11.2)], which leads to the fusion of ABL1 gene sequences on chromosome 9q34 with BCR gene sequences on chromosome 22q11. The resulting BCR/ABL1 chimeric protein is a constitutively active tyrosine kinase that modulates various redox and energy metabolism-related signaling pathways, including RAS/MAPK, PI3K/Akt, and JAK/STAT, which collectively contribute to malignant transformation [5, 6].
Most patients progress rapidly and are challenging to manage, significantly jeopardizing their lives and quality of life [7]. In the absence of effective treatment, the chronic phase of CML will advance to the acute phase. Currently, no effective therapeutic strategy has been identified for patients in the acute phase, and the survival period typically does not exceed 6 months [8]. The development of BCR-ABL1 tyrosine kinase inhibitors (TKIs) has provided benefits for CML patients. However, approximately 20-30% of patients still encounter treatment failure due to factors such as drug resistance, relapse after discontinuation, or disease progression [9]. Consequently, the primary challenge in treating CML lies in overcoming TKI resistance, enhancing the prognosis of blast phase CML (BP-CML), and increasing treatment-free remission (TFR) rates. Key areas for the treatment of CML continue to focus on optimizing treatment strategies and researching patient medication discontinuation [10].
The treatment of CML with traditional Chinese medicine offers therapeutic advantages, including the sensitization of chemotherapy and the enhancement of the body’s immune function. Identifying key compounds in traditional Chinese medicine that are effective against CML and elucidating their mechanisms of action can provide novel insights for the treatment of this disease. Gardenia, a traditional Chinese medicine with a clinical history spanning 1,600 years, shows considerable promise in this context [11]. The main component of Gardenia, GEN, has been extensively studied in recent years as a novel biological crosslinking agent, demonstrating significant anti-inflammatory, anti-tumor, and hypoglycemic effects, as well as acting as an uncoupling protein 2 (UCP2) inhibitor [12].
UCP2 is the only uncoupling protein that is widely expressed across various tissues. It is located in the inner mitochondrial membrane and serves as an important endogenous antioxidant protein within the body. UCP2 plays a crucial role in regulating redox homeostasis and energy metabolism, and it can influence tumor growth by modulating intracellular reactive oxygen species (ROS) levels [13]. Numerous studies have demonstrated that UCP2 is highly expressed in various malignant tumors, particularly in cells with high proliferative potential, such as breast cancer [14], lung cancer [15], and leukemia [16, 17]. Furthermore, downregulating UCP2 has been shown to induce apoptosis in leukemia K562 cells [18].
Mailloux et al [19] utilized drug-sensitive acute promyelocytic leukemia HL-60 cells and a drug-resistant MX2 subline as models, and found that GEN rendered drug-resistant cells sensitive to chemotherapy drugs by inhibiting the expression of UCP2. Feng et al [18] demonstrated that GEN inhibits K562 cell proliferation by activating caspase-3 and inducing G2/M phase cell cycle arrest. However, the specific actions and mechanisms of UCP2 in the context of GEN’s inhibition of leukemia cells remain to be fully elucidated. In the present study, we investigated the differential expression levels of UCP2 in ML patients and cell lines, as well as the effects of GEN on the proliferation of human leukemia K562 cells in vitro, aiming to clarify the underlying mechanisms.
| Materials and Methods | ▴Top |
Main materials and reagents
Human promyelocytic leukemia cell lines K562 (CCTCC # SCSP-5054), U937 (CCTCC # TCHu159), and HL60 (CCTCC # TCHu23) were obtained from the China Center for Type Culture Collection. RPMI-1640 culture medium and the annexin V-fluorescein isothiocyanate/propidium iodide (FITC/PI) apoptosis detection kit were procured from Kaiji Biotechnology. Fetal bovine serum was sourced from Clark, while penicillin-streptomycin was acquired from Biosharp. The PrimeScript™ First Strand cDNA synthesis kit was obtained from TaKaRa, and the PerfectStart Green qPCR SuperMix was purchased from Beijing Quanshijin Biotechnology Co., Ltd. GEN was acquired from Sigma, and the cell counting kit-8 (CCK-8) assay kit was obtained from Glpbio. The bicinchoninic acid (BCA) protein assay kit, ROS assay kit, membrane permeability transition pore (MPTP) assay kit, and adenosine triphosphate (ATP) assay kit were all purchased from Biyuntian Biotechnology Co., Ltd. UCP2 primer was synthesized by Shanghai Shenggong Biotechnology, and glyceraldehyde-3-phosphate dehydrogenase (GAPDH) primer was synthesized by Shanghai Qiyin Biosynthesis. The L-lactic acid (LA) content detection reagent kit was purchased from Beijing Solaibao Technology Co., Ltd, and the extracellular oxygen consumption rate (OCR) plate assay kit was procured from Dojindo Company. UCP2 antibody was obtained from Santa Cruz, and β-actin antibody was acquired from Beijing Zhongshan Jinqiao Biotechnology Co., Ltd. The primer sequences for CD33, CD11b, and GAPDH were synthesized by Sangon Biotech (Shanghai) Co., Ltd.
Clinical patient bone marrow samples
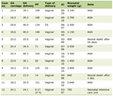
From November 25, 2023 to May 10, 2024, bone marrow samples were collected from 25 patients with acute myeloid leukemia (AML) and 22 patients with CML, all of whom had initial diagnosis records. Additionally, samples were obtained from 10 normal human subjects at the Hematology Department of the Second Affiliated Hospital of Qiqihar Medical University. All selected patients met the diagnostic criteria for AML and CML as outlined in the WHO 2022 guidelines [20]. The diagnoses were confirmed through a comprehensive examination that included cytogenetic analysis, evaluation of bone marrow cell morphology, immunological assessments, and molecular biology techniques. All patients were newly diagnosed and had not received any treatment prior to this study. To ensure the complete confidentiality of the participants, only de-identified information (such as age, gender, and pathology outcomes) will be used to indicate whether the samples were from a participant who tested positive or negative for ML. No information regarding dietary factors, such as smoking and alcohol consumption, was made available for this study. All available data are summarized in Table 1.
 Click to view |
Table 1. General Clinical Data in ML
Patients |
Ethical approval
The study was approved by the Ethics Committee of Qiqihar Medical University (protocol number: 54/2023). To ensure patient privacy, all information utilized in the research was maintained in strict confidentiality, adhering to established ethical guidelines and privacy protocols. The Ethics Committee waived the requirement for informed consent due to the absence of intervention and the exclusion of patient-identifying information. The waiver of consent was justified based on three primary reasons: 1) All specimens were obtained retrospectively from pathology archives; 2) There was no risk to participants, as only anonymized bone marrow samples were used; and 3) Patients’ identities were anonymized and completely dissociated from any unique identifiers. This study was conducted in accordance with the ethical standards of the responsible institution regarding human subjects, as well as the principles outlined in the Helsinki Declaration.
Cell culture
HL60, U937, and K562 cells were cultured in RPMI-1640 medium supplemented with 10% serum and 1% penicillin-streptomycin at 37 °C in an atmosphere containing 5% CO2. The cells were passaged every 2 - 3 days, and prior to any treatments, they were maintained in a logarithmic growth phase.
RNA extraction and quantitative reverse transcription polymerase chain reaction (qRT-PCR)
Total RNA was extracted from patient bone marrow cells and leukemia cell lines using the Trizol method. The concentration and purity of the RNA were assessed with a B-500 biophotometer (Metash, China). Following the instructions provided with the PrimeScript™ First Strand cDNA synthesis kit, 1 µg of RNA was reverse transcribed into cDNA. qRT-PCR was performed using the PerfectStart Green qPCR SuperMix kit, with GAPDH serving as an internal reference gene for detection. Real-time PCR amplification was conducted with an qTOWER3 G (Analytik Jena, Germany) according to the manufacturer’s protocol for relative quantification. The standard temperature profile included an initial denaturation at 94 °C for 30 s, followed by 40 cycles of denaturation at 94 °C for 5 s, and annealing and extension at 60 °C for 30 s. The relative expression level of target gene mRNA was calculated using the 2-ΔΔCT method. The primer sequence is provided in Table 2.
Click to view |
Table 2. The PCR Primer Sequence |
Protein extraction and western blot analysis
Cells were collected and mixed with an appropriate volume of radioimmunoprecipitation assay (RIPA) lysate containing protease and phosphatase inhibitors. The mixture was placed in an ice bath and shaken for 30 min until complete lysis occurred. Following this, the samples were centrifuged at 4 °C and 12,000 g for 10 min, and the supernatant was collected. The total protein concentration was determined using the BCA protein concentration assay kit, and the sample volume was adjusted to 40 µg per well. Subsequently, the proteins were separated using a 10% sodium dodecyl sulfate-polyacrylamide gel electrophoresis (SDS-PAGE) gel and transferred to polyvinylidene difluoride (PVDF) membranes. The membranes were blocked with 5% skim milk for 2 h, followed by an overnight incubation with UCP2 antibody (1:800) at 4 °C, and then with secondary antibodies (1:5,000) for an additional 2 h. Grayscale analysis of the images was performed using ImageJ software version 1.52a. The expression levels of the proteins were compared by calculating the ratio of the grayscale values of the target protein to that of the internal reference, with β-actin (1:1,500) serving as the internal reference.
Cell proliferation was detected by the CCK-8 method
K562 cells were inoculated into 96-well plates at a density of 1 × 10⁴ cells/well. Each group was treated with GEN at final concentrations of 20, 40, 80, 120, 160, and 200 µmol/L in 150 µL, as well as corresponding blank and control groups. The cells were then cultured at 37 °C in a 5% CO2 incubator for 24, 48, and 72 h. Subsequently, 15 µL of CCK-8 reagent was added to each well and incubated for an additional 2 h. The absorbance at A450 nm was measured using an Infinite m plex (TECAN) plate reader. Cell viability is calculated according to the instructions.
Cell apoptosis was detected by flow cytometry
An experimental group (GEN) was established with concentrations of 40, 80, and 160 µmol/L, alongside a control group. Each group consisted of 1 × 10⁶ K562 cells cultured in a 75 cm2 culture flask containing 14 mL of complete medium for 72 h. Following the protocol, 5 × 10⁵ cells were harvested from each group and washed twice with phosphate-buffered saline (PBS). Subsequently, 500 µL of binding buffer was added to the cells and gently mixed. Next, 5 µL of annexin V-FITC was introduced and thoroughly mixed. Finally, 5 µL of PI was added and mixed well. The cells were allowed to react at room temperature and protected from light for 5 min. Observations and detections were performed using a flow cytometer.
Cell morphology was observed through Wright-Giemsa staining
The experimental group (GEN, 112 µmol/L) and a control group were established. K562 cells were inoculated into a 75 cm2 culture flask containing 14 mL of complete medium, with 1 × 10⁶ cells in each group. The cells were incubated at 37 °C in a 5% CO2 incubator for 72 h (all subsequent experimental cell models were treated similarly). Following incubation, cells were collected for Wright-Giemsa staining. The staining procedure involved several steps. First, Wright’s stain was added dropwise to the smear until it was completely covered. The excess stain was then removed using an aspirator ball, and the smear was allowed to stand for approximately 1 min. Next, a suitable amount of Giemsa’s stain was added dropwise, ensuring thorough coverage. Subsequently, an equal or slightly larger volume of phosphate buffer was added immediately and mixed with the stain. The mixture was left to stand for 5 min. Finally, the staining solution was rinsed away from one end of the smear with running water, and the smear was air-dried. Cell morphology was then observed and photographed under an oil immersion microscope.
ROS levels in cells were detected using the 2,7-Dichlorodihydrofluorescein Diacetate (DCFH-DA) probe in combination with flow cytometry
According to the instructions provided with the ROS assay kit, 1 × 10⁶ cells were collected in 1.5 mL EP tubes for each group. The cells were washed three times with PBS and then mixed with 0.8 mL of the DCFH-DA (10 µmol/L) probe working solution. Subsequently, the cells were transferred to a 12-well plate to ensure complete binding with the staining solution and incubated in a dark incubator for 30 min. Following incubation, the cells were washed three times with PBS to remove any unbound probe and were then resuspended in 500 µL of serum-free medium. ROS were detected by flow cytometry, utilizing an excitation wavelength of 488 nm and an emission wavelength of 525 nm. The experimental results were analyzed using FlowJo software version 10.8.1.
The alterations in the mitochondrial MPTP were identified using a laser confocal microscope
Following the application instructions of the MPTP assay kit, 0.5 × 10⁶ cells were collected from each group. The cells were washed three times with PBS, then mixed with 500 µL of staining solution, and incubated in a culture incubator for 30 min. Subsequently, Hoechst 33342 staining solution (10 µg/mL) was added to the cells, which were then cultured in the dark for an additional 30 min. After washing the cells three times, they were resuspended in 500 µL of PBS. Each group of cells was then transferred to a specialized 20 mm culture dish for observation using laser confocal microscopy, where they were photographed.
Detection of LA content in cells
In accordance with the application instructions for the LA content detection kit, 1 × 10⁶ cells were cultured for 72 h. Subsequently, 50 µL of supernatant was collected from each group and mixed with 500 µL of extraction solution I. The resulting mixture was centrifuged at 4 °C and 12,000 g for 10 min to obtain the supernatant. Next, 15 µL of extraction solution II was added to 80 µL of the supernatant, and the mixture was centrifuged again at 4 °C and 12,000 g for 10 min, after which the supernatant was collected for testing. The absorbance at 570 nm was measured using an Infinite M Plex (TECAN) plate reader. The LA content was analyzed according to the calculation formula provided in the reagent manual.
Extracellular OCR assay
According to the application instructions for the extracellular OCR plate assay kit, 0.5 × 10⁶ cells were utilized for each group. Following the prescribed procedure, the assay was performed at 10-min intervals over a duration of 200 min using the continuous reading mode of the enzyme marker. The OCR values were calculated by inputting the fluorescence intensity into the provided automatic calculation form.
Detection of ATP content in cells
In accordance with the instructions provided in the ATP assay kit, 0.5 × 10⁶ cells were collected from each group, followed by the addition of 400 µL of lysis solution. After centrifugation at 4 °C and 12,000 g for 5 min, the supernatant was collected for subsequent detection. The ATP working solution was prepared in an ice bath, and 100 µL of this solution was added to each well of a 96-well opaque white plate, allowing it to incubate for 3 min. Subsequently, 20 µL of the test sample was added into each well, followed by rapid mixing, and the relative light units (RLU) value was measured using a chemiluminescence instrument. Concurrently, the protein concentration of each group was assessed. The ATP content was calculated based on the formula provided in the reagent manual.
Statistical analysis
All statistical analyses of the experimental data were performed using GraphPad Prism version 8.0.2. Measurement data are presented as mean ± standard deviation. One-way analysis of variance (ANOVA) was used for comparisons among multiple groups, whereas a t-test was applied for comparisons between two groups. A significance level of P < 0.05 was deemed statistically significant.
| Results | ▴Top |
The differentially expressed UCP2 in ML patients and cell lines
Differential expression of UCP2 mRNA in clinical patients with ML
To investigate the variances in UCP2 expression in ML, bone marrow samples were subjected to qRT-PCR analysis. The findings indicated that, compared to the control group (n = 10), UCP2 mRNA expression in the AML group (n = 25) significantly increased in 14 cases, decreased in seven cases, and remained unchanged in four cases. In the CML group (n = 22), UCP2 mRNA expression notably increased in 14 cases, decreased in five cases, and showed no significant change in three cases. These results demonstrate the differential expression of UCP2 mRNA in ML patients (Table 3).
Click to view |
Table 3. The Expression of UCP2 mRNA in ML
Patients |
Expression level of UCP2 in K562 cells
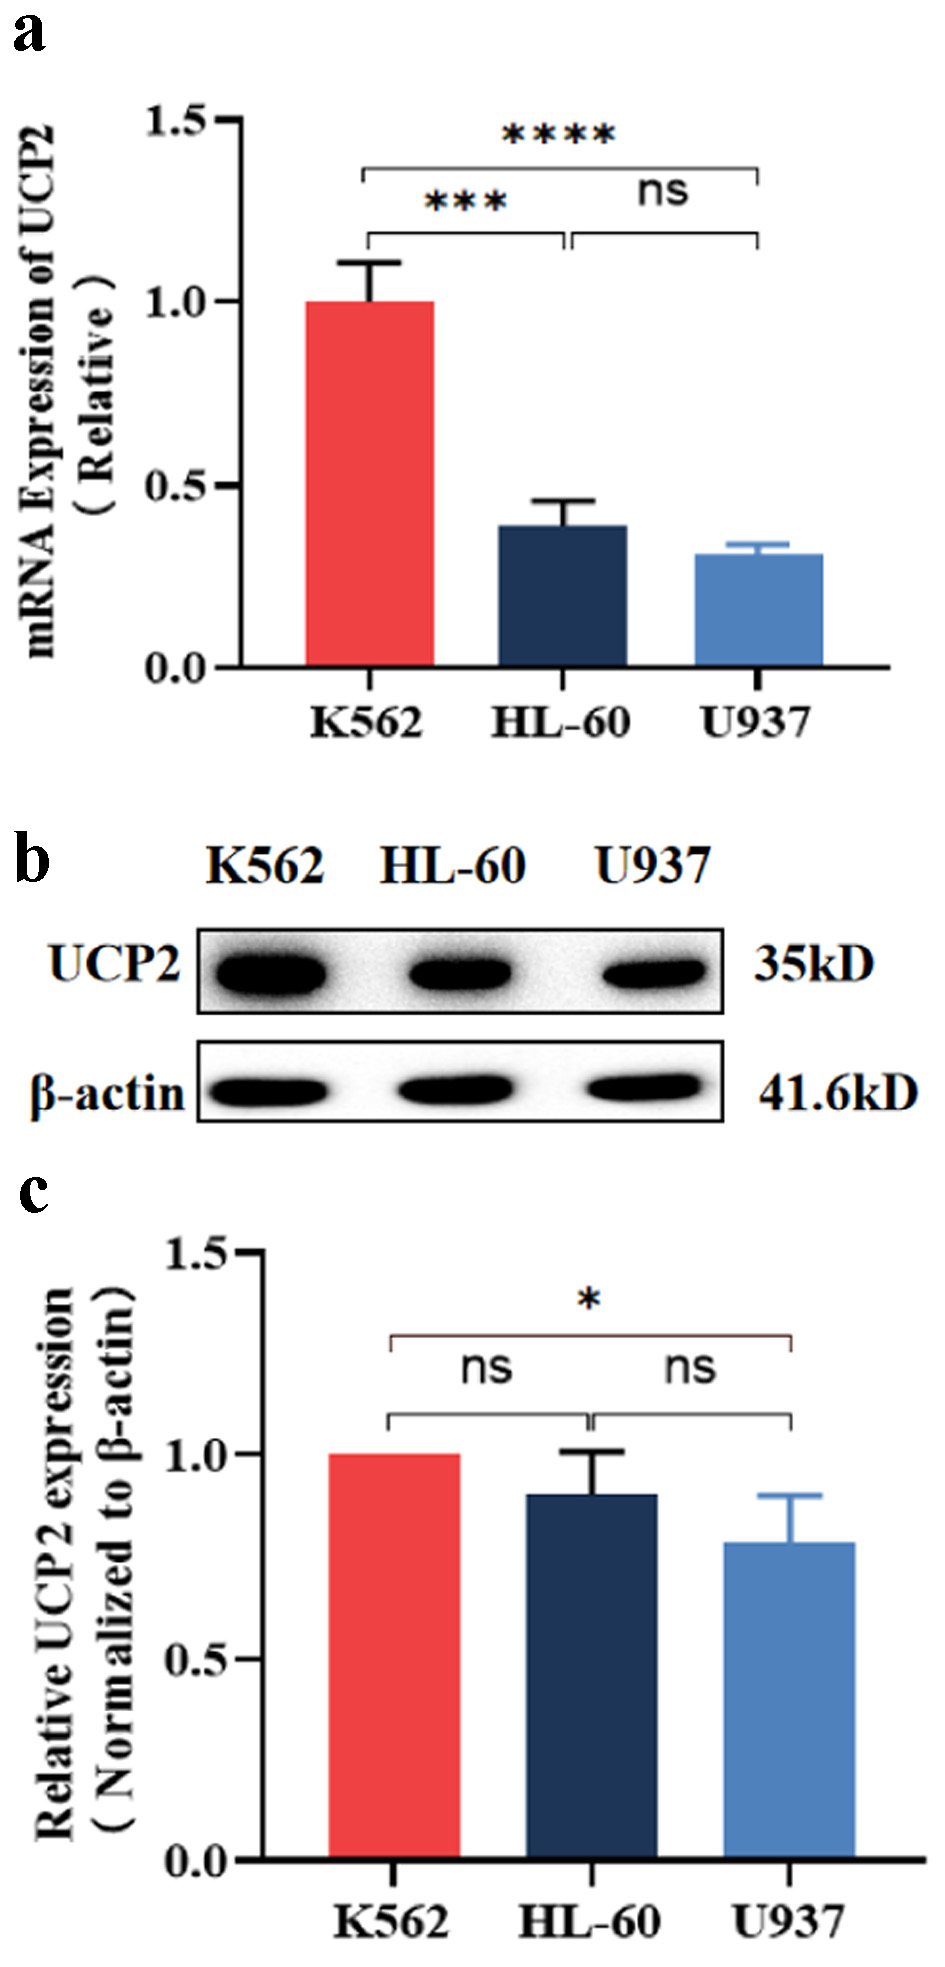
The mRNA and protein expression levels of UCP2 in ML cell lines (K562, HL-60, and U937) were assessed using qRT-PCR and western blot. The results demonstrated that the UCP2 mRNA level in K562 cells was significantly higher than that in HL-60 (P < 0.001) and U937 (P < 0.0001) (Fig. 1a). Additionally, the UCP2 protein level in K562 cells was higher than that in HL-60 cells (P > 0.05) and significantly higher than that in U937 cells (P < 0.05) (Fig. 1b, c). The highest expression levels of both UCP2 mRNA and protein were observed in K562 cells. Consequently, only K562 cells were utilized in the subsequent experiments.
 Click for large image |
Figure 1. Expression of UCP2 in ML cell lines. (a) Expression levels of UCP2 mRNA in K562, HL-60, and U937. Western blot bands (b) analysis of UCP2 protein expression levels (c) in K562, HL-60, and U937. Data were presented as mean ± SD of the relative changes (n = 3). *P < 0.05, **P < 0.01, ***P < 0.001, ****P < 0.0001, ns: no significant P > 0.05. ML: myeloid leukemia; UCP2: uncoupling protein 2; SD: standard deviation. |
GEN inhibited proliferation and facilitated the differentiation in K562 cells
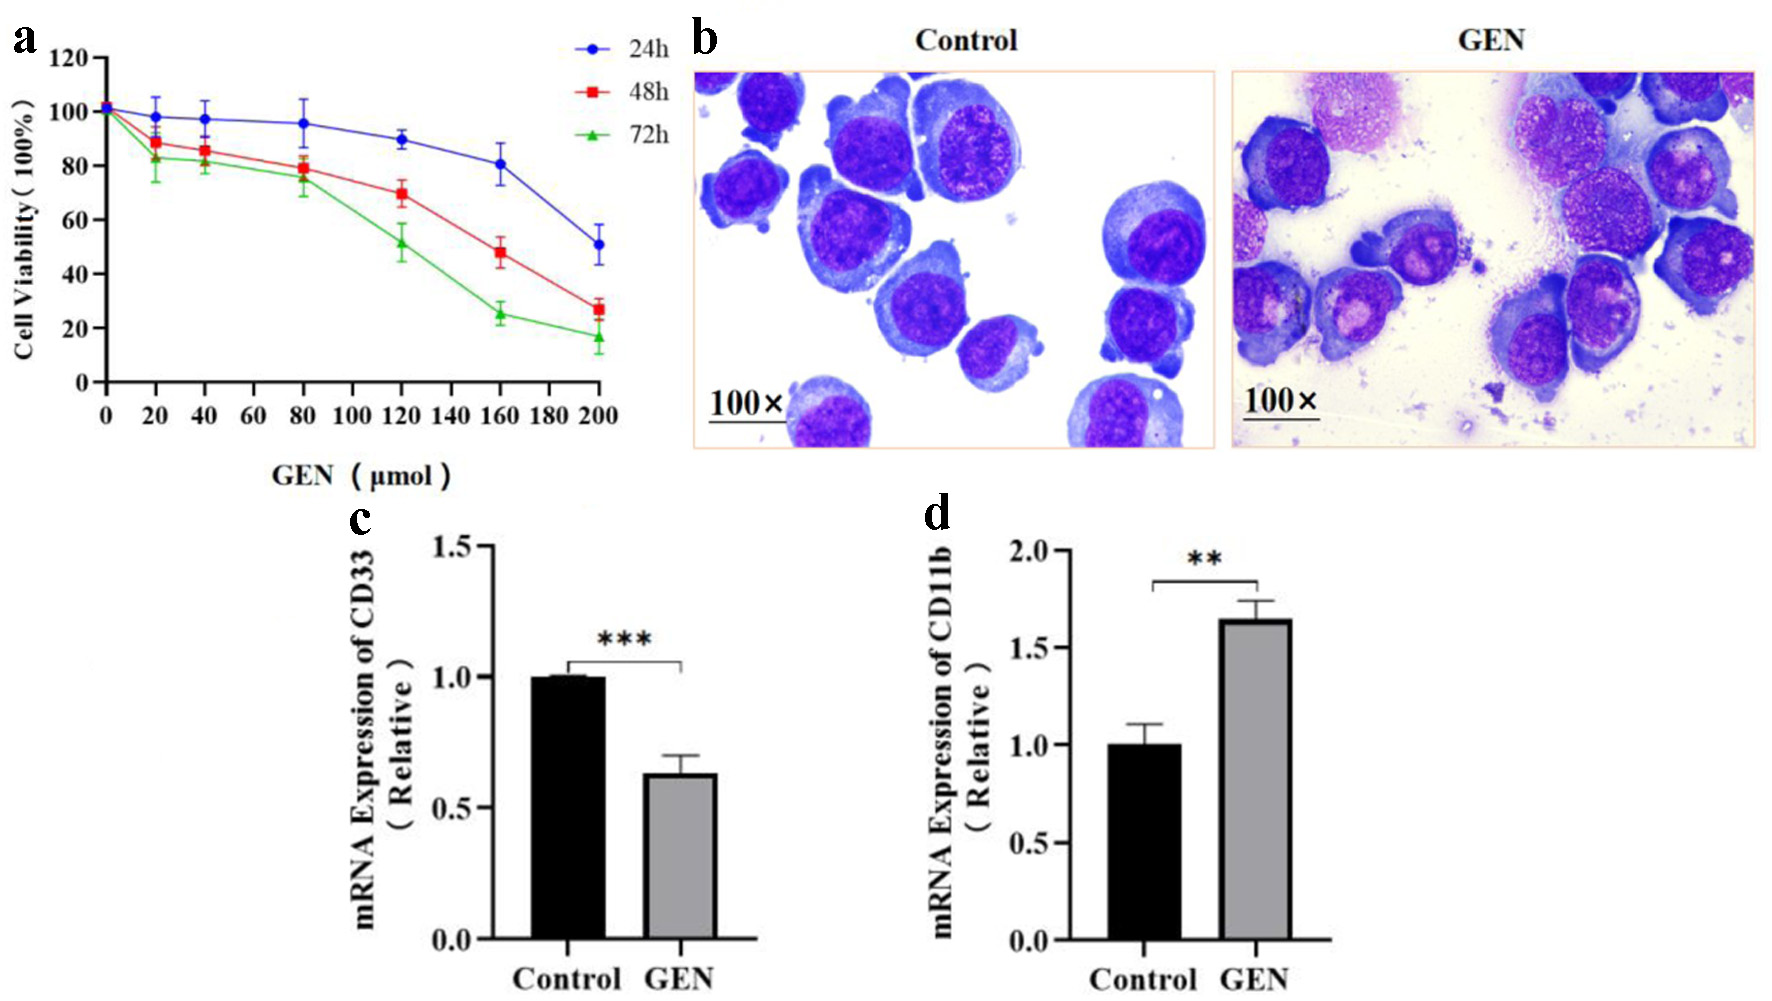
The effects of various concentrations of GEN (20, 40, 80, 120, 160, and 200 µmol/L) on the proliferation of K562 cells were assessed at different time points by the CCK-8 method. The results indicated that, compared to the control group, K562 cell viability decreased by 3.15%, 3.96%, 5.50%, 11.52%, 20.58%, and 50.33% after 24 h of GEN treatment; by 13.10%, 16.09%, 22.54%, 31.97%, 53.66%, and 74.66% after 48 h; and by 17.92%, 19.25%, 25.23%, 49.25%, 75.42%, and 83.94% after 72 h of treatment (Fig. 2a). The calculated half maximal inhibitory concentration (IC50) values at 24, 48, and 72 h were 204, 149, and 112 µmol/L, respectively.
 Click for large image |
Figure 2. The effect of GEN on the proliferation and differentiation of K562 cells. (a) Cell proliferation was evaluated after treatment with various concentrations of GEN (0, 20, 40, 80, 120, 160, and 200 µmol/L) in K562 cells, utilizing the CCK-8 assay. (b) Cell morphology was observed through Wright-Giemsa staining. The mRNA expression levels of CD33 (c) and CD11b (d) were assessed in K562 cells treated with 112 µmol/L GEN for 72 h. Data were presented as mean ± SD of the relative changes (n = 3). **P < 0.01, ***P < 0.001. CCK-8: cell counting kit-8; GEN: genipin; SD: standard deviation. |
The effect of GEN on K562 cell differentiation was assessed through Wright-Giemsa staining. The results revealed that K562 cells in the control group displayed larger cell sizes, prominent nuclei, a high nucleoplasmic ratio, strongly basophilic cytoplasm, and an absence of distinct granules. In contrast, the experimental group exhibited no reduction in cell volume, a slight decrease in nucleus diameter, diminished cytoplasmic basophilicity, a modest increase in cytoplasmic volume, a reduced nucleoplasmic ratio, the presence of cytoplasmic granules, and a transition in nuclear chromatin from fine to rough, indicative of morphological characteristics associated with differentiation towards a mature stage (Fig. 2b). The expression of cell surface differentiation antigens was analyzed using qRT-PCR. The findings indicated that, relative to the control group, the experimental group demonstrated a significant decrease in CD33 mRNA expression levels (Fig. 2c) and a significant increase in CD11b mRNA expression levels (Fig. 2d).
Apoptosis was promoted by GEN in K562 cells
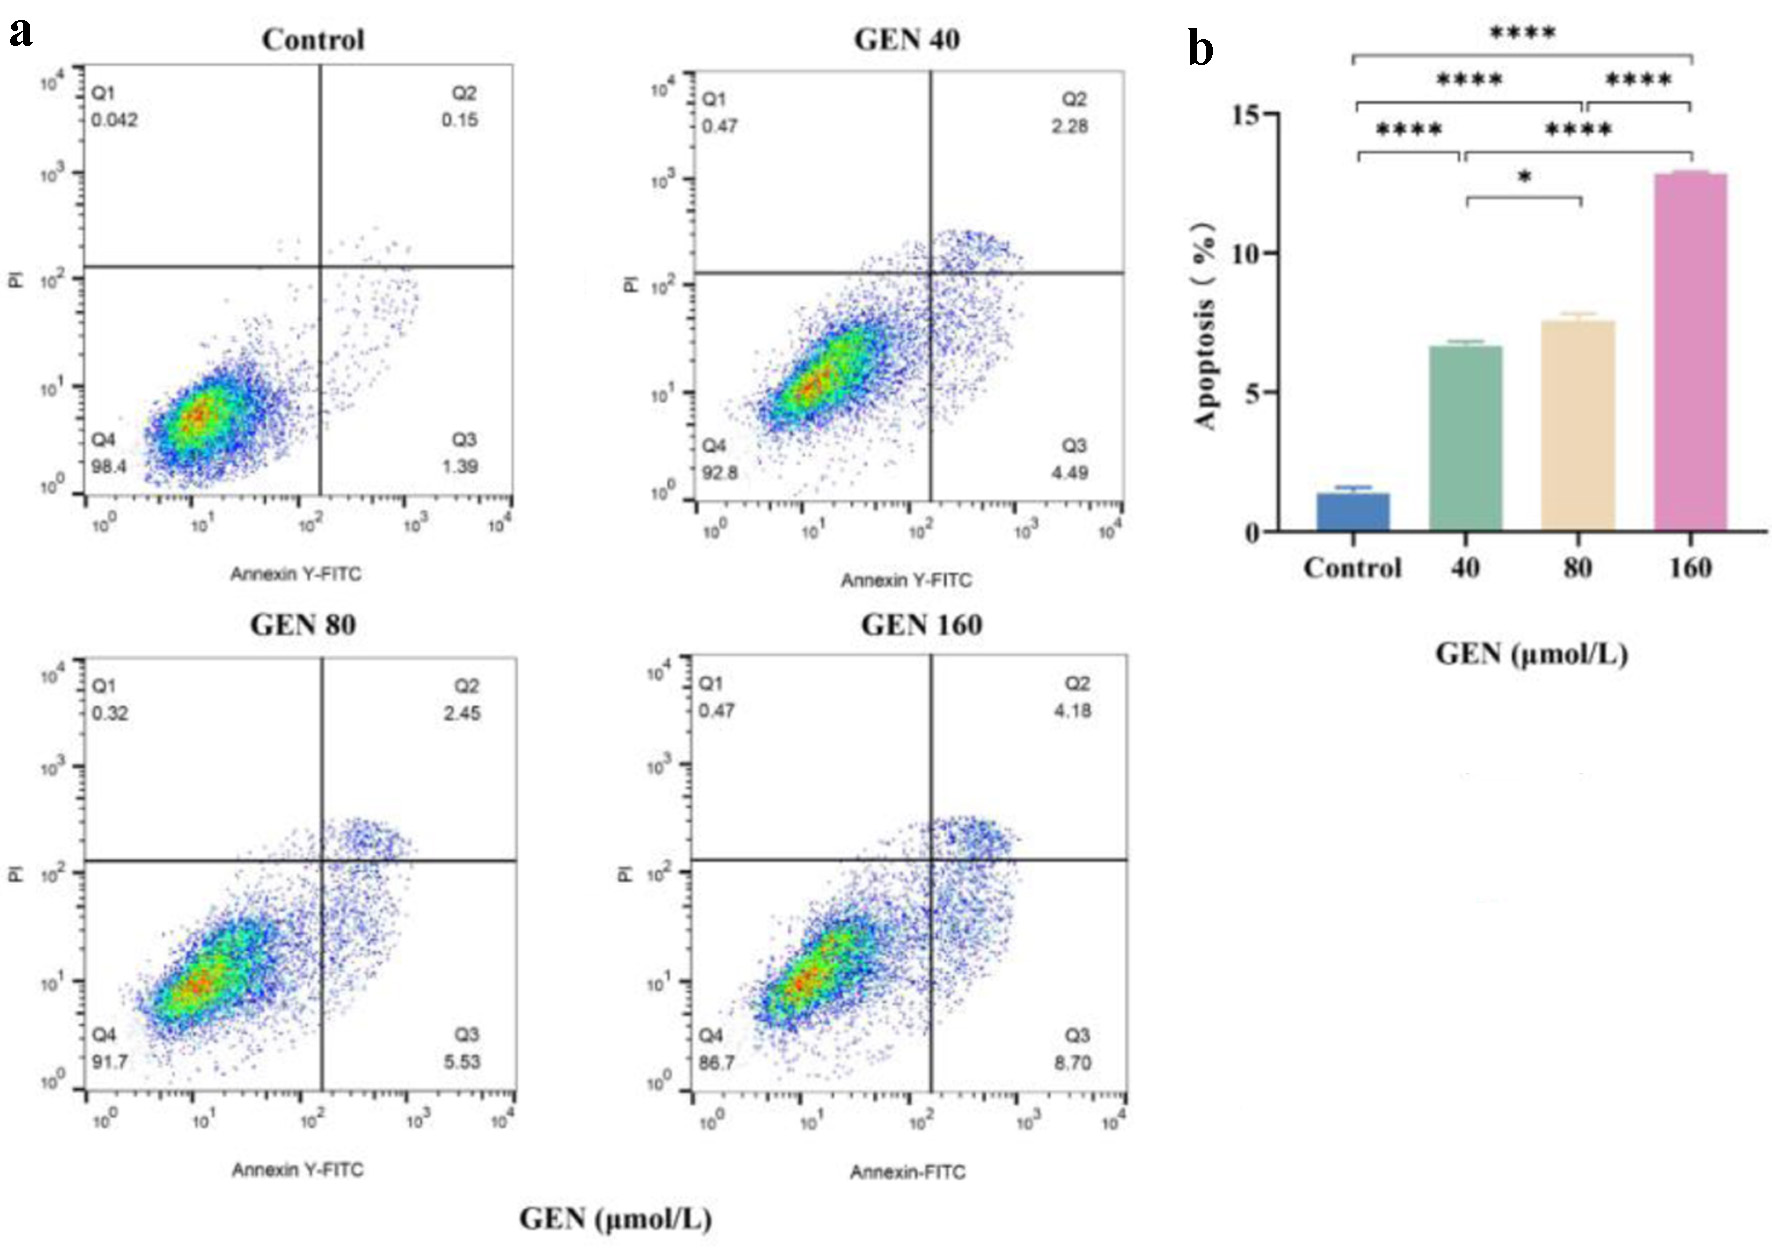
The effects of varying concentrations of GEN (40, 80, and 160 µmol/L) on the apoptosis of K562 cells were assessed using flow cytometry. The results indicated that, compared to the control group, concentrations of 40 µmol/L (P < 0.0001), 80 µmol/L (P < 0.0001), and 160 µmol/L (P < 0.0001) of GEN significantly promoted apoptosis in K562 cells (Fig. 3).
 Click for large image |
Figure 3. The promoting effect of GEN on apoptosis of K562 cells. (a) Flow cytometry analysis was conducted to assess the promotion of apoptosis in K562 cells after 72 h of treatment with 40, 80, and 160 µmol/L of GEN. (b) Column analysis of the promotion of apoptosis in K562 cells after 72 h of treatment with 40, 80, and 160 µmol/L of GEN. All data were presented as mean ± SD of the relative changes (n = 3). *P < 0.05, **P < 0.01, ***P < 0.001, ****P < 0.0001. GEN: genipin; SD: standard deviation. |
UCP2 mRNA and protein expression inhibited by GEN in K562 cells
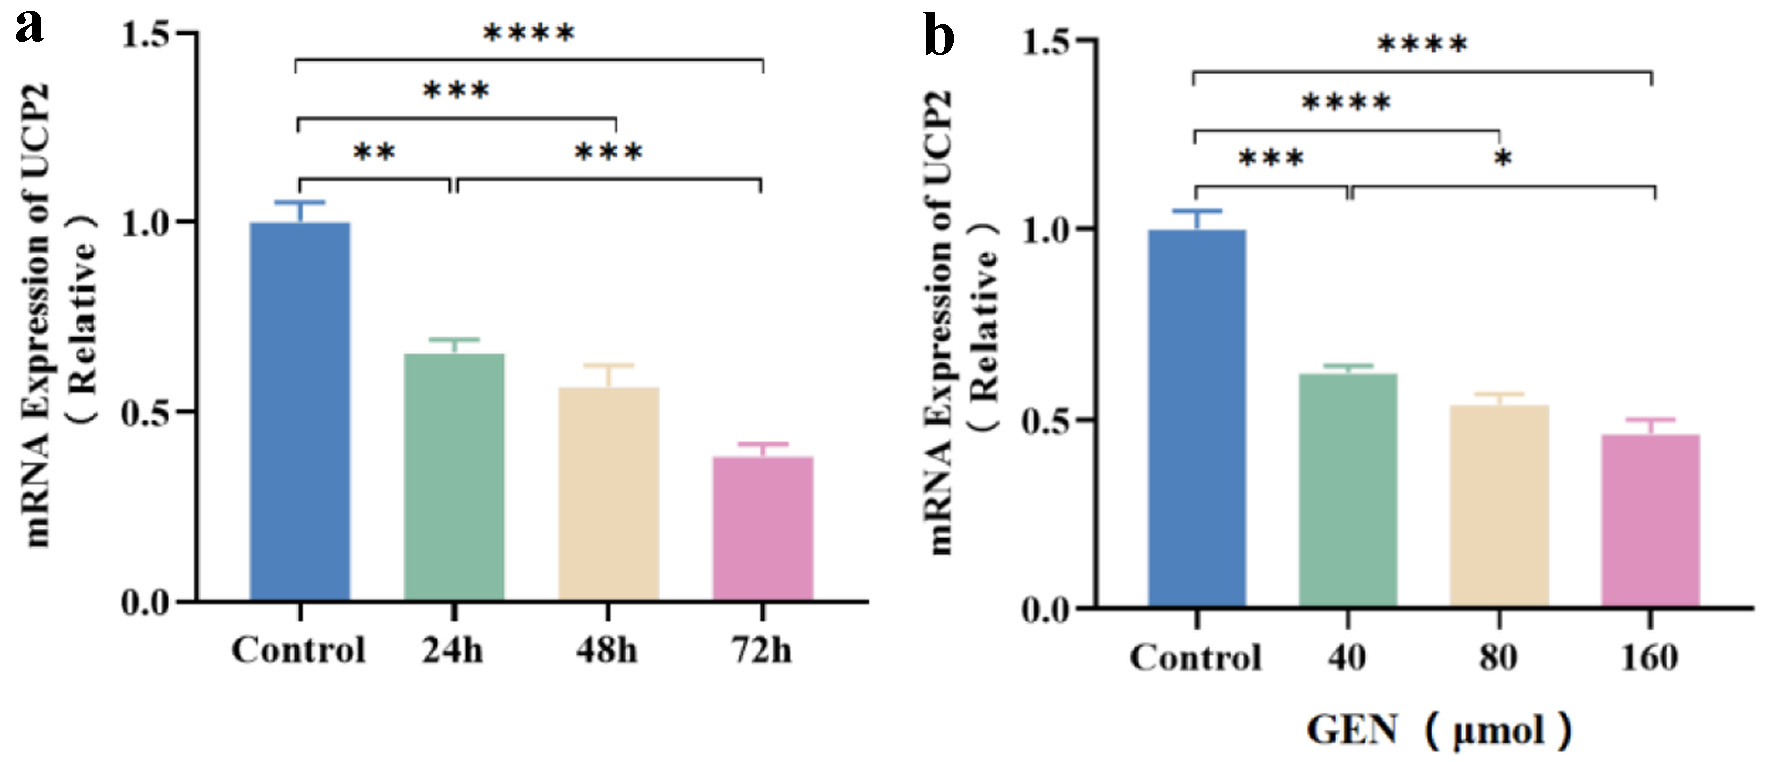
The expression level of UCP2 mRNA was assessed in K562 cells following GEN treatment using qRT-PCR. Compared to the control group, K562 cells treated with 160 µmol/L GEN exhibited a significant reduction in UCP2 mRNA expression levels at 24 h (P < 0.01), 48 h (P < 0.001), and 72 h (P < 0.0001) (Fig. 4a). Additionally, when compared to the control group, UCP2 mRNA expression levels in K562 cells were markedly suppressed by 40 µmol/L (P < 0.001), 80 µmol/L (P < 0.0001), and 160 µmol/L (P < 0.0001) of GEN at 72 h (Fig. 4b).
 Click for large image |
Figure 4. The expression level of UCP2 mRNA in K562 cells is inhibited by GEN. Relative expression levels of UCP2 mRNA in K562 cells treated with 160 µmol/L GEN at 24, 48, and 72 h (a). Relative expression levels of UCP2 mRNA in K562 cells treated with GEN at different concentrations (40, 80, and 160 µmol/L) for 72 h (B). All data were presented as mean ± SD of the relative changes (n = 3). *P < 0.05, **P < 0.01, ***P < 0.001, ****P < 0.0001. GEN: genipin; SD: standard deviation; UCP2: uncoupling protein 2. |
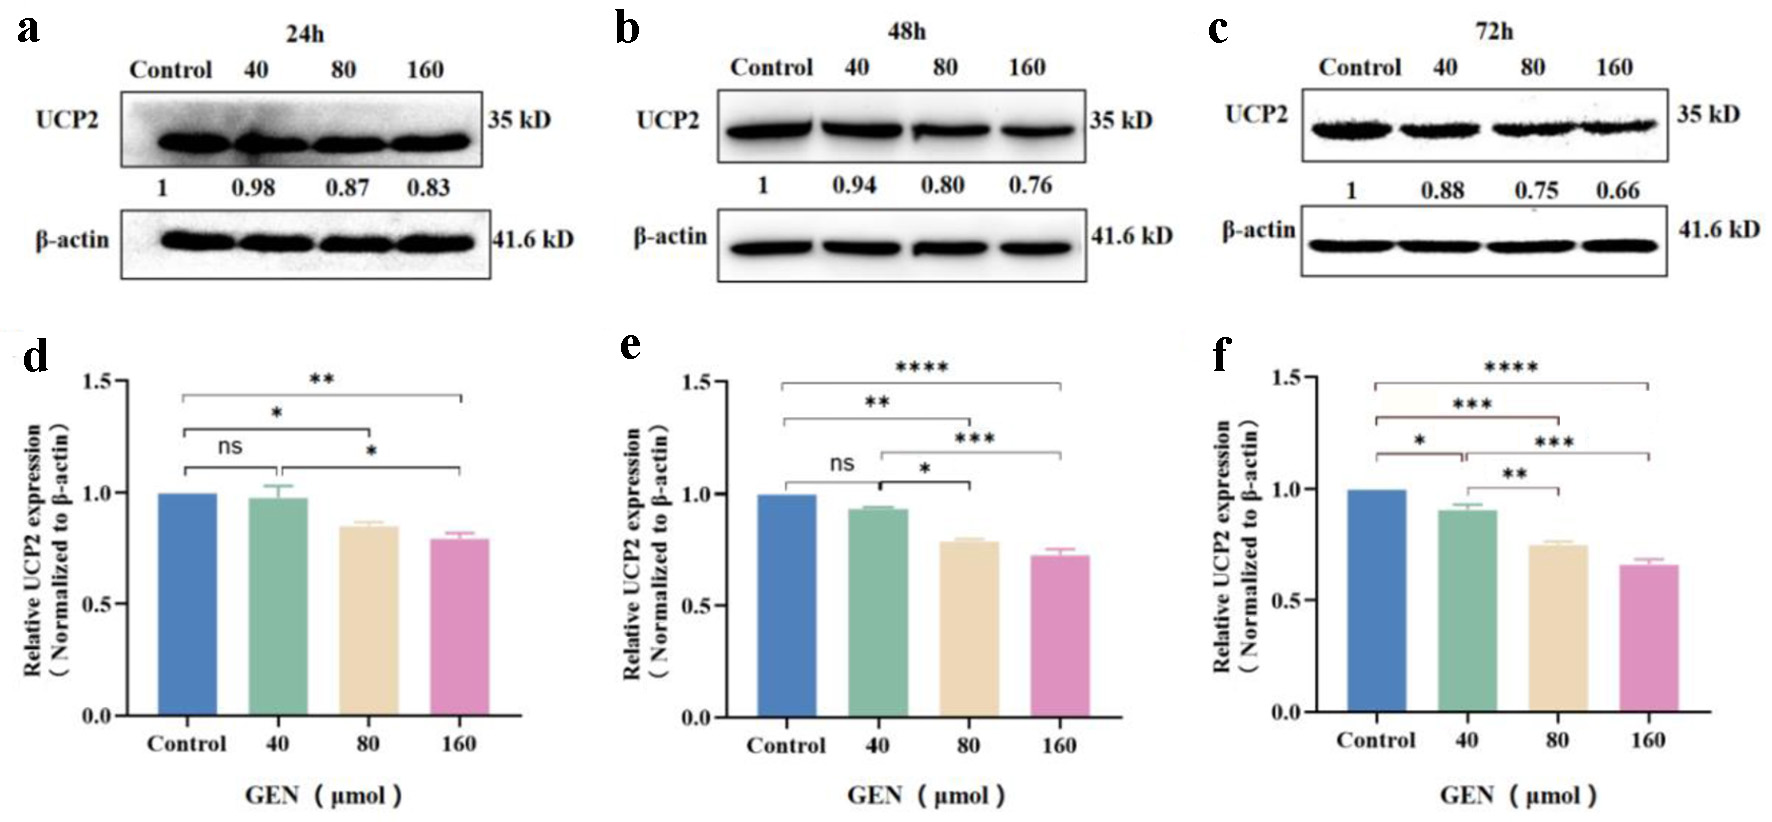
The expression level of the UCP2 protein was detected in K562 cells following treatment with various concentrations of GEN (40, 80, and 160 µmol/L) using western blot analysis. Compared to the control group, the expression level of UCP2 protein in K562 cells was significantly reduced at 24 h with 80 µmol/L (P < 0.05) and 160 µmol/L (P < 0.01) of GEN (Fig. 5a, d). At 48 h, the expression level of UCP2 protein was significantly decreased with 80 µmol/L (P < 0.01), and 160 µmol/L (P < 0.0001) of GEN (Fig. 5b, e). At 72 h, the expression levels of UCP2 protein in K562 cells were markedly suppressed by 40 µmol/L (P < 0.05), 80 µmol/L (P < 0.001), and 160 µmol/L (P < 0.0001) of GEN (Fig. 5c, f). The inhibitory effect of GEN on UCP2 protein expression in K562 cells increased with higher concentrations at 24, 48, and 72 h. These findings suggest that the expression level of UCP2 protein in K562 cells is inhibited in a concentration-dependent manner.
 Click for large image |
Figure 5. The expression level of UCP2 protein in K562 cells was inhibited in a concentration-dependent manner. Western blot analysis of UCP2 protein expression levels in K562 cells treated with various concentrations of GEN (40, 80, and 160 µmol/L) for 24 h (a), 48 h (b), and 72 h (c). Grayscale analysis bar chart depicting the expression levels of UCP2 protein in K562 cells treated with GEN at different concentrations for 24 h (d), 48 h (e), and 72 h (f). All data were presented as mean ± SD of the relative changes (n = 3). *P < 0.05, **P < 0.01, ***P < 0.001, ****P < 0.0001, ns: no significant P > 0.05. GEN: genipin; SD: standard deviation; UCP2: uncoupling protein 2. |
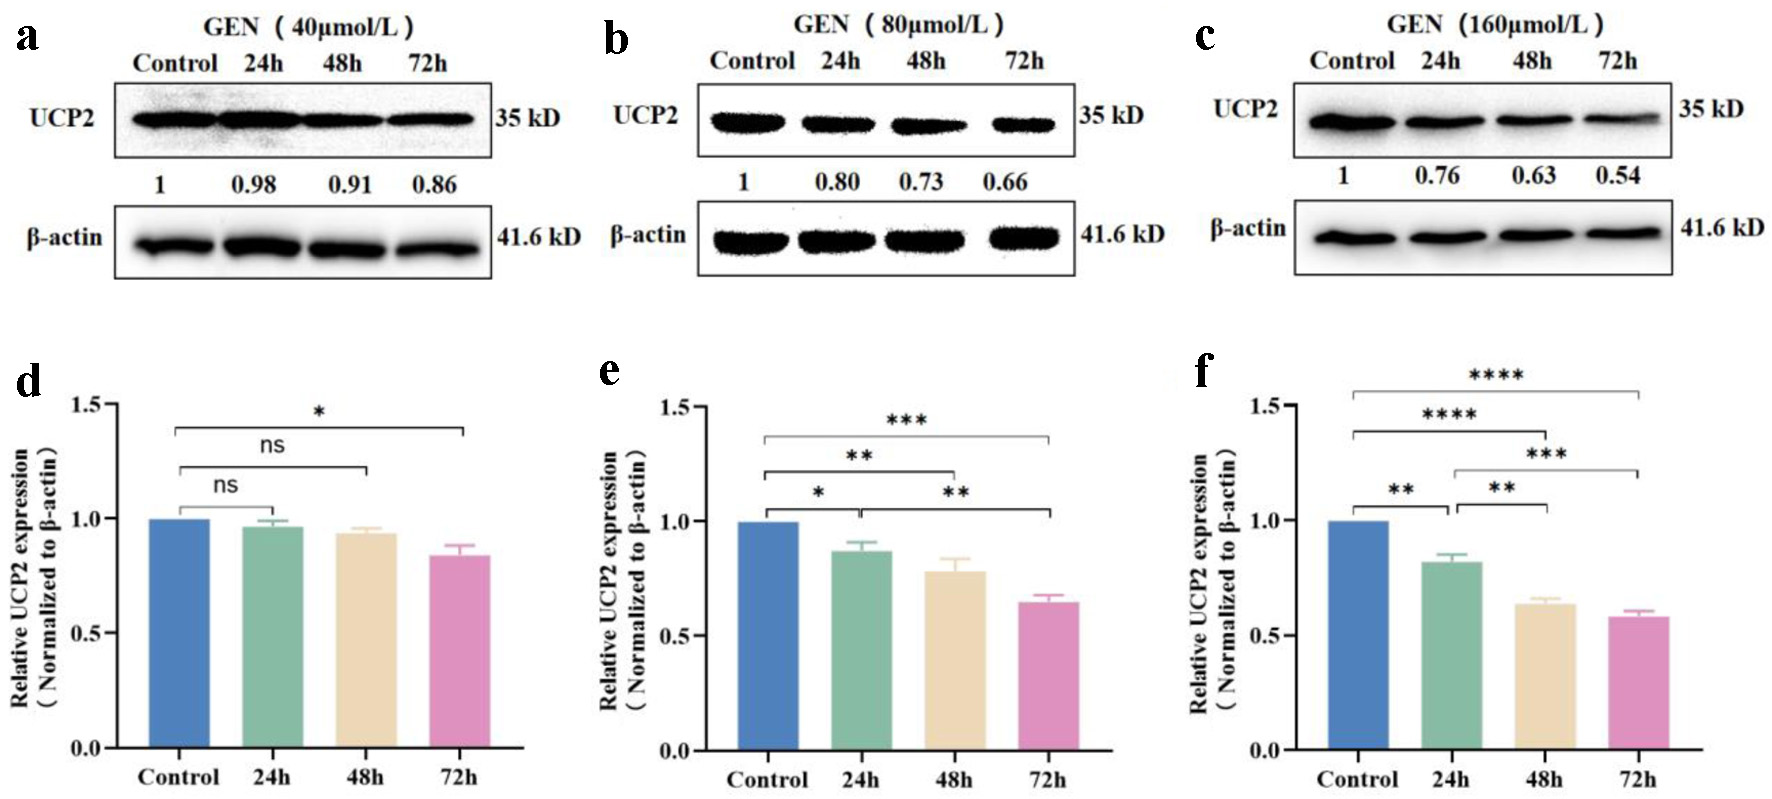
The expression level of the UCP2 protein was assessed in K562 cells following treatment with GEN at various time points (24, 48, and 72 h) using western blot analysis. Compared to the control group, which was treated with 40 µmol/L GEN, the expression levels of UCP2 protein in K562 cells were significantly inhibited at 72 h (P < 0.05) (Fig. 6a, d). In cells treated with 80 µmol/L GEN, significant inhibition of UCP2 protein expression was observed at 24 h (P < 0.05), 48 h (P < 0.01), and 72 h (P < 0.001) (Fig. 6b, e). Furthermore, in cells treated with 160 µmol/L GEN, the expression levels of UCP2 protein were significantly reduced at 24 h (P < 0.01), 48 h (P < 0.0001), and 72 h (P < 0.0001) (Fig. 6c, f). The inhibitory effect of GEN on UCP2 protein expression in K562 cells increased over time at concentrations of 40, 80, and 160 µmol/L. These findings suggest that the expression level of UCP2 protein is inhibited by GEN in a time-dependent manner in K562 cells.
 Click for large image |
Figure 6. The expression level of UCP2 protein in K562 cells was inhibited in a time-dependent manner. Western blot analysis indicated that GEN at concentrations of 40 µmol/L (a), 80 µmol/L (b), and 160 µmol/L (c) suppressed UCP2 protein expression levels in K562 cells at 24, 48, and 72 h. Grayscale analysis bar chart of GEN at 40 µmol/L (d), 80 µmol/L (e), and 160 µmol/L (f) inhibiting UCP2 protein expression levels in K562 cells at 24, 48, and 72 h. All data were presented as mean ± SD of the relative changes (n = 3). *P < 0.05, **P < 0.01, ***P < 0.001, ****P < 0.0001, ns, no significant P > 0.05. GEN: genipin; SD: standard deviation; UCP2: uncoupling protein 2. |
Mitochondrial damage was induced by GEN in K562 cells
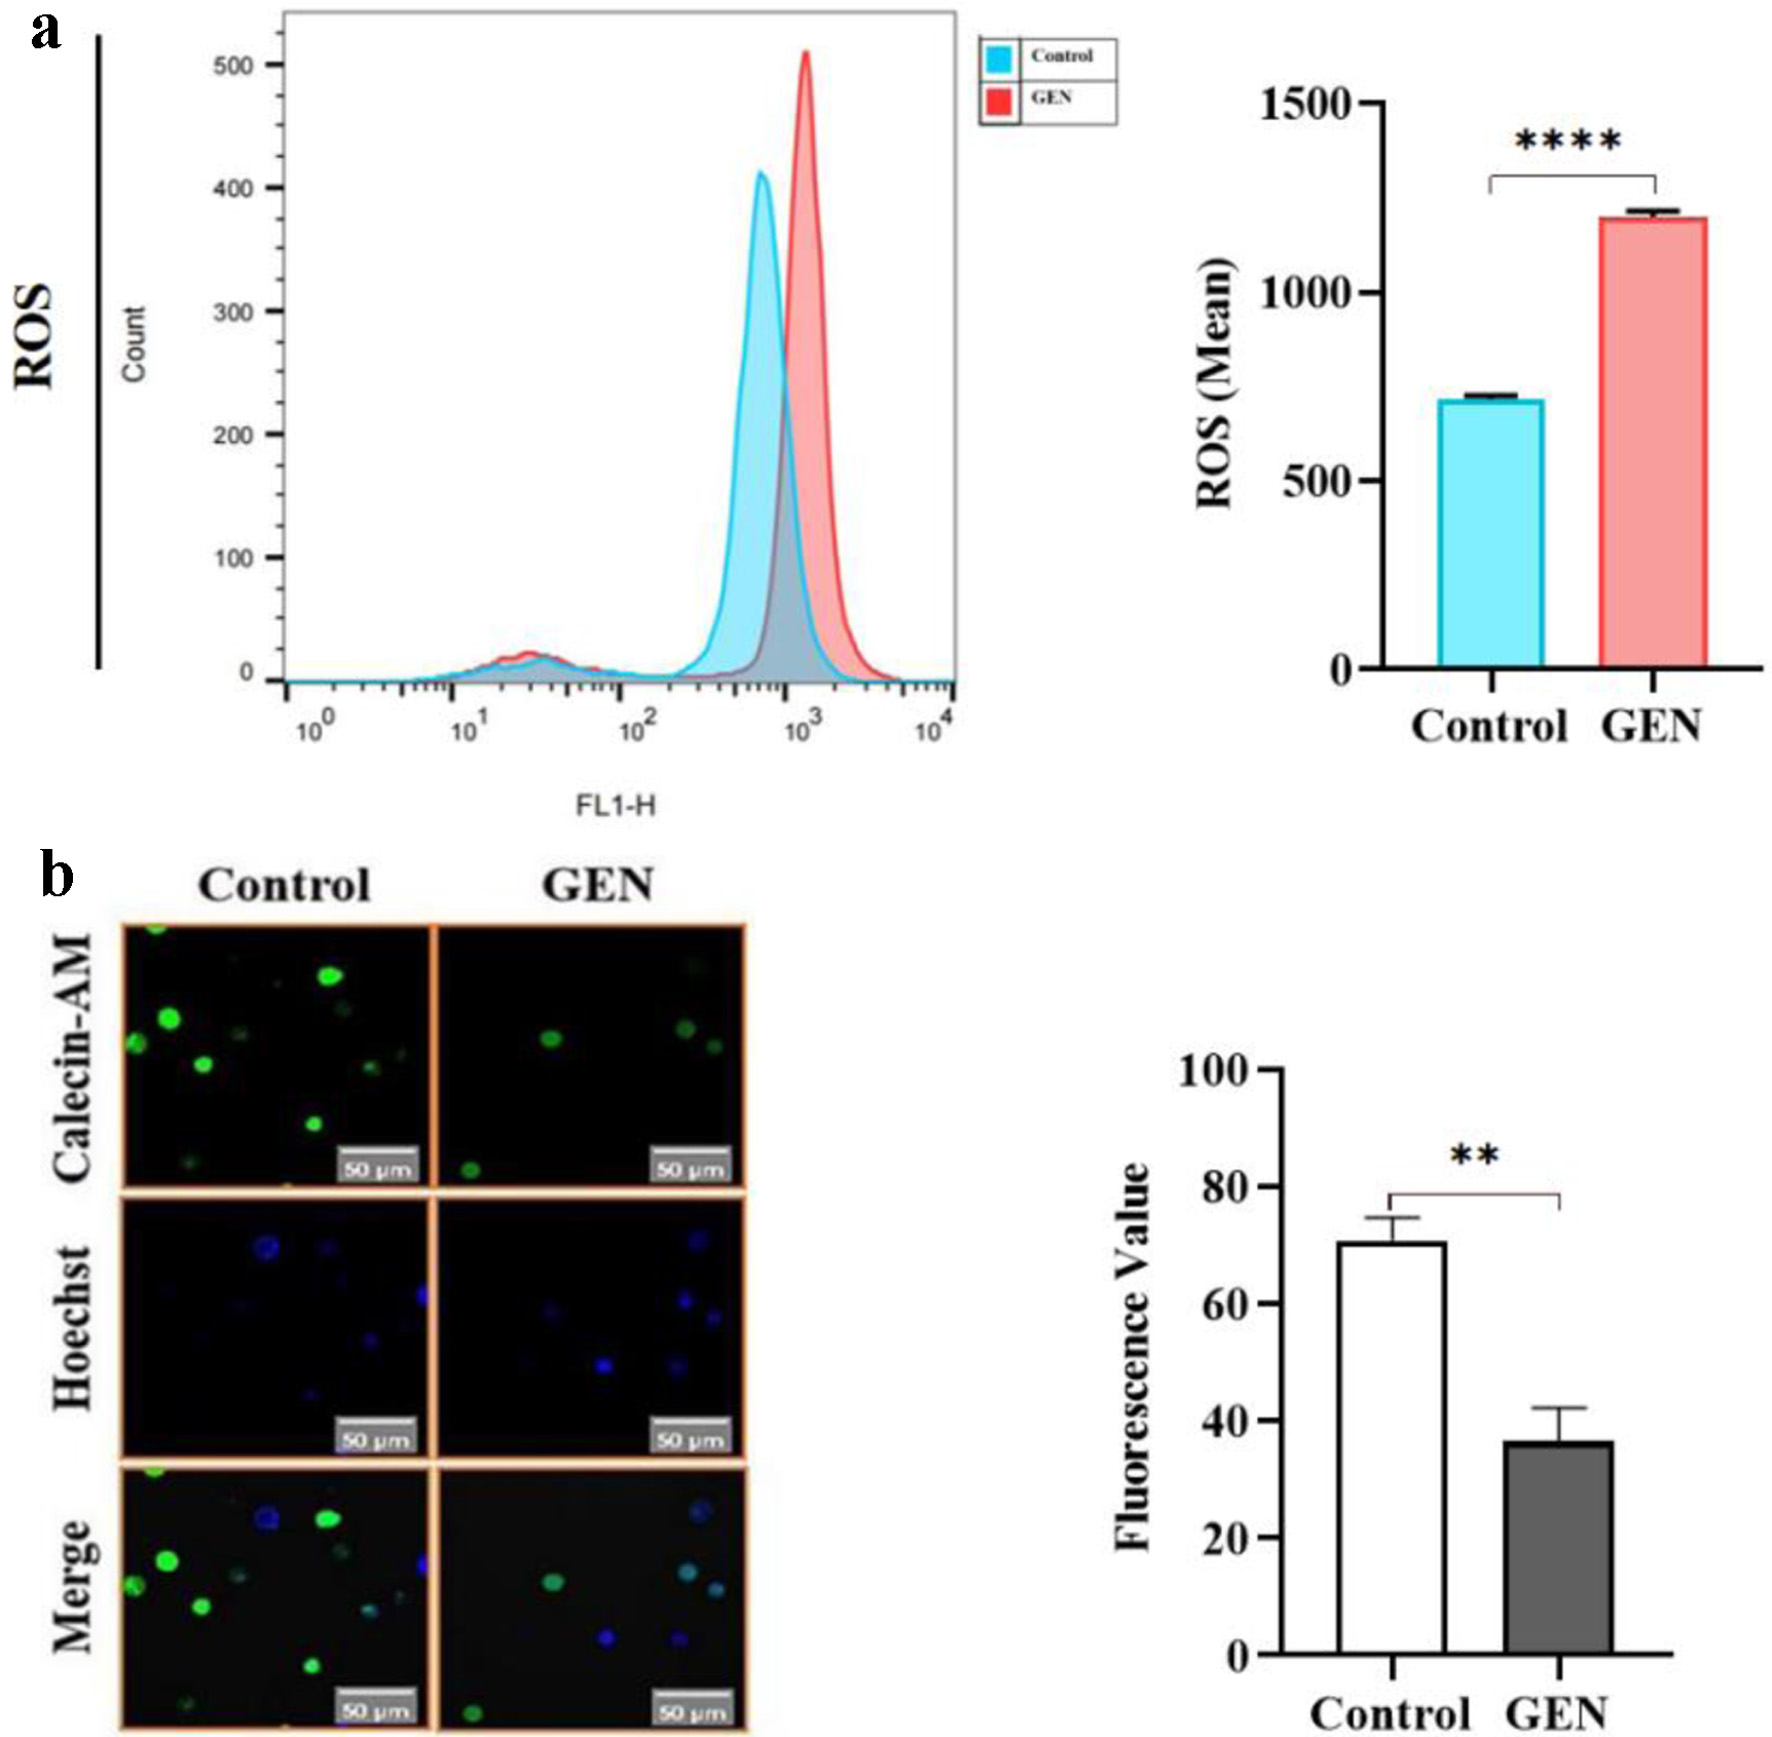
ROS content was detected in K562 cells treated with GEN using the DCFH-DA probe in combination with flow cytometry. The ROS levels significantly increased, measuring 1.68 times higher than those in the control group (P < 0.0001) in the experimental group (112 µmol/L) (Fig. 7a). This findings suggest that GEN induces oxidative stress in K562 cells. Additionally, green fluorescence intensity in K562 cells was observed using laser confocal microscopy. Focal microscopy was employed to analyze the influence of the MPTP following GEN treatment of K562 cells. A significant decrease in green fluorescence intensity was noted in the experimental group (112 µmol/L) compared to the control group (0 µmol/L) (P < 0.01). This decrease indicates an enhancement in MPTP activity (Fig. 7b) and suggests that GEN promotes the opening of the MPTP, resulting in impaired mitochondrial function in K562 cells.
 Click for large image |
Figure 7. GEN induces mitochondrial damage in K562 cells. (a) Promotion of ROS generation by GEN in K562 cells. (b) Promotion of MPTP by GEN in K562 cells. All data were presented as mean ± SD of the relative changes (n = 3). **P < 0.01, ****P < 0.0001. GEN: genipin; MPTP: membrane permeability transition pore; ROS: reactive oxygen species; SD: standard deviation. |
Aerobic glycolysis was inhibited by GEN in K562 cells
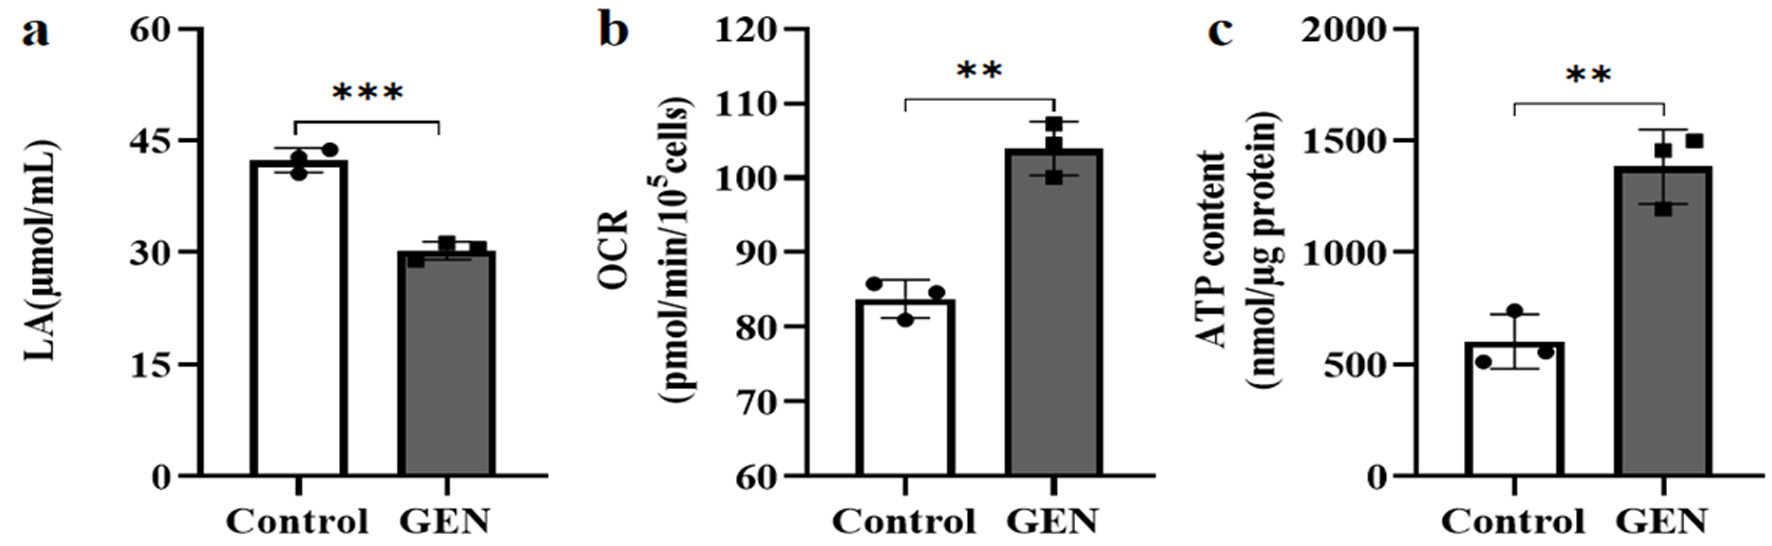
The levels of LA, OCR, and ATP in K562 cells were assessed using assay kits. Compared to the control group, the production of LA was significantly reduced by 28.6% (P < 0.001) in the experimental group (Fig. 8a). In contrast, the OCR and ATP results indicated that, compared to the control group, OCR and ATP content increased by 24.0% (P < 0.01) (Fig. 8b) and 129.5% (P < 0.01) (Fig. 8c) in the experimental group, respectively. These findings suggest that glycolytic capacity was significantly diminished, and metabolic remodeling towards oxidative phosphorylation was induced by the repression of UCP2 expression in K562 cells.
 Click for large image |
Figure 8. The effect of GEN on the energy metabolism pathway of K562 cells. (a) GEN inhibits LA production. (b) GEN increases oxygen consumption. (c) GEN promotes ATP production. The control group was cultured under normal conditions. The experimental group was treated with 112 µmol/L GEN. All data were presented as mean ± SD of the relative changes (n = 3). **P < 0.01, ***P < 0.001. ATP: adenosine triphosphate; GEN: genipin; SD: standard deviation. |
| Discussion | ▴Top |
Tumor cells encounter significant metabolic challenges throughout their formation, growth, metastasis, and response to chemotherapy [21]. Recent studies have increasingly demonstrated that redox homeostasis and energy metabolism are vital in the onset and progression of CML [22]. In this context, UCP2 plays a critical role in regulating both redox homeostasis and energy metabolism [13]. GEN, a specific inhibitor of UCP2, has exhibited inhibitory effects on various leukemia cell lines [18, 19]. However, the precise role and mechanisms by which UCP2 mediates the effects of GEN on leukemia cells remain to be elucidated. In this study, we observed differential expression of UCP2 in ML patients and further investigated the effects and underlying mechanisms of the UCP2 inhibitor GEN on the proliferation and mitochondrial damage of K562 cells. Our findings revealed that the expression level of UCP2 mRNA and protein significantly decreased following treatment with varying concentration of GEN, with this decrease showing a negative correlation to the treatment concentration. The results from the CCK-8 assay indicated that as the concentration of GEN increased, the proliferation of K562 cells was progressively inhibited, with a more pronounced inhibitory effect observed in the medium and high concentration. Moreover, both the relative expression levels of UCP2 protein and mRNA in K562 cells decreased in correlation with increasing concentrations and duration of GEN treatment.
With an enhanced understanding of leukemia, it is now recognized that inducing differentiation of leukemia cells into relatively mature cells can significantly alleviate symptoms and potentially improve the cure rate for leukemia patients [23]. Researchers have demonstrated that K562 cells possess the ability to differentiate into multiple lineages, including erythroid, granulocyte, monocyte, and megakaryocyte, under the influence of various inducers, exhibiting corresponding maturation markers [24, 25]. Li et al [26] found that the expression level of UCP2 protein increased when K562 cells differentiated into erythroid lineages, while it decreased during differentiation into megakaryoid lineages. This observation suggests that UCP2 may play a role in the differentiation process of K562 cells. Additionally, cell differentiation was assessed through Wright-Giemsa staining following treatment with GEN in K562 cells. The results indicated that K562 cells exhibited morphological characteristics indicative of differentiation towards a mature stage after GEN treatment. Recent studies have identified that CD33 and CD11b serve as crucial differentiation antigens for myeloid cells. CD33 exhibits strong expression during the early stages of myeloid blood cell differentiation, while being absent in mature granulocytes. The decline in CD33 expression can be utilized as an indicator for assessing cell differentiation and maturation [27]. Notably, CD11b is absent on the surface of promyelocytes, with its expression gradually increasing as primitive and immature cells undergo differentiation and maturation [28, 29]. Following GEN treatment of K562 cells, a significant decrease in CD33 mRNA expression was observed, accompanied by a notable increase in CD11b mRNA expression. These findings suggest that GEN facilitates the differentiation of K562 cells into the myeloid lineage.
Currently, it is widely recognized that ROS play a crucial role in promoting tumor development, facilitating tumor progression, and contributing to drug resistance. Additionally, ROS are involved in regulating signaling pathways in leukemia cells. Notably, the baseline level of ROS in leukemia cells is higher than that in normal cells. Significant alterations in the expression and function of antioxidant enzymes are key mechanisms that lead to elevated ROS levels in leukemia cells [30]. Excessive concentrations of ROS can cause cytotoxicity and oxidative damage, and a marked increase in oxidative damage may also trigger programmed cell death. The knockdown of UCP2 inhibits tumor migration, invasiveness, clonality, and proliferation, while promoting apoptosis through ROS mediation [31]. This study demonstrated that GEN promotes the generation of ROS and induces oxidative stress damage in K562 cells. Furthermore, the study revealed a decrease in the calcium xanthophyll ratio, the opening of the MPTP, and impaired mitochondrial function in K562 cells treated with GEN. It was also observed that the rate of apoptosis in GEN-treated K562 cells increased with higher concentrations of GEN.
The Warburg effect is recognized as one of the metabolic hallmarks of tumor cells. In this phenomenon, energy production in the Warburg effect occurs through the abandonment of oxidative phosphorylation in favor of glycolysis. This may provide a more efficient means of generating metabolic intermediates that facilitate nucleotide proliferation and stimulate angiogenesis in a low-oxygen, acidic microenvironment [32]. Additionally, the increased expression of UCP2 in response to the accumulation of ROS in tumor cells promotes the evasion of apoptosis, further contributing to chemotherapy resistance and reinforcing the Warburg effect [17]. Research has shown that inhibiting glycolysis while activating oxidative phosphorylation can restore the normal metabolic phenotype after UCP2 knockout [33]. Currently, the Warburg effect presents a significant target for selective intervention in leukemia [34]. Test results indicated that the concentration of LA, the end product of aerobic glycolysis, was notably decreased by GEN in K562 cells. Elevated levels of UCP2 disrupt the mitochondrial respiratory chain’s oxidative phosphorylation through a proton leakage mechanism, leading to energy loss in the form of heat, which is inefficient for cellular function. Consequently, this results in reduced ATP synthesis [17].
This investigation demonstrated that the levels of OCR and ATP were significantly enhanced by GEN in K562 cells. Based on the cumulative research findings, it is suggested that GEN reverses or inhibits the Warburg effect in K562 cells, thereby inducing metabolic remodeling towards oxidative phosphorylation. This is consistent with reports from scholars indicating that the regulation of metabolic remodeling may offer a promising therapeutic strategy for CML [35].
In summary, GEN, as an UCP2 inhibitor, influences the redox capacity of K562 cells by inhibiting the expression levels of UCP2. This inhibition induces mitochondrial damage and metabolic remodeling, consequently suppressing the proliferation of K562 cells. But the role and associated mechanisms of UCP2 in the onset and progression of leukemia should be further investigated.
Acknowledgments
None to declare.
Financial Disclosure
This work was supported by the Foundation of Natural Science Foundation of Heilongjiang Province (No. LH2024H076), Heilongjiang Provincial Administration of Traditional Chinese Medicine (No. ZHY2024-286), Science and Technology Program Joint Guidance of Qiqihar (No. LSFGG-2023044 and 2023031), Project of Qiqihar Academy of Medical Sciences (No. QMSI2024M-11), Graduate Innovation Project (QYYCX2023-05), and Innovation and Entrepreneurship Training Program for College Students in Heilongjiang Province (No. S202311230031).
Conflict of Interest
The authors declare no conflict of interest.
Informed Consent
Not applicable.
Author Contributions
YL and HTY conceived and designed the study. YZ, RS and XYH performed the experiments. YZ, RS, ZWZ, XYH, LL, and CJZ collected the data and analyzed the data. YL and HTY drafted the manuscript and revised the manuscript. YZ and RS contributed equally to this work. All authors have read and approved the final manuscript.
Data Availability
The datasets used and/or analyzed during the current study are available from the corresponding author on reasonable request.
Abbreviations
CCK-8: cell counting kit-8; CML: chronic myeloid leukemia; DCFH-DA: 2,7-dichlorodihydrofluorescein diacetate; FITC: fluorescein isothiocyanate; GEN: genipin; LA: lactic acid; ML: myeloid leukemia; MPTP: membrane permeability transition pore; OCR: oxygen consumption rate; PI: propidium iodide; qRT-PCR: real-time quantitative reverse transcription PCR; RLU: relative light units; ROS: reactive oxygen species; TFR: treatment-free remission; TKIs: tyrosine kinase inhibitors; UCP2: uncoupling protein 2
| References | ▴Top |
- Dong C, Zhang NJ, Zhang LJ. Oxidative stress in leukemia and
antioxidant treatment. Chin Med J (Engl). 2021;134(16):1897-1907.
doi pubmed - Whiteley AE, Price TT, Cantelli G, Sipkins DA. Leukaemia: a
model metastatic disease. Nat Rev Cancer. 2021;21(7):461-475.
doi pubmed - Juliusson G, Hough R. Leukemia. Prog Tumor Res.
2016;43:87-100.
doi pubmed - Jabbour E, Kantarjian H. Chronic myeloid leukemia: 2020
update on diagnosis, therapy and monitoring. Am J Hematol.
2020;95(6):691-709.
doi pubmed - Liu Y, Jang H, Zhang M, Tsai CJ, Maloney R, Nussinov R. The
structural basis of BCR-ABL recruitment of GRB2 in chronic myelogenous leukemia.
Biophys J. 2022;121(12):2251-2265.
doi pubmed - Lak ER, Tamaddon G, Ramzi M, Ranjbaran R, Abedi E,
Sharifzadeh S. The mRNA expression of PTEN, LEF1, JAK3, LC3 and p62/SQSTM1 genes in patients
with chronic myeloid leukemia. Cardiovasc Hematol Agents Med Chem. 2023;21(1):67-76.
doi pubmed - Pan YL, Zeng SX, Hao RR, Liang MH, Shen ZR, Huang WH. The
progress of small-molecules and degraders against BCR-ABL for the treatment of CML.
Eur J Med Chem. 2022;238:114442.
doi pubmed - Osman AEG, Deininger MW. Chronic myeloid leukemia: modern
therapies, current challenges and future directions. Blood Rev. 2021;49:100825.
doi pubmed - Braun TP, Eide CA, Druker BJ. Response and Resistance to
BCR-ABL1-Targeted Therapies. Cancer Cell. 2020;37(4):530-542.
doi pubmed - Senapati J, Jabbour E, Kantarjian H, Short NJ. Pathogenesis
and management of accelerated and blast phases of chronic myeloid leukemia. Leukemia.
2023;37(1):5-17.
doi pubmed - Wei M, Wu Y, Liu H, Xie C. Genipin induces autophagy and
suppresses cell growth of oral squamous cell carcinoma via PI3K/AKT/MTOR pathway. Drug Des Devel
Ther. 2020;14:395-405.
doi pubmed - Cho YS. Genipin, an inhibitor of UCP2 as a promising new
anticancer agent: a review of the literature. Int J Mol Sci.
2022;23(10):5637.
doi pubmed - Hass DT, Barnstable CJ. Uncoupling proteins in the
mitochondrial defense against oxidative stress. Prog Retin Eye Res. 2021;83:100941.
doi pubmed - Balakrishnan P, Arasu A, Velusamy T. Targeting altered
calcium homeostasis and uncoupling protein-2 promotes sensitivity in drug-resistant breast
cancer cells. J Biochem Mol Toxicol. 2024;38(1):e23575.
doi pubmed - Du W, Yin F, Zhong Y, Luo M, Wang Z, Lin P, Liu Q, et al.
CircUCP2 promotes the tumor progression of non-small cell lung cancer through the miR-149/UCP2
pathway. Oncol Res. 2023;31(6):929-936.
doi pubmed - Robinson AJ, Hopkins GL, Rastogi N, Hodges M, Doyle M,
Davies S, Hole PS, et al. Reactive oxygen species drive proliferation in acute myeloid leukemia
via the glycolytic regulator PFKFB3. Cancer Res. 2020;80(5):937-949.
doi pubmed - Vallejo FA, Vanni S, Graham RM. UCP2 as a potential
biomarker for adjunctive metabolic therapies in tumor management. Front Oncol.
2021;11:640720.
doi pubmed - Feng Q, Cao HL, Xu W, Li XR, Ren YQ, Du LF. Apoptosis
induced by genipin in human leukemia K562 cells: involvement of c-Jun N-terminal kinase in
G(2)/M arrest. Acta Pharmacol Sin. 2011;32(4):519-527.
doi pubmed - Mailloux RJ, Adjeitey CN, Harper ME. Genipin-induced
inhibition of uncoupling protein-2 sensitizes drug-resistant cancer cells to cytotoxic agents.
PLoS One. 2010;5(10):e13289.
doi pubmed - Khoury JD, Solary E, Abla O, Akkari Y, Alaggio R, Apperley
JF, Bejar R, et al. The 5th edition of the World Health Organization Classification of
Haematolymphoid Tumours: Myeloid and Histiocytic/Dendritic Neoplasms. Leukemia.
2022;36(7):1703-1719.
doi pubmed - Vaupel P, Schmidberger H, Mayer A. The Warburg effect:
essential part of metabolic reprogramming and central contributor to cancer progression.
Int J Radiat Biol. 2019;95(7):912-919.
doi pubmed - Wu K, Guo C, Li Y, Yang J, Zhou Q, Cheng S, Li Y, et al.
MicroRNA-18a-5p regulates the Warburg effect by targeting hypoxia-inducible factor 1alpha in the
K562/ADM cell line. Exp Ther Med. 2021;22(4):1069.
doi pubmed - Cheung EC, Vousden KH. The role of ROS in tumour development
and progression. Nat Rev Cancer. 2022;22(5):280-297.
doi pubmed - Chaman N, Iqbal MA, Siddiqui FA, Gopinath P, Bamezai RN.
ERK2-Pyruvate Kinase Axis Permits Phorbol 12-Myristate 13-Acetate-induced Megakaryocyte
Differentiation in K562 Cells. J Biol Chem. 2015;290(39):23803-23815.
doi pubmed - Takeuchi R, Suzuki M, Yasukawa T. Electrorotation Rates of
K562 Cells Accompanied by Erythroid Differentiation Induced by Sodium Butyrate. Anal Sci.
2021;37(2):229-232.
doi pubmed - Li JR, Zhang F, Cao FL, Sun GX. Establishment of a differentiation model for leukemia cell line K562 and changes in uncoupling protein 2 expression during different differentiation stages. Chinese Journal of Birth Health & Heredity. 2019;27(3):271.
- Jiao YM, Ma LT, Wang D, Zhao P. Clinical study on the expression levels of CD33, CD13, and MPO in children with acute promyelocytic leukemia. Chinese Journal of Maternal and Child Health Research. 2022;33(2):86-89.
- Huang Q, Wang L, Ran Q, Wang J, Wang C, He H, Li L, et al.
Notopterol-induced apoptosis and differentiation in human acute myeloid leukemia HL-60 cells.
Drug Des Devel Ther. 2019;13:1927-1940.
doi pubmed - Sharma J, Prabha P, Sharma R, Gupta S, Dixit A.
Anti-leukemic principle(s) from Momordica charantia seeds induce differentiation of HL-60 cells
through ERK/MAPK signalling pathway. Cytotechnology. 2022;74(5):591-611.
doi pubmed - Bourgeais J, Ishac N, Medrzycki M, Brachet-Botineau M,
Desbourdes L, Gouilleux-Gruart V, Pecnard E, et al. Oncogenic STAT5 signaling promotes oxidative
stress in chronic myeloid leukemia cells by repressing antioxidant defenses. Oncotarget.
2017;8(26):41876-41889.
doi pubmed - Wu S, Luo C, Hameed NUF, Wang Y, Zhuang D. UCP2 silencing in
glioblastoma reduces cell proliferation and invasiveness by inhibiting p38 MAPK pathway. Exp
Cell Res. 2020;394(1):112110.
doi pubmed - Epstein T, Gatenby RA, Brown JS. The Warburg effect as an
adaptation of cancer cells to rapid fluctuations in energy demand. PLoS One.
2017;12(9):e0185085.
doi pubmed - Samudio I, Fiegl M, McQueen T, Clise-Dwyer K, Andreeff M.
The warburg effect in leukemia-stroma cocultures is mediated by mitochondrial uncoupling
associated with uncoupling protein 2 activation. Cancer Res. 2008;68(13):5198-5205.
doi pubmed - Stine ZE, Schug ZT, Salvino JM, Dang CV. Targeting cancer
metabolism in the era of precision oncology. Nat Rev Drug Discov. 2022;21(2):141-162.
doi pubmed - Nie ZY, Liu XJ, Zhan Y, Liu MH, Zhang XY, Li ZY, Lu YQ, et
al. miR-140-5p induces cell apoptosis and decreases Warburg effect in chronic myeloid leukemia
by targeting SIX1. Biosci Rep. 2019;39(4):BSR20190150.
doi pubmed
This
article is distributed under the terms of the Creative Commons Attribution Non-Commercial 4.0
International License, which permits unrestricted non-commercial use, distribution, and
reproduction in any medium, provided the original work is properly cited.
World
Journal of Oncology is published by Elmer Press Inc.