| World Journal of Oncology, ISSN 1920-4531 print, 1920-454X online, Open Access |
| Article copyright, the authors; Journal compilation copyright, World J Oncol and Elmer Press Inc |
| Journal website https://wjon.elmerpub.com |
Original Article
Volume 16, Number 1, February 2025, pages 30-50

Expression Profile of Thymidine Kinase Genes in Cervical Squamous Cell Carcinoma Confirmed by Various Detection Methods
Cai Xia Lianga, Ya Jun Pangb, Man Yu Chenb, Long Nian Hongc, Si Xia Huangc, Cheng Nong Guana, d
aThe First Clinical Medical School, Jinan University, Guangzhou 510632, Guangdong,
China
bDepartment of Gynecological Oncology, The Affiliated Hospital of
Guangdong Medical University, Zhanjiang 524001, Guangdong, China
cDepartment of
Gynecology, The Affiliated Hospital of Guangdong Medical University, Zhanjiang 524001,
Guangdong, China
dCorresponding Author: Cheng Nong Guan, The First Clinical
Medical School, Jinan University, Guangzhou 510632, Guangdong, China
Manuscript submitted August 28, 2024, accepted December 3, 2024, published online December 31,
2024
Short title: Expression Profile of TK Genes in CESC
doi:
https://doi.org/10.14740/wjon1962
| Abstract | ▴Top |
Background: Thymidine kinases (TKs) are key enzymes involved in DNA synthesis and repair, with alterations in their expression associated with various cancers. Thymidine kinase 1 (TK1) and TK2 are cytosolic enzyme proteins that catalyze the addition of a gamma-phosphate group to thymidine. The existing literature on TK1 in cervical squamous cell carcinoma (CESC) fails to address the clinical role of TK1 overexpression and its possible molecular mechanism in CESC. The clinical significance of TK2 in CESC is also unknown. The objective was to explore the differential expression, clinical significance, and molecular mechanisms of TK1 and TK2 in CESC.
Methods: The researchers collected global high-throughput data, extracted the expression levels of TK1 and TK2, and calculated the integrated standardized mean difference (SMD) and summarized receiver’s operating characteristics (sROC) of TK1 or TK2 mRNA to investigate the expression profiles of TK genes fully and objectively in 918 CESC tissues and 360 control tissues. In-house tissue microarrays for immunohistochemical testing were used to verify the protein level of TK1 in 62 CESC tissues and control tissues. The growth effect of TK1 and TK2 in CESC cell lines was assessed using Chronos dependency scores derived from CRISPR knockout screen in the Achilles project. We also analyzed the potential mechanism of TK genes by studying the relationship between TK gene expression and immune infiltration, gene alternations as well as the related signal pathways.
Results: The various detection methods employed all confirmed that the TK1 expression is upregulated and TK2 is downregulated in CESC tissues (SMD: 2.44, 95% confidence interval (CI): 1.36 - 3.51, area under curve (AUC): 0.88, 95% CI: 0.85 - 0.90; SMD: -0.69, 95% CI: -1.25 to -0.14, AUC: 0.75, 95% CI: 0.71 - 0.78). Inhibition of TK1 expression by CRISPR knockout had negative influence on the biological functions of 11 CESC cell lines. The expression of TK2 was negatively correlated with the malignant progression of CESC. Expression of TK genes showed significant association with the immune infiltration of macrophages, CD4+ T cells, and neutrophils. Genes related with TK1 or TK2 were involved in pathways related to DNA replication, proteasome, and homologous recombination.
Conclusions: Clinically, these findings suggest that the differential expression of TK1 and TK2 could serve as potential biomarkers, as well as therapeutic targets for personalized treatment strategies in CESC patients.
Keywords: Thymidine kinase genes; Cervical squamous cell carcinoma tissues; Microarray; RNA-sequencing; Standardized mean difference; Immune infiltration
| Introduction | ▴Top |
According to the latest global statistics on the incidence and mortality of tumors, cervical cancer came as the fourth most commonly diagnosed tumor in women [1]. According to a 2018 global epidemiological assessment of malignant tumors, there were approximately 570,000 newly diagnosed cases of cervical cancer worldwide, accounting for 3.15% of all cancers; in the same year, 310,000 people died of cervical cancer, which accounted for 3.26% of all cancer deaths globally [2]. In the United States, a total of 14,480 estimated new cases and 4,290 estimated deaths from cervical cancer were predicted to occur in 2021 [3]. In China, the number of patients with cervical cancer is also increasing [4]. Cervical squamous cell carcinoma (CESC) is the most common subtype of cervical cancer based on histology classification; it accounts for more than 90% of all cervical cancers. Squamous cell carcinoma cells originate from the squamous cells on the surface epithelial layer of the cervix. Most CESC occurs following a pre-cancerous period, characterized by high-grade squamous intraepithelial lesions [5-8]. Infection by the high-risk subtypes of human papillomavirus (HPV) is the most vital risk factor for CESC [9-11]. Although some risk factors for CESC have been confirmed, it is thought that many unknown molecules influence the initial carcinogenesis and subsequent progression of CESC [12-17]. The clinical value of targeting these molecules for therapeutic interventions and their precise molecular mechanisms need to be further studied.
As one of the key enzymes in DNA metabolism, thymidine kinases (TKs) catalyze the phosphorylation of thymidine to thymidine monophosphate and serve as significant regulators of the mammalian cell cycle [18, 19]. The TK genes consist of two isoenzymes in human tissue: TK1 and TK2. TK1 presents in the cytoplasm and is mainly detected in the G1/S phase of cell cycles of dividing cells, therefore TK1 exhibits high activity in fetal and neoplastic tissues but is absent in resting cells. TK2 is of mitochondrial origin, and located in mitochondria. The enzyme levels of TK2 remain relatively constant throughout the cell cycle. TK1 and TK2 differ in biochemical properties. While TK1 migrates slowly during polyacrylamide gel electrophoresis, TK2 migrates rapidly [20]. TK1 overexpression is reported to play pivotal roles in the occurrence and progression of several cancer types, including breast cancer, thyroid cancer, head and neck cancer, lung cancer, bladder cancer, prostate cancer, and colon cancer [21-27]. However, to the best of the researcher’s knowledge, only two research studies have investigated the expression levels of TK1 and its clinical significance, both of which were based on a single detection method and a small sample size [28, 29]. Specifically, one of these studies performed only immunohistochemical analysis of clinical samples sourced from an institute; no mRNA levels were assessed and no prospective mechanism was explored [29]. The other study collected three microarrays (GSE63514, GSE9750, and GSE7803), which only represented a small proportion of the global high-throughput data. The researchers found that TK1 was among the differentially expressed genes (DEGs) identified in the cervical cancer and non-cancer controls. However, they did not show the exact expression levels of TK1 mRNA, nor the validation of TK1 protein levels [28]. Thus, the existing literature on the role of TK1 in CESC has several shortcomings concerning the clinical role of TK1 and its possible molecular mechanism in CESC. With regard to TK2, there has been no research concerning the expression significance and clinical role of TK2 for CESC so far.
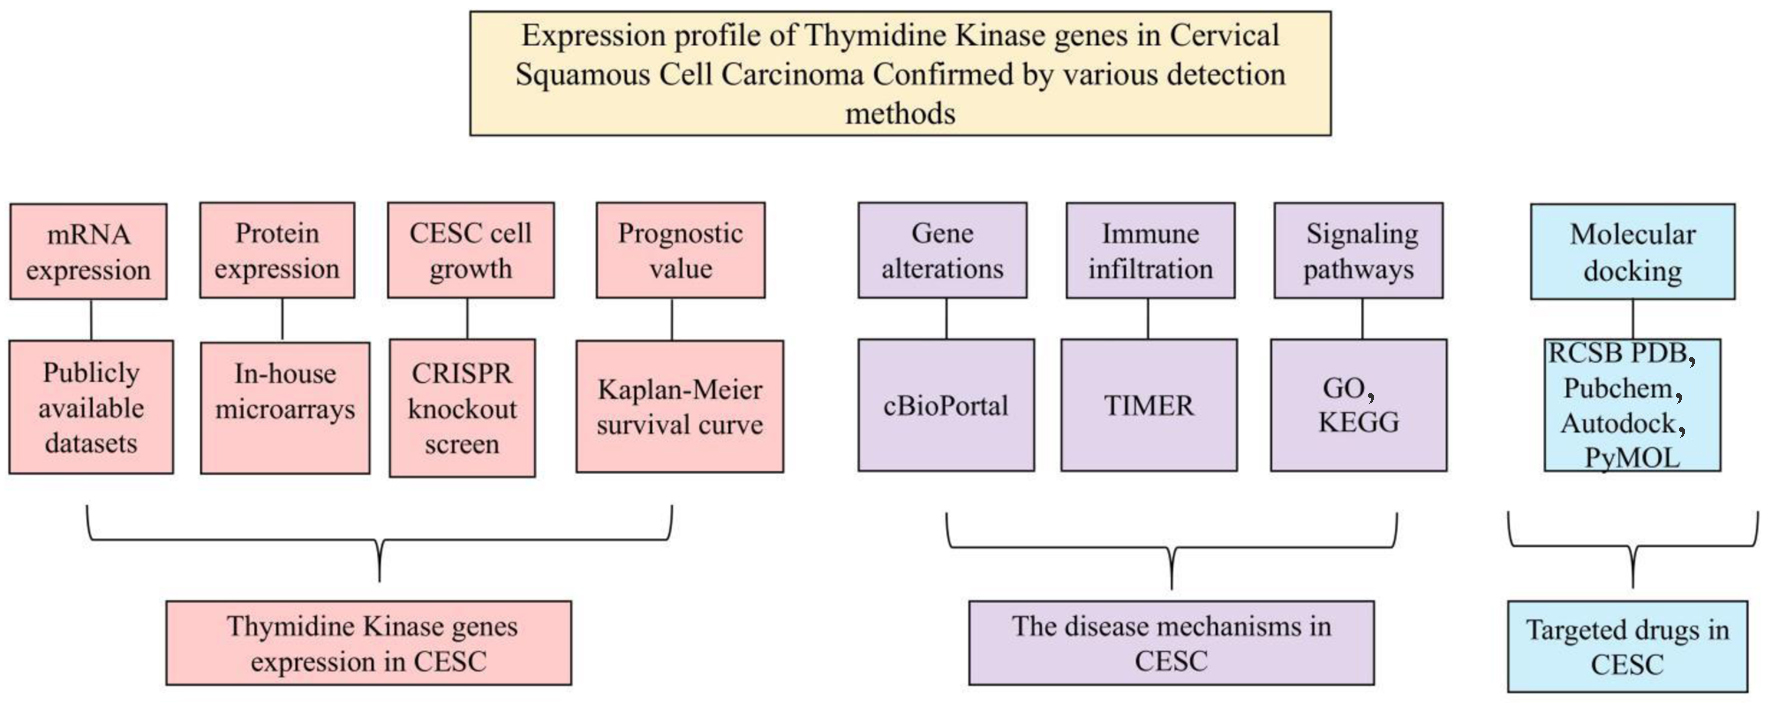
To bridge the existing research gaps and comprehensively elucidate the roles of TK1 and TK2 in CESC and their potential clinical implications, we initiated our study by aggregating global high-throughput datasets. We extracted and analyzed the expression levels of TK1 and TK2, computing the integrated standard mean difference (SMD) and the summarized discrimination index to objectively quantify the expression of these genes in CESC tissues. Additionally, we employed in-house tissue microarrays for immunohistochemical validation of TK1 protein levels and further explored the crucial functions of TK genes in the biological behavior of CESC cell lines. Our investigations also extended to the molecular mechanisms underlying the immune regulation mediated by TK genes in CESC and assessed the predictive clinical relevance of genetic alterations in TK1 and TK2. A targeted approach was undertaken through molecular docking to evaluate potential therapeutic drugs. The overall design of the study is illustrated in Figure 1.
 Click for large image |
Figure 1. The overall design of the current study. |
| Materials and Methods | ▴Top |
Clinical significance of TK1 and TK2 expression in CESC tissues
The TK1 and TK2 mRNA expression levels in CESC tissues
To investigate TK1 and TK2 mRNA expression in CESC tissue samples, we first collected all currently available high-throughput data on TK genes and then extracted the TK1 and TK2 mRNA expression data from each independent study. This was followed by integrated data analysis. The primary screening was performed up until September 1, 2023. The following high-throughput datasets were searched: Genotype-Tissue Expression Project (GTEx), Gene Expression Omnibus (GEO), The Cancer Genome Atlas (TCGA), Cancer Cell Line Encyclopedia (CCLE), International Cancer Genome Consortium (ICGC), ONCOMINE, Sequence Read Archive (SRA), Genomic Expression Archive (GEA), and ArrayExpress. Meanwhile, RNA-sequencing (RNA-seq) or microarrays were also sought from studies in multiple literature databases such as Web of Science, PubMed, and Wiley Online Library. In the case that different microarrays were employed by the same platform, we integrated them after removing the batch effect. After the integration of the platforms, the microarray was accepted for subsequent calculations if the number of cases in both the experimental group and the control group exceeded 3. The differences between mRNA expression of TK genes in the CESC and control tissues were calculated using independent Student’s t-tests, and receiver’s operating characteristics (ROC) was plotted according to previous reports [15, 29-33].
The TK1 protein expression levels in CESC tissues
To determine TK1 protein expression in the CESC tissues, we used immunohistochemical analysis to detect and semi-quantitatively evaluate the TK1 protein expression levels on 62 pairs of CESC specimens and corresponding control specimens. The samples were provided by the tissue microarray (OD-CT-RpUtr03-004 and OD-CT-RpUtr03-005, from Shanghai Outdo Biotech Co., Ltd). The tissue microarray production procedure gained authorization from the Ethics Committee of the Shanghai Outdo Biotech Co., Ltd (National Human Genetic Resources Sharing Service Platform, 2005DKA21300) and signed informed consent forms of agreeing with the use of samples were gathered from all enrolled patients. Immunohistochemical analysis was carried out according to previous reports on the first antibody of TK1 (ab76495, Abcam) [34-37]. The staining results were also judged as previously reported in terms of both staining intensity and range [34-37]. The same statistical strategy for judging mRNA level was performed for the TK1 protein level in the CESC tissue microarray.
The comprehensive measurement of TK1 and TK2 expression levels in CESC tissues
To comprehensively measure TK1 and TK2 expression, we recalculated the final SMD and drew the summarized receiver’s operating characteristics (sROC) curves with all available expression data with TK1 and TK2 in CESC. The SMD was calculated with all available gene microarrays, RNA-seq, and an in-house tissue microarray using R software (v.3.6.1). The sROC curves were exhibited using Stata (v.14.0) [38-41].
The essentiality of TK1 and TK2 for biological functions of CESC cell lines
The importance of TK1 and TK2 for the biological functions of 12 human CESC cell lines was evaluated through the Chronos dependency scores from CRISPR knockout assays of project Achilles [42].
The prognostic value of TK genes and correlations between TK genes with clinical factors of CESC
The influence of TK1 and TK2 expression on the overall and disease-free survival of CESC patients was assessed through Kaplan-Meier survival curves with hazard ratio (HR) values calculated based on Cox proportional hazard model [43]. Group cutoff value for survival analysis of CESC patients was determined by the median expression value of TK1 and TK2 mRNA expression. The correlation between expression of TK genes and clinical parameters such as cancer stages, patient’s race, patient’s weight, patient’s age, histological subtype, tumor grade, and nodal metastasis status was analyzed via UALCAN [44].
The predictive clinical significance of TK1 and TK2 gene alterations
To investigate the clinical significance of TK1 and TK2 gene mutations in CESC, this study utilized the cBioPortal [45] to analyze the mutation types of TK1 and TK2 in CESC samples. We performed correlation analyses between TK1 and TK2 mutations to determine their interdependencies and associations. The objective of this analysis was to identify potential therapeutic targets that could enhance the treatment strategies and improve patient outcomes in CESC.
The role of TK1 and TK2 expression in immune regulation of CESC
To study the function of TK1 and TK2 expression in the immune regulation of CESC, TIMER2.0 was used to calculate the correlations between expression of TK genes and immune infiltrations based on TCGA data from the GDAC Firehose website. Correlation scatter plots of TK1 and TK2 expression with tumor cell purity and six immune cell types were constructed, including B cells, T cells, macrophages, dendritic cells, and neutrophils [46].
The prospective signaling pathways of TK1 and TK2-related genes in CESC
The DEGs of all included datasets were profiled. The gene microarray data were analyzed using the Limma package and the RNA-seq data were analyzed using the Limma Voom package with EdgeR. The threshold of the DEG was log2FC>1 or < -1 and P < 0.05 after adjustment. Those DEGs that appeared in more than two datasets were recruited for the next stage of analysis. Moreover, Pearson correlation analyses were also performed on the correlations between the expression levels of all other genes and TK genes in each dataset using the psych R package to select TK1 or TK2-related genes. The intersections of high-expressed genes in CESC and positively-related genes of TK1, as well as low-expressed genes and negatively-related genes of TK1, were noted for subsequent investigation. Meanwhile, the intersections of high-expressed genes in CESC and negatively-related genes of TK2, as well as low-expressed genes and positively-related genes of TK2 were also reserved for functional enrichment analysis. The above two groups of genes were annotated using Gene Ontology (GO) and analyzed for signaling pathways with the Kyoto Encyclopedia of Genes and Genomes (KEGG) by the cluster profiler R package as previously reported [47-51].
Molecular docking of targeted TK1 and TK2 for CESC
Investigating the molecular docking of targeted TK1 and TK2 in CESC, this study analyzed potential drug candidates that could significantly decrease TK1 expression while increasing TK2 expression. Drug candidates were selected from the Drug Gene Budger (DGB) database [52]. The original LINCS L1000 dataset was corrected for batch effects using the combat package, and statistical significance was assessed using the Limma package to calculate P-values. The Benjamini-Hochberg method was employed to compute q-values [53]. Drugs that specifically target TK1 and TK2 were identified by selecting those displaying the smallest top 10 logFoldChange values, with both P and q values under 0.05. Subsequently, these targeted drugs were examined for their intersection. For molecular docking studies, the crystal structures of TK1 and TK2, obtained from the RCSB PDB database (PDB ID: 1W4R, AF-O00142-F1), were prepared by removing all solvent molecules and co-crystallized ligands using PyMOL 2.4. The active sites of TK1 and TK2 were predicted using the POCASA 1.1. Chemical structures of the drugs were acquired from the PubChem database and optimized with AutoDockTools. Docking simulations were conducted using AutoDock Vina 1.5.7, prioritizing those simulations that resulted in lower affinity energy values, indicative of stronger binding efficacy at the active sites of TK1 and TK2. Visualization of the docking models was accomplished using PyMOL.
| Results | ▴Top |
Clinical significance of TK1 and TK2 expression in CESC tissues
TK1 and TK2 mRNA expression in CESC tissues based on independent cohorts
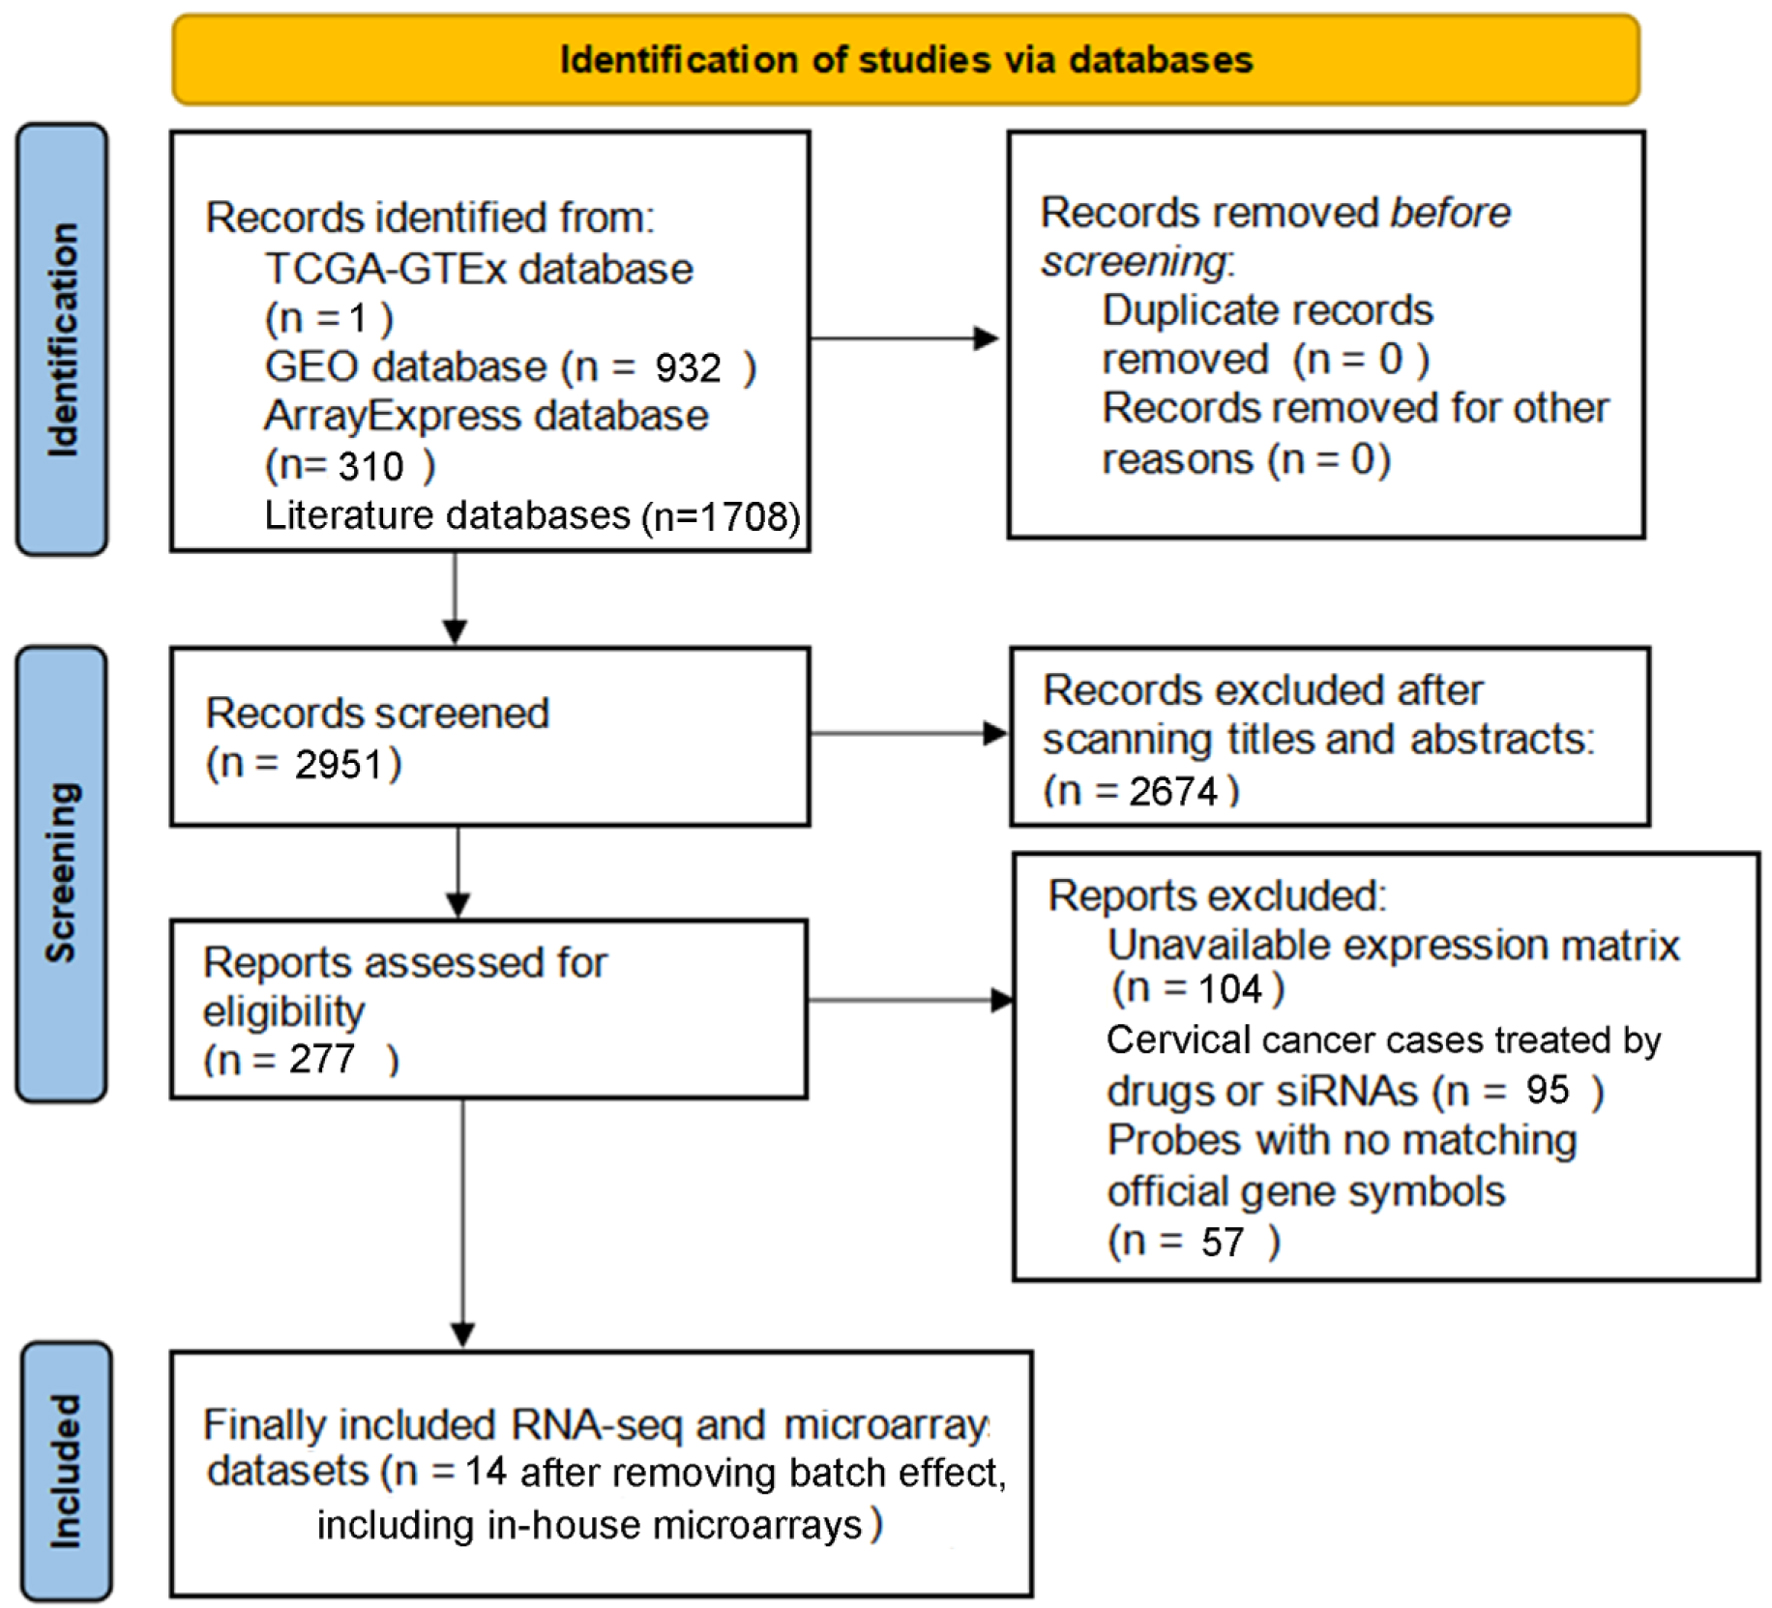
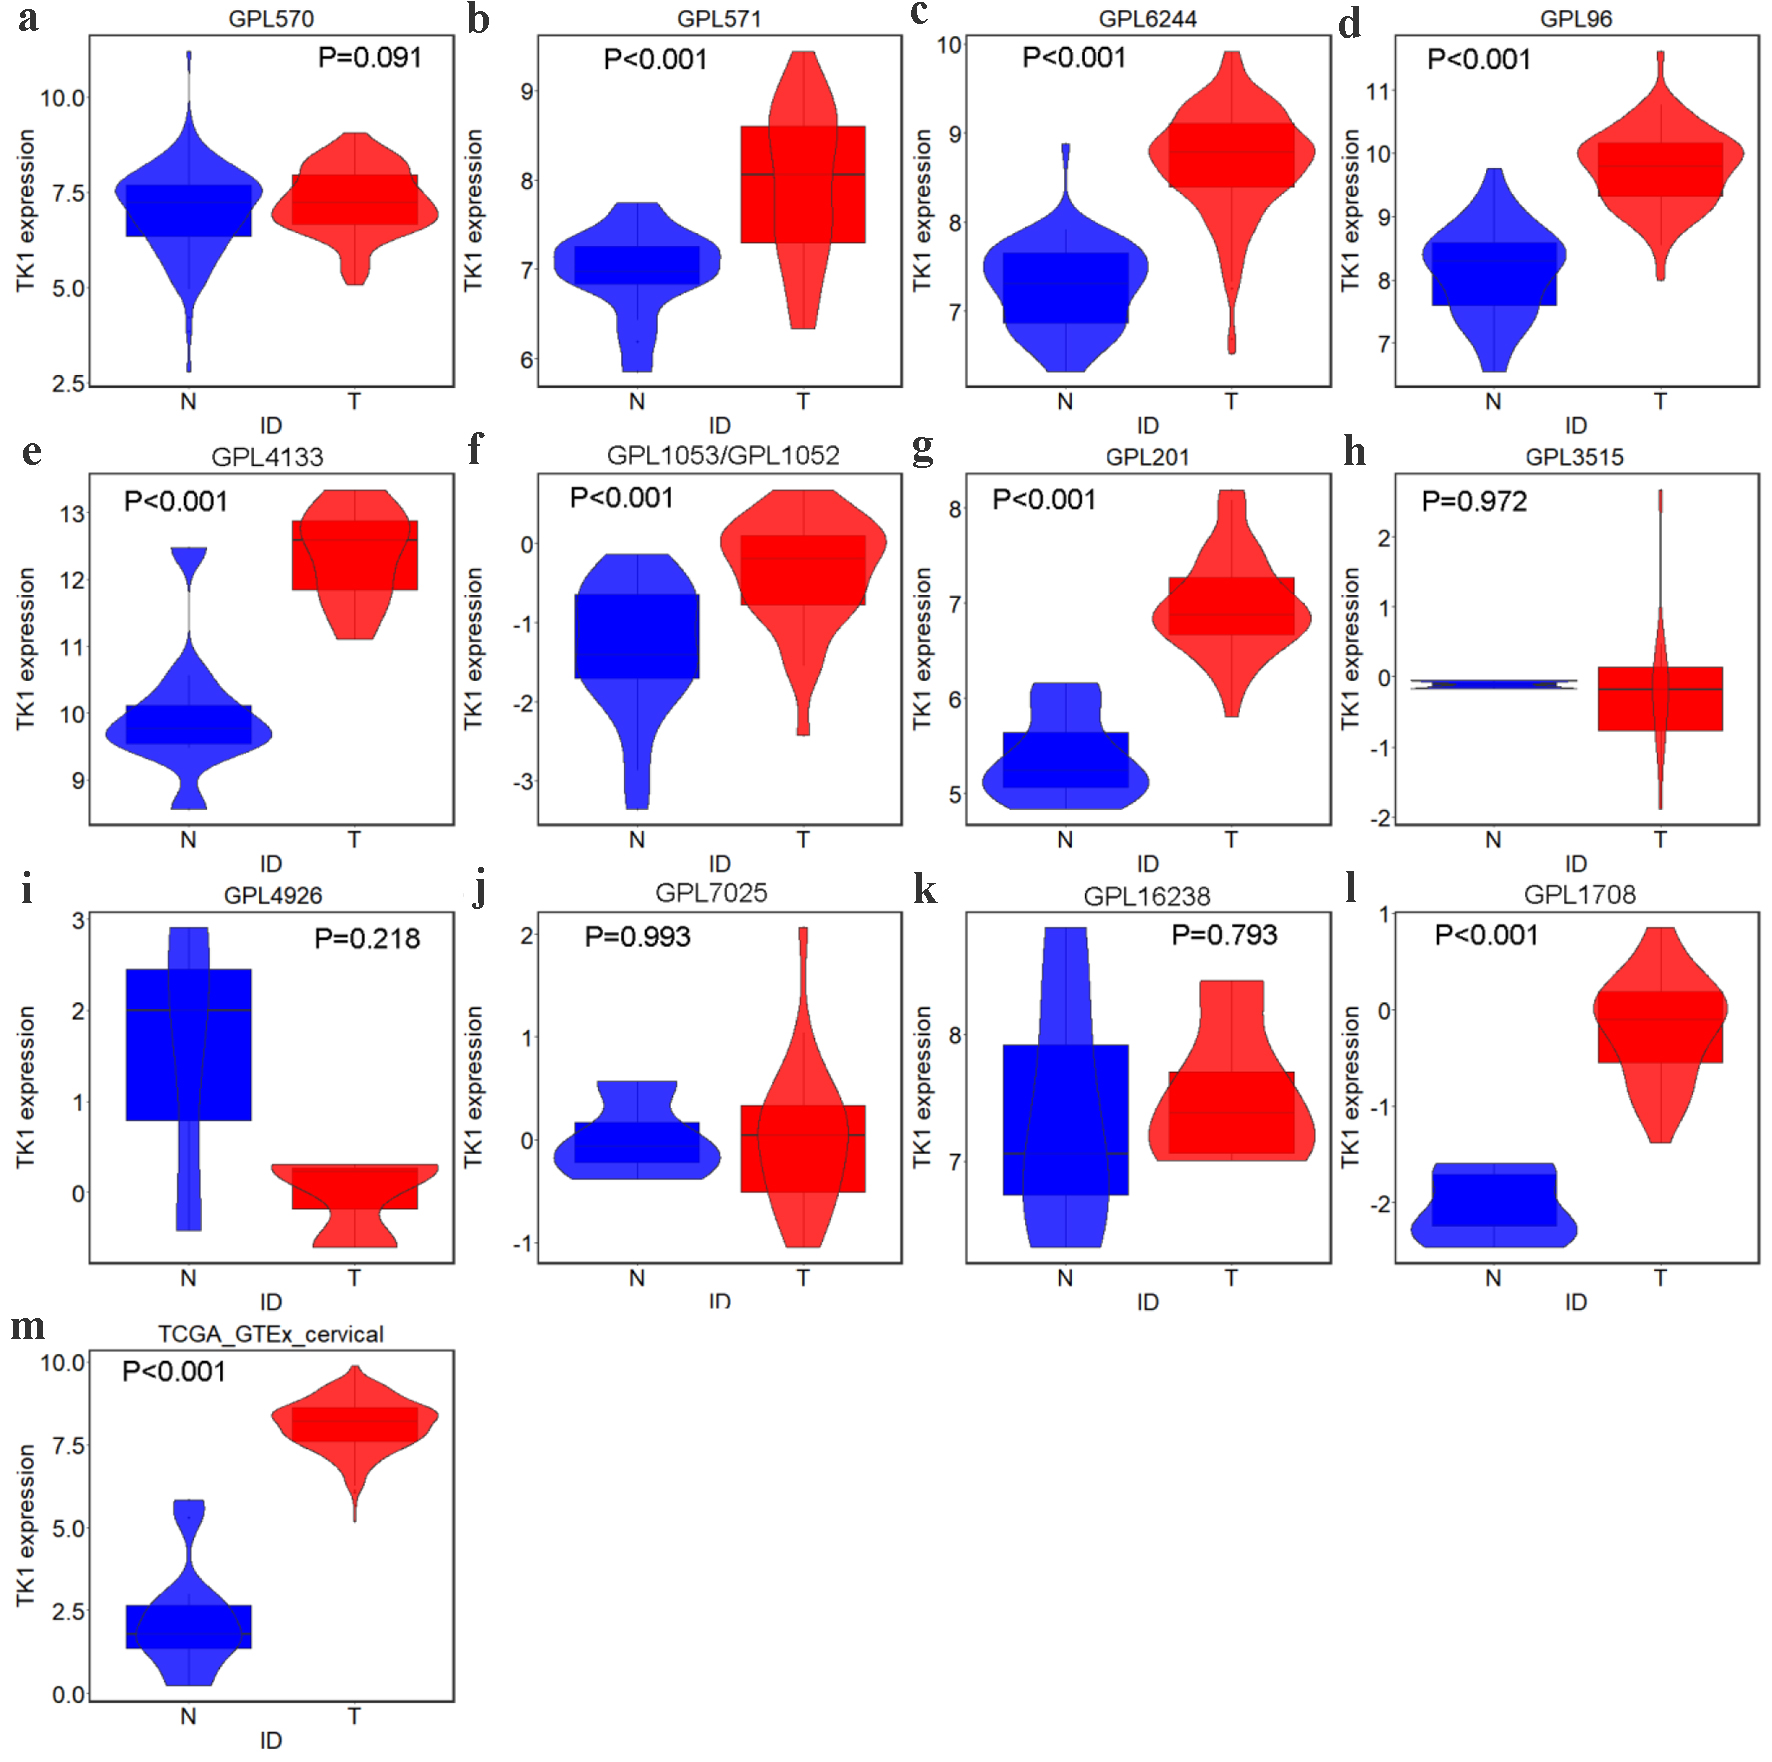
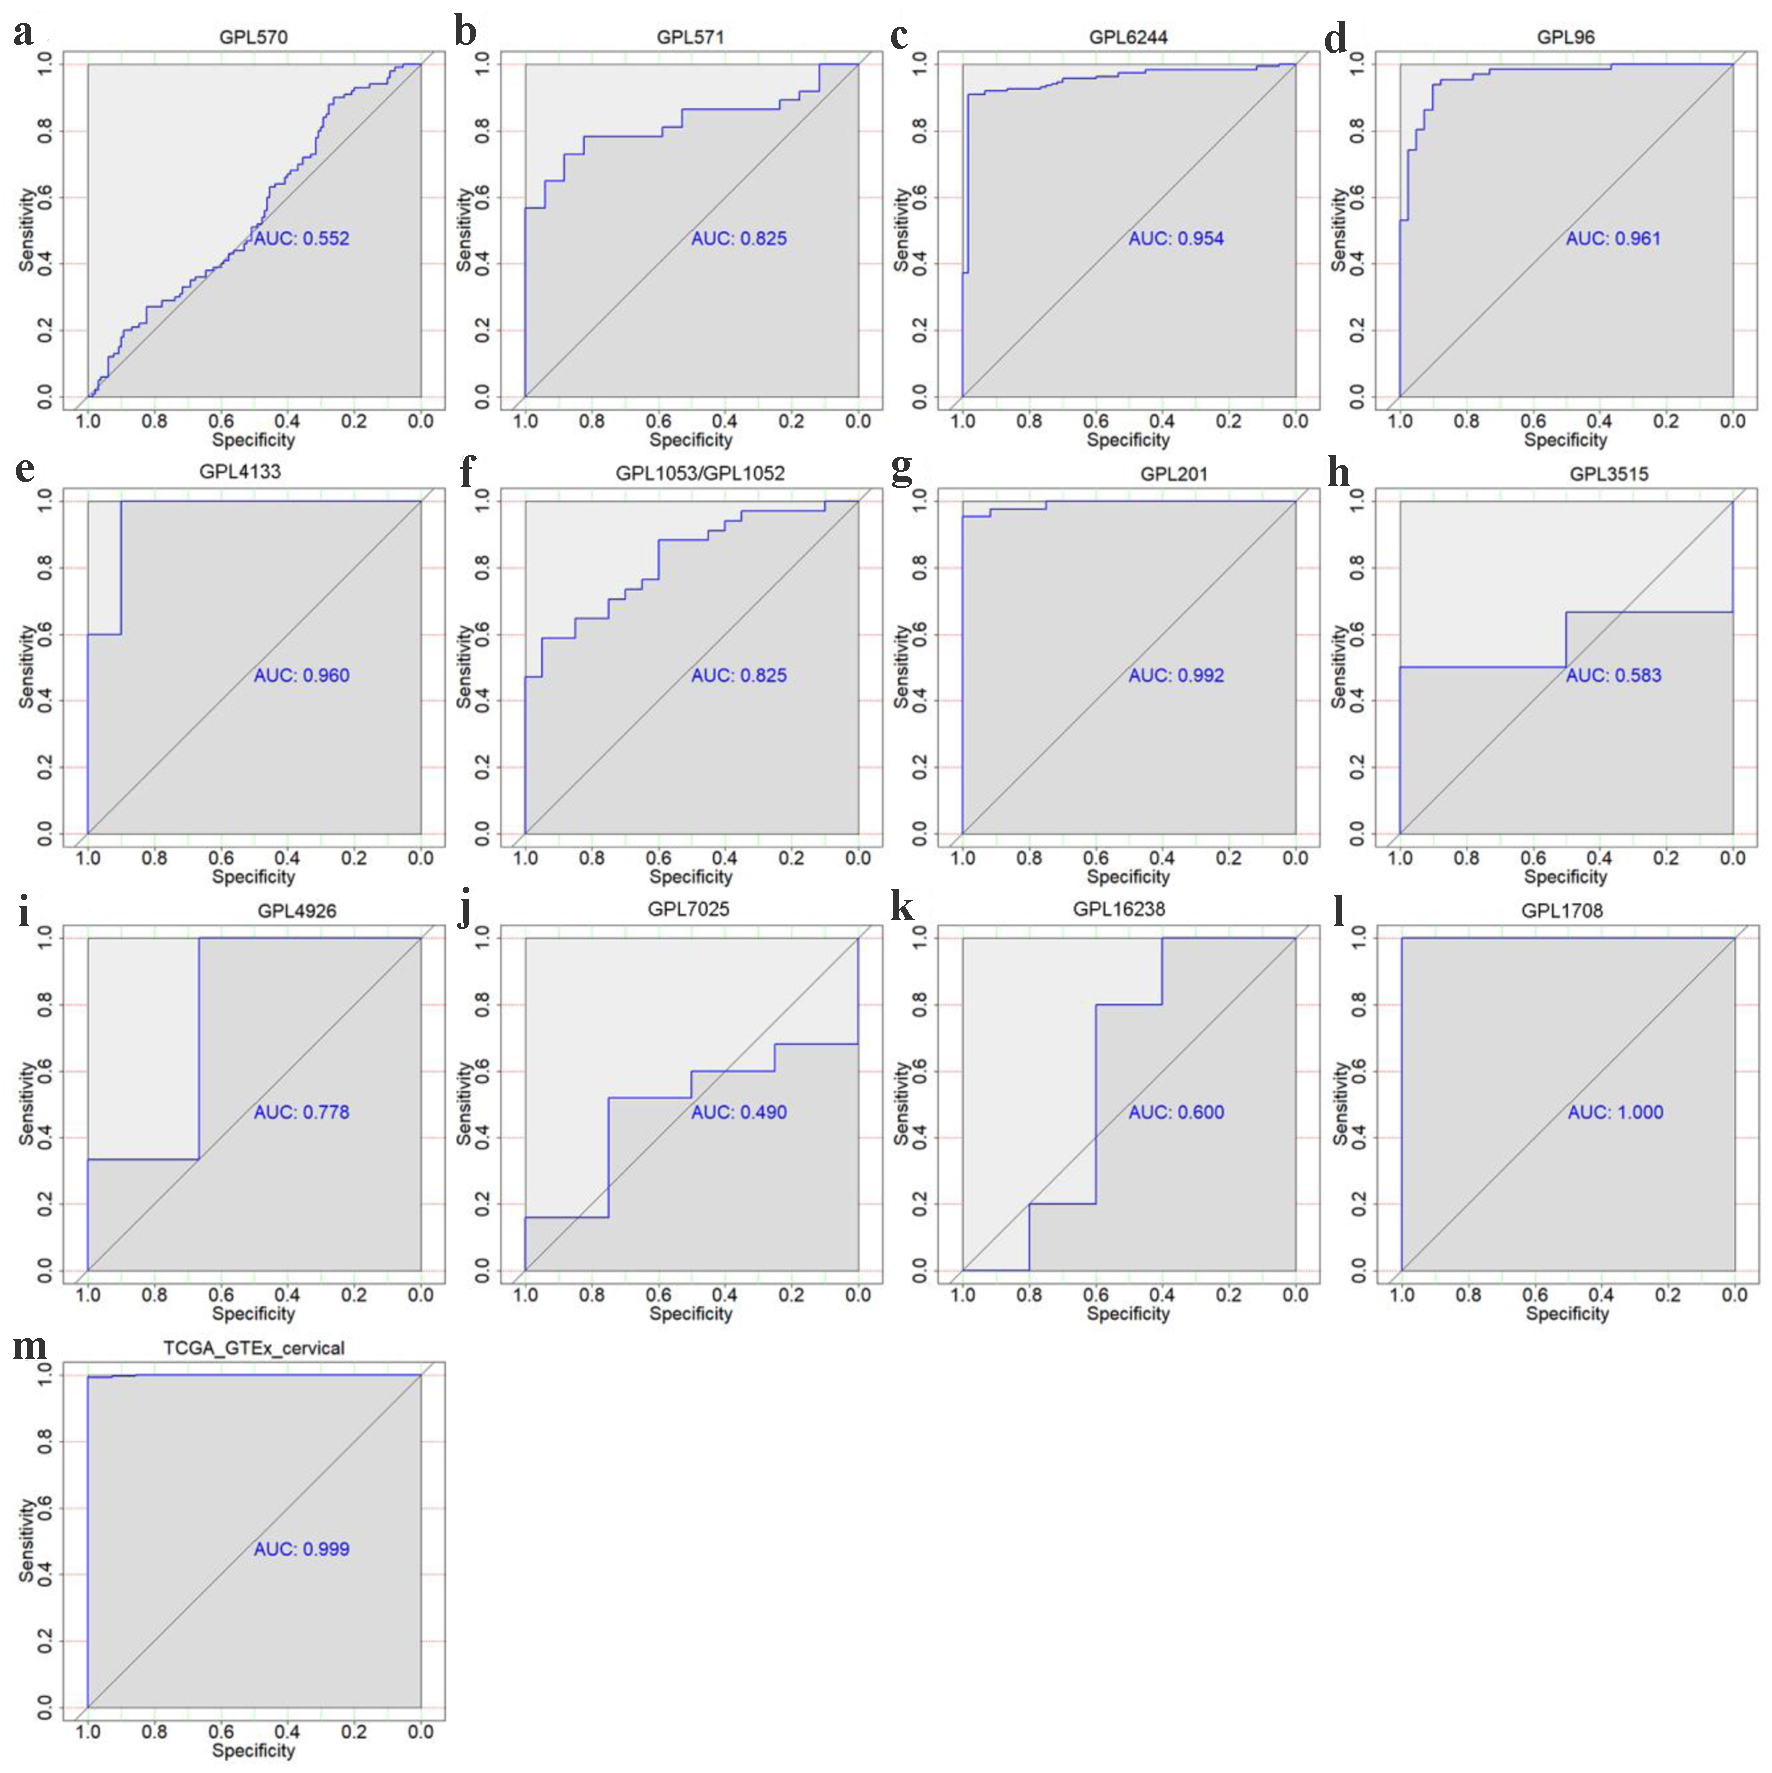
Altogether, we gathered one RNA-seq dataset and 22 microarray datasets from all the above-mentioned high-throughput and literature sources. After removal of the batch effect, final 15 groups were included to assess the TK1 and TK2 mRNA levels in the CESC tissues, including one RNA-seq dataset (TCGA/GTEx) and 14 microarray platforms (Fig. 2, Table 1). The differences of the TK1 mRNA expression between CESC tissue samples and controls, as well as the AUC values of TK1 and TK2 expression for CESC are shown in Figures 3-6, which highlight the diverse distributions of the TK1 and TK2 expression trend among the different cohorts.
 Click for large image |
Figure 2. PRISMA flow diagram for the current study. |
 Click to view |
Table 1. Basic Information From All Included
RNA-seq and Microarray Datasets of Cervical Cancer |
 Click for large image |
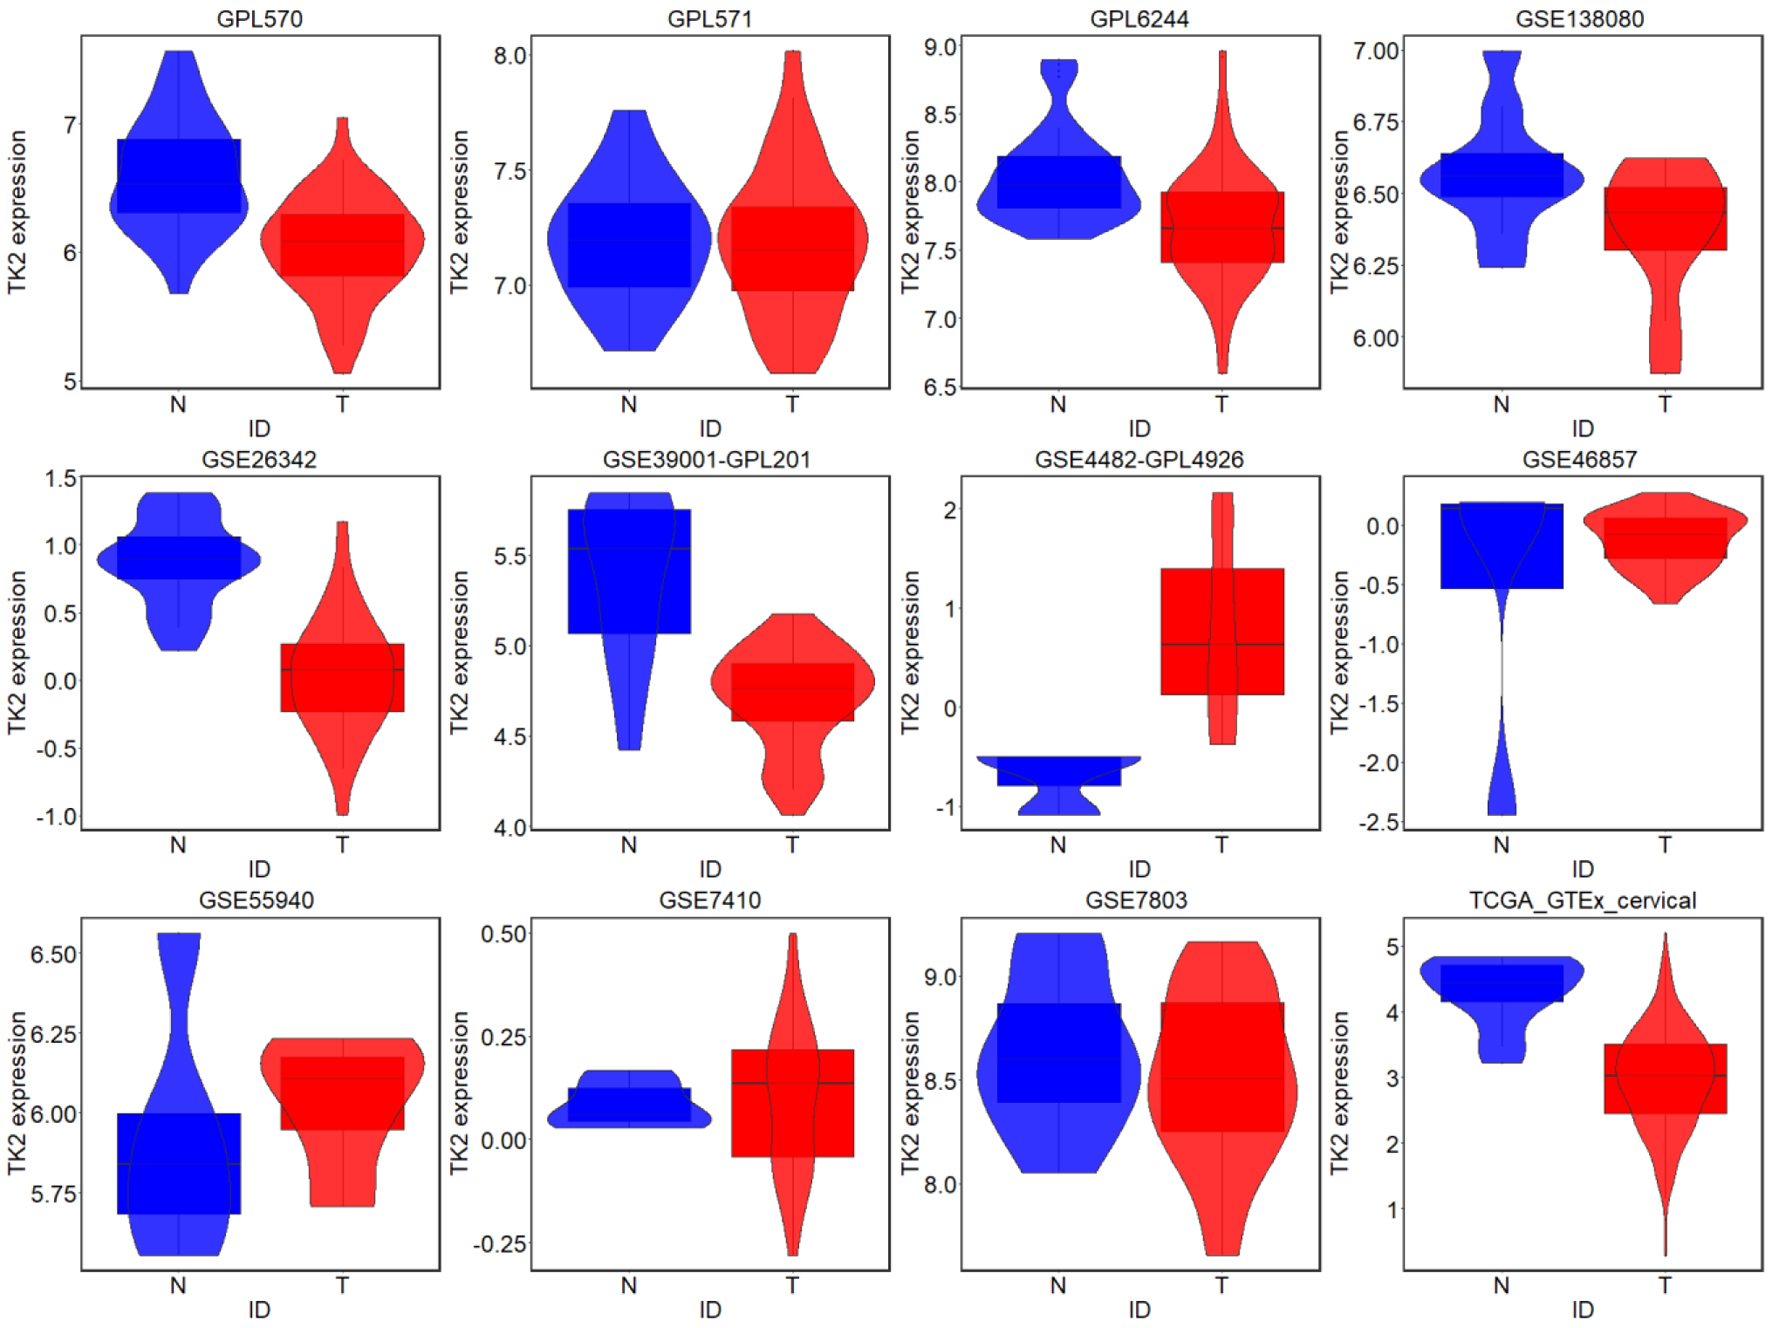
Figure 3. TK1 expression in CESC from external microarrays and RNA-seq datasets. Violin plots for: (a) GPL570; (b) GPL571; (c) GPL6244; (d) GPL96; (e) GPL4133; (f) GPL1053 and GPL1052; (g) GPL201; (h) GPL3515; (i) GPL4926; (j) GPL7025; (k) GPL16238; (l) GPL1708; (m) TCGA-GTEx. N: non-cancer controls; T: CESC samples. |
 Click for large image |
Figure 4. The discriminatory ability of TK1 expression in distinguishing CESC from non-cancer tissues in each microarray and RNA-seq dataset. ROC curves for GPL570 (a), GPL571 (b), GPL6244 (c), GPL96 (d), GPL4133 (e), GPL1053 and GPL1052 (f), GPL201 (g), GPL3515 (h), GPL4926 (i), GPL7025 (j) GPL16238 (k), GPL1708 (l) and TCGA-GTEx datasets (m). AUC: area under curve. |
 Click for large image |
Figure 5. TK2 expression in CESC from external microarrays and RNA-seq datasets; N: non-cancer controls; T: CESC samples. |
 Click for large image |
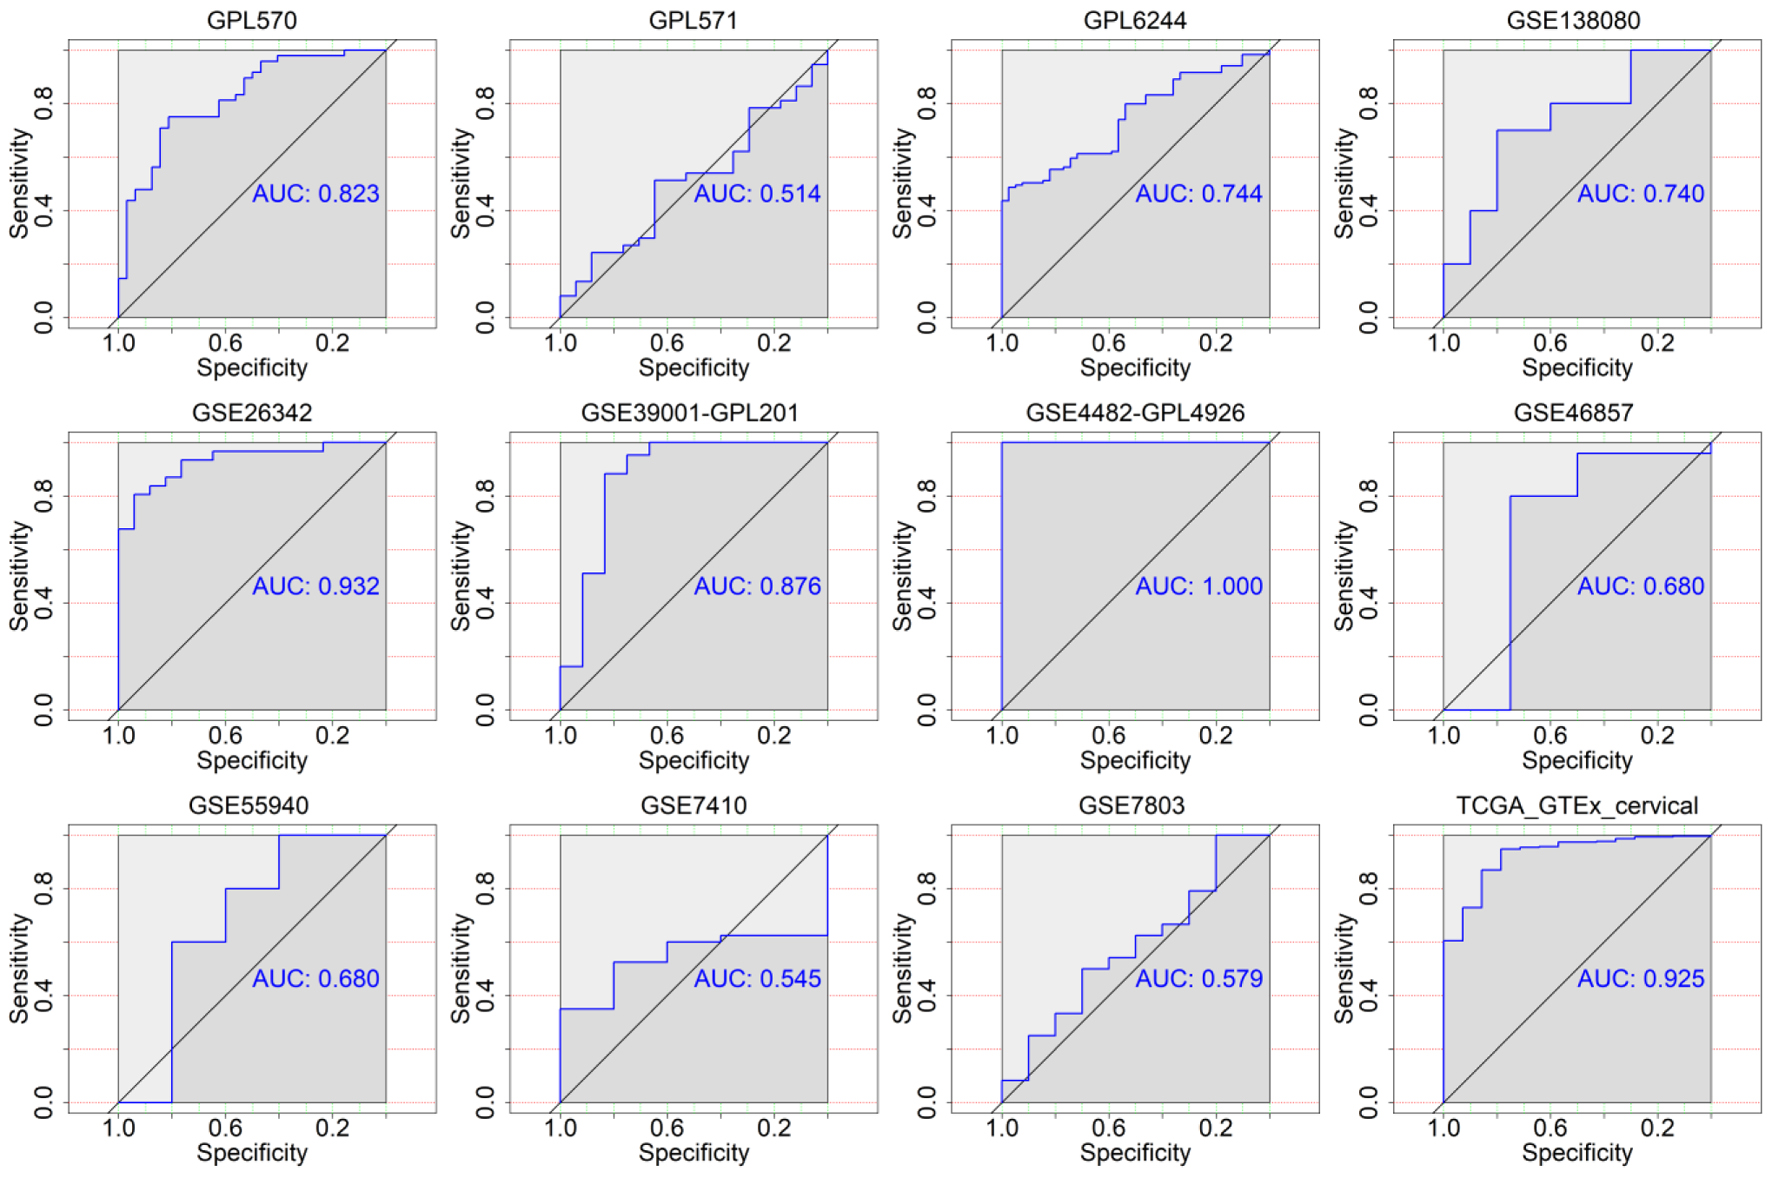
Figure 6. The discriminatory ability of TK2 expression in distinguishing CESC from non-cancer tissues in each microarray and RNA-seq dataset. AUC: area under curve. |
The aggregated integrative TK1 and TK2 expression in the CESC tissue samples of all cohorts
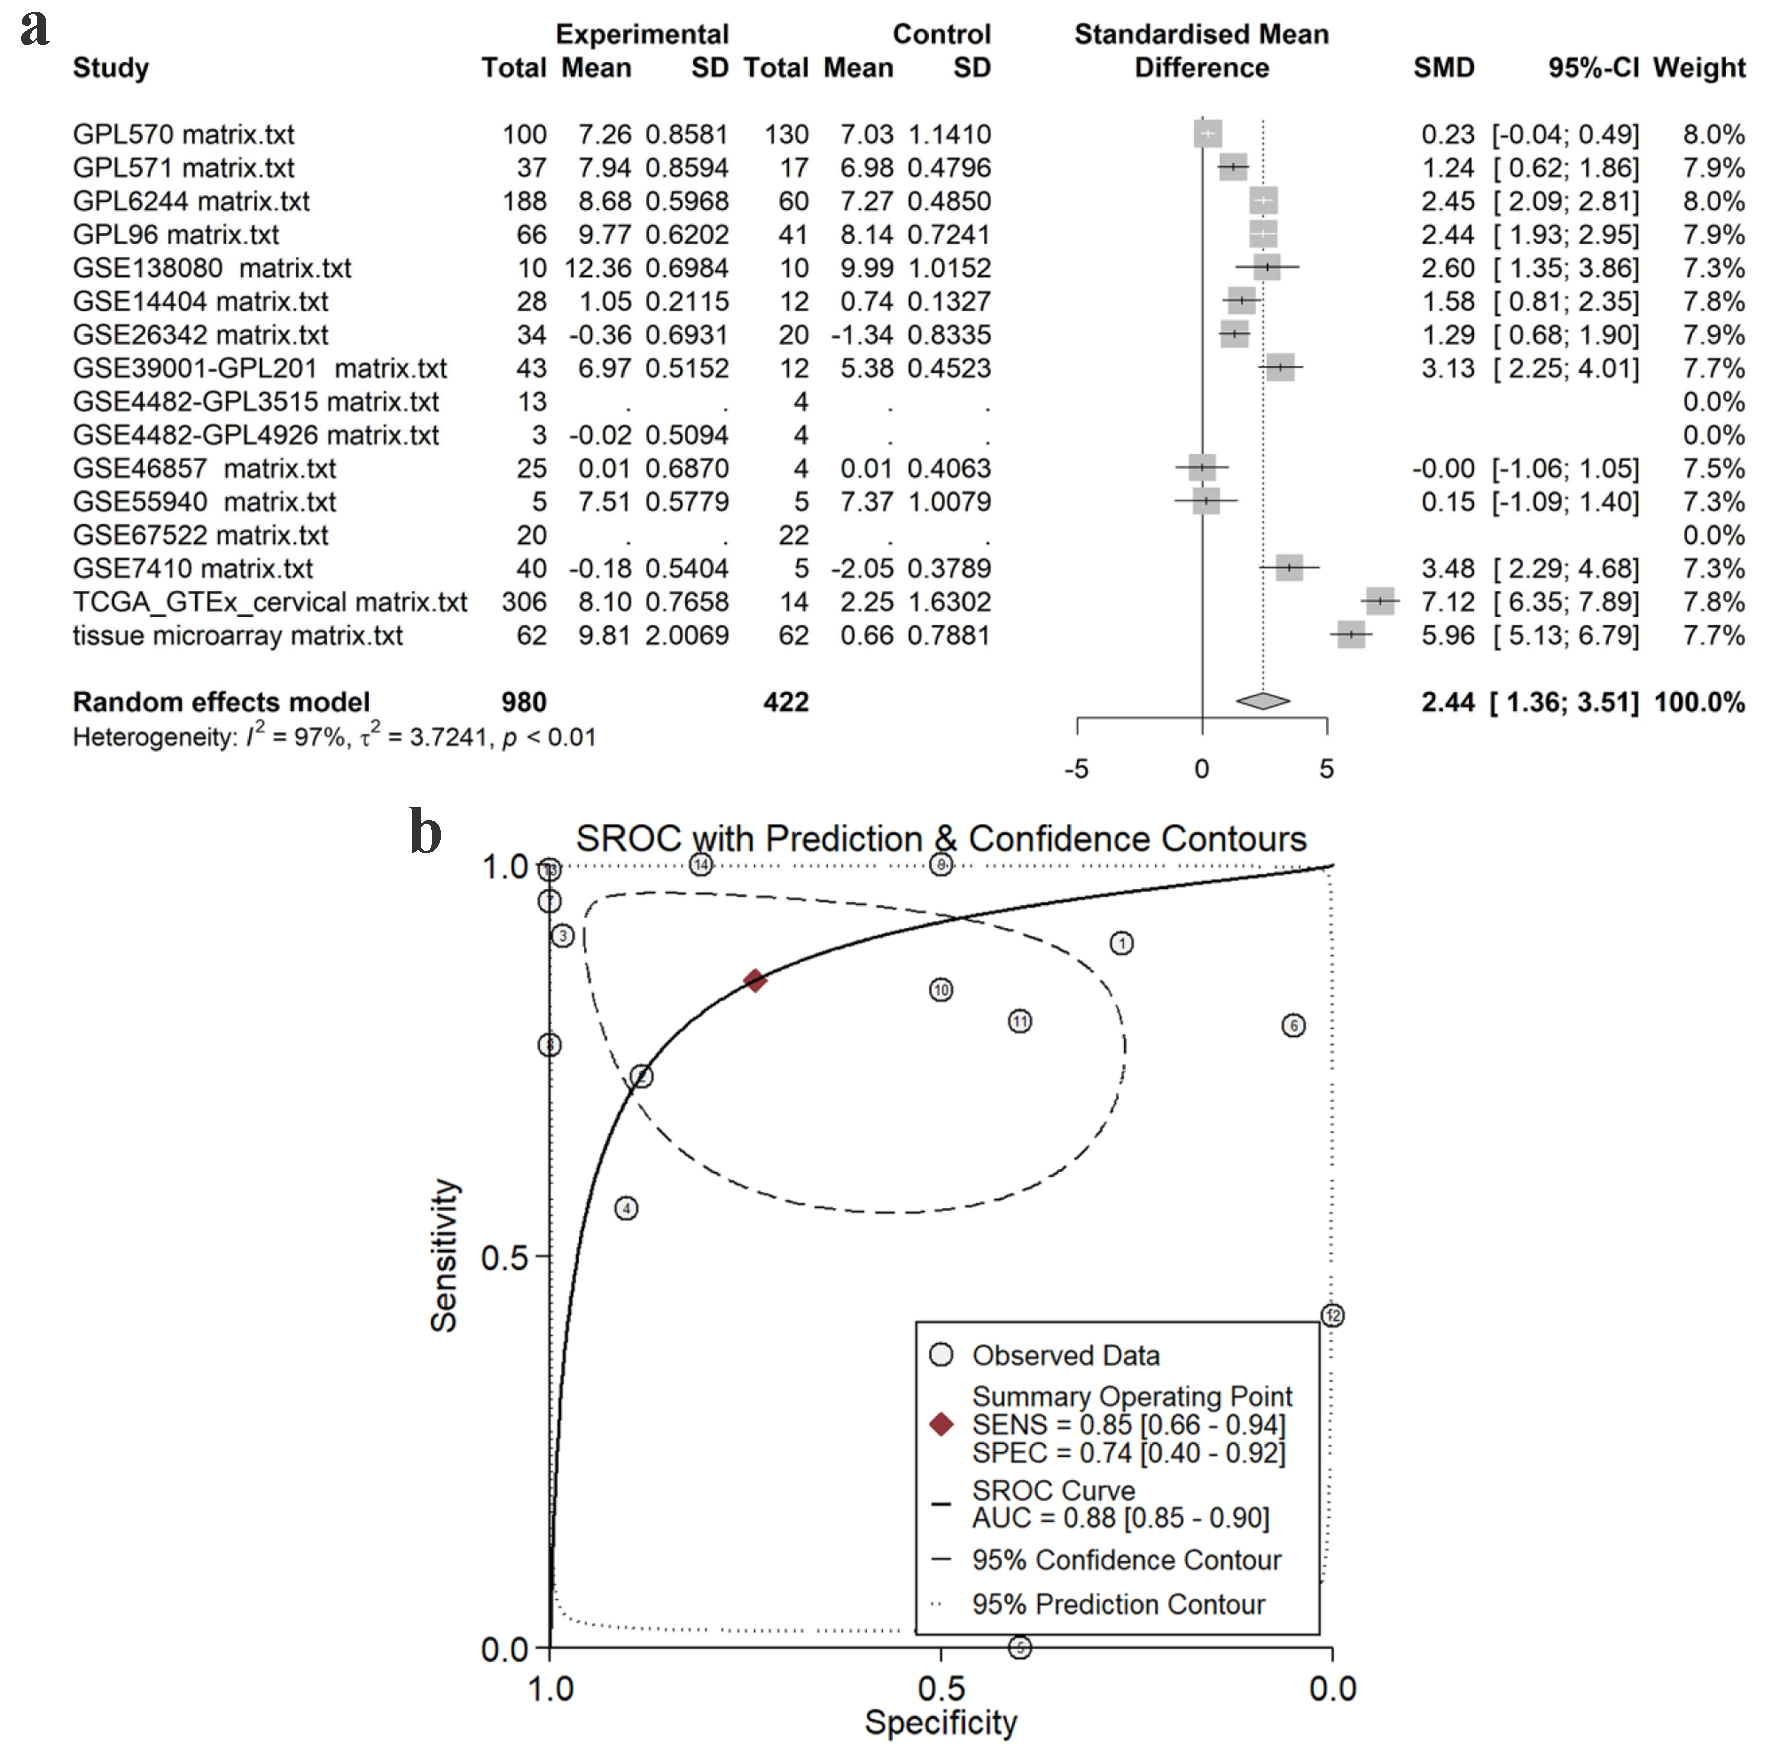
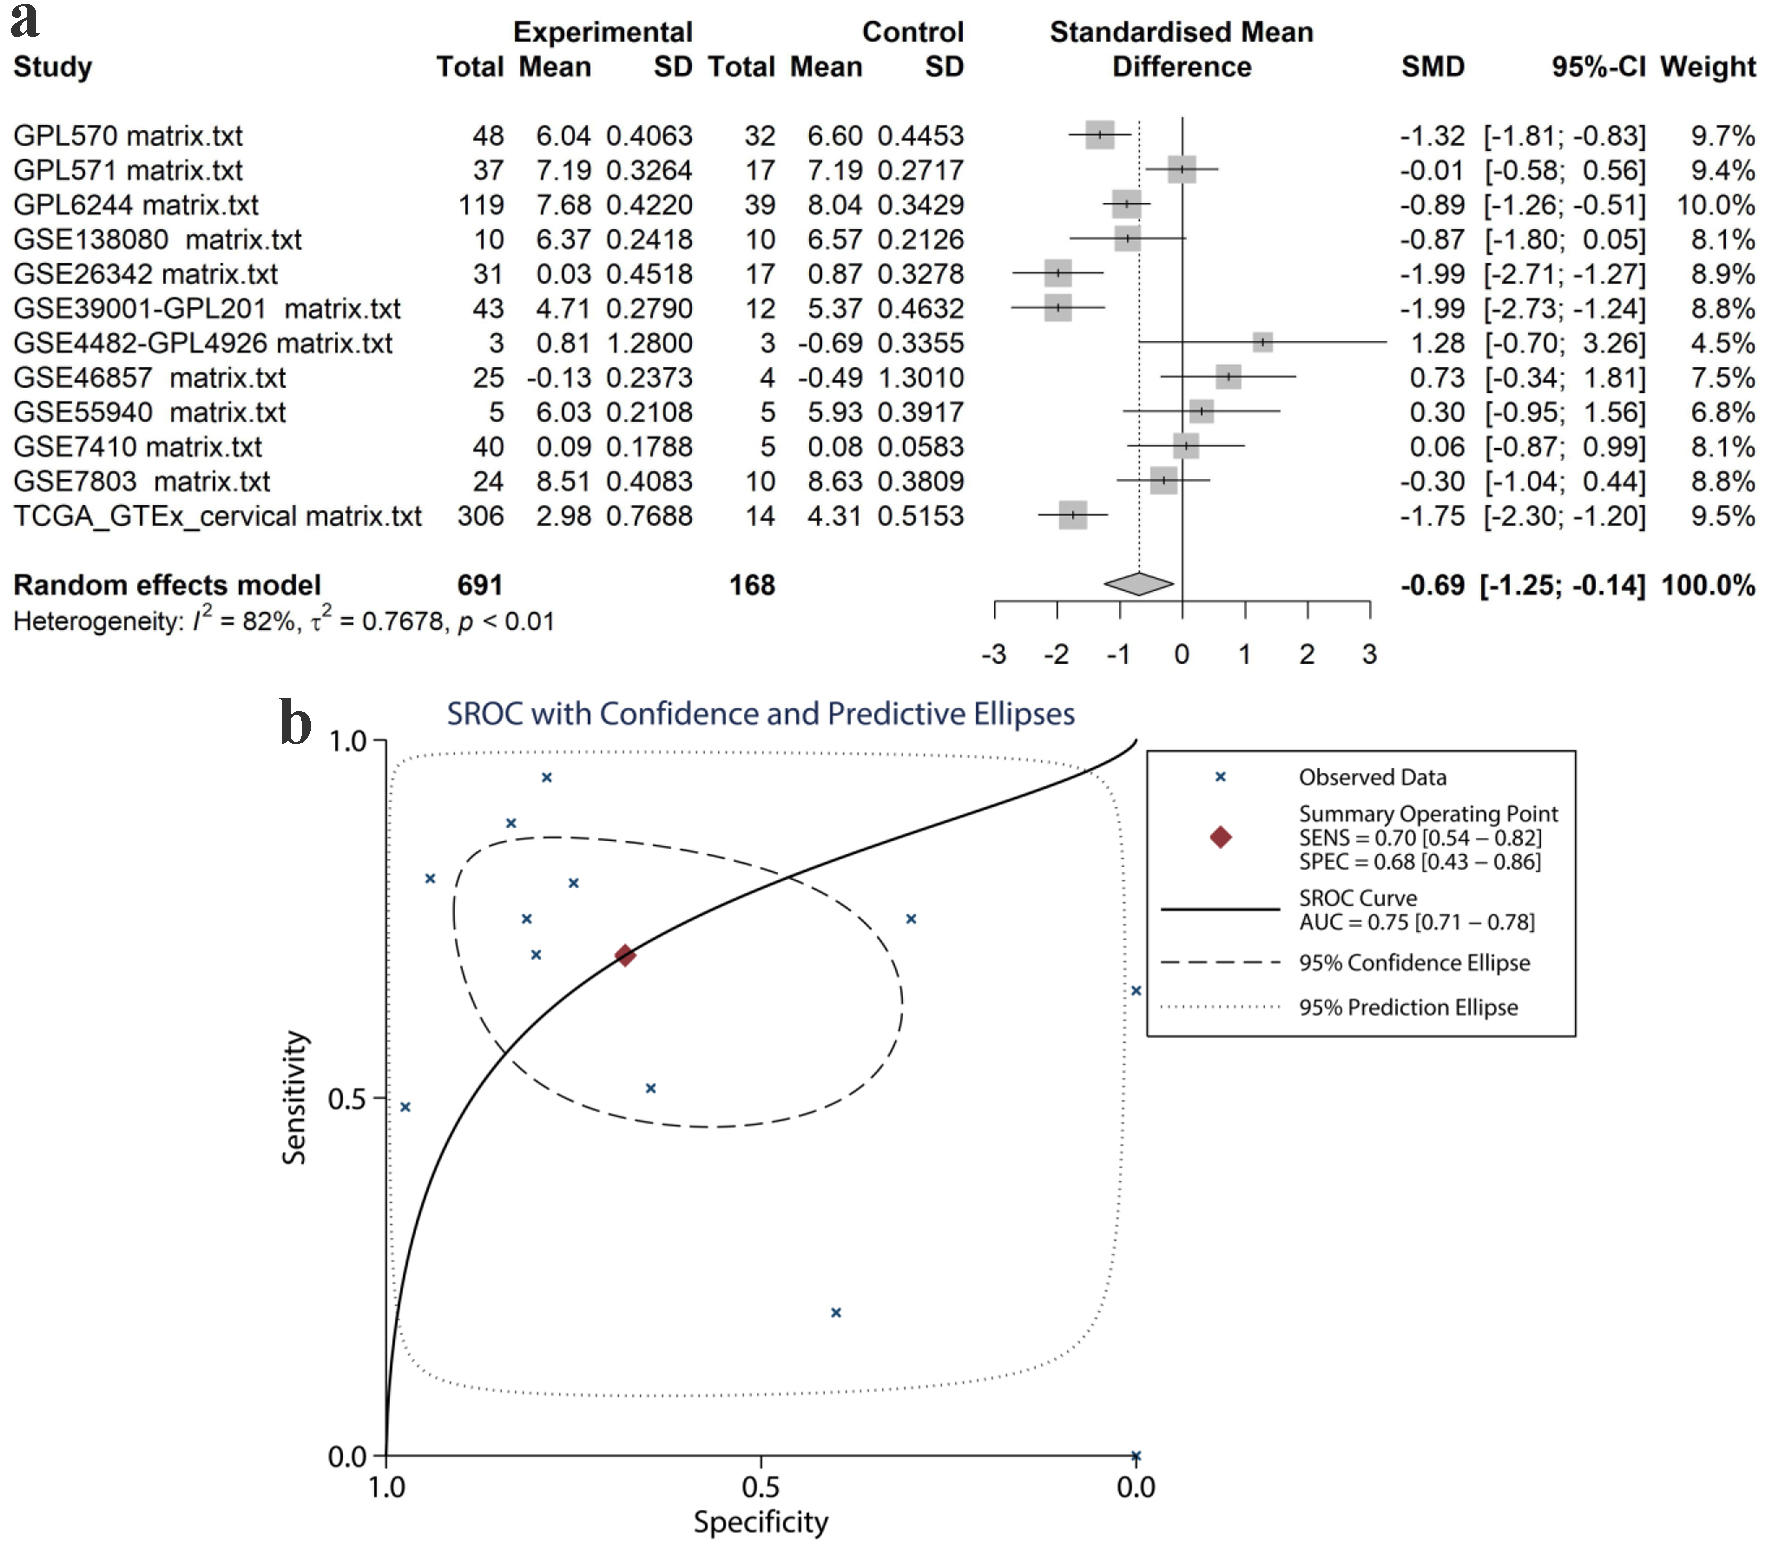
Using the in-house tissue microarray data, a final set of 16 studies were combined to determine the comprehensive expression level of TK1 in the CESC tissue samples. For TK2, a total of eight datasets including seven GEO microarrays and one RNA-seq dataset were integrated for overall appraisal of TK2 expression in CESC and non-cancer cervical tissues. The SMD was 2.44 (95% confidence interval (CI): 1.36 - 3.51) and -0.69 (95% CI: -1.25 to -0.14) for TK1 (980 cases of CESC and 422 non-cancerous controls) and TK2 (691 cases of CESC and 168 non-cancerous controls), respectively (Figs. 7a, 8a). Meanwhile, the summarized AUC was 0.88 (95% CI: 0.85 - 0.90) with a sensitivity of 0.85 and a specificity of 0.74 for TK1, and 0.75 (95% CI: 0.71 - 0.78) with a sensitivity of 0.70 and a specificity of 0.68 for TK2 (Figs. 7b, 8b). This integrative calculation confirmed remarkably increased expression of TK1 and decreased expression of TK2 in the CESC tissue samples based on the results of the various above-mentioned detection methods.
 Click for large image |
Figure 7. Pooled TK1 expression in CESC tissues. (a) SMD forest. (b) sROC curve. SMD: standardized mean difference; sROC: summarized receiver’s operating characteristics. |
 Click for large image |
Figure 8. Pooled TK2 expression in CESC tissues. (a) SMD forest. (b) sROC curve. SMD: standardized mean difference; sROC: summarized receiver’s operating characteristics. |
The upregulation of TK1 protein expression levels in CESC tissue samples in-house
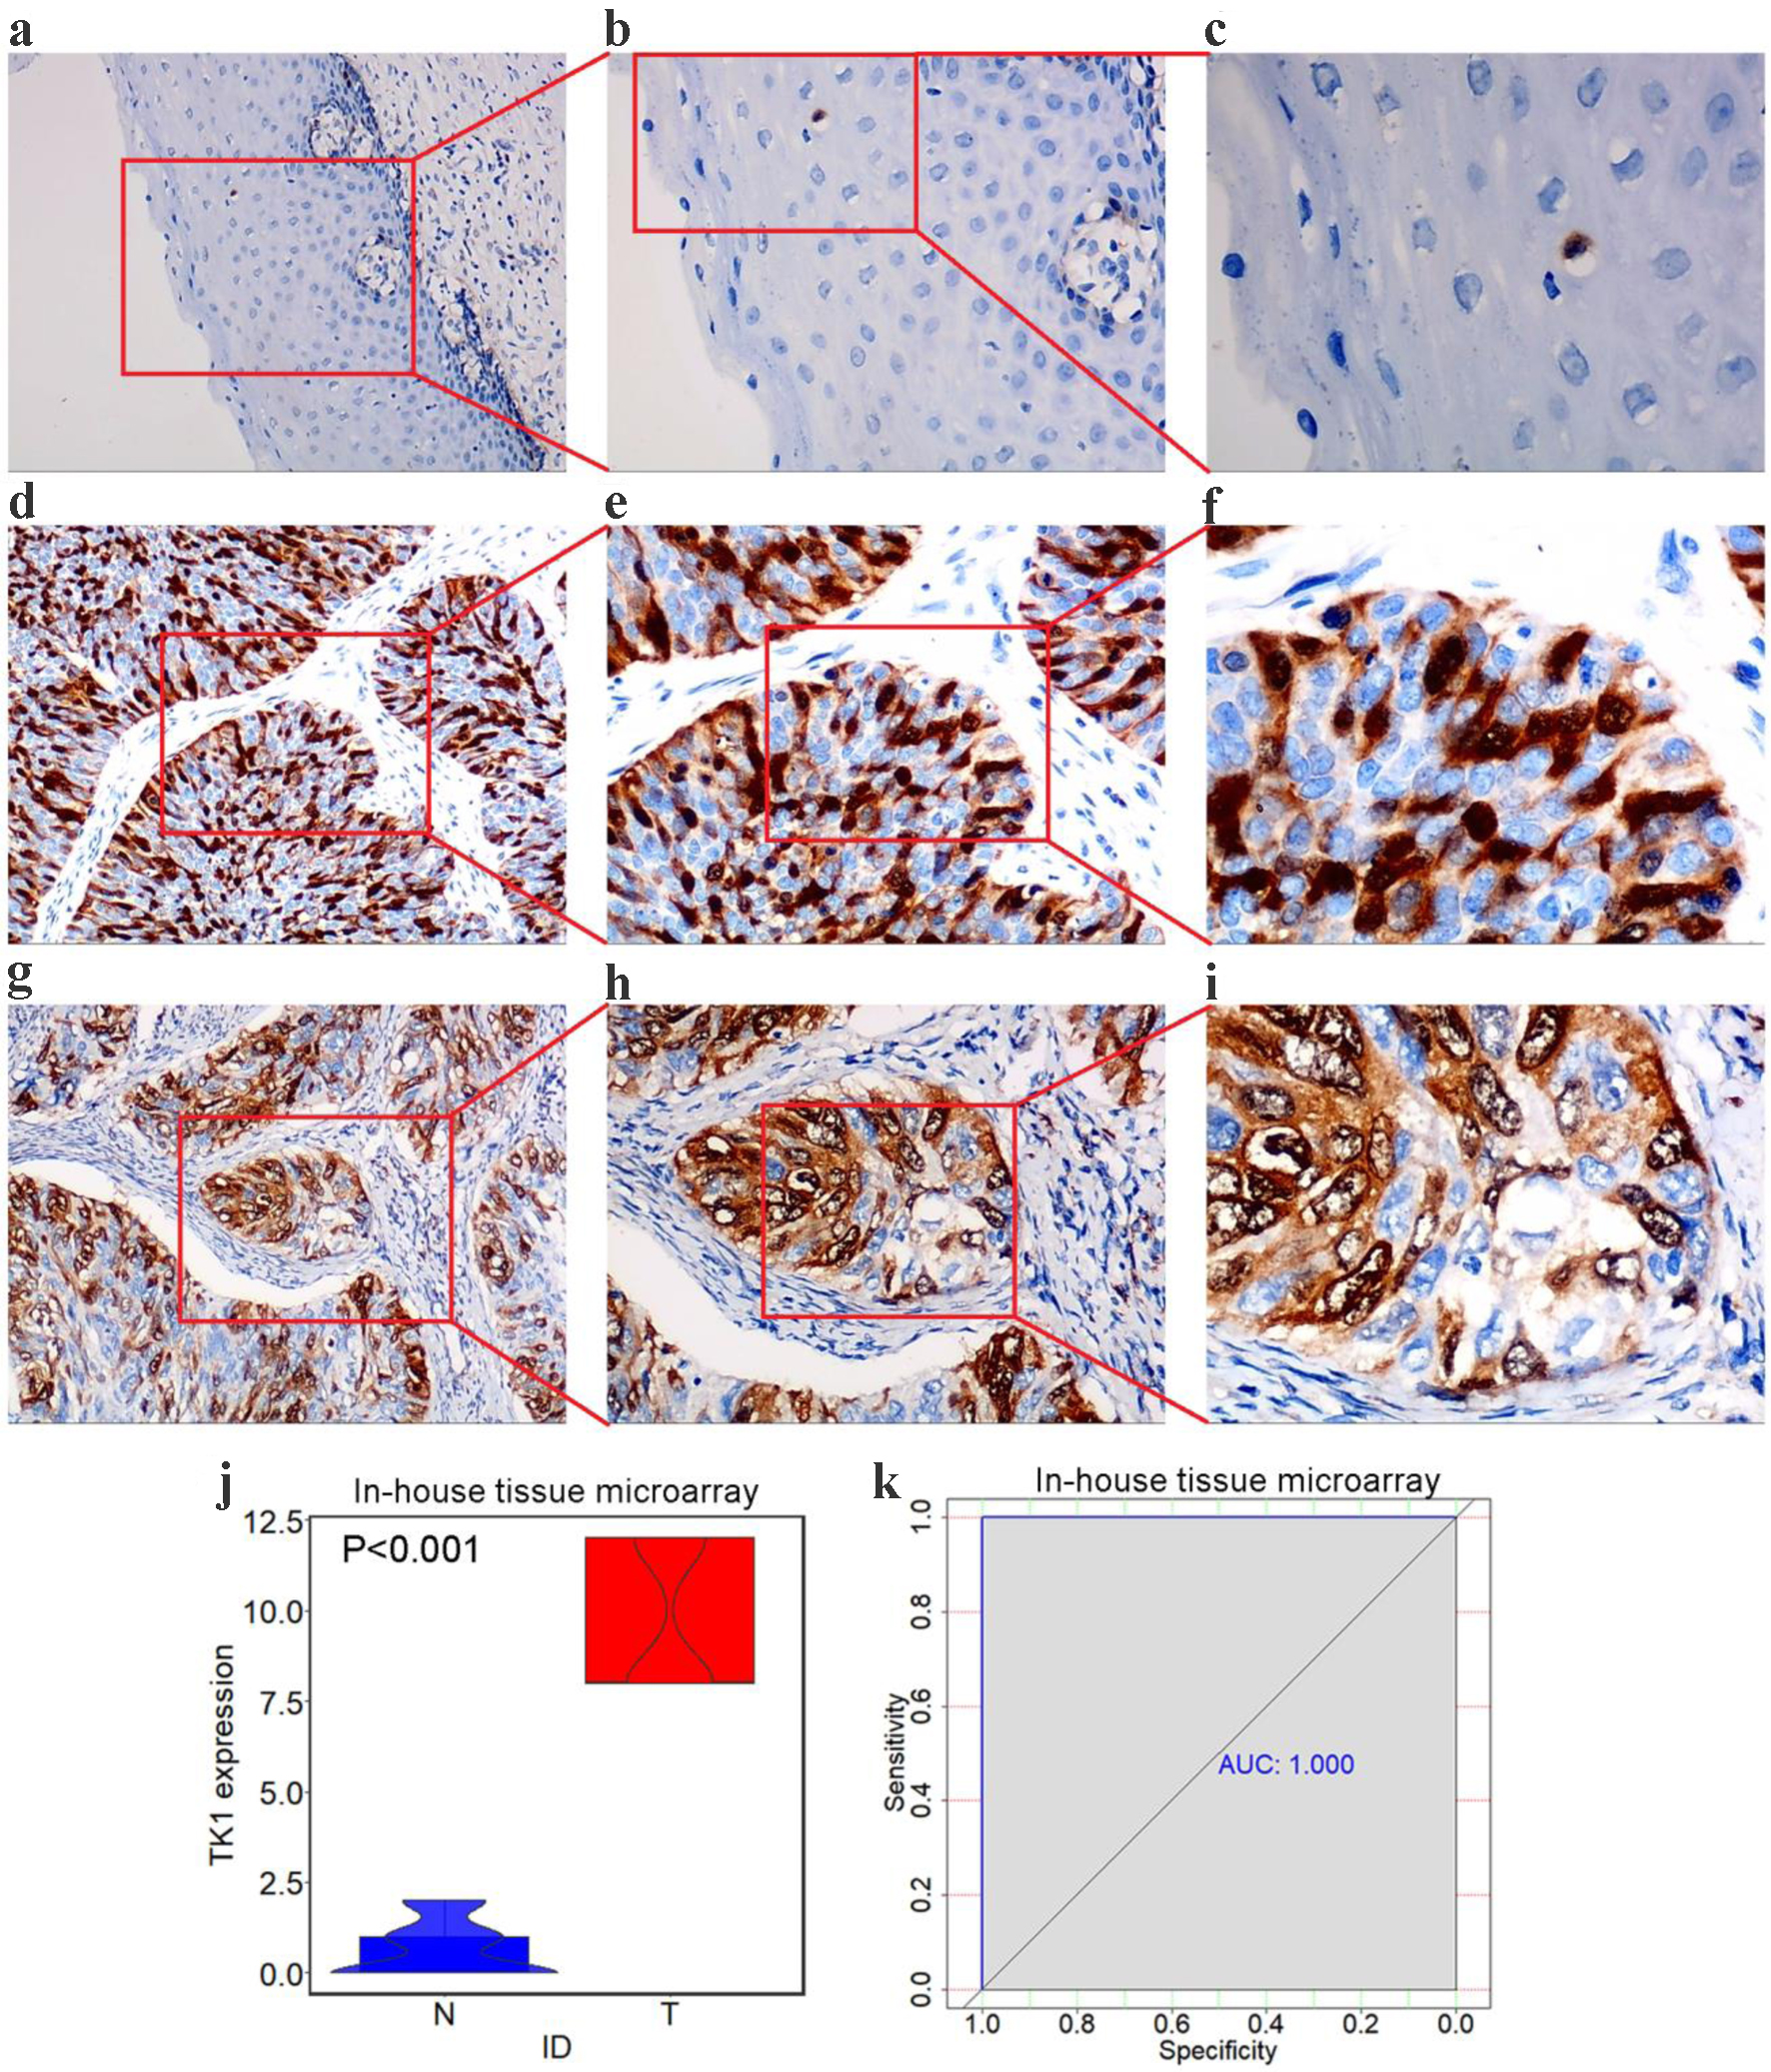
In the non-cancerous tissue samples of cervix, there were scattered nucleus-positive cells in the squamous epithelial cells, and the distribution of the positively stained cells was sporadic (Fig. 9a-c). However, in the CESC tissue samples, in addition to nucleus-positive cancer cells, a large number of nuclei and cytoplasm-positive cells were observed (Fig. 9d-i). The relative protein expression level of TK1 was 9.806 ± 2.007 in the CESC tissue samples, strikingly higher than that in the control tissue samples (0.661 ± 0.788, P < 0.001, Fig. 9j-k).
 Click for large image |
Figure 9. TK1 protein levels in CESC from tissue microarrays. (a) Negative staining of TK1 in non-cancer squamous epithelium tissues (× 100). (b) Negative staining of TK1 in non-cancer squamous epithelium tissues (× 200); (c) Negative staining of TK1 in non-cancer squamous epithelium tissues (× 400); (d, g) Strong staining of TK1 in CESC tissues (× 100); (e, h) Strong staining of TK1 in CESC tissues (× 200); (f, i) Strong staining of TK1 in CESC tissues (× 400); (j) Violin plots of TK1 expression in CESC and non-cancer controls; (k) ROC curves of the discriminating ability of TK1 overexpression. N: non-cancer samples; T: CESC samples; AUC: area under curve. |
The essentiality of TK1 and TK2 for biological functions of CESC cell lines
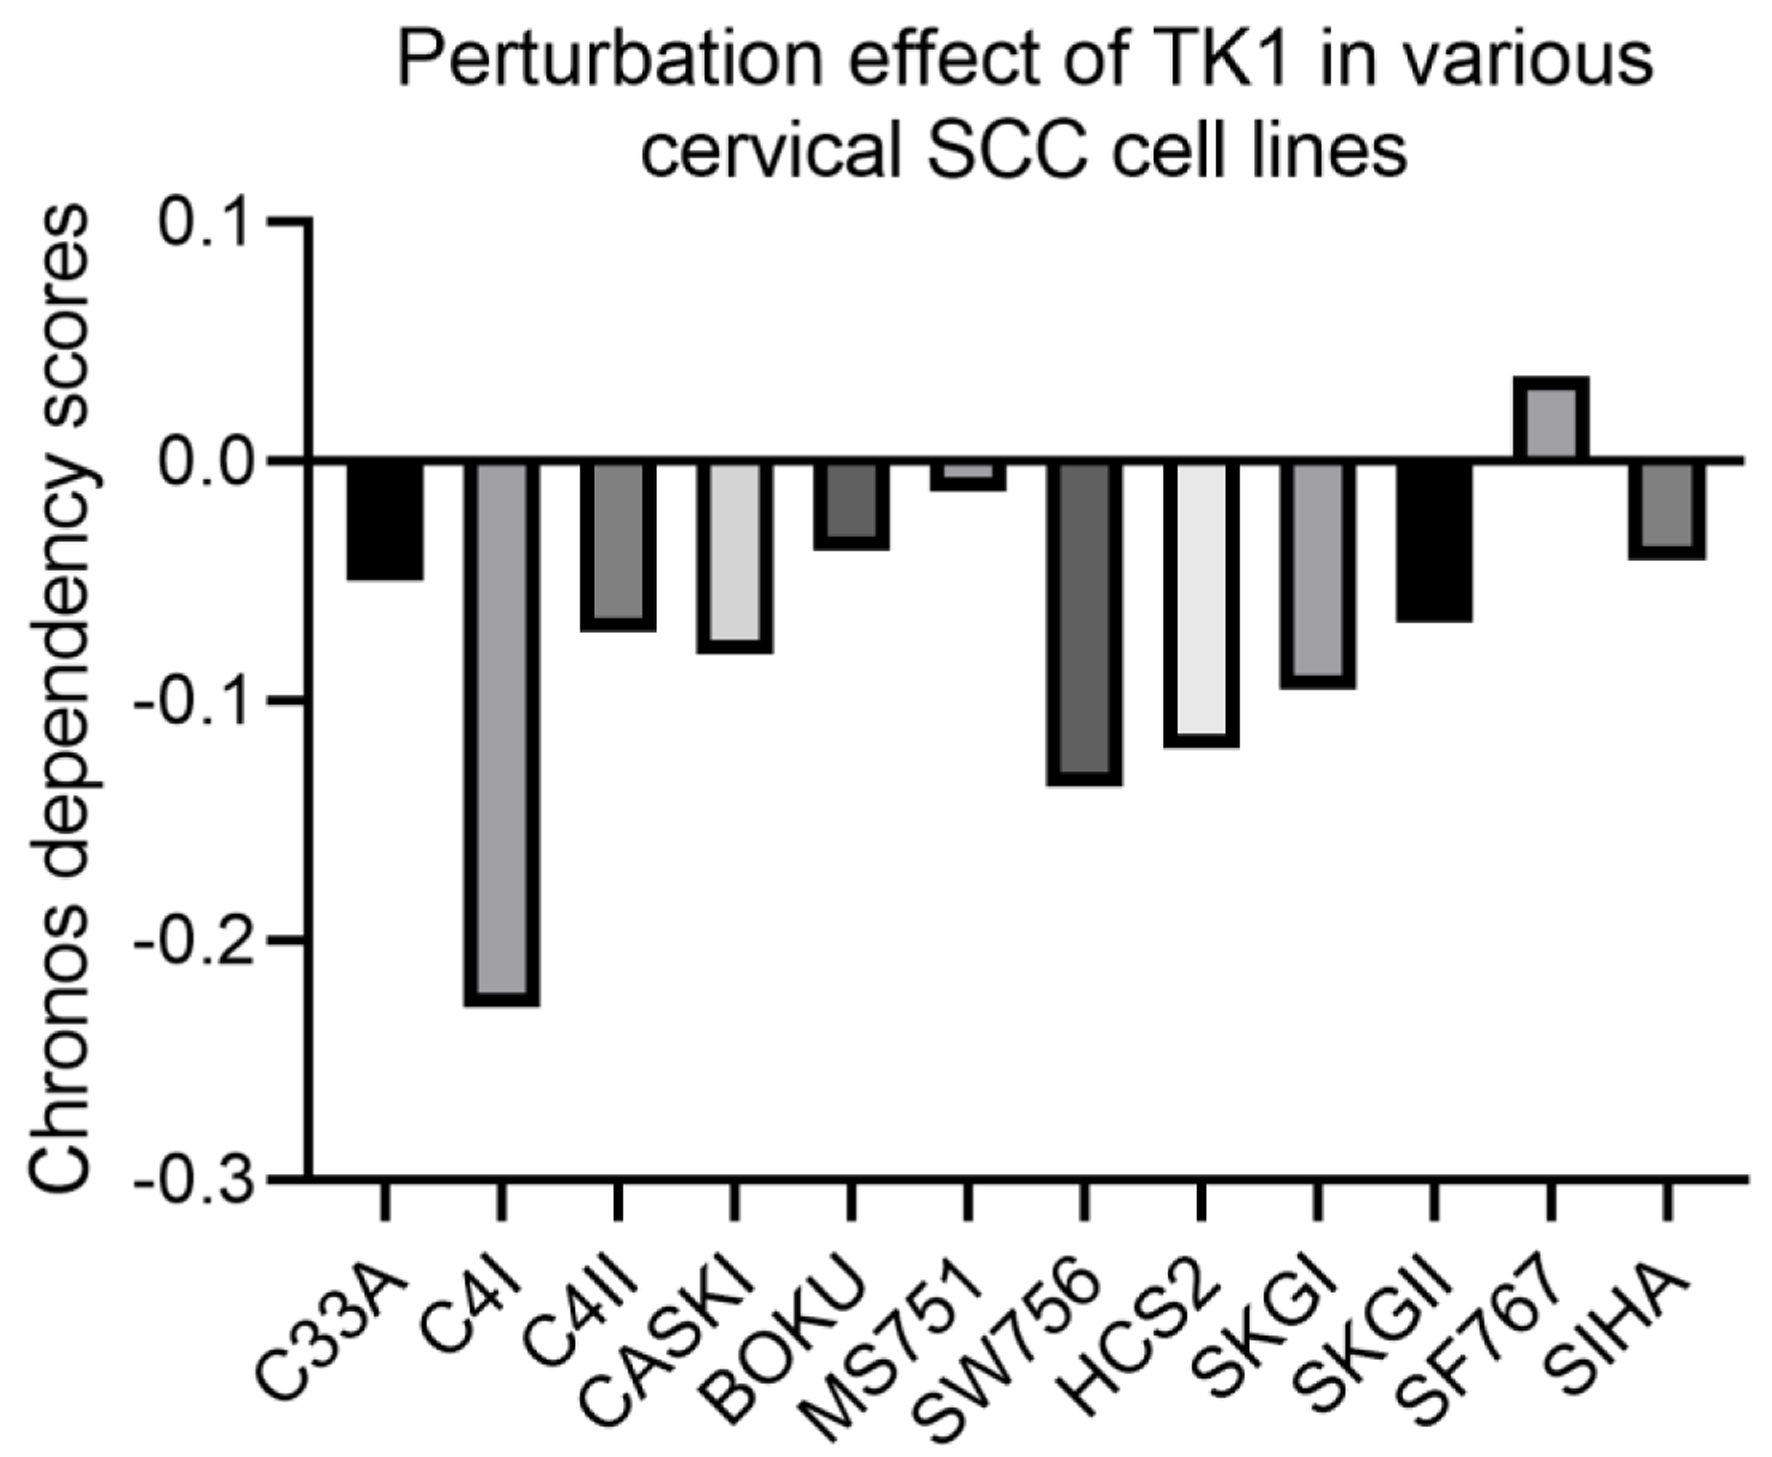
The knockout of TK1 gene showed perturbation effect on 11 CESC cells (Chronos dependency score < 0), with the most obvious effect observed in C4I cells (Chronos dependency score = -0.228) (Fig. 10), which indicated the importance of TK1 in the biological functions of the 11 CESC cell lines. The effect of knockout of TK2 gene on biological functions of CESC cell lines was unavailable from project Achilles.
 Click for large image |
Figure 10. Perturbation effect of knocking down TK1 expression in various CESC cell lines. A lower Chronos score indicates a higher likelihood that the gene of interest is essential in a given cell line. |
The prognostic value of TK genes and correlations between TK genes with clinical factors of CESC
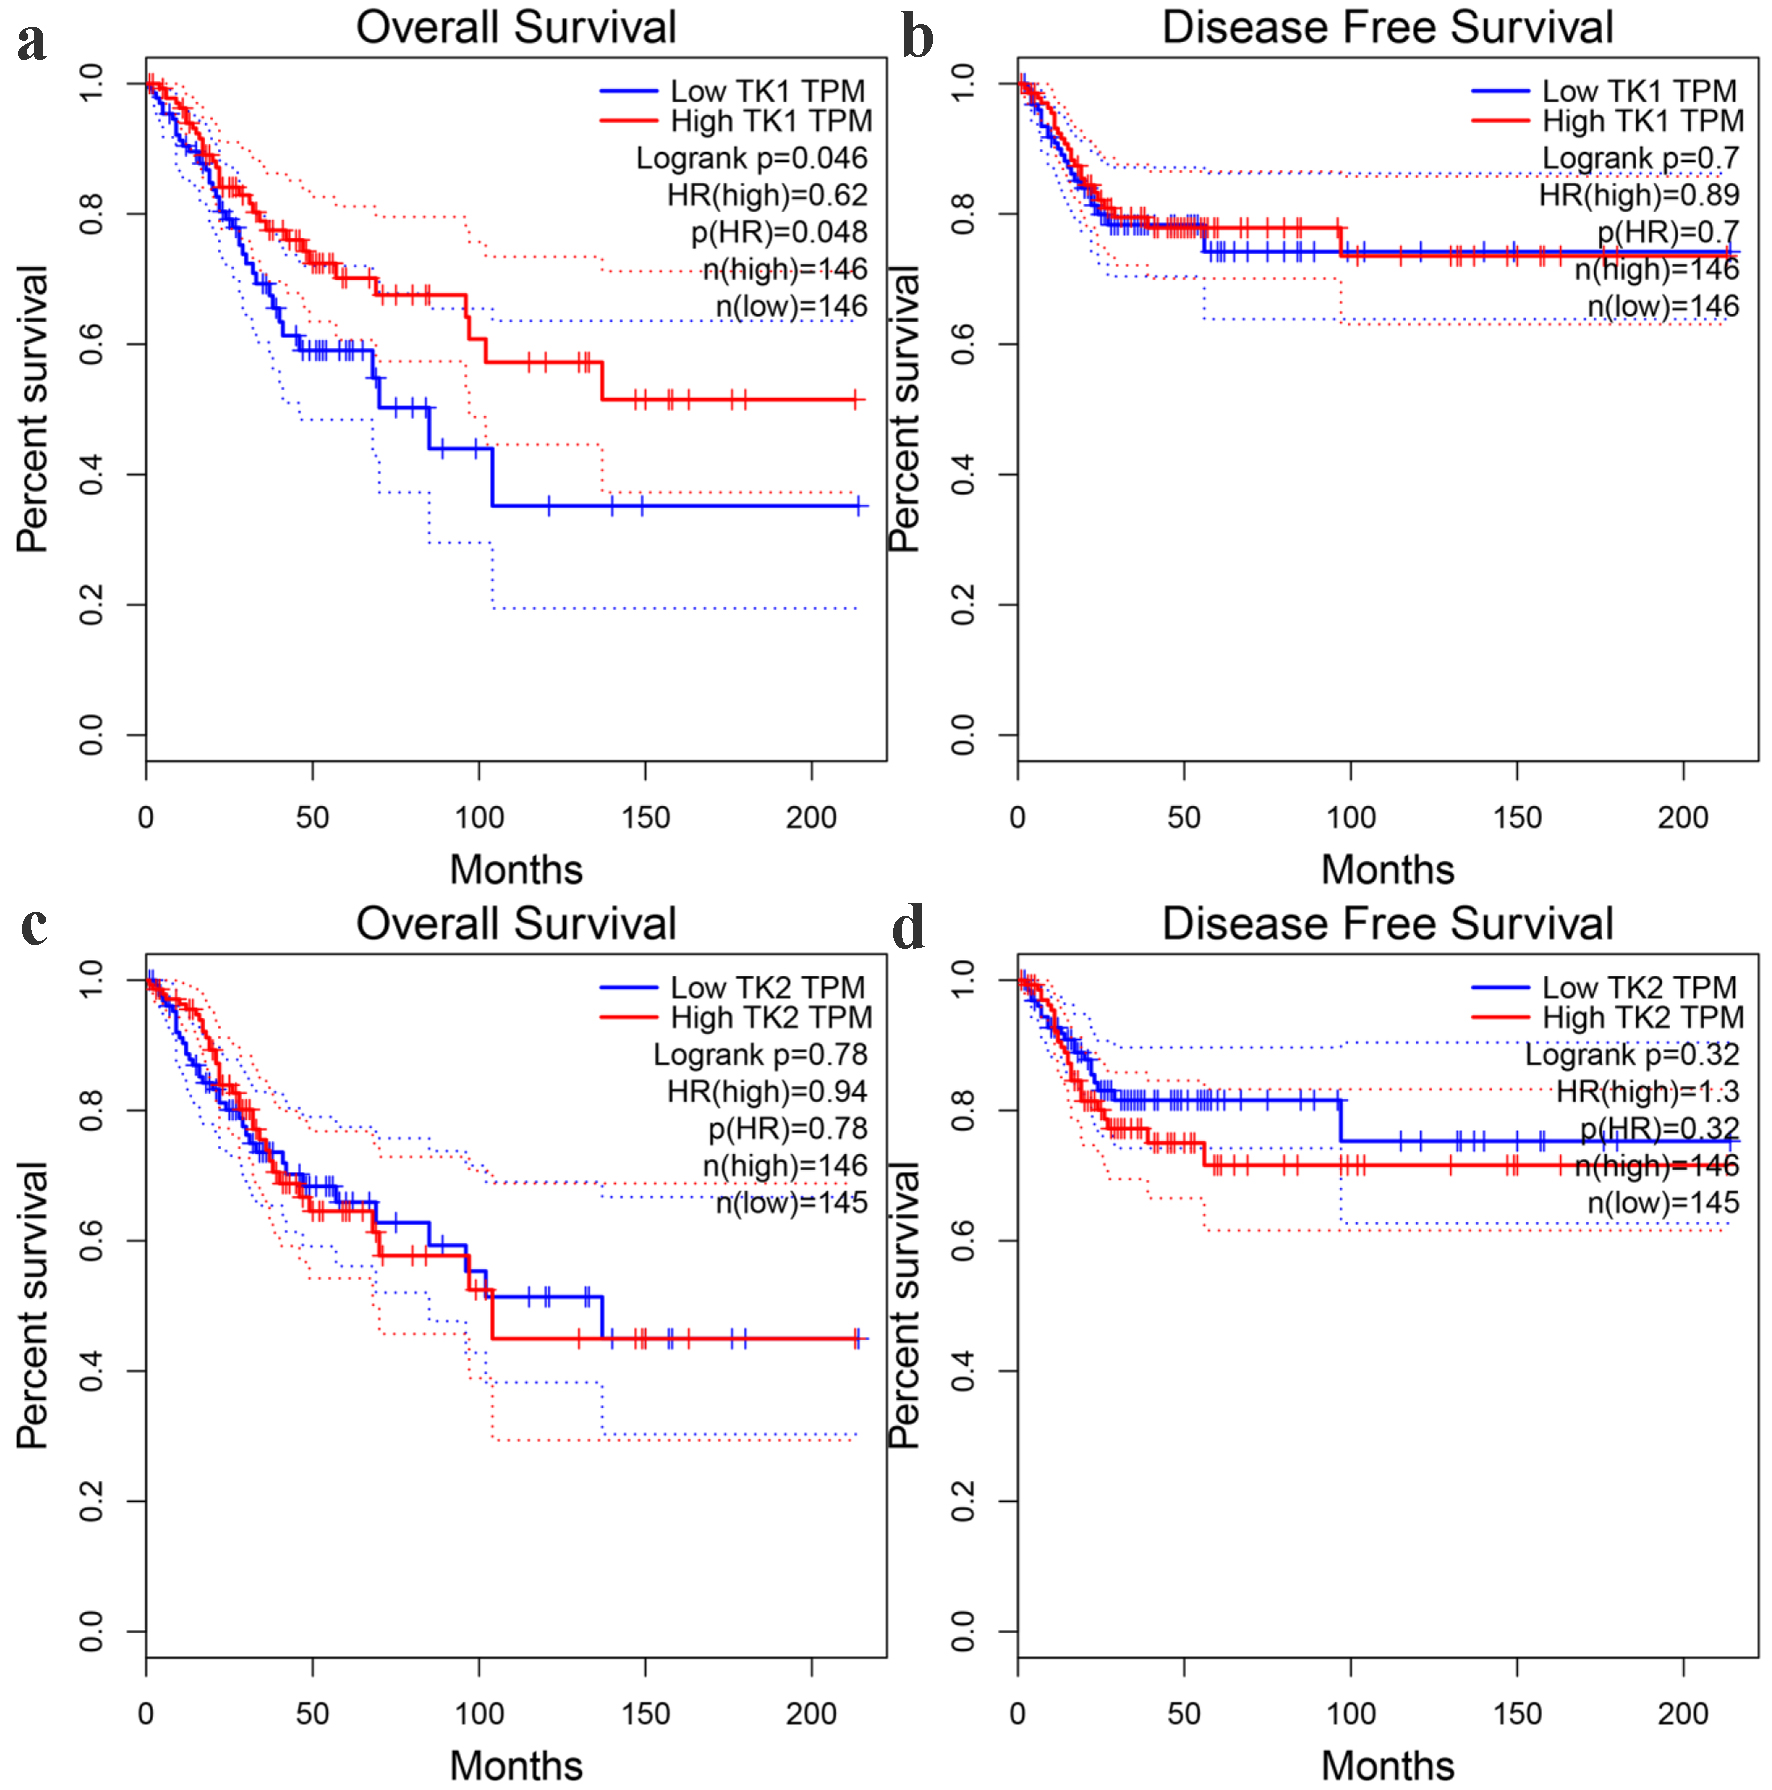
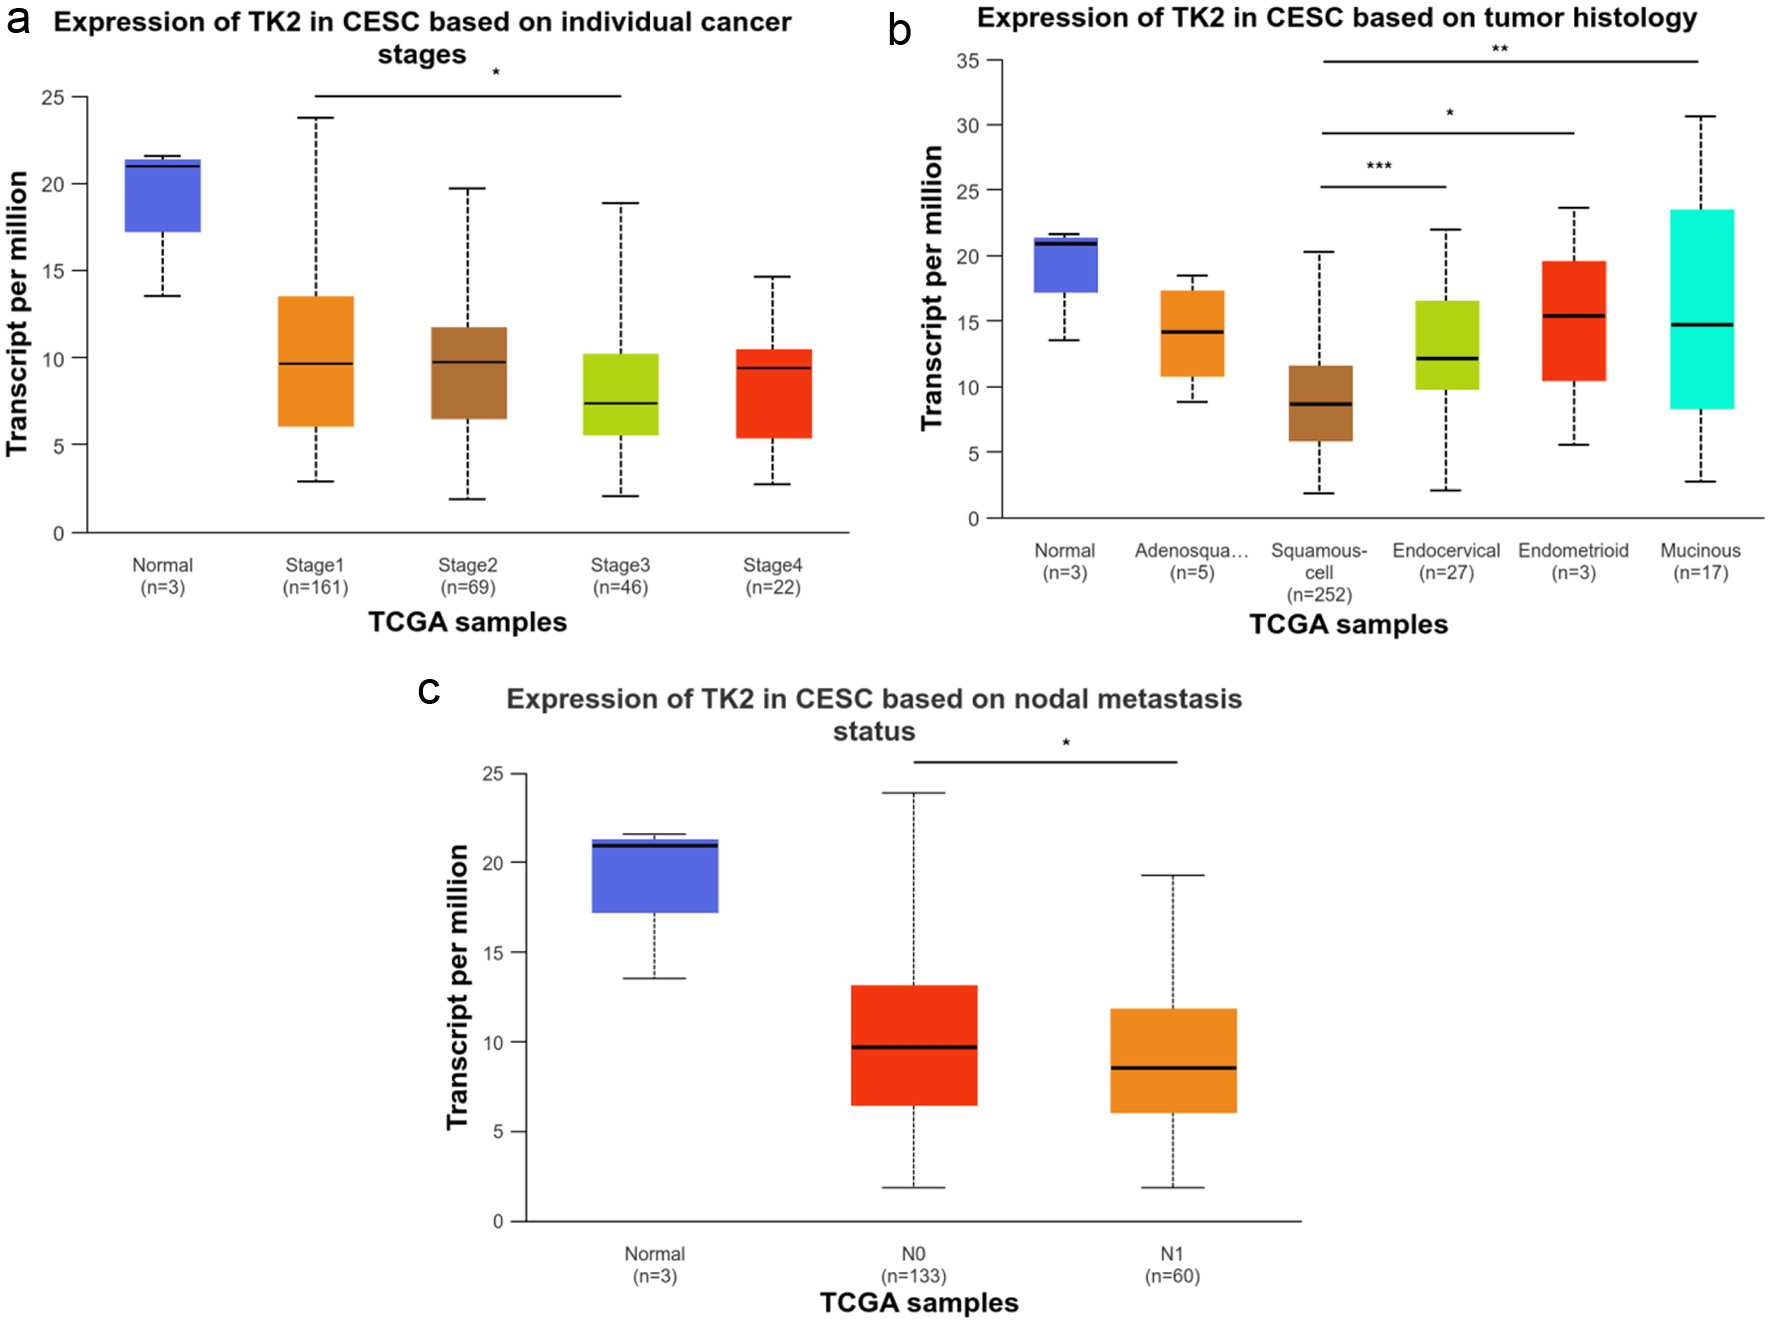
According to the prognostic analysis results, the overall survival time of CESC patients with higher TK1 expression was significantly longer than CESC patients with lower TK1 expression (P < 0.05) (Fig. 11a). There was no obvious difference between the disease-free survival and overall survival of CESC patients in other groups (Fig. 11b-d). Clinical analysis on relationship between TK gene expression and parameters of CESC patients revealed that CESC patients with stage 3, histological subtype of squamous cell, node metastasis and nodal metastasis presented significantly lower TK2 expression than CESC patients with stage 1, histological subtype of endocervical, endometrioid or mucinous without nodal metastasis (P < 0.05) (Fig. 12), which indicated the positive effect of TK2 upregulation on curbing the clinical progression of CESC. No significant difference was observed in CESC patients of different clinical groups with high or low TK2 expression.
 Click for large image |
Figure 11. The prognostic significance of TK1 and TK2 expression for CESC. (a) Kaplan-Meier survival curves for overall survival of CESC patients with low or high TK1 expression. (b) Kaplan-Meier survival curves for disease-free survival of CESC patients with low or high TK1 expression. (c) Kaplan-Meier survival curves for overall survival of CESC patients with low or high TK2 expression. (d) Kaplan-Meier survival curves for disease-free survival of CESC patients with low or high TK2 expression. HR: hazard ratio. |
 Click for large image |
Figure 12. The relationship between TK2 expression and the clinical progression of CESC. (a) TK2 expression in CESC patients with different cancer stages. (b) TK2 expression in CESC patients with different tumor histology. (c) TK2 expression in CESC patients with different status of nodal metastasis. |
Mutation and correlation analysis of TK1 and TK2 genes in sequencing samples
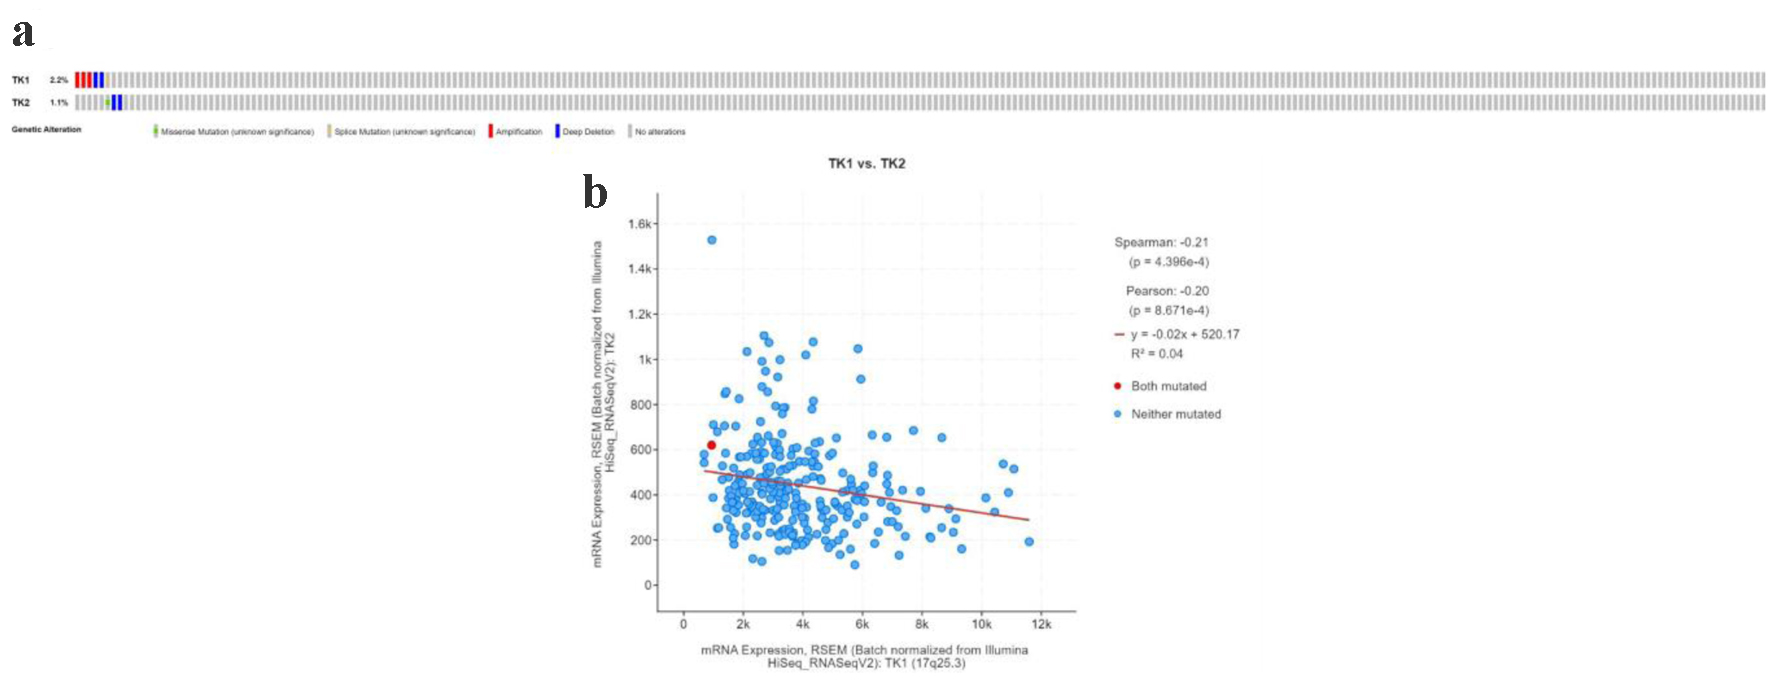
Our data analysis revealed that in a dataset of 278 sequencing samples, mutations were observed in six cases (2.2%) for the TK1 gene and in three cases (1.1%) for the TK2 gene. Specifically, for TK1, there were three instances of gene amplification, two instances of deep deletions, and one instance of splicing mutation; for TK2, there were two instances of deep deletions and one instance of a missense mutation (Fig. 13a). Co-expression analysis of TK1 and TK2 demonstrated a negative correlation between the mRNA expression levels of TK1 and TK2 (Fig. 13b), further validating the previous findings.
 Click for large image |
Figure 13. The TK1 and TK2 gene alterations in CESC patients. (a) The mutation type of TK1 and TK2 in CESC patients. (b) The expression of TK1 and TK2 showed a negative correlation. |
The correlations between TK1 or TK2 expression and immune infiltration of CESC tissue samples
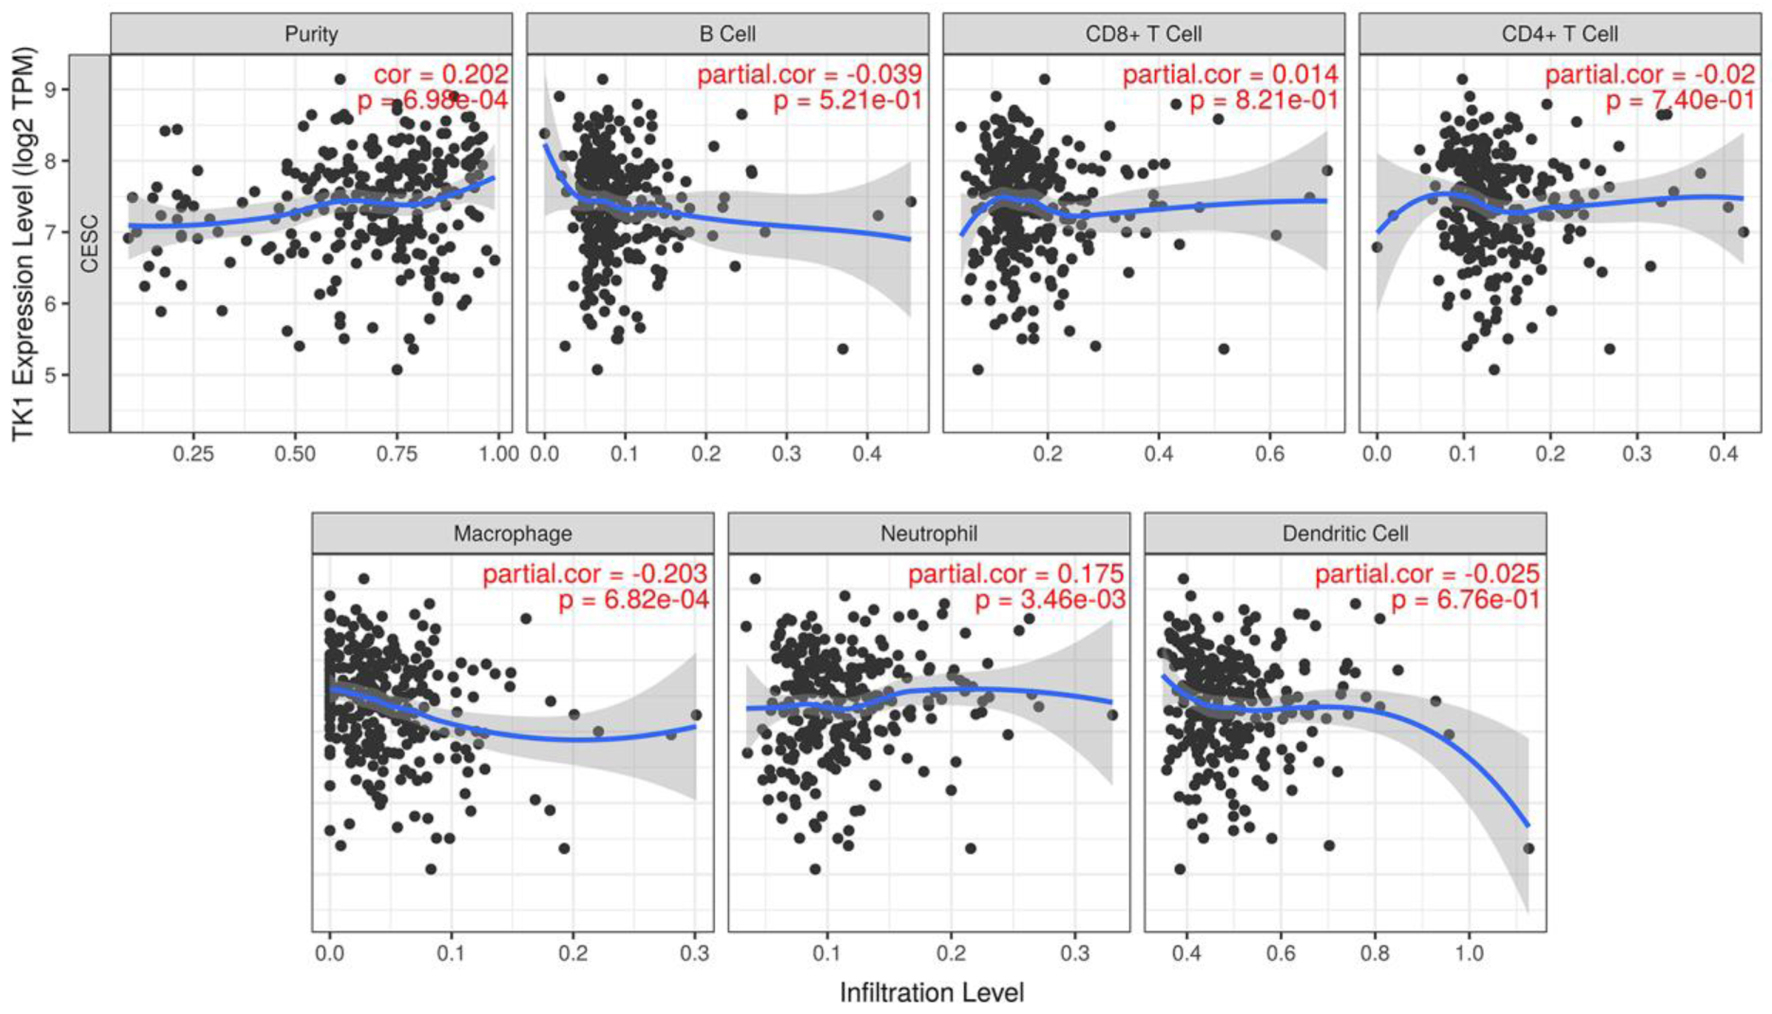
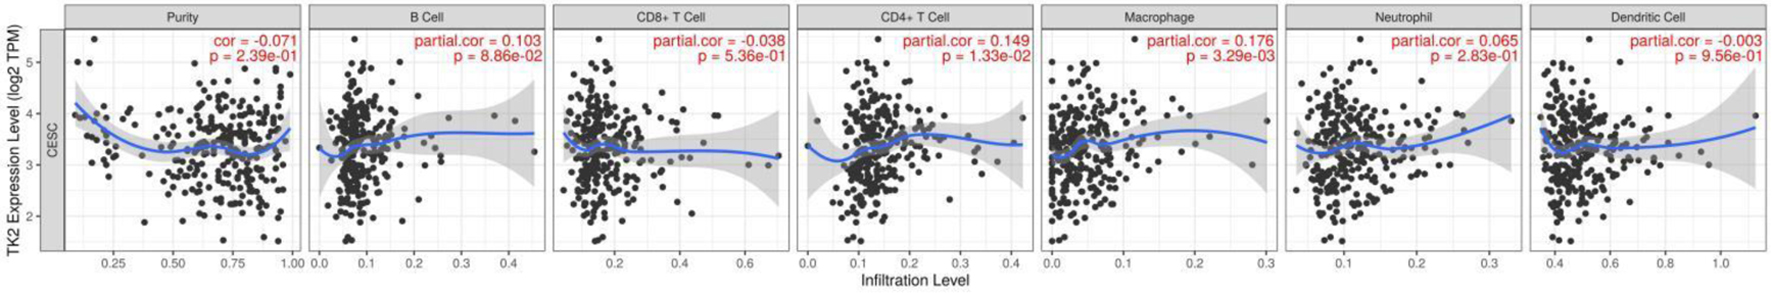
Among all the immune infiltrates, macrophages and neutrophils were found to be related to the TK1 expression levels in the CESC tissue samples. Specifically, a negative correlation was observed between macrophages and TK1 expression, with an index of -0.203 (P < 0.01). On the contrary, there was positive association between TK1 expression and neutrophils, with an index of 0.175 (P < 0.01, Fig. 14). The upregulation of TK2 was positively correlated with the infiltration of CD4+ T cells (r = 0.149, P < 0.05) and macrophages (r = 0.176, P < 0.01) (Fig. 15). These data indicated that TK1 or TK2 overexpression might be related to patient immune status with the involvement of CD4+ T cells, macrophages and neutrophils.
 Click for large image |
Figure 14. The correlations between TK1 expression and the infiltration level of immune cells in CESC. Scatter plot of the correlations between TK1 expression and immune infiltration. TPM: transcripts per kilobase million. |
 Click for large image |
Figure 15. The correlations between TK2 expression and the infiltration level of immune cells in CESC. Scatter plot of the correlations between TK2 expression and immune infiltration. TPM: transcripts per kilobase million. |
The signaling pathways of TK1 or TK2-related genes in the CESC tissue samples
Finally, the number of the positively-related genes of TK1 that were also upregulated in CESC was 99. Several gene annotations and signaling pathways related to cancer cell growth and spread were revealed by the GO and KEGG analysis: extracellular matrix from cellular component gene annotation, extracellular matrix structural constituent from molecular function gene annotation, and Ras signaling pathway, PI3K-Akt signaling pathway, cGMP-PKG signaling pathway and calcium signaling pathway from KEGG pathway annotation (Supplementary Figures 1-4, Supplementary Table 1, wjon.elmerpub.com). A total of 378 genes negatively related with TK1 were also downregulated in the CESC tissue samples. Gene annotations from biological process terms such as DNA replication, DNA-dependent DNA replication, and G1/S transition of the mitotic cell cycle corresponded to these genes. In KEGG analysis, the first three significantly enriched pathways were consistently DNA replication, cell cycle, and mismatch repair for these genes (Supplementary Figures 5-8, Supplementary Table 2, wjon.elmerpub.com). As for TK2, the number of positively-related genes of TK1 that were also downregulated in CESC was 528. Several gene annotations and signaling pathways related to system development and focal adhesion were revealed by the GO and KEGG analysis: urogenital system development, renal system development, Wnt signaling pathway, FoxO and AMPK signaling pathways (Supplementary Figures 9-12, Supplementary Table 3, wjon.elmerpub.com). A total of 377 genes negatively related with TK1 were also upregulated in the CESC tissue samples. Gene annotations from biological process terms such as negative regulation of cell cycle process, epidermis development, and negative regulation of cell cycle phase transition corresponded to these genes. In KEGG analysis, the first three significantly enriched pathways were cell cycle, proteasome, and homologous recombination for these genes (Supplementary Figures 13-16, Supplementary Table 4, wjon.elmerpub.com).
Vorinostat specifically targets TK1 and TK2 in CESC
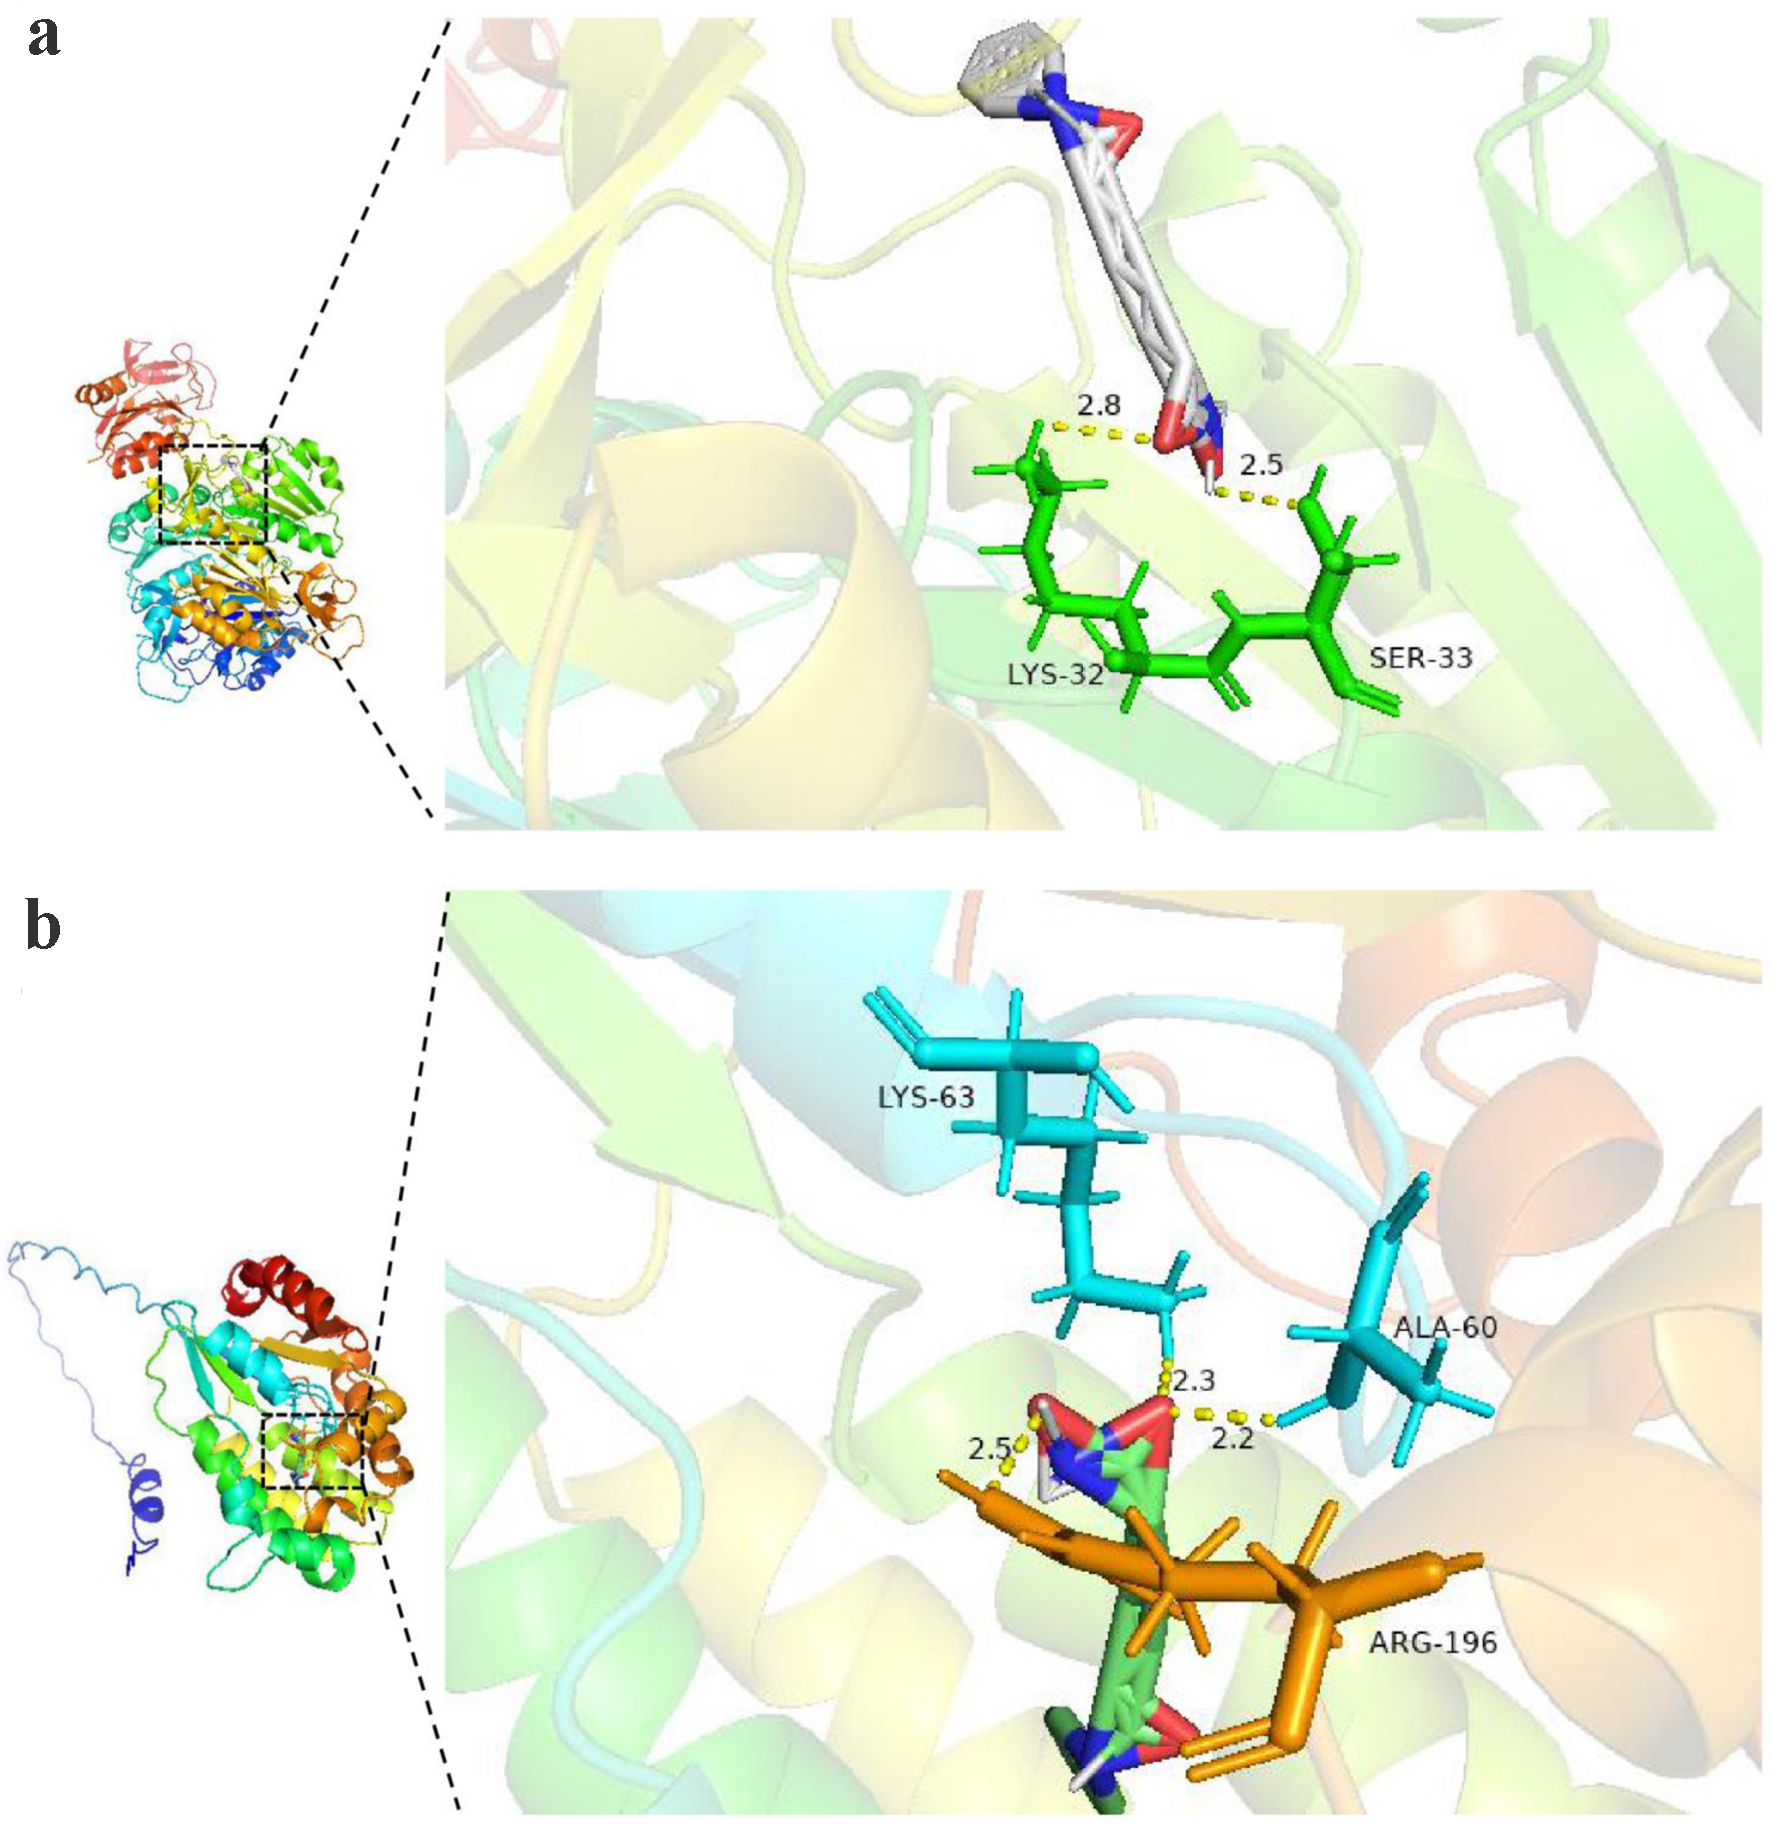
To identify potential therapeutic agents that target TK1 and TK2, we first conducted a screening to identify drugs (Tables 2 and 3). Vorinostat, which acts on both TK1 and TK2, was selected for further investigation. Subsequent molecular docking studies were conducted to assess the specific interactions of vorinostat with TK1 and TK2. Notably, vorinostat forms hydrogen bonds with LYS-32 and SER-33 in TK1, and with ARG-196, LYS-63, and ALA-60 in TK2. These molecular interactions are illustrated in Figure 16a, b.
Click to view |
Table 2. Top 10 Drugs With the Smallest Fold
Changes Targeting TK1 |
Click to view |
Table 3. Top 10 Drugs With the Smallest Fold
Changes Targeting TK2 |
 Click for large image |
Figure 16. The molecular docking model of targeted protein and vorinostat (a: TK1 protein; b: TK2 protein). |
| Discussion | ▴Top |
The novel contribution of the present study is the collection of TK1 and TK2 expression data from global sources assessed by various detection methods. The results confirmed that TK1 expression was upregulated while TK2 was downregulated in the CESC tissue samples. The overexpression of TK1 protein may play a crucial role in the carcinogenesis of CESC, which may be achieved partly by promoting the pathways of cell DNA replication and cell growth. Conversely, the overexpression of TK2 protein might exert suppressing effect on the progression of CESC through interfering cell cycle phase transition, Wnt signaling pathway, FoxO and AMPK signaling pathways.
To date, only two studies have reported on the clinical roles of TK1 in CESC tissue samples [27, 28], both of which are subject to important limitations. One study only examined the protein expression level of TK1 using immunohistochemical analysis in 84 cases of CESC tissue samples from Fujian Provincial Cancer Hospital, China. The sample size was small and the results do not reflect global trends in TK1 expression in CESC. Furthermore, the study did not investigate the mRNA level of TK1. Lastly, the researchers did not explain the potential mechanism of the overexpression of TK1 protein levels in CESC [28]. The second study used three public gene chips and calculated the common DEGs. They reported that TK1 was one of the upregulated mRNAs in three gene chips, including GSE63514, GSE9750, and GSE7803. However, the researchers did not describe the exact expression levels of TK1 individually in each gene chip or comprehensively across all the sources. Moreover, even though more than three public high-throughput datasets are available across different sources, this study used only three of them, which means it is not representative of the global status of TK1 mRNA levels. Finally, this study did not explore the molecular mechanism of TK1 in CESC, as it focused on the DEGs of cervical cancer only [27]. Besides, there lacks studies on the role of TK2 in the initiation and development of CESC. Compared to these previous two studies, the current study provides the following novel contributions.
First, the present study had the advantage of sampling a larger number of cases compared to the previous studies available. It involved the analysis of a total of 980 CESC cases and 422 controls, which makes the results on the expression of TK1 and TK2 more credible and generalizable. Second, this study included data from 23 research centers, covering six countries and regions, including China, India, The Netherlands, Mexico, the United Kingdom, and the United States. The results better reflect the overall global situation of TK1 upregulation and TK2 downregulation. Third, this study used a variety of detection methods to determine the upregulation of TK1, including gene microarray, RNA-seq, immunohistochemistry of tissue samples, and the calculation of SMD and sROC by integration, which verifies the findings of the paper via multiple methods. Lastly, to our knowledge, no studies to date have investigated the mechanism of TK1 upregulation and TK2 downregulation in CESC. Also, our study has identified, for the first time, that the expression of TK genes was closely correlated with the infiltration of immune cells such as CD4+ T cells, macrophages, and neutrophils. Additionally, we disclosed through functional annotations that TK1 or TK2-related genes are enriched in some pathways closely related to cell growth and cell cycle. This study provides a solid experimental basis to understand the specific mode of TK1 and TK2 action and will be helpful to future translational research on TK genes in CESC.
TK1 is a protein that can be secreted into the blood, so non-invasive detection methods from serum or plasma have become a reality in clinical work to monitor TK1-related tumors. Indeed, increasing serum TK1 levels have also been detected in several tumors and they can even predict disease progression, including breast cancer [23, 26, 54-57], prostate cancer [19], lung cancer [26], Hodgkin’s lymphoma [58], hepatocellular carcinoma [59], colon cancer [23], and head and neck cancer [20]. TK1 appears to have great potential to act as a promising extra diagnostic and predictive biomarker in patients with some cancers. Unfortunately, to date, no studies have reported on the expression of TK1 protein in serum or plasma in patients with CESC. Therefore, further experiments are required to confirm whether TK1 protein is upregulated in the bodily fluid of patients with CESC, and whether TK1 protein levels are similarly overexpressed in other cancers. The researchers also plan to conduct enzyme-linked immunosorbent assays to test TK1 protein levels in the serum of CESC patients. Although another salvage enzyme capable of phosphorylating cellular thymidine, TK2, has been revealed by previous literature studies to generate deoxycytidine triphosphate (dCTP), thereby diminishing the anticancer effect of anti-cancer drugs such as gemcitabine [60, 61]. We discovered in the present study that TK2 showed downregulation in CESC samples compared with non-cancer cervical samples. It was further disclosed that the expression of TK2 was negatively related to the malignant progression of CESC. Further work awaits to be performed to ascertain the tumor-suppressing effect of TK2 in CESC.
We are also interested in how TK1 and TK2 works in the occurrence of CESC. We analyzed the potential mechanism of TK genes by studying the relationship between TK1 or TK2 expression and infiltration of immune cells, as well as the related signal pathways. Surprisingly, the current study’s results showed that TK1 expression was negatively related to macrophages and positively related to neutrophils; TK2 expression was positively related to CD4+ T cells and macrophages. The stromal cells are the key structural and functional components of all cancers, besides the cancer cells themselves. The stromal cells are composed of immune cells, fibroblasts, pericytes, endothelial cells, and mesenchymal (stem) stromal cells. It is conceivable that the occurrence of CESC is closely related to immune cells [62-64]. The detailed interaction of TK genes and immune cells in CESC warrants further experimental studies. Considering the important roles of TK genes in DNA synthesis and DNA damage [65, 66], we also investigated the functional enrichment of genes related to TK genes. The gene annotations and potential signaling pathways of TK1-related genes in CESC tissue samples in the current study also support the traditional theory of the molecular mechanism of TK1. Typically, the gene annotations related to DNA replication and cell cycle appeared with the TK1-related genes based on the GO analyses. Constantly, similar pathways of DNA replication, mismatch repair and cell cycle were also enriched by the KEGG analysis. In another two cancer types, in vitro experiments also confirmed the function of TK1 on cell growth [24, 67]. The loss of TK1 expression could inhibit the cell growth in thyroid carcinoma cells [24]. Furthermore, the silence of TK1 expression could also suppress the proliferative capacity of lung cancer cells [24]. In view of the higher expression of TK1 protein and mRNA in the CESC tissue samples in this study, and the fact that TK1 also clearly affects DNA synthesis and DNA repair, we hypothesize that TK1 also very likely regulates the biological characteristics of CESC cells, such as cell proliferation, invasion, and migration. The inhibitory effect of TK2 on CESC in this study might be concerned with the aberrant activity of it in proteasome, and homologous recombination, Wnt signaling pathway, FoxO and AMPK signaling pathways. Perturbation assay of TK1 knockout in CESC cell lines from project Achilles confirmed the biological function of TK1 in CESC.
Vorinostat, a well-established histone deacetylase inhibitor, modifies chromatin dynamics to regulate gene expression, potentially halting cancer cell proliferation [68]. This compound, by altering acetylation patterns of histone proteins, impacts transcriptional regulation, which is crucial for cancer therapy [69]. The drug’s properties make it a versatile agent in oncological treatments, with approvals for various malignancies, including its notable efficacy in hematological cancers such as cutaneous T-cell lymphoma [70]. The application of vorinostat extends beyond hematological malignancies into solid tumors, where studies have shown promising results in enhancing the cytotoxic effects of other therapeutic agents [71-73]. This synergistic potential is particularly significant as it could overcome resistance mechanisms that limit the efficacy of conventional treatments. In the context of non-hematological cancers, vorinostat has been explored for its role in sensitizing tumors to radiation therapy and improving the outcomes of chemotherapy [74, 75]. In CESC, recent investigations have begun to uncover the potential utility of vorinostat. Preliminary data suggest that vorinostat may disrupt cell cycle progression and induce apoptosis, making it a candidate for combination therapies aimed at enhancing cell death in CESC cells [76]. Our current research integrates molecular docking studies that demonstrate vorinostat’s interaction with TK1 and TK2, which are essential for DNA synthesis and repair. The favorable docking scores indicate a strong binding affinity, suggesting that vorinostat may effectively inhibit these enzymes, thereby stalling the DNA synthesis in tumor cells. This interaction could explain the enhanced apoptotic rates observed in treated cells and positions vorinostat as a potentially effective agent in CESC therapy. Our findings encourage further studies to validate these interactions and explore the full therapeutic potential of vorinostat in CESC management.
However, this study did not observe reduced expression of TK2 in CESC tissues at the protein level. Several factors could contribute to this discrepancy: potential post-transcriptional modifications that might affect TK2 protein stability, insufficient sensitivity of the protein detection methods employed, and possible compensatory mechanisms within the tissue that maintain stable protein levels despite reduced mRNA expression. Additionally, our study did not establish a definitive role for TK2 in the proliferation of CESC cells, indicating that the biological impact of TK2 on cell growth requires further investigation. Moreover, the molecular mechanisms suggested in our findings necessitate validation through additional in vivo and in vitro experiments to confirm their significance and reliability in the context of cervical cancer. These further studies will be crucial for clarifying the potential therapeutic implications of targeting TK2 in CESC.
Conclusions
We conducted a systematic investigation of the clinical role of TK1 and TK2 expression in CESC tissue samples and demonstrated that the aberrant expression of TK1 or TK2 mRNA and protein influenced the carcinogenesis of CESC, at least partially via interaction with immune cells or pathways related to DNA replication, proteasome, and homologous recombination. The biofunction and molecular mechanism of TK1 and TK2 on CESC cells require further in-depth study.
| Supplementary Material | ▴Top |
Figure 1. GO enrichment analysis of genes positively correlated with TK1 in CESC for biological process (BP).
Figure 2. GO enrichment analysis of genes positively correlated with TK1 in CESC within the cellular component (CC) category.
Figure 3. GO enrichment analysis of genes positively correlated with TK1 in CESC within the molecular function (MF) category.
Figure 4. Kyoto Encyclopedia of Genes and Genomes (KEGG) enrichment analysis of genes positively correlated with TK1 in CESC.
Figure 5. GO enrichment analysis of genes negatively correlated with TK1 in CESC for BP.
Figure 6. GO enrichment analysis of genes negatively correlated with TK1 in CESC for CC.
Figure 7. GO enrichment analysis of genes negatively correlated with TK1 in CESC for MF.
Figure 8. KEGG enrichment analysis of genes negatively correlated with TK1 in CESC.
Figure 9. GO enrichment analysis of genes positively correlated with TK2 in CESC for BP.
Figure 10. GO enrichment analysis of genes positively correlated with TK2 in CESC for CC.
Figure 11. GO enrichment analysis of genes positively correlated with TK2 in CESC for MF.
Figure 12. KEGG enrichment analysis of genes negatively correlated with TK2 in CESC.
Figure 13. GO enrichment analysis of genes negatively correlated with TK2 in CESC for BP.
Figure 14. GO enrichment analysis of genes negatively correlated with TK2 in CESC for CC.
Figure 15. GO enrichment analysis of genes negatively correlated with TK2 in CESC for MF.
Figure 16. KEGG enrichment analysis of genes negatively correlated with TK2 in CESC.
Table 1. Functional enrichment analysis of genes positively related to TK1 in cervical cancer.
Table 2. Functional enrichment analysis of genes negatively related to TK1 in cervical cancer.
Table 3. Functional enrichment analysis of genes positively related to TK2 in cervical cancer.
Table 4. Functional enrichment analysis of genes negatively related to TK2 in cervical cancer.
Acknowledgments
The authors have no acknowledgments.
Financial Disclosure
The authors report no funding.
Conflict of Interest
The authors declare that the research was conducted in the absence of any commercial or financial relationships that could be construed as a potential conflict of interest.
Informed Consent
Signed informed consent forms of agreeing with the use of samples were gathered from all enrolled patients.
Author Contributions
Cai Xia Liang: formal analysis and writing - original draft preparation; Man Yu Chen: data curation and investigation; Ya Jun Pang: resources and software; Long Nian Hong: methodology and visualization; Si Xia Huang: supervision and writing - review and editing; Cheng Nong Guan: project administration, conceptualization, funding acquisition, and validation.
Data Availability
The datasets generated and/or analyzed during the current study are available in the TCGA (https://portal.gdc.cancer.gov/) and GEO (https://cwww.ncbi.nlm.nih.gov/gds) databases.
| References | ▴Top |
- Bray F, Laversanne M, Sung H, Ferlay J, Siegel RL,
Soerjomataram I, Jemal A. Global cancer statistics 2022: GLOBOCAN estimates of incidence and
mortality worldwide for 36 cancers in 185 countries. CA Cancer J Clin.
2024;74(3):229-263.
doi pubmed - Siegel RL, Miller KD, Fuchs HE, Jemal A. Cancer statistics,
2021. CA Cancer J Clin. 2021;71(1):7-33.
doi pubmed - Wang Z, Guo E, Yang B, Xiao R, Lu F, You L, Chen G. Trends
and age-period-cohort effects on mortality of the three major gynecologic cancers in China from
1990 to 2019: Cervical, ovarian and uterine cancer. Gynecol Oncol. 2021;163(2):358-363.
doi pubmed - Ma MJ, Wang YN, Zhu JF, Wang XY, Jin YB, Liu XN, Wu SF, et
al. Characterization of HPV subtypes not covered by the nine-valent vaccine in patients with CIN
2-3 and cervical squamous cell carcinoma. Curr Probl Cancer. 2021;45(6):100761.
doi pubmed - McGauran MFG, Pendlebury AB, Hiscock RJ, Lamont JM, Jones
APM, Grant P, Newman MR, et al. Possible high-grade squamous intraepithelial lesion (pHSIL) in
the new cervical screening paradigm: The outcomes and the role of clinicopathological review.
Aust N Z J Obstet Gynaecol. 2021;61(4):569-575.
doi pubmed - Jing H, Xiuhong W, Ying Y, Zhenrong L, Xiyun C, Deping L,
Changmei S, et al. Neoadjuvant chemotherapy combined with radical surgery for stage IB2/IIA2
cervical squamous cell carcinoma: a prospective, randomized controlled study of 35 patients.
World J Surg Oncol. 2021;19(1):209.
doi pubmed - Zhou Q, Yao X, Wu C, Chen S, Fan D. Knockdown of
Ubiquitin-Specific Protease 53 Enhances the Radiosensitivity of Human Cervical Squamous Cell
Carcinoma by Regulating DNA Damage-Binding Protein 2. Technol Cancer Res Treat.
2020;19:1533033820929792.
doi pubmed - Cui X, Wang X, Zhou X, Jia J, Chen H, Zhao W. miR-106a
regulates cell proliferation and autophagy by targeting LKB1 in HPV-16-associated cervical
cancer. Mol Cancer Res. 2020;18(8):1129-1141.
doi pubmed - Ju X, Canfell K, Howard K, Garvey G, Hedges J, Smith M,
Jamieson L. Population-based utility scores for HPV infection and cervical squamous cell
carcinoma among Australian Indigenous women. PLoS One. 2021;16(7):e0254575.
doi pubmed - Bozgeyik E, Tepe NB, Bozdag Z. Identification of microRNA
expression signature for the diagnosis and prognosis of cervical squamous cell carcinoma. Pathol
Res Pract. 2020;216(11):153159.
doi pubmed - Guo Q, Wu Y, Wen H, Ju X, Wu X. Effect of the number of
removed lymph nodes on survival in patients with FIGO Stage IB-IIA cervical squamous cell
carcinoma following open radical hysterectomy with pelvic lymphadenectomy: a retrospective
cohort study. J Oncol. 2021;2021:6201634.
doi pubmed - Guo HT, Bi XH, Lei T, Lv X, Yao G, Chen Y, Liu C.
Preoperative SCC-Ag as a predictive marker for the use of adjuvant chemotherapy in cervical
squamous cell carcinoma with intermediate-risk factors. BMC Cancer. 2020;20(1):441.
doi pubmed - Li Z, Chen J, Zhao S, Li Y, Zhou J, Liang J, Tang H.
Discovery and validation of novel biomarkers for detection of cervical cancer. Cancer Med.
2021;10(6):2063-2074.
doi pubmed - Wu HY, Li QQ, Liang L, Qiu LL, Wei HW, Huang BY, Gang C, et
al. Prognostic alternative splicing signature in cervical squamous cell carcinoma. IET Syst
Biol. 2020;14(6):314-322.
doi pubmed - Gao L, Pang YY, Guo XY, Zeng JJ, Tang ZQ, Xiong DD, Yang X,
et al. Polo like kinase 1 expression in cervical cancer tissues generated from multiple
detection methods. PeerJ. 2020;8:e10458.
doi pubmed - Olthof EP, van der Aa MA, Adam JA, Stalpers LJA, Wenzel HHB,
van der Velden J, Mom CH. The role of lymph nodes in cervical cancer: incidence and
identification of lymph node metastases-a literature review. Int J Clin Oncol.
2021;26(9):1600-1610.
doi pubmed - He Q, Skog S, Welander I, Tribukait B. X-irradiation effects
on thymidine kinase (TK): I. TK1 and 2 in normal and malignant cells. Cell Prolif.
2002;35(2):69-81.
doi pubmed - McKenna PG, O'Neill KL, Abram WP, Hannigan BM. Thymidine
kinase activities in mononuclear leukocytes and serum from breast cancer patients.
Br J Cancer. 1988;57(6):619-622.
doi pubmed - Aufderklamm S, Todenhofer T, Gakis G, Kruck S, Hennenlotter
J, Stenzl A, Schwentner C. Thymidine kinase and cancer monitoring. Cancer Lett.
2012;316(1):6-10.
doi pubmed - Meirovitz A, Gross M, Leibovici V, Sheva K, Popovzer A,
Barak V. Clinical applicability of the proliferation marker thymidine kinase 1 in head and neck
cancer patients. Anticancer Res. 2021;41(2):1083-1087.
doi pubmed - Hanouskova L, Rezac J, Vesely S, Prusa R, Kotaska K.
Thymidine Kinase-1 as Additional Diagnostic Marker of Prostate Cancer. Clin Lab.
2020;66(6).
doi pubmed - Wang Y, Wang J, Yan K, Lin J, Zheng Z, Bi J. Identification
of core genes associated with prostate cancer progression and outcome via bioinformatics
analysis in multiple databases. PeerJ. 2020;8:e8786.
doi pubmed - Tribukait B. Early prediction of pathologic response to
neoadjuvant treatment of breast cancer: use of a cell-loss metric based on serum thymidine
kinase 1 and tumour volume. BMC Cancer. 2020;20(1):440.
doi pubmed - Liu C, Wang J, Zhao L, He H, Zhao P, Peng Z, Liu F, et al.
Knockdown of thymidine kinase 1 suppresses cell proliferation, invasion, migration, and
epithelial-mesenchymal transition in thyroid carcinoma cells. Front Oncol. 2019;9:1475.
doi pubmed - Xu Y, Zhang P, Tan Y, Jia Z, Chen G, Niu Y, Xiao J, et al. A
potential panel of five mRNAs in urinary extracellular vesicles for the detection of bladder
cancer. Transl Androl Urol. 2021;10(2):809-820.
doi pubmed - Velazquez EJ, Brindley TD, Shrestha G, Bitter EE, Cress JD,
Townsend MH, Berges BK, et al. Novel monoclonal antibodies against thymidine kinase 1 and their
potential use for the immunotargeting of lung, breast and colon cancer cells. Cancer Cell Int.
2020;20:127.
doi pubmed - Qiu HZ, Huang J, Xiang CC, Li R, Zuo ED, Zhang Y, Shan L, et
al. Screening and Discovery of New Potential Biomarkers and Small Molecule Drugs for Cervical
Cancer: A Bioinformatics Analysis. Technol Cancer Res Treat. 2020;19:1533033820980112.
doi pubmed - Chen G, He C, Li L, Lin A, Zheng X, He E, Skog S. Nuclear
TK1 expression is an independent prognostic factor for survival in pre-malignant and malignant
lesions of the cervix. BMC Cancer. 2013;13:249.
doi pubmed - Sun Y, Chen G, He J, Li JX, Gan XY, Ji SF, Huang Y, et al.
Clinical significance and underlying mechanisms of CELSR3 in metastatic prostate cancer based on
immunohistochemistry, Data Mining, and in Silico analysis. Cancer Biother Radiopharm.
2022;37(6):466-479.
doi pubmed - He RQ, Li JD, Du XF, Dang YW, Yang LJ, Huang ZG, Liu LM, et
al. LPCAT1 overexpression promotes the progression of hepatocellular carcinoma. Cancer Cell Int.
2021;21(1):442.
doi pubmed - Huang WJ, He WY, Li JD, He RQ, Huang ZG, Zhou XG, Li JJ, et
al. Clinical significance and molecular mechanism of angiotensin-converting enzyme 2 in
hepatocellular carcinoma tissues. Bioengineered. 2021;12(1):4054-4069.
doi pubmed - Li JD, Chen G, Wu M, Huang Y, Tang W. Downregulation of
CDC14B in 5218 breast cancer patients: A novel prognosticator for triple-negative breast cancer.
Math Biosci Eng. 2020;17(6):8152-8181.
doi pubmed - Liu AG, Pang YY, Chen G, Wu HY, He RQ, Dang YW, Huang ZG, et
al. Downregulation of miR-199a-3p in hepatocellular carcinoma and its relevant molecular
mechanism via GEO, TCGA database and in silico analyses. Technol Cancer Res Treat.
2020;19:1533033820979670.
doi pubmed - Li R, Chen G, Dang Y, He R, Liu A, Ma J, Ling Z. Expression
and clinical significance of BCL2 interacting protein 3 like in multiple myeloma. Technol Cancer
Res Treat. 2021;20:15330338211024551.
doi pubmed - Li GS, Hou W, Chen G, Yao YX, Chen XY, Zhang XG, Liang Y, et
al. Clinical significance of integrin subunit beta 4 in head and neck squamous cell carcinoma.
Cancer Biother Radiopharm. 2022;37(4):256-275.
doi pubmed - Yang DP, Lu HP, Chen G, Yang J, Gao L, Song JH, Chen SW, et
al. Integrated expression analysis revealed RUNX2 upregulation in lung squamous cell carcinoma
tissues. IET Syst Biol. 2020;14(5):252-260.
doi pubmed - Liu CZ, Guo WP, Peng JB, Chen G, Lin P, Huang XL, Liu XF, et
al. Clinical significance of CCNE2 protein and mRNA expression in thyroid cancer tissues. Adv
Med Sci. 2020;65(2):442-456.
doi pubmed - Yang DP, Huang WY, Chen G, Chen SW, Yang J, He RQ, Huang SN,
et al. Clinical significance of transcription factor RUNX2 in lung adenocarcinoma and its latent
transcriptional regulating mechanism. Comput Biol Chem. 2020;89:107383.
doi pubmed - Pang YY, Li JD, Gao L, Yang X, Dang YW, Lai ZF, Liu LM, et
al. The clinical value and potential molecular mechanism of the downregulation of MAOA in
hepatocellular carcinoma tissues. Cancer Med. 2020;9(21):8004-8019.
doi pubmed - Peng W, Li JD, Zeng JJ, Zou XP, Tang D, Tang W, Rong MH, et
al. Clinical value and potential mechanisms of COL8A1 upregulation in breast cancer: a
comprehensive analysis. Cancer Cell Int. 2020;20:392.
doi pubmed - Zhong F, Lu HP, Chen G, Dang YW, Li GS, Chen XY, Qin YY, et
al. The clinical significance and potential molecular mechanism of integrin subunit beta 4 in
laryngeal squamous cell carcinoma. Pathol Res Pract. 2020;216(2):152785.
doi pubmed - Dempster JM, Boyle I, Vazquez F, Root DE, Boehm JS, Hahn WC,
Tsherniak A, et al. Chronos: a cell population dynamics model of CRISPR experiments that
improves inference of gene fitness effects. Genome Biol. 2021;22(1):343.
doi pubmed - http://gepia2.cancer-pku.cn/#index.
- https://ualcan.path.uab.edu/cgi-bin/ualcan-res.pl.
- http://www.cbioportal.org/.
- Li T, Fu J, Zeng Z, Cohen D, Li J, Chen Q, Li B, et al.
TIMER2.0 for analysis of tumor-infiltrating immune cells. Nucleic Acids Res.
2020;48(W1):W509-W514.
doi pubmed - Guo WP, Tang D, Pang YY, Li XJ, Chen G, Huang ZG, Tang XZ,
et al. Immunohistochemical basigin expression level in thyroid cancer tissues.
World J Surg Oncol. 2020;18(1):240.
doi pubmed - Chen SW, Lu HP, Chen G, Yang J, Huang WY, Wang XM, Huang SP,
et al. Downregulation of miRNA-126-3p is associated with progression of and poor prognosis for
lung squamous cell carcinoma. FEBS Open Bio. 2020;10(8):1624-1641.
doi pubmed - Wang SS, Huang ZG, Wu HY, He RQ, Yang LH, Feng ZB, Dang YW,
et al. Downregulation of miR-193a-3p is involved in the pathogenesis of hepatocellular carcinoma
by targeting CCND1. PeerJ. 2020;8:e8409.
doi pubmed - Tang W, Li GS, Li JD, Pan WY, Shi Q, Xiong DD, Mo CH, et al.
The role of upregulated miR-375 expression in breast cancer: an in vitro and in silico study.
Pathol Res Pract. 2020;216(1):152754.
doi pubmed - Chen YJ, Guo YN, Shi K, Huang HM, Huang SP, Xu WQ, Li ZY, et
al. Down-regulation of microRNA-144-3p and its clinical value in non-small cell lung cancer: a
comprehensive analysis based on microarray, miRNA-sequencing, and quantitative real-time PCR
data. Respir Res. 2019;20(1):48.
doi pubmed - Nishiguchi H, Omura T, Sato A, Kitahiro Y, Yamamoto K,
Kunimasa J, Yano I. Luteolin protects against 6-hydoroxydopamine-induced cell death via an
upregulation of HRD1 and SEL1L. Neurochem Res. 2024;49(1):117-128.
doi pubmed - Wang Z, He E, Sani K, Jagodnik KM, Silverstein MC, Ma'ayan
A. Drug Gene Budger (DGB): an application for ranking drugs to modulate a specific gene based on
transcriptomic signatures. Bioinformatics. 2019;35(7):1247-1248.
doi pubmed - Paoletti C, Barlow WE, Cobain EF, Bergqvist M, Mehta RS,
Gralow JR, Hortobagyi GN, et al. Evaluating serum thymidine kinase 1 in patients with hormone
receptor-positive metastatic breast cancer receiving first-line endocrine therapy in the SWOG
S0226 trial. Clin Cancer Res. 2021;27(22):6115-6123.
doi pubmed - McCartney A, Biagioni C, Schiavon G, Bergqvist M, Mattsson
K, Migliaccio I, Benelli M, et al. Prognostic role of serum thymidine kinase 1 activity in
patients with hormone receptor-positive metastatic breast cancer: Analysis of the randomised
phase III Evaluation of Faslodex versus Exemestane Clinical Trial (EFECT).
Eur J Cancer. 2019;114:55-66.
doi pubmed - Matikas A, Wang K, Lagoudaki E, Acs B, Zerdes I, Hartman J,
Azavedo E, et al. Prognostic role of serum thymidine kinase 1 kinetics during neoadjuvant
chemotherapy for early breast cancer. ESMO Open. 2021;6(2):100076.
doi pubmed - Cabel L, Rosenblum D, Lerebours F, Brain E, Loirat D,
Bergqvist M, Cottu P, et al. Plasma thymidine kinase 1 activity and outcome of ER+ HER2-
metastatic breast cancer patients treated with palbociclib and endocrine therapy. Breast Cancer
Res. 2020;22(1):98.
doi pubmed - Mattsson Ulfstedt J, Venge P, Holmgren S, Enblad G, Eriksson
S, Molin D. Serum concentrations of Thymidine kinase 1 measured using a novel antibody-based
assay in patients with Hodgkin Lymphoma. Ups J Med Sci. 2021;126:e6119.
doi pubmed - Ma H, Hei A, Zhou J, He E, Skog S, Li J. Serum thymidine
kinase 1 protein concentration for predicting early progression and monitoring the response to
TACE in hepatocellular carcinomas: a network meta-analysis. Future Sci OA.
2021;7(7):FSO717.
doi pubmed - Di Cresce C, Figueredo R, Rytelewski M, Maleki Vareki S, Way
C, Ferguson PJ, Vincent MD, et al. siRNA knockdown of mitochondrial thymidine kinase 2 (TK2)
sensitizes human tumor cells to gemcitabine. Oncotarget. 2015;6(26):22397-22409.
doi pubmed - Di Cresce C, Figueredo R, Ferguson PJ, Vincent MD,
Koropatnick J. Combining small interfering RNAs targeting thymidylate synthase and thymidine
kinase 1 or 2 sensitizes human tumor cells to 5-fluorodeoxyuridine and pemetrexed.
J Pharmacol Exp Ther. 2011;338(3):952-963.
doi pubmed - Sim JH, Lee JS, Jang DM, Kim HJ, Lee SW, Cho HS, Choi WJ.
Effects of perioperative inflammatory response in cervical cancer: laparoscopic versus open
surgery. J Clin Med. 2021;10(18):4198.
doi pubmed - Eiro N, Fraile M, Fernandez-Francos S, Sanchez R, Costa LA,
Vizoso FJ. Importance of the origin of mesenchymal (stem) stromal cells in cancer biology:
"alliance" or "war" in intercellular signals. Cell Biosci. 2021;11(1):109.
doi pubmed - Liu QF, Feng ZY, Jiang LL, Xu TT, Li SM, Liu KR. Immune cell
infiltration as signatures for the diagnosis and prognosis of malignant gynecological tumors.
Front Cell Dev Biol. 2021;9:702451.
doi pubmed - Bitter EE, Townsend MH, Erickson R, Allen C, O'Neill KL.
Thymidine kinase 1 through the ages: a comprehensive review. Cell Biosci.
2020;10(1):138.
doi pubmed - Chon J, Field MS, Stover PJ. Deoxyuracil in DNA and disease:
genomic signal or managed situation? DNA Repair (Amst). 2019;77:36-44.
doi pubmed - Malvi P, Janostiak R, Nagarajan A, Cai G, Wajapeyee N. Loss
of thymidine kinase 1 inhibits lung cancer growth and metastatic attributes by reducing GDF15
expression. PLoS Genet. 2019;15(10):e1008439.
doi pubmed - Patra S, Praharaj PP, Klionsky DJ, Bhutia SK. Vorinostat in
autophagic cell death: A critical insight into autophagy-mediated, -associated and -dependent
cell death for cancer prevention. Drug Discov Today. 2022;27(1):269-279.
doi pubmed - Zagni C, Floresta G, Monciino G, Rescifina A. The search for
potent, small-molecule HDACIs in cancer treatment: a decade after vorinostat. Med Res Rev.
2017;37(6):1373-1428.
doi pubmed - Kim YH, Bagot M, Pinter-Brown L, Rook AH, Porcu P, Horwitz
SM, Whittaker S, et al. Mogamulizumab versus vorinostat in previously treated cutaneous T-cell
lymphoma (MAVORIC): an international, open-label, randomised, controlled phase 3 trial. Lancet
Oncol. 2018;19(9):1192-1204.
doi pubmed - Okubo K, Isono M, Miyai K, Asano T, Sato A. Fluvastatin
potentiates anticancer activity of vorinostat in renal cancer cells. Cancer Sci.
2020;111(1):112-126.
doi pubmed - Li YQ, Fan F, Wang YR, Li LY, Cao YJ, Gu SM, Liu SS, et al.
The novel small molecule BH3 mimetic nobiletin synergizes with vorinostat to induce apoptosis
and autophagy in small cell lung cancer. Biochem Pharmacol. 2023;216:115807.
doi pubmed - Alqosaibi AI, Abdel-Ghany S. Vorinostat induces G2/M cell
cycle arrest in breast cancer cells via upregulation of PTEN. Eur Rev Med Pharmacol Sci.
2023;27(4):1503-1511.
doi pubmed - Galanis E, Anderson SK, Miller CR, Sarkaria JN, Jaeckle K,
Buckner JC, Ligon KL, et al. Phase I/II trial of vorinostat combined with temozolomide and
radiation therapy for newly diagnosed glioblastoma: results of Alliance N0874/ABTC 02. Neuro
Oncol. 2018;20(4):546-556.
doi pubmed - Leary SES, Kilburn L, Geyer JR, Kocak M, Huang J, Smith KS,
Hadley J, et al. Vorinostat and isotretinoin with chemotherapy in young children with embryonal
brain tumors: A report from the Pediatric Brain Tumor Consortium (PBTC-026). Neuro Oncol.
2022;24(7):1178-1190.
doi pubmed - Lee SJ, Hwang SO, Noh EJ, Kim DU, Nam M, Kim JH, Nam JH, et
al. Transactivation of bad by vorinostat-induced acetylated p53 enhances doxorubicin-induced
cytotoxicity in cervical cancer cells. Exp Mol Med. 2014;46(2):e76.
doi pubmed
This
article is distributed under the terms of the Creative Commons Attribution Non-Commercial 4.0
International License, which permits unrestricted non-commercial use, distribution, and
reproduction in any medium, provided the original work is properly cited.
World
Journal of Oncology is published by Elmer Press Inc.