Figures
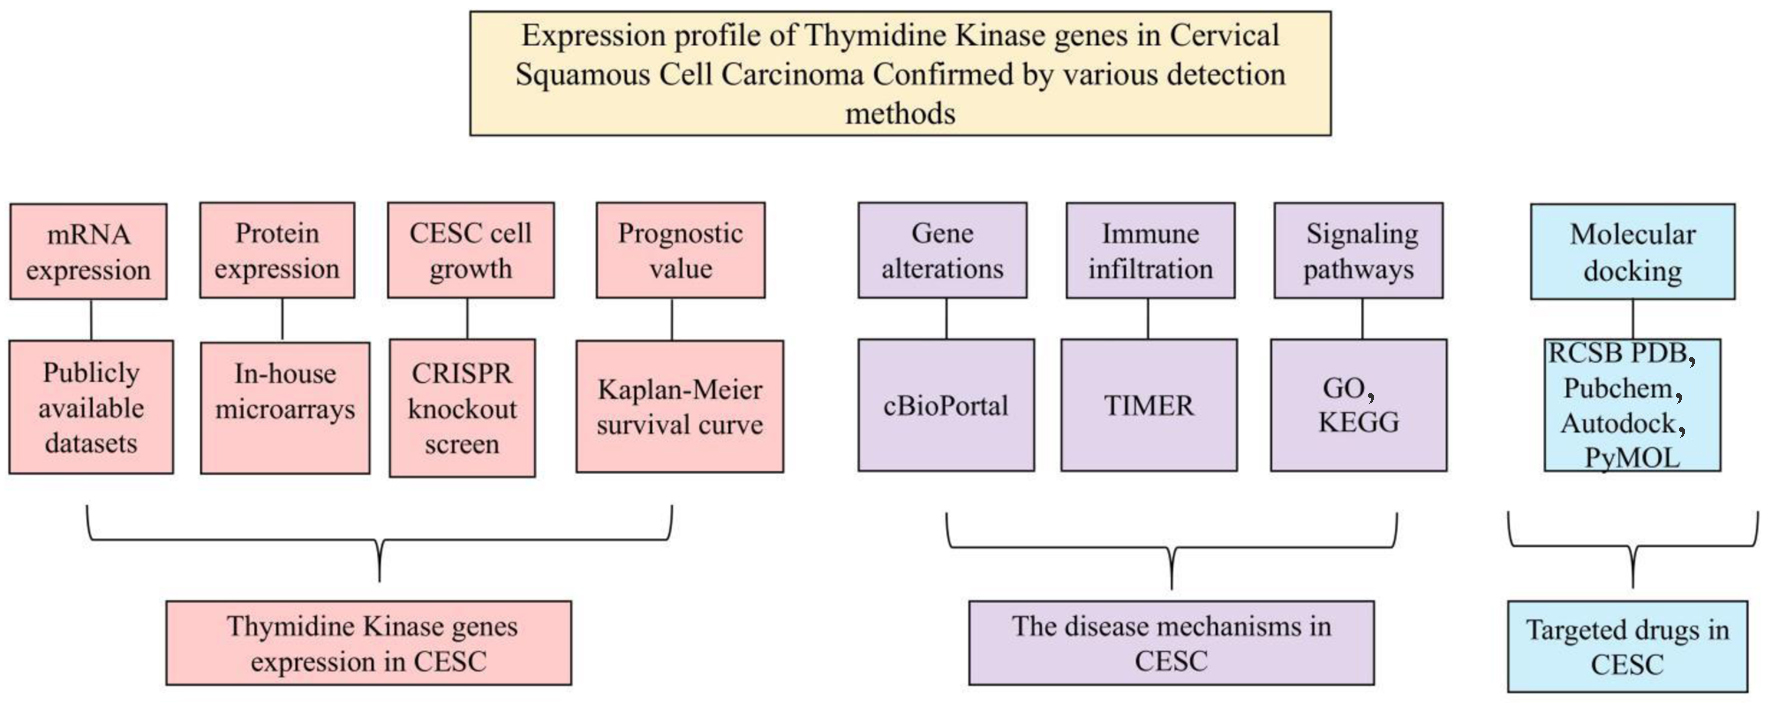
↓ Figure 1. The overall design of the current
study.
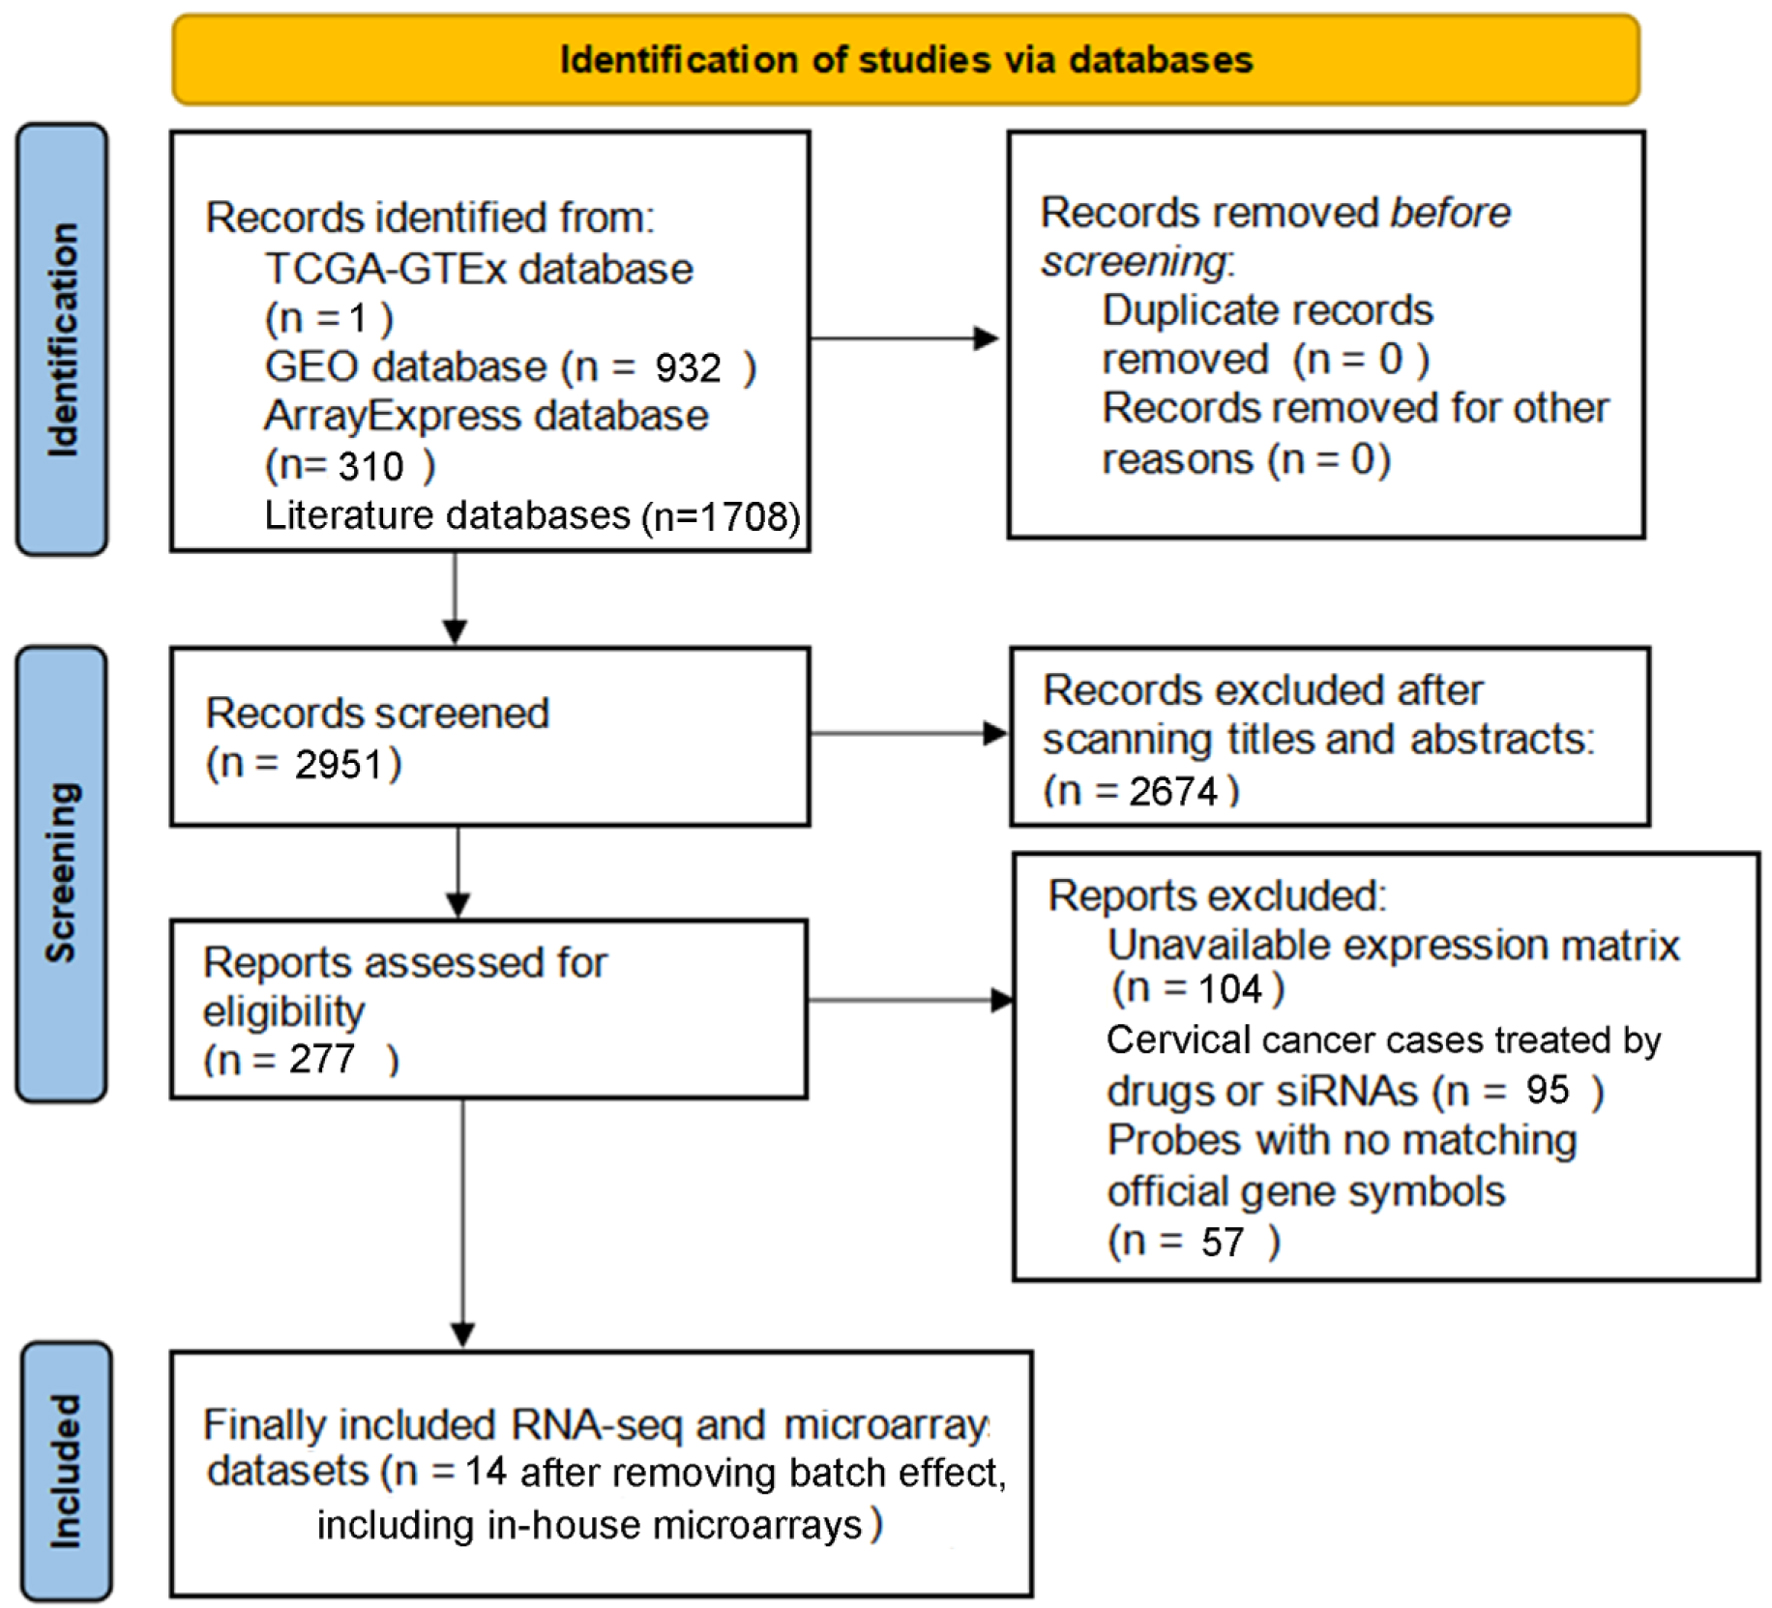
↓ Figure 2. PRISMA flow diagram for the current
study.
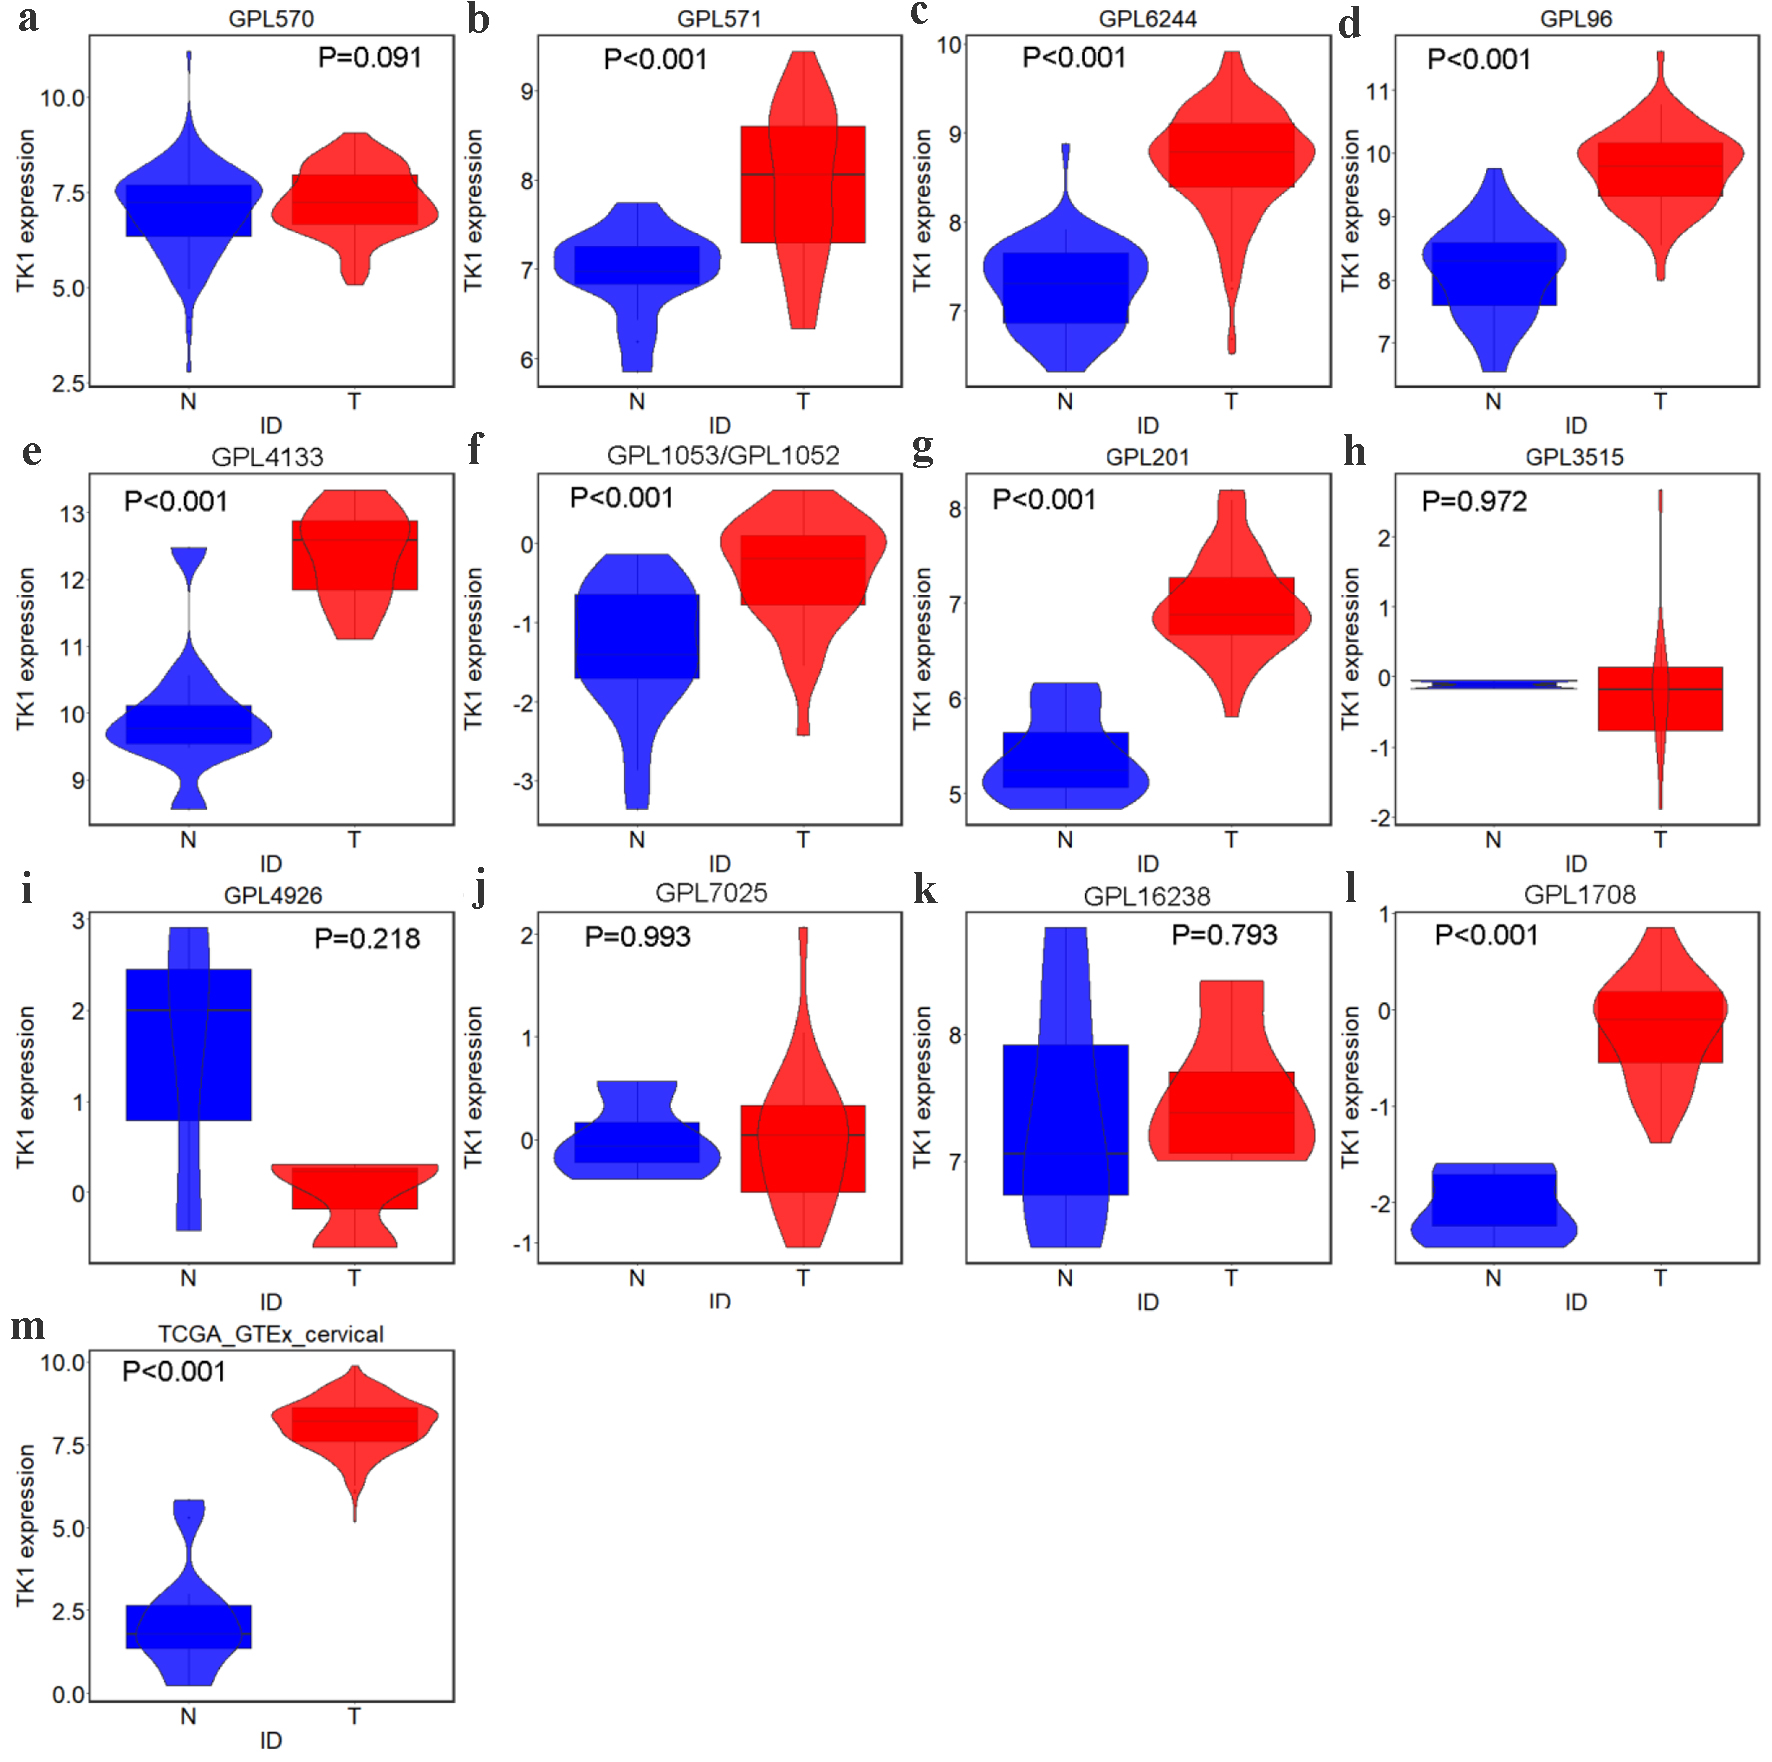
↓ Figure 3. TK1 expression in CESC from external
microarrays and RNA-seq datasets. Violin plots for: (a) GPL570; (b) GPL571; (c) GPL6244; (d) GPL96; (e)
GPL4133; (f) GPL1053 and GPL1052; (g) GPL201; (h) GPL3515; (i) GPL4926; (j) GPL7025; (k) GPL16238; (l)
GPL1708; (m) TCGA-GTEx. N: non-cancer controls; T: CESC samples.
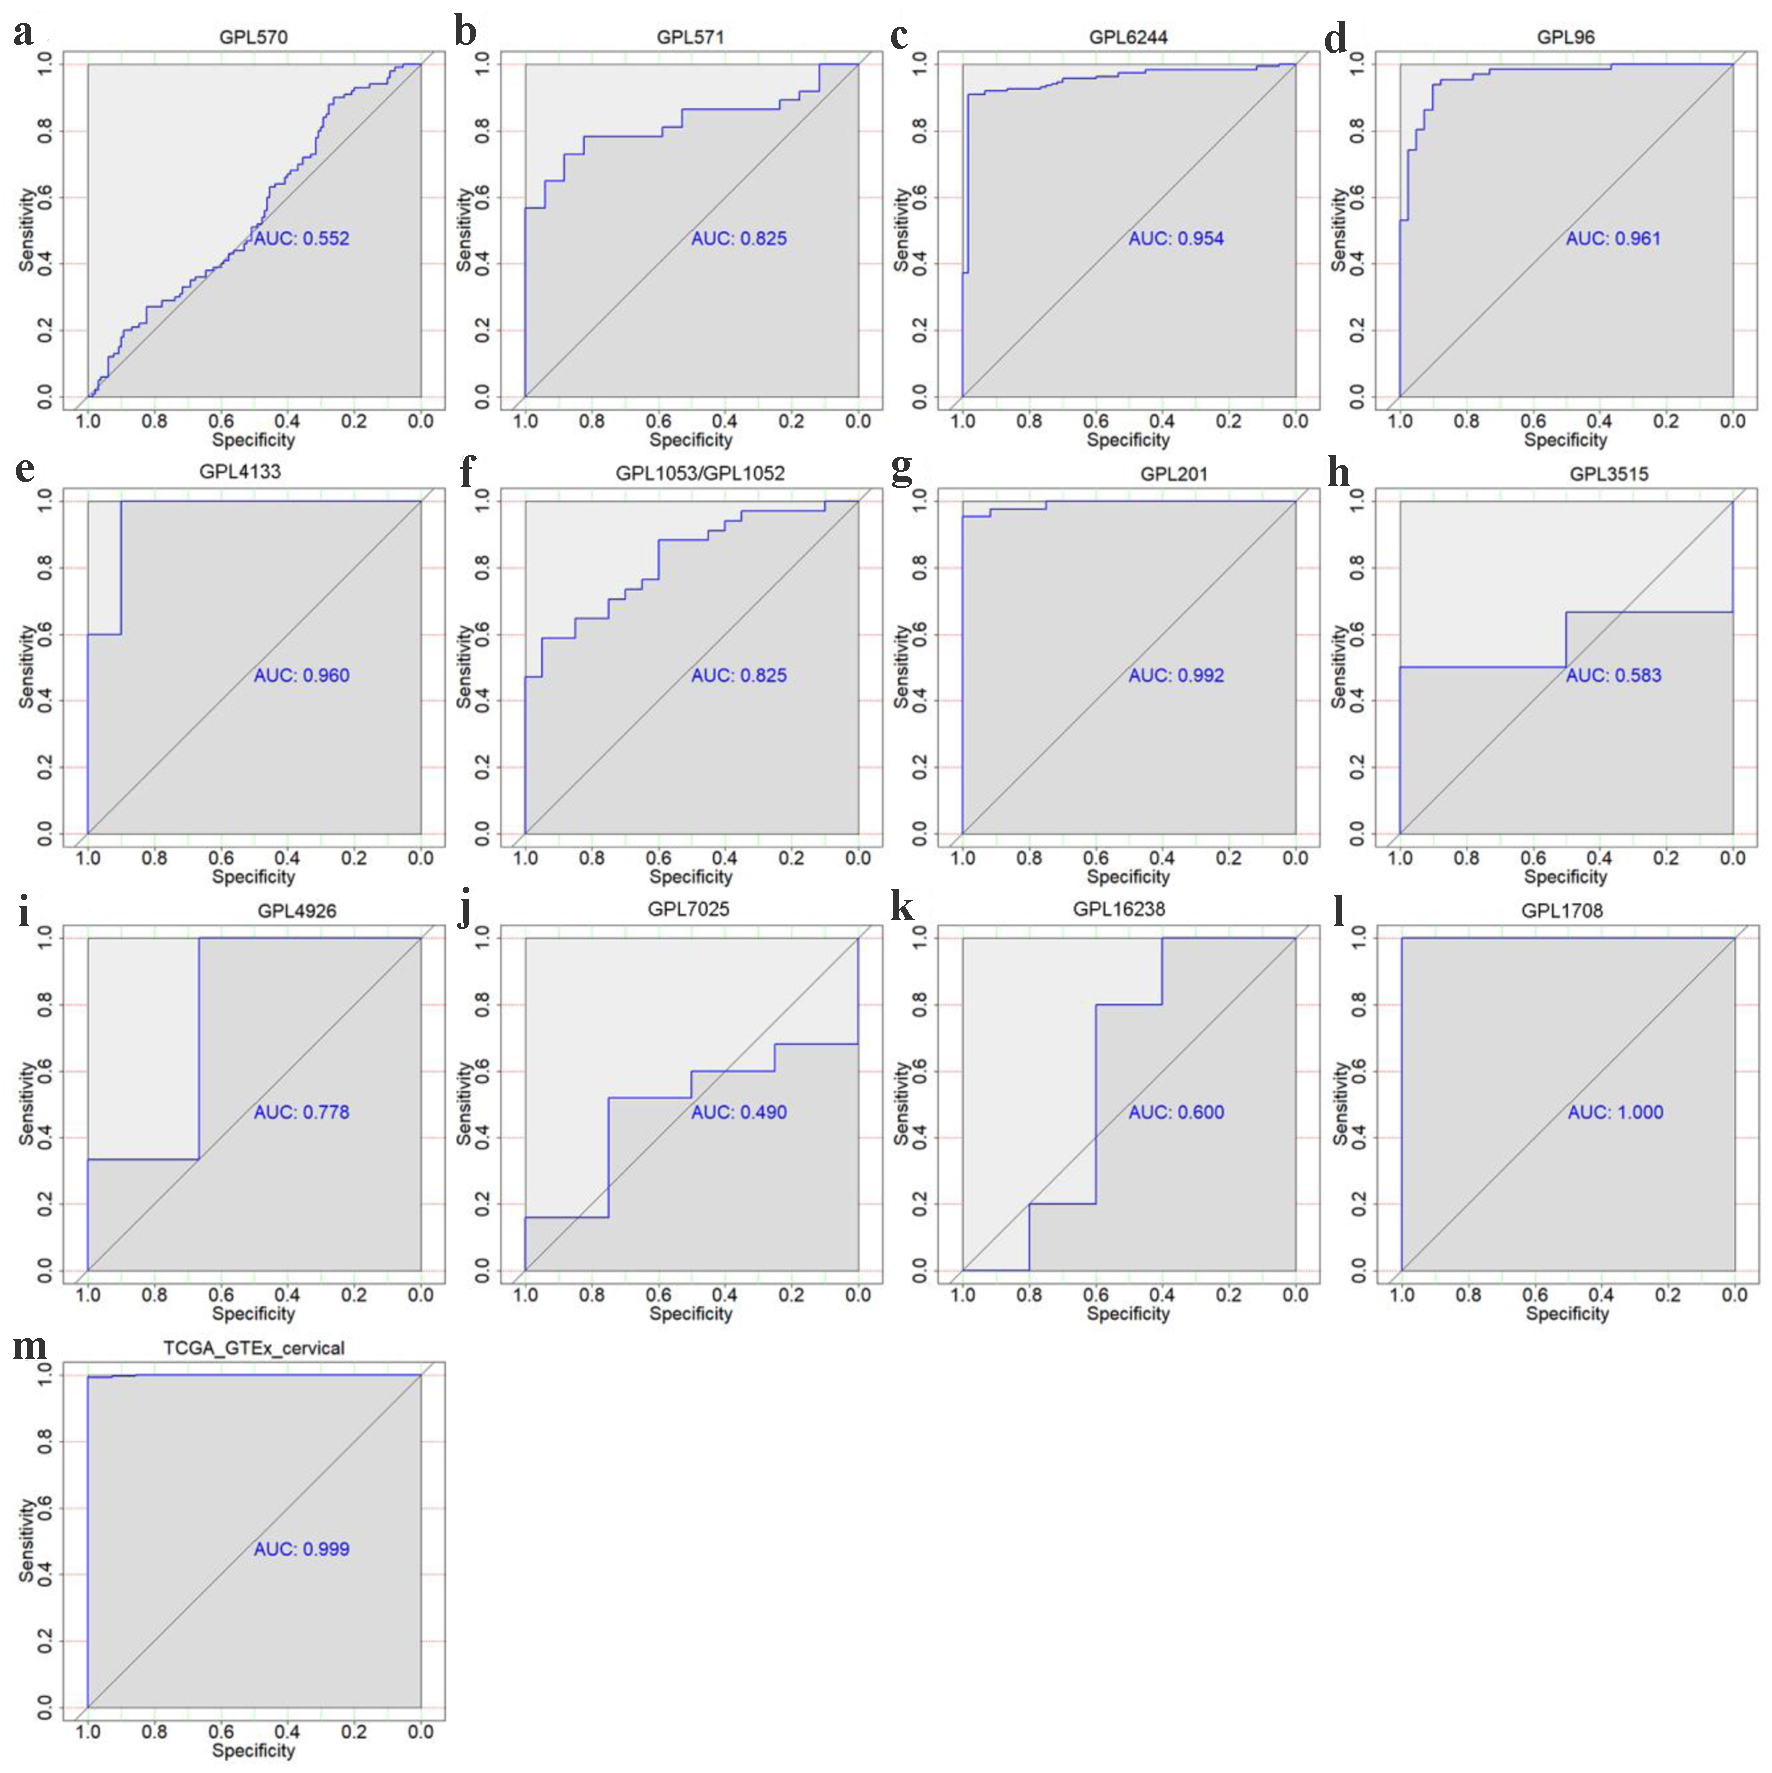
↓ Figure 4. The discriminatory ability of TK1
expression in distinguishing CESC from non-cancer tissues in each microarray and RNA-seq dataset. ROC
curves for GPL570 (a), GPL571 (b), GPL6244 (c), GPL96 (d), GPL4133 (e), GPL1053 and GPL1052 (f), GPL201
(g), GPL3515 (h), GPL4926 (i), GPL7025 (j) GPL16238 (k), GPL1708 (l) and TCGA-GTEx datasets (m). AUC:
area under curve.
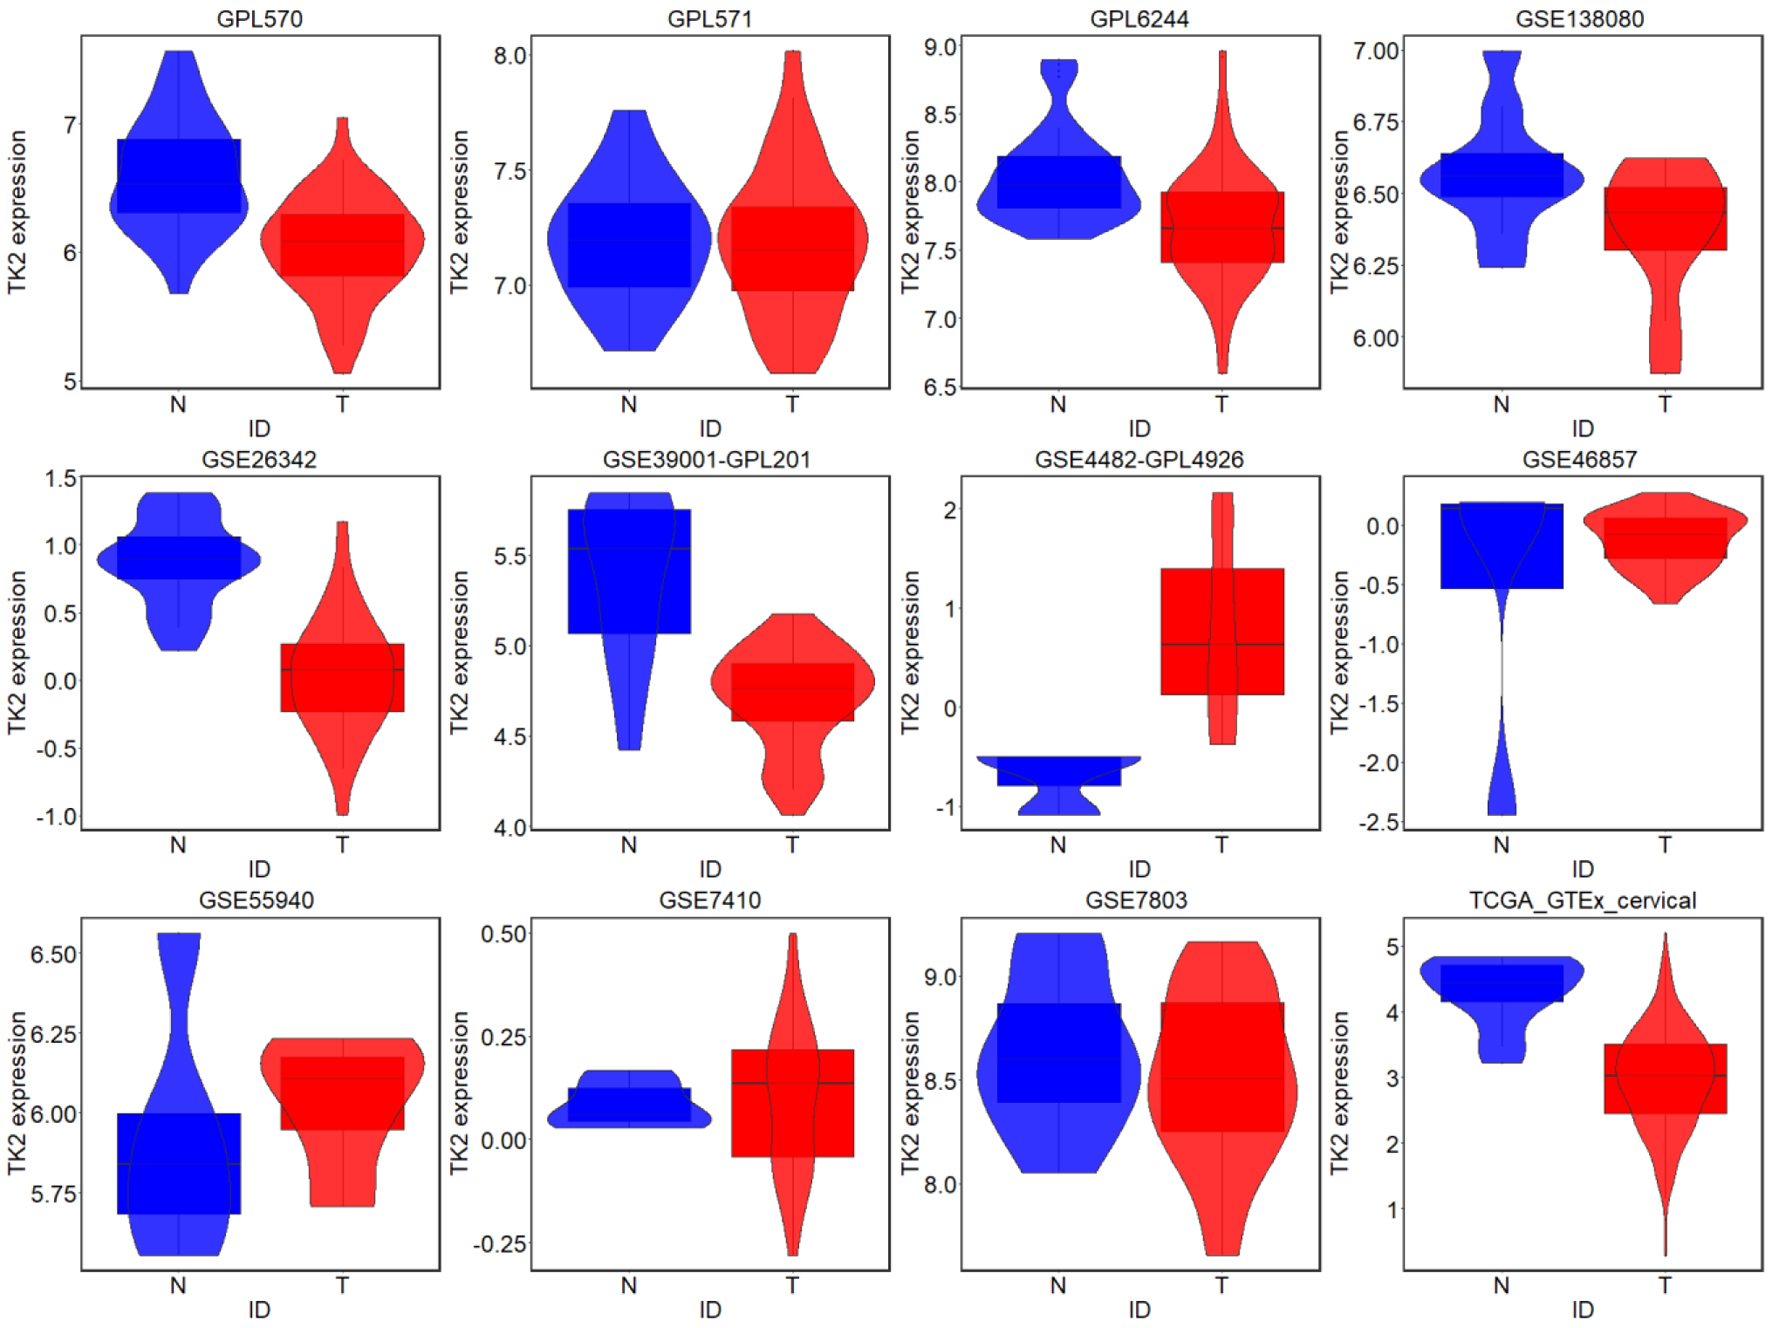
↓ Figure 5. TK2 expression in CESC from external
microarrays and RNA-seq datasets; N: non-cancer controls; T: CESC samples.
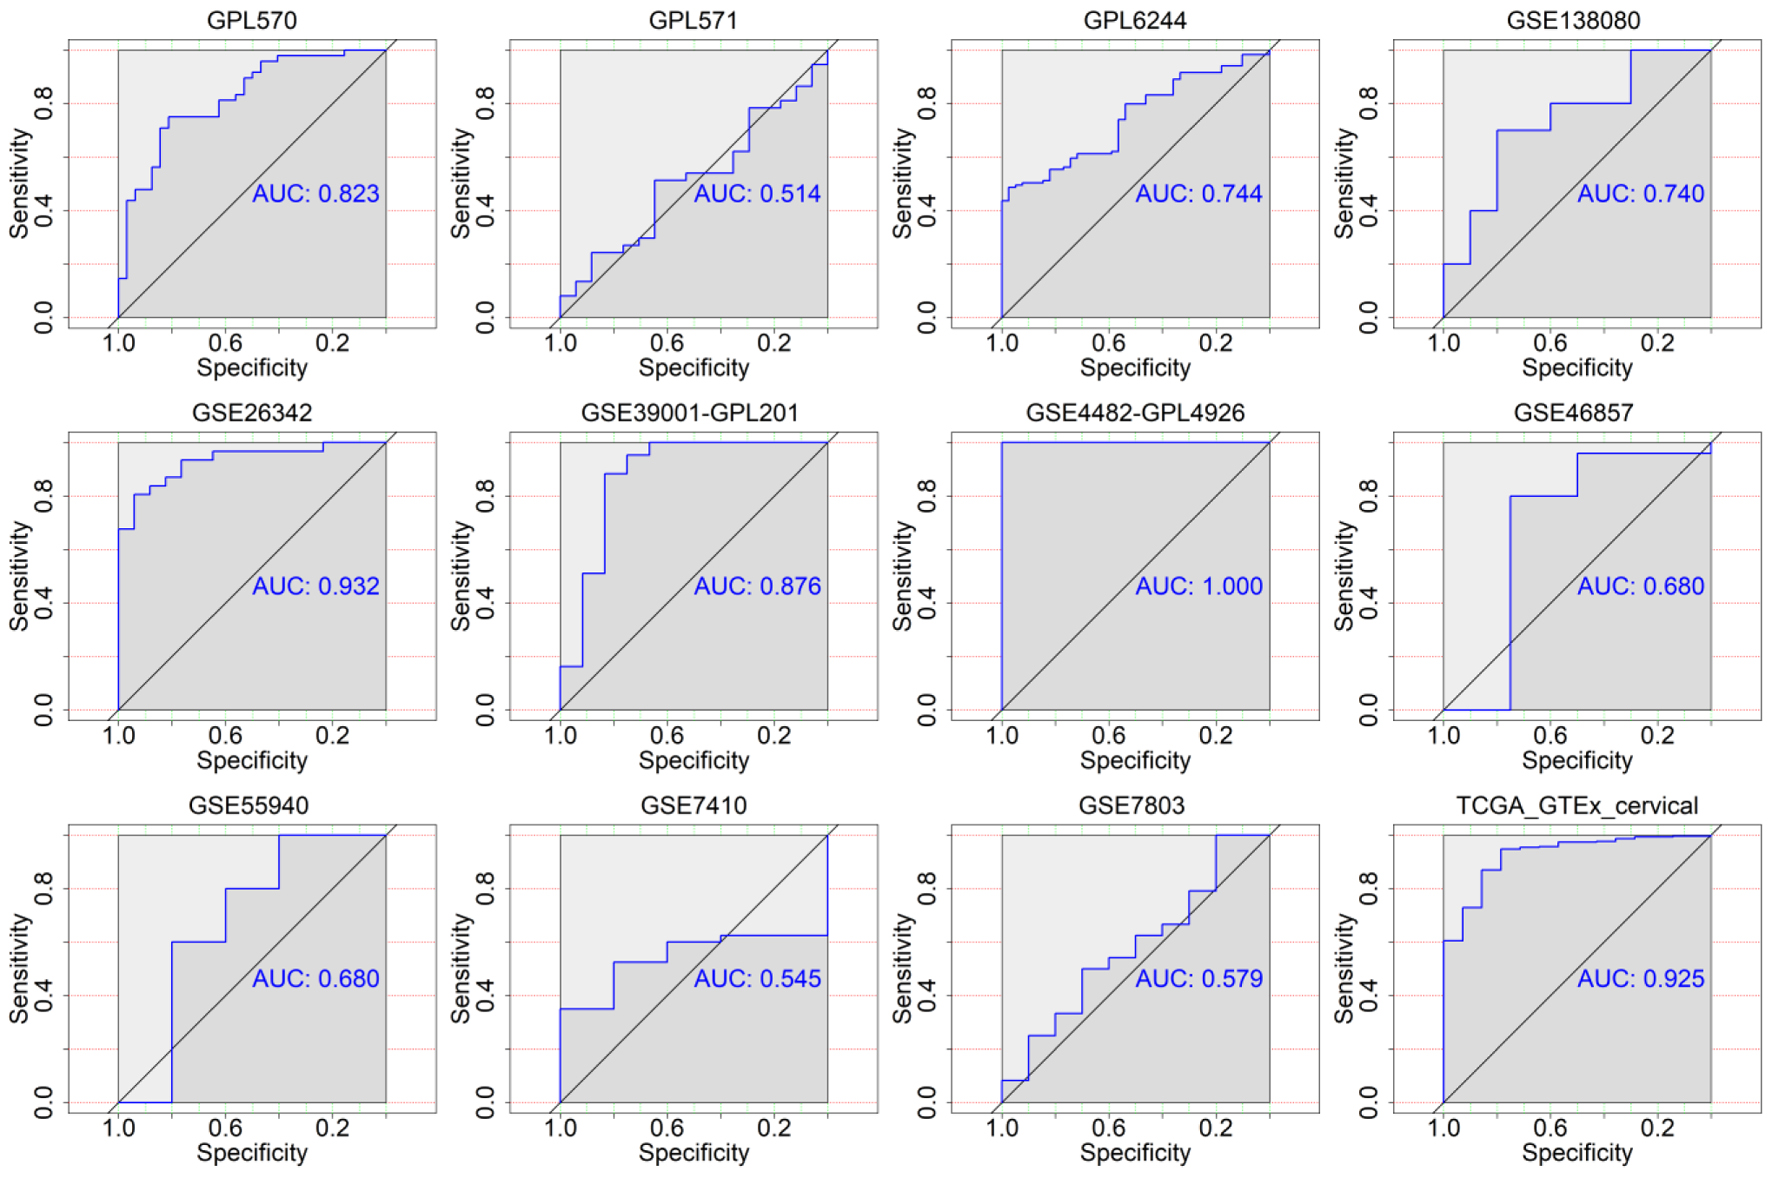
↓ Figure 6. The discriminatory ability of TK2
expression in distinguishing CESC from non-cancer tissues in each microarray and RNA-seq dataset. AUC:
area under curve.
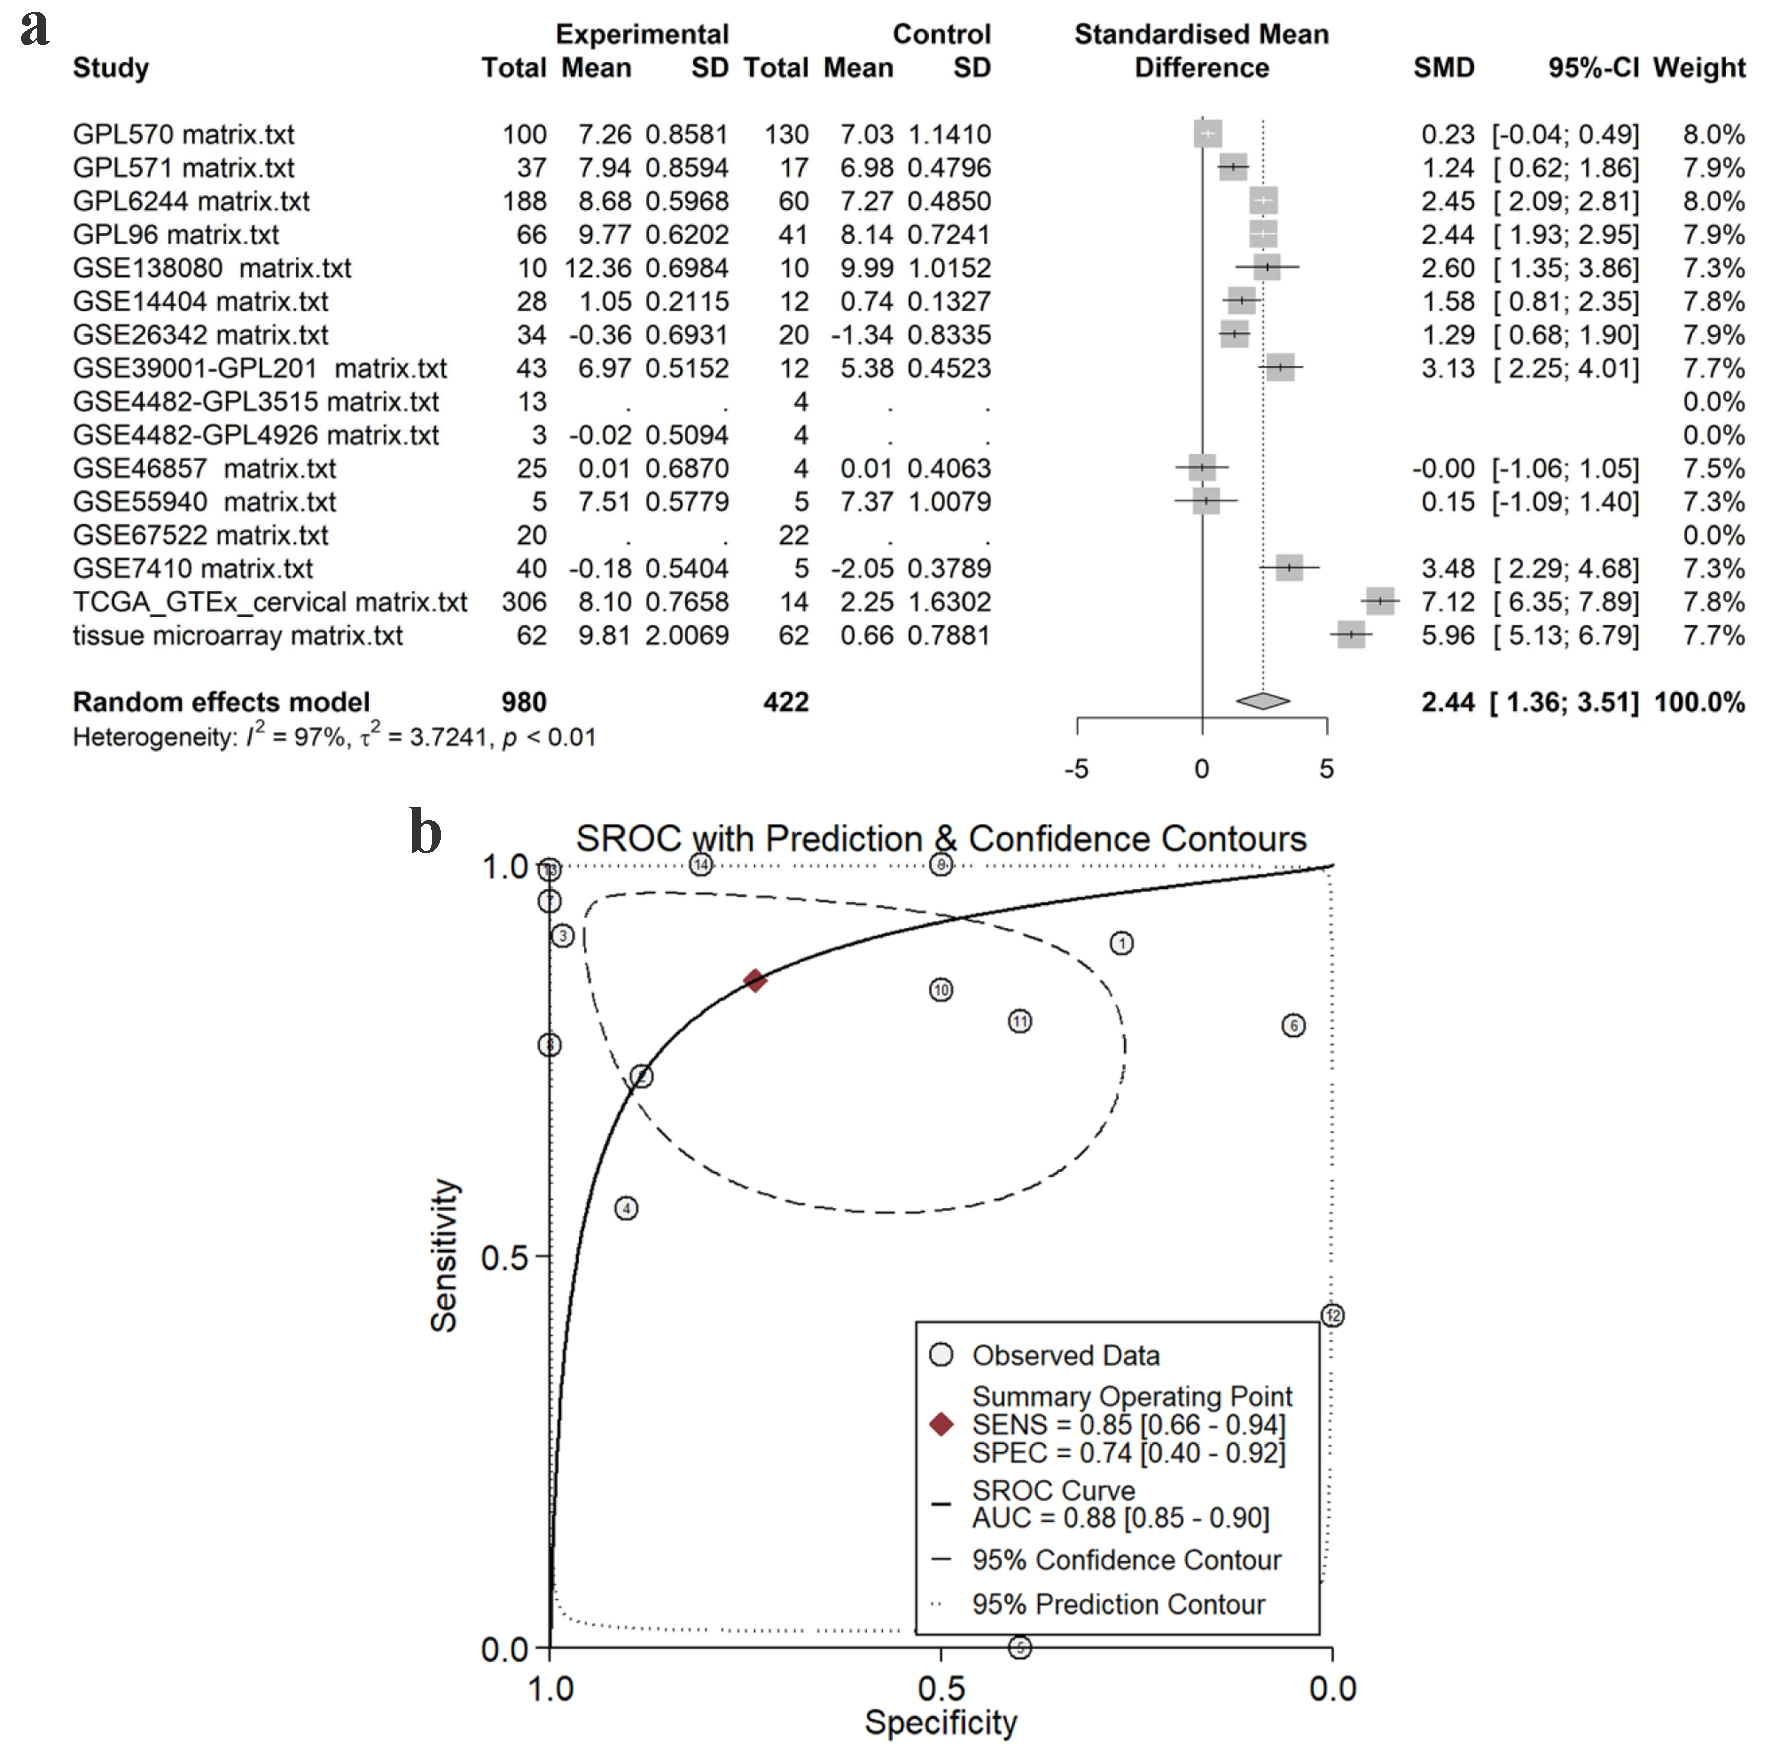
↓ Figure 7. Pooled TK1 expression in CESC
tissues. (a) SMD forest. (b) sROC curve. SMD: standardized mean difference; sROC: summarized
receiver’s operating characteristics.
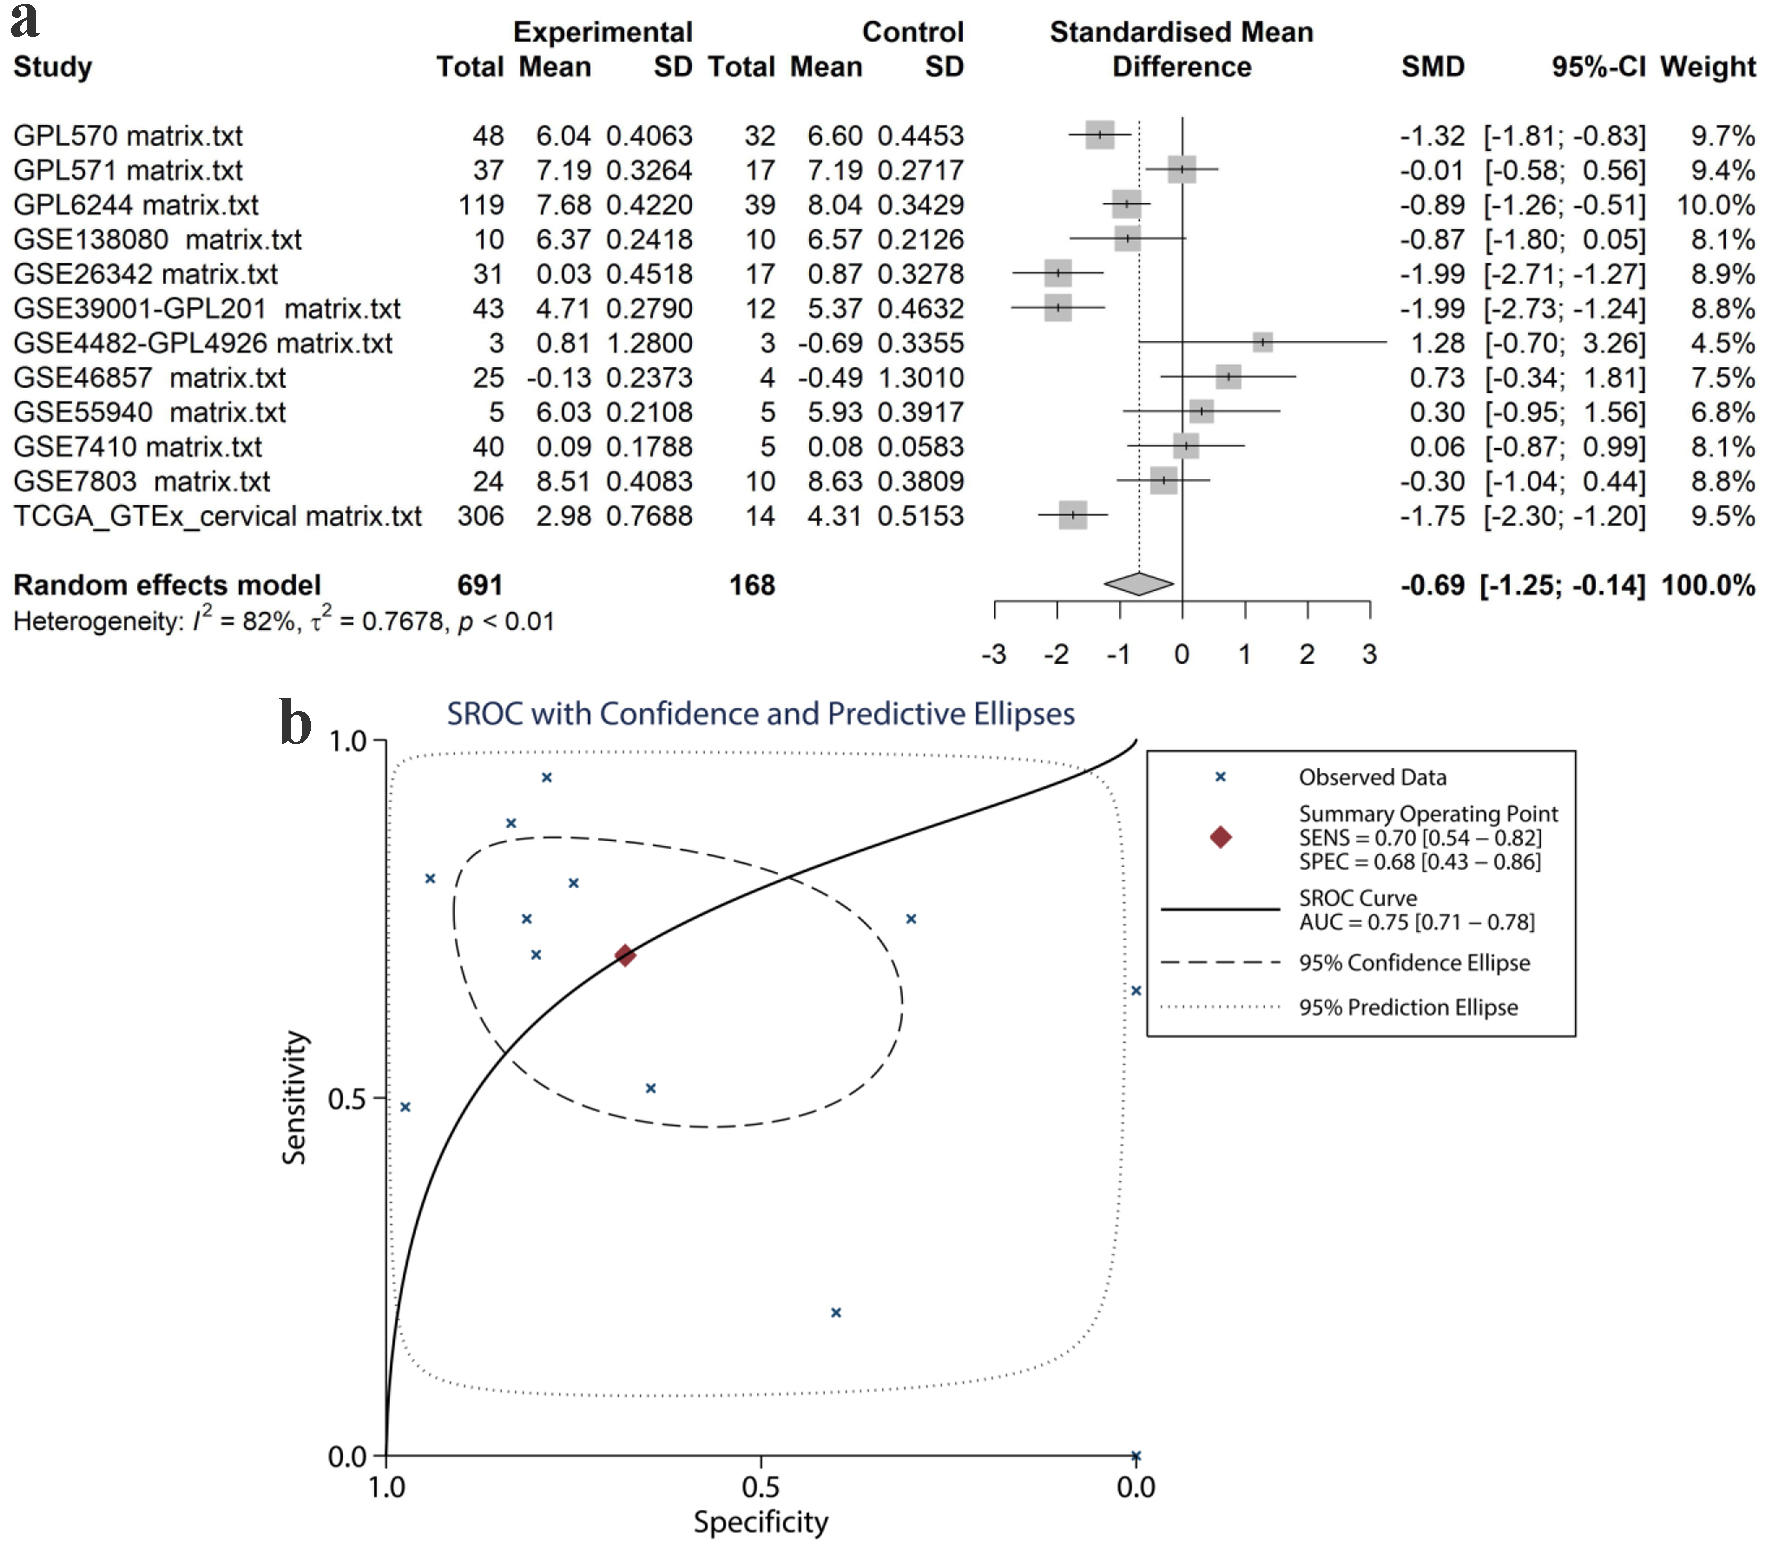
↓ Figure 8. Pooled TK2 expression in CESC
tissues. (a) SMD forest. (b) sROC curve. SMD: standardized mean difference; sROC: summarized
receiver’s operating characteristics.
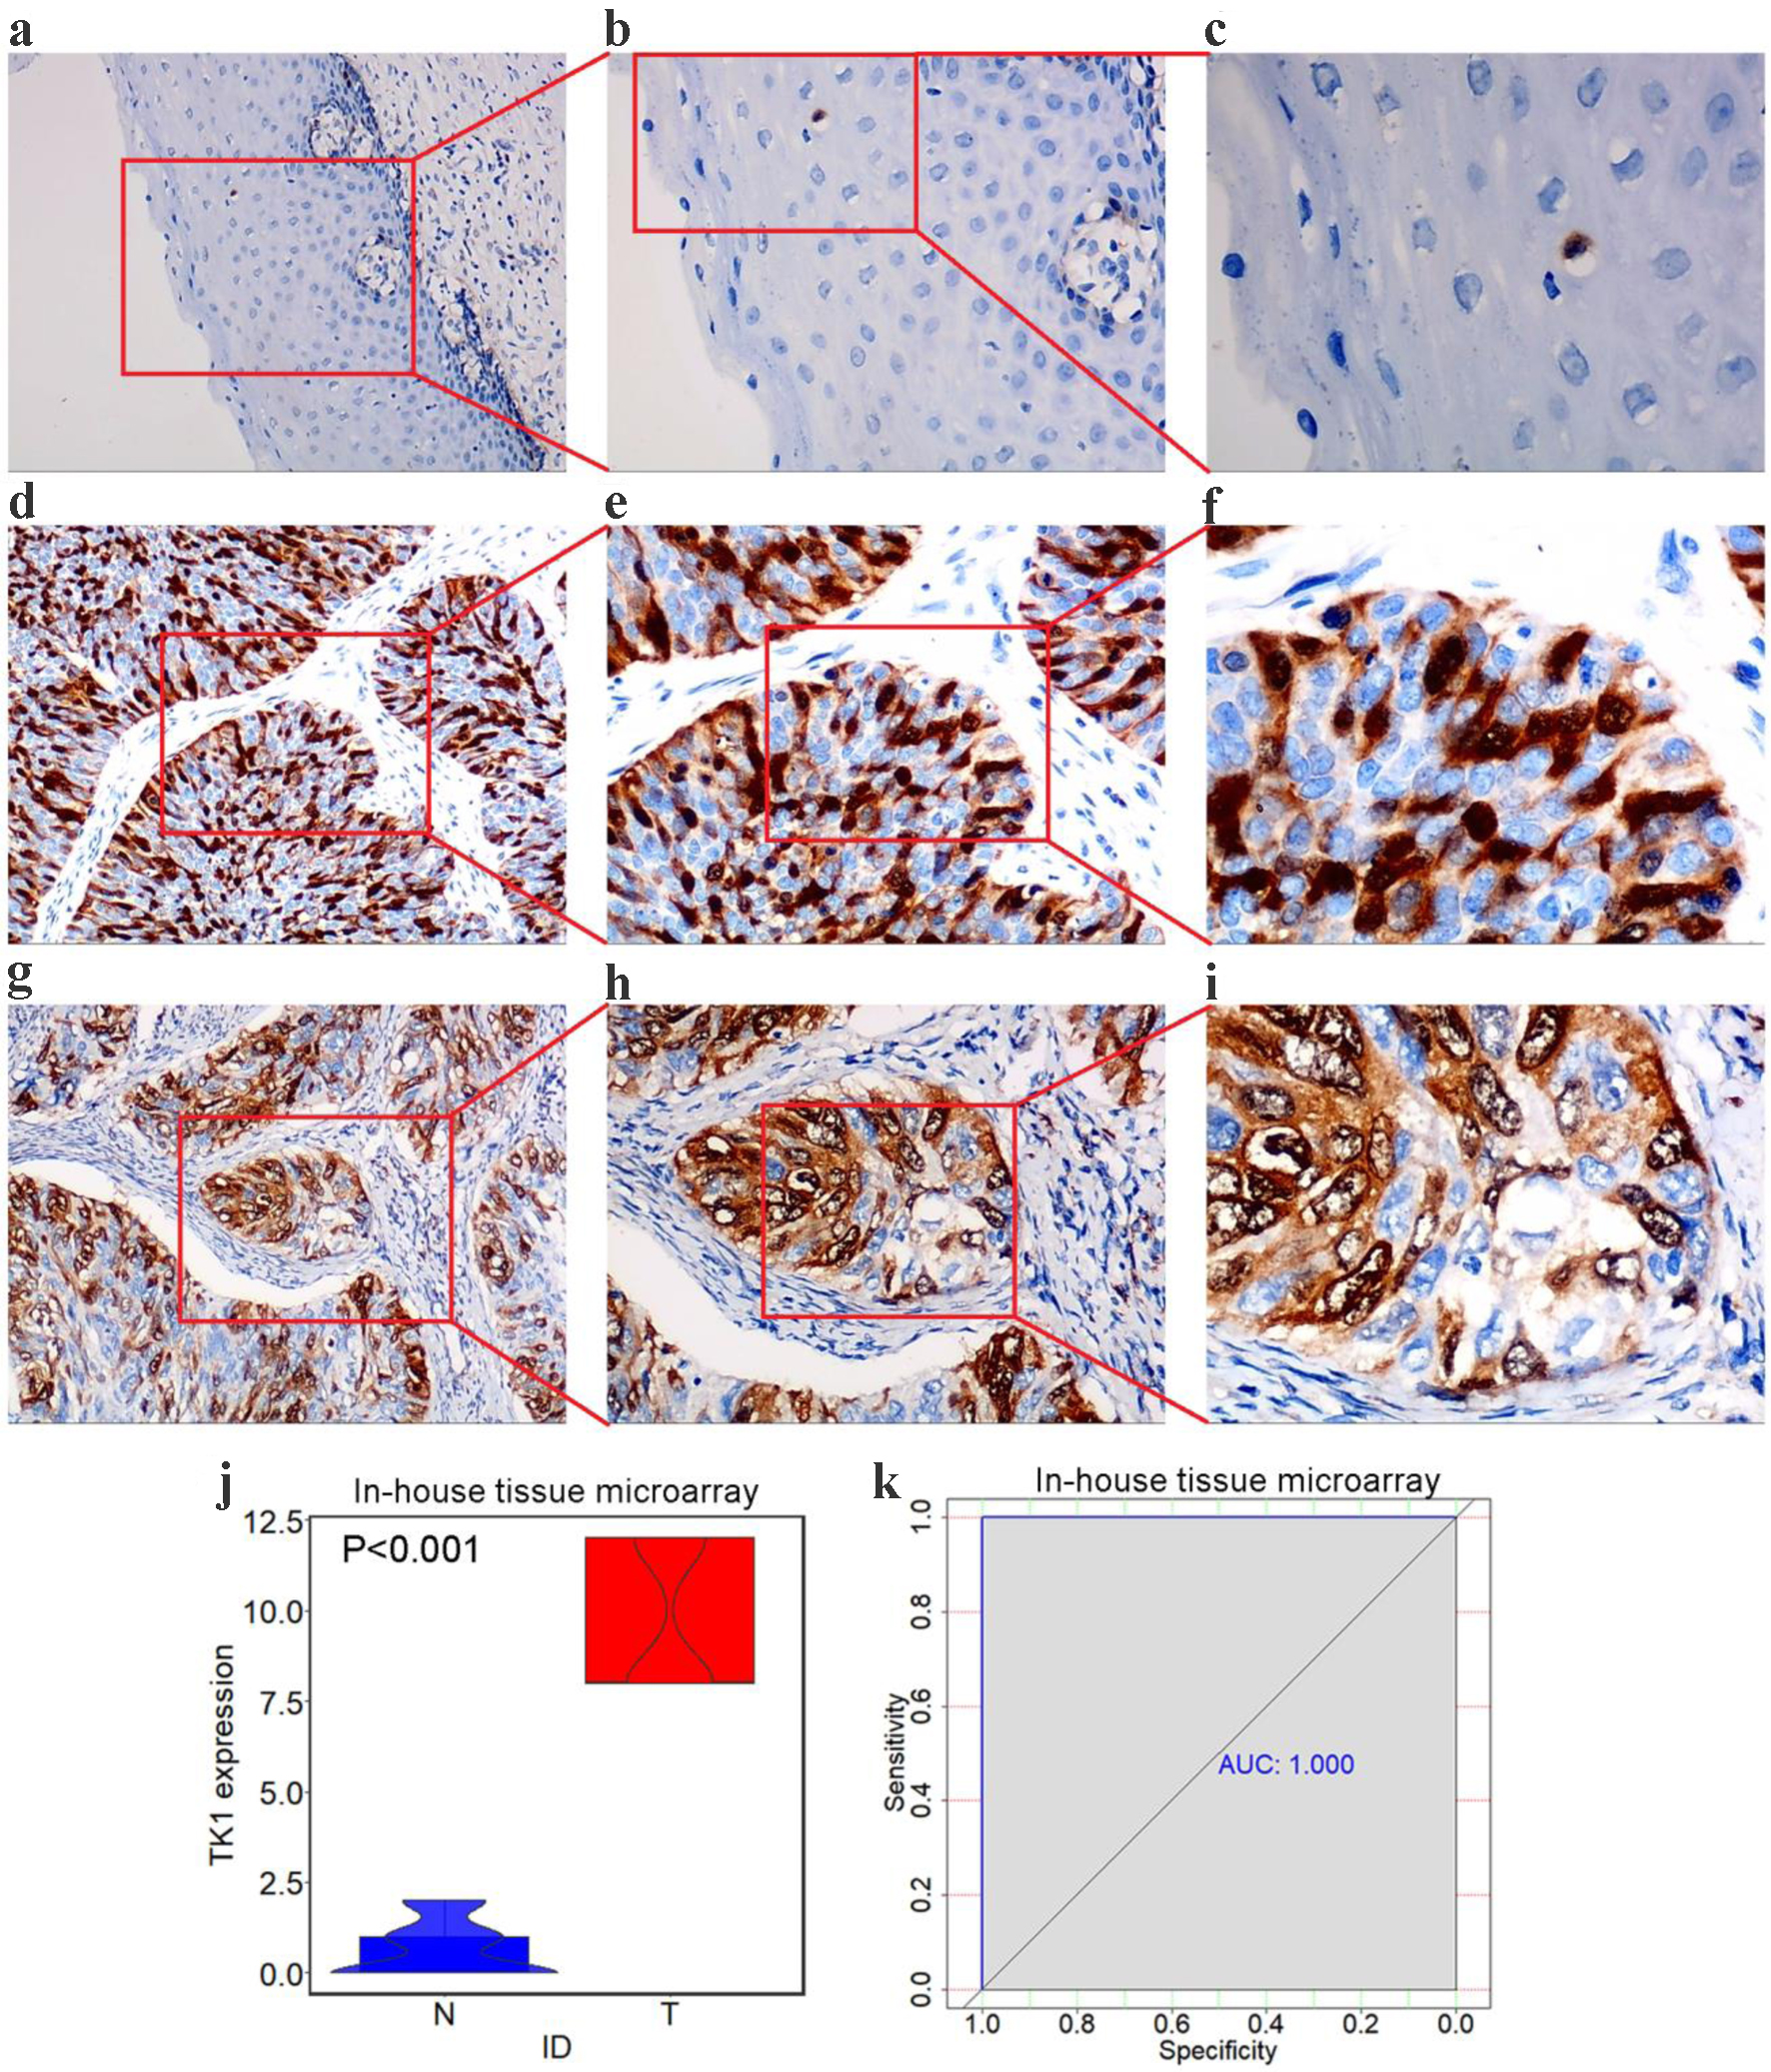
↓ Figure 9. TK1 protein levels in CESC from
tissue microarrays. (a) Negative staining of TK1 in non-cancer squamous epithelium tissues (× 100).
(b) Negative staining of TK1 in non-cancer squamous epithelium tissues (× 200); (c) Negative
staining of TK1 in non-cancer squamous epithelium tissues (× 400); (d, g) Strong staining of TK1 in
CESC tissues (× 100); (e, h) Strong staining of TK1 in CESC tissues (× 200); (f, i) Strong
staining of TK1 in CESC tissues (× 400); (j) Violin plots of TK1 expression in CESC and non-cancer
controls; (k) ROC curves of the discriminating ability of TK1 overexpression. N: non-cancer samples; T:
CESC samples; AUC: area under curve.
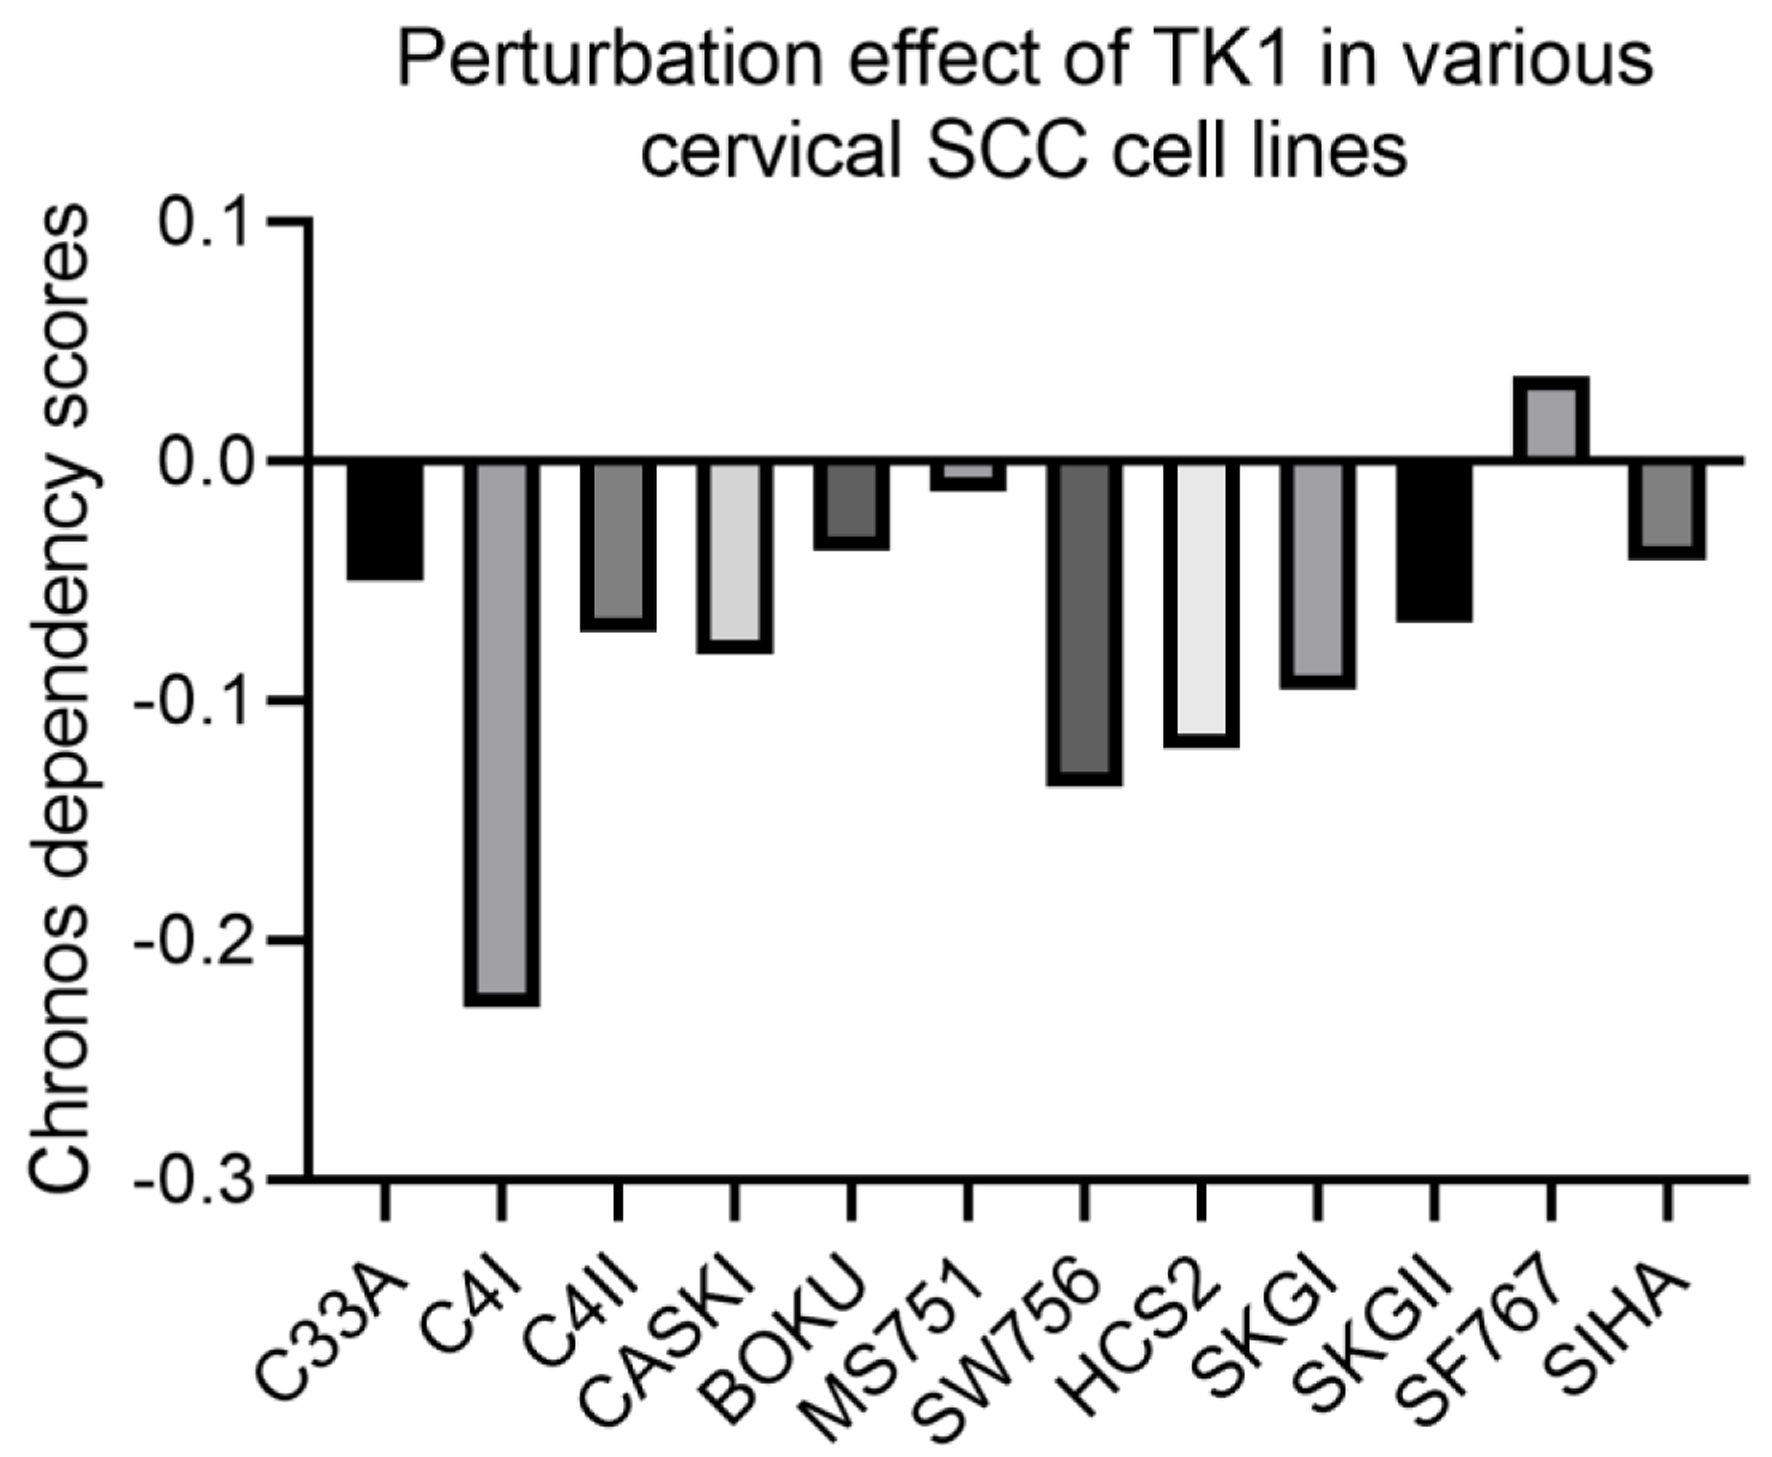
↓ Figure 10. Perturbation effect of knocking down
TK1 expression in various CESC cell lines. A lower Chronos score indicates a higher likelihood that the
gene of interest is essential in a given cell line.
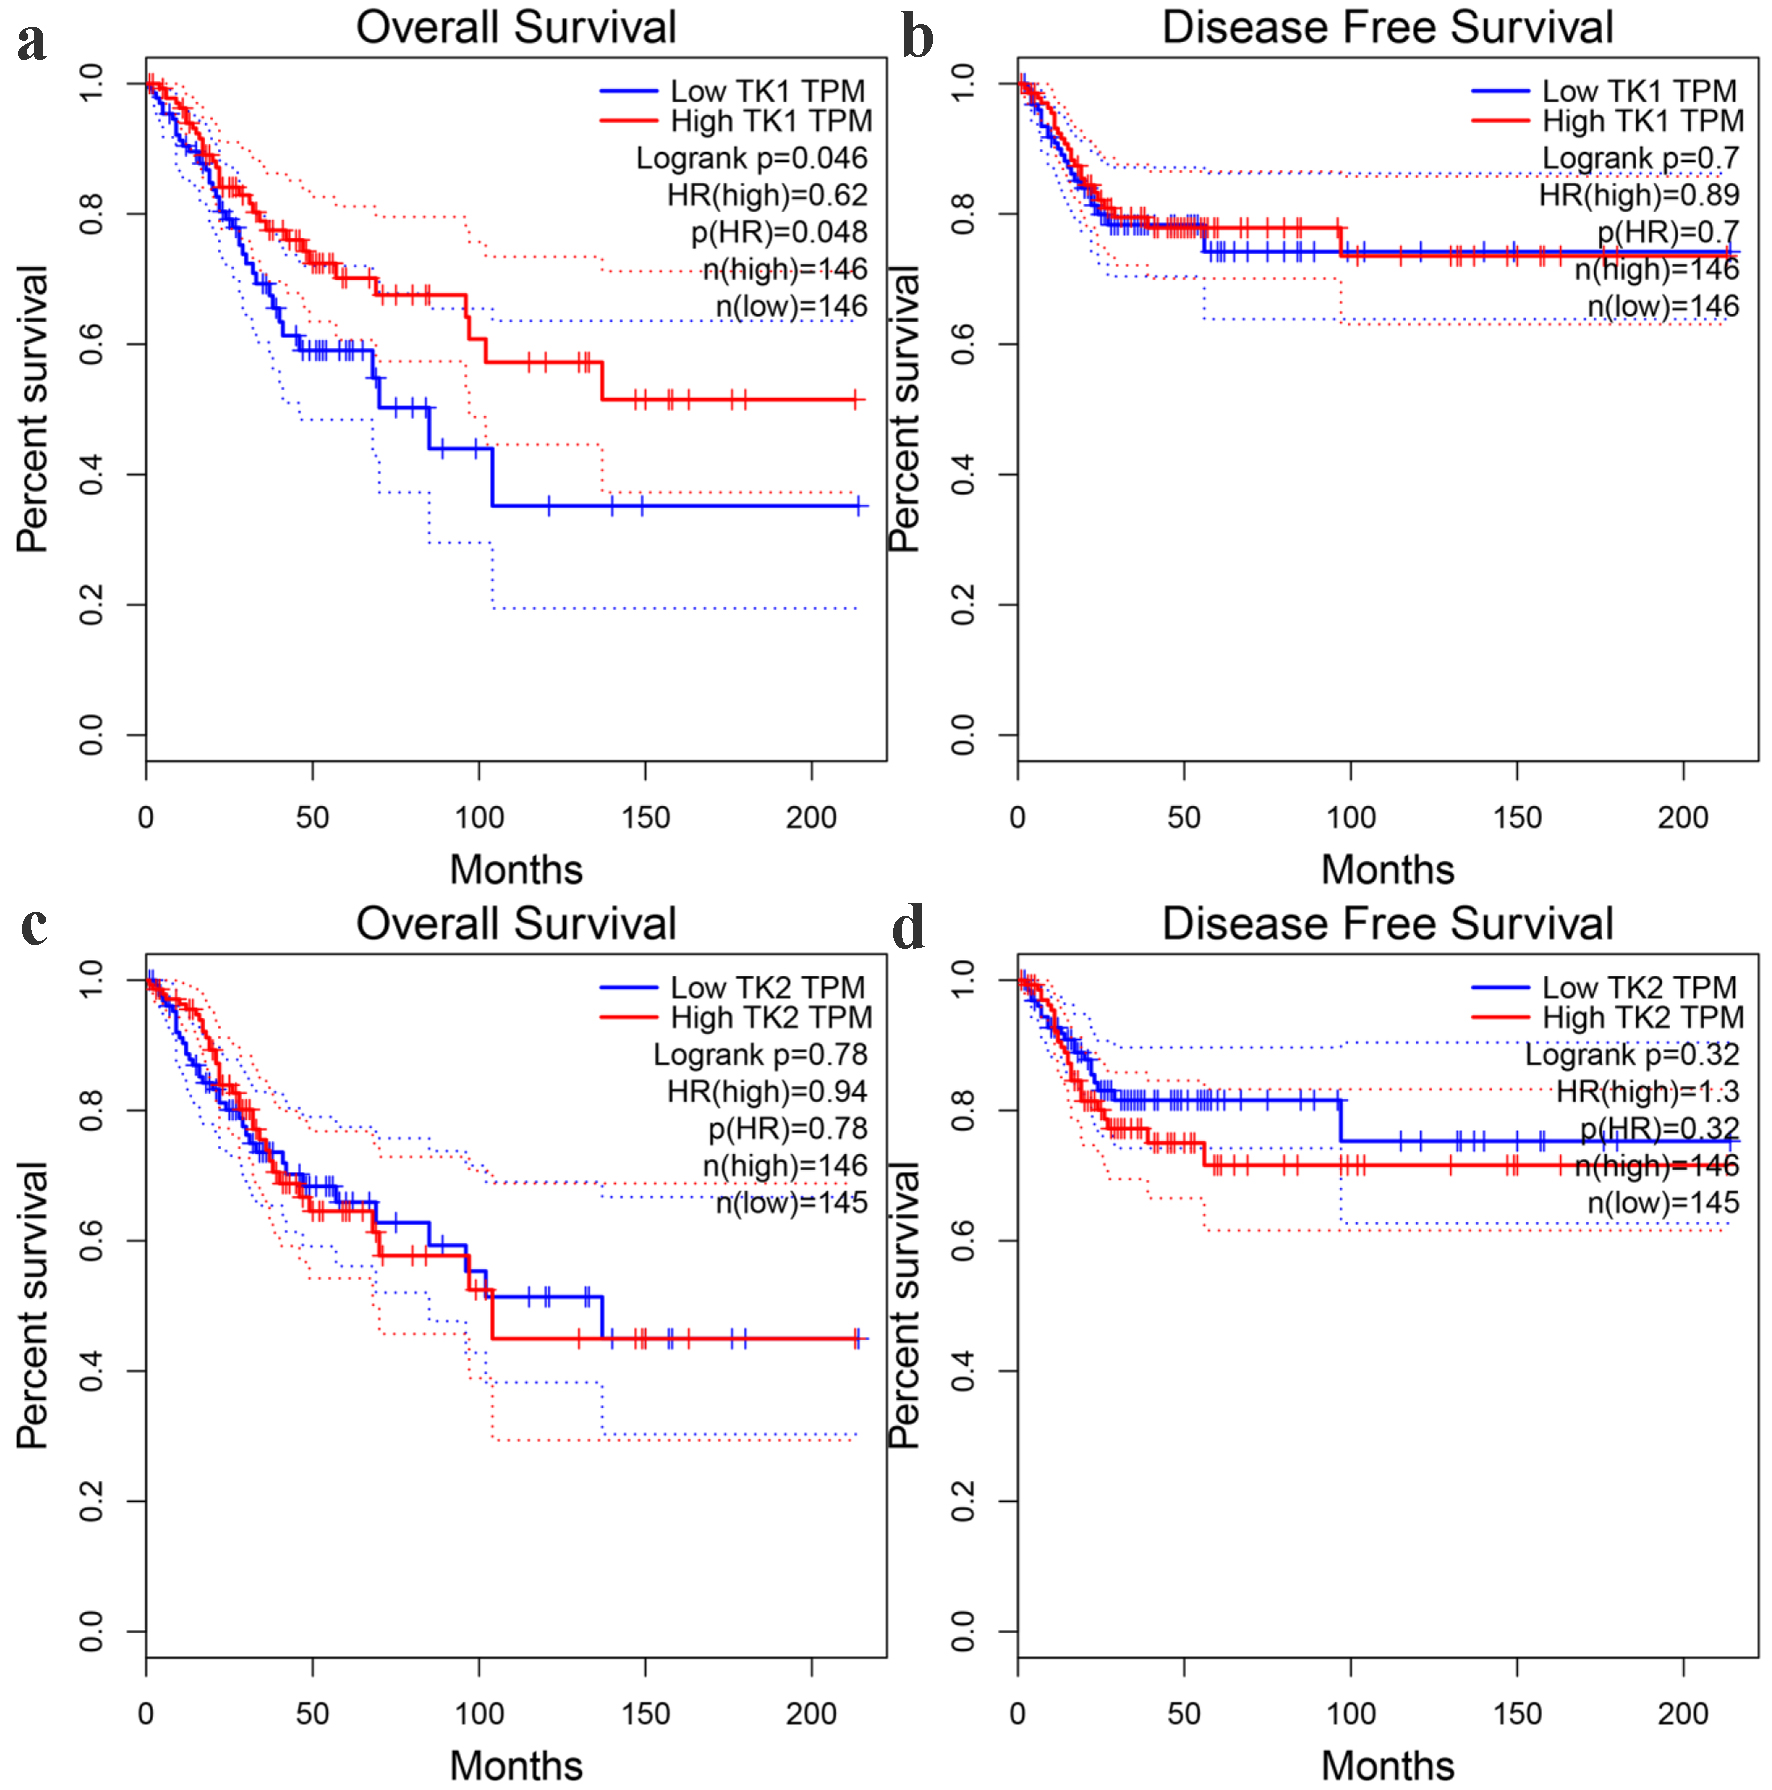
↓ Figure 11. The prognostic significance of TK1
and TK2 expression for CESC. (a) Kaplan-Meier survival curves for overall survival of CESC patients with
low or high TK1 expression. (b) Kaplan-Meier survival curves for disease-free survival of CESC patients
with low or high TK1 expression. (c) Kaplan-Meier survival curves for overall survival of CESC patients
with low or high TK2 expression. (d) Kaplan-Meier survival curves for disease-free survival of CESC
patients with low or high TK2 expression. HR: hazard ratio.
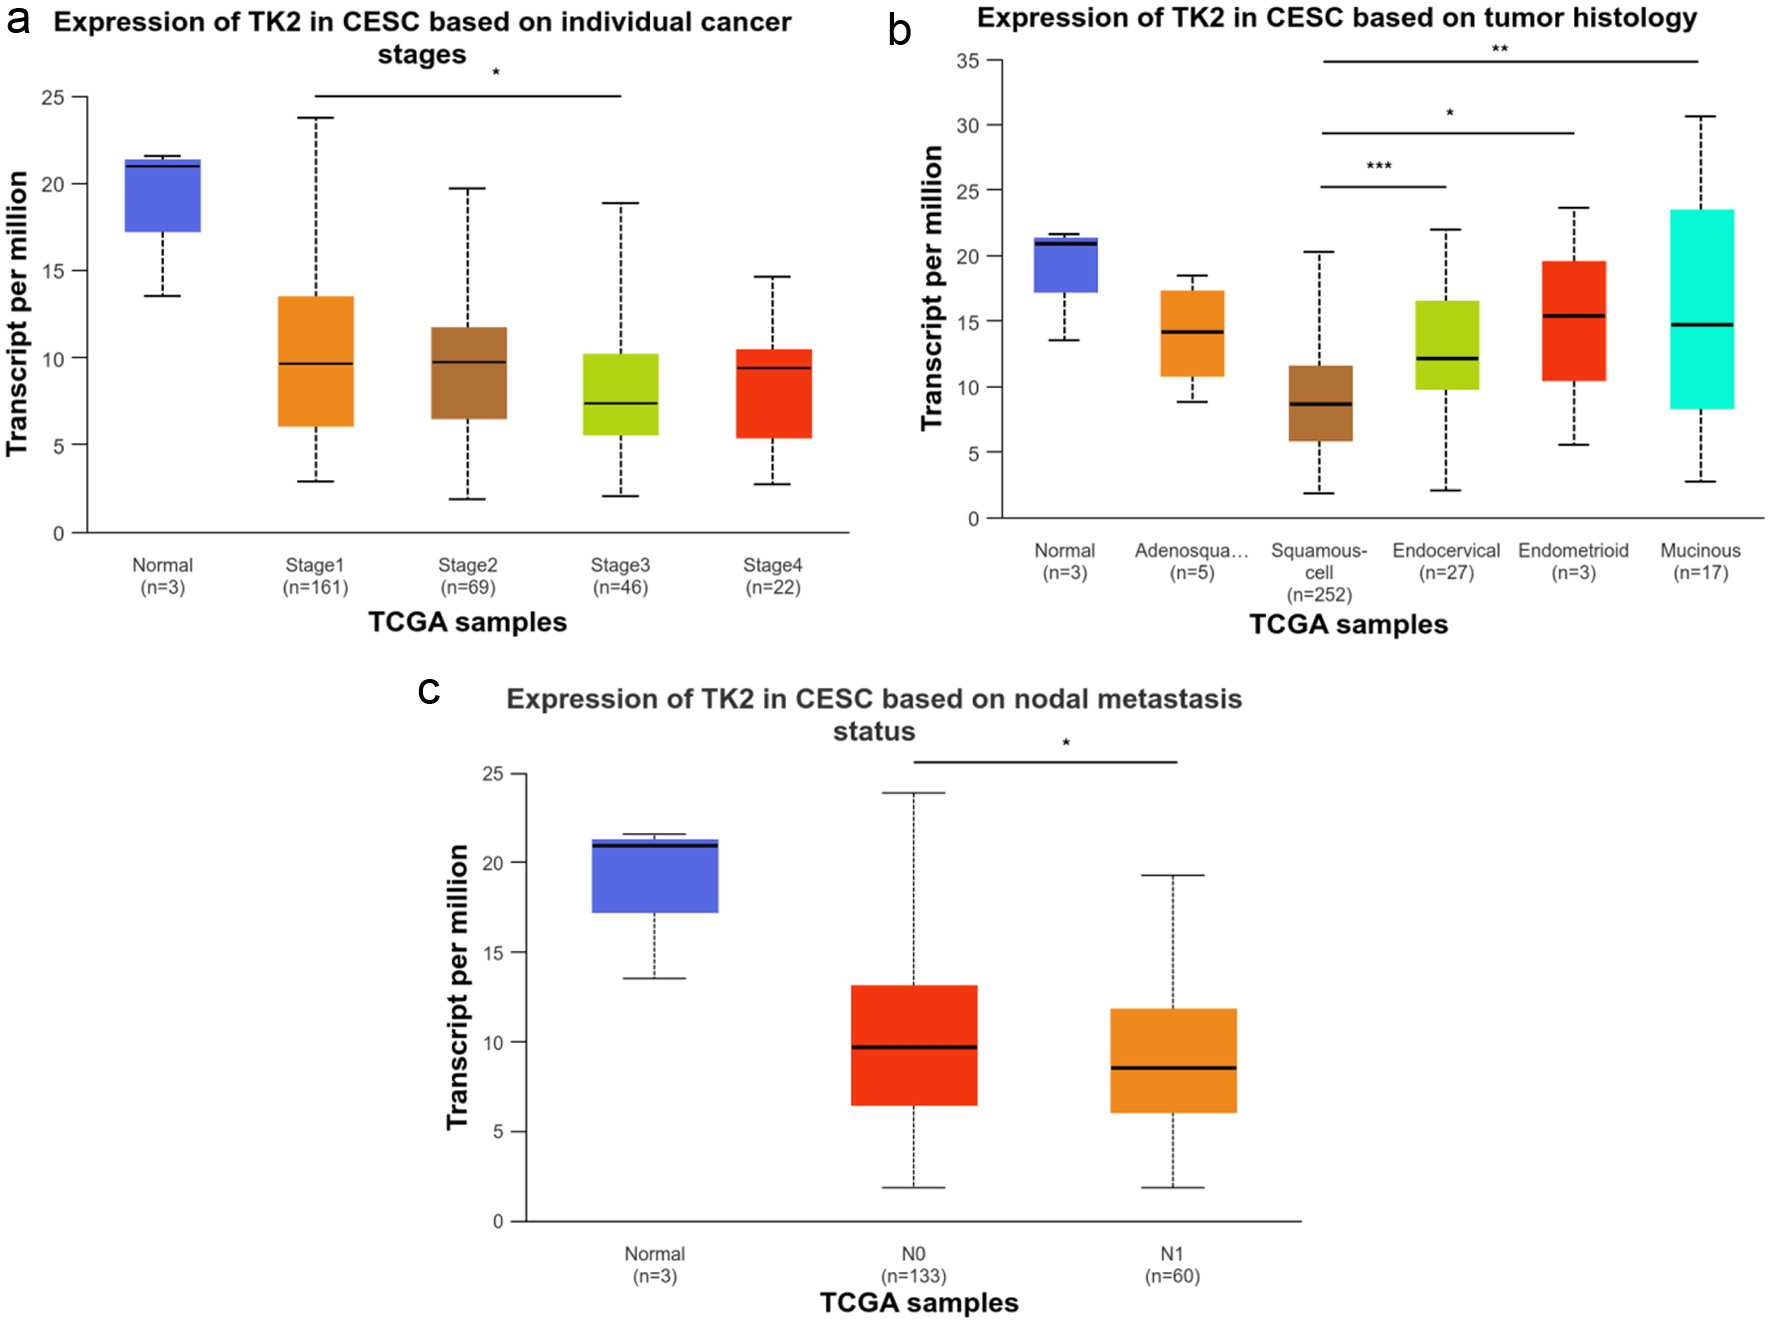
↓ Figure 12. The relationship between TK2
expression and the clinical progression of CESC. (a) TK2 expression in CESC patients with different
cancer stages. (b) TK2 expression in CESC patients with different tumor histology. (c) TK2 expression in
CESC patients with different status of nodal metastasis.
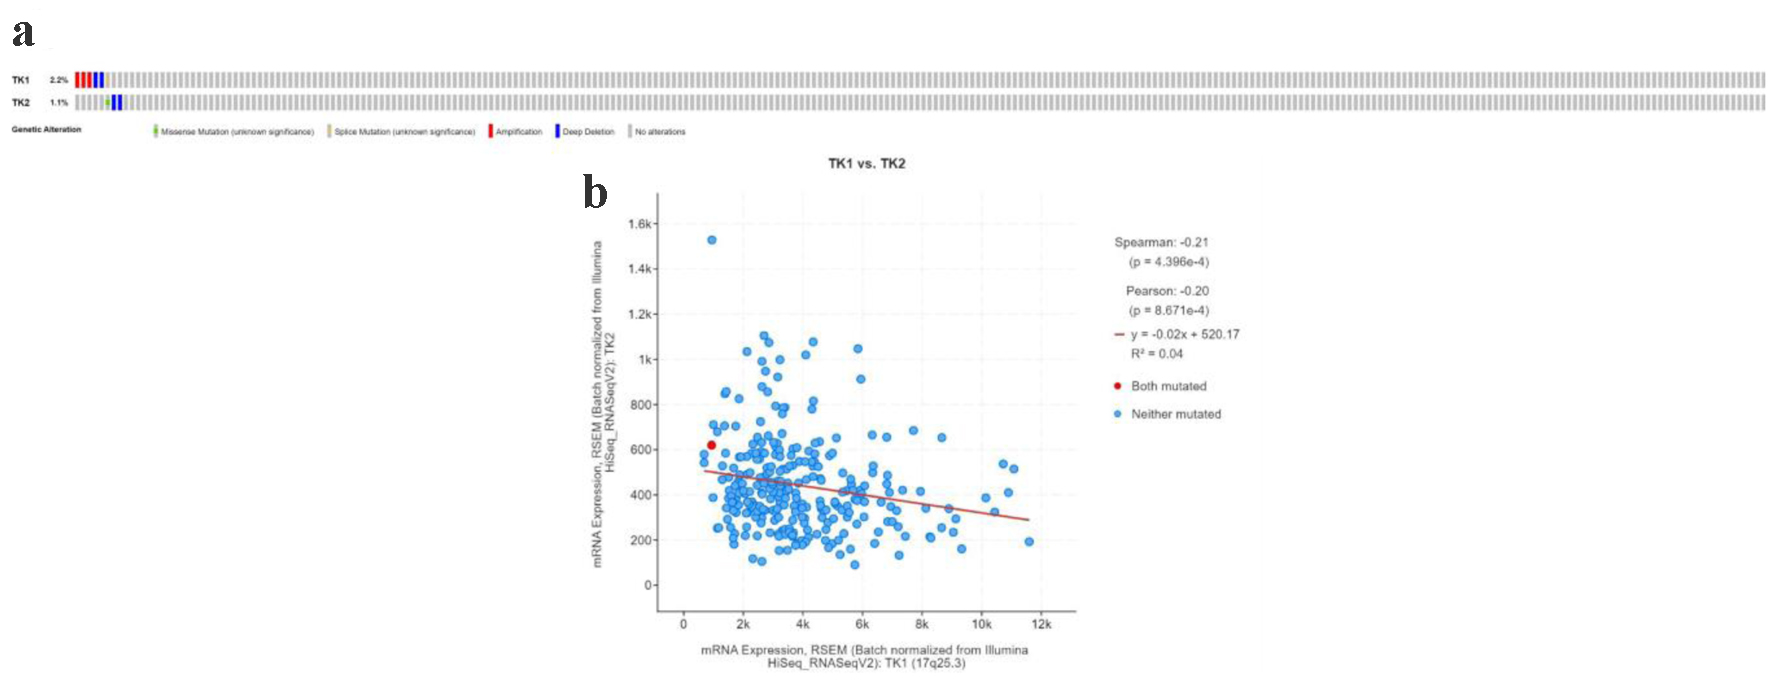
↓ Figure 13. The TK1 and TK2 gene alterations in
CESC patients. (a) The mutation type of TK1 and TK2 in CESC patients. (b) The expression of TK1 and TK2
showed a negative correlation.
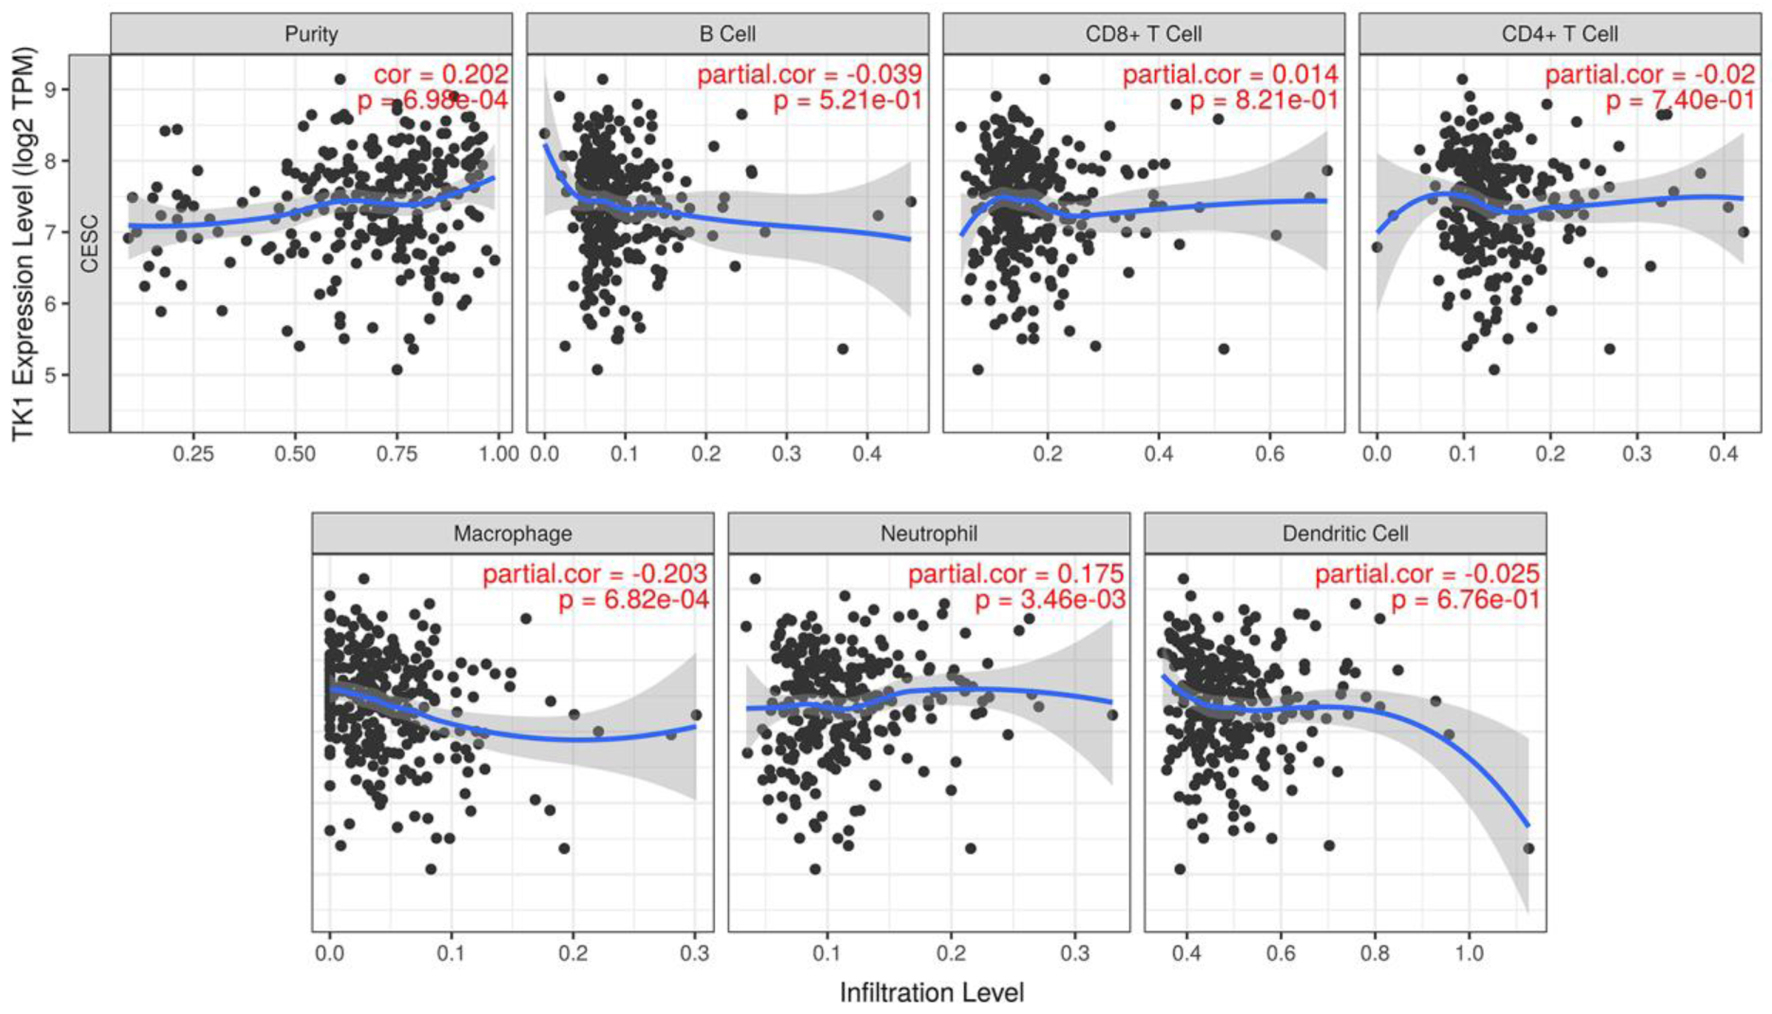
↓ Figure 14. The correlations between TK1
expression and the infiltration level of immune cells in CESC. Scatter plot of the correlations between
TK1 expression and immune infiltration. TPM: transcripts per kilobase million.
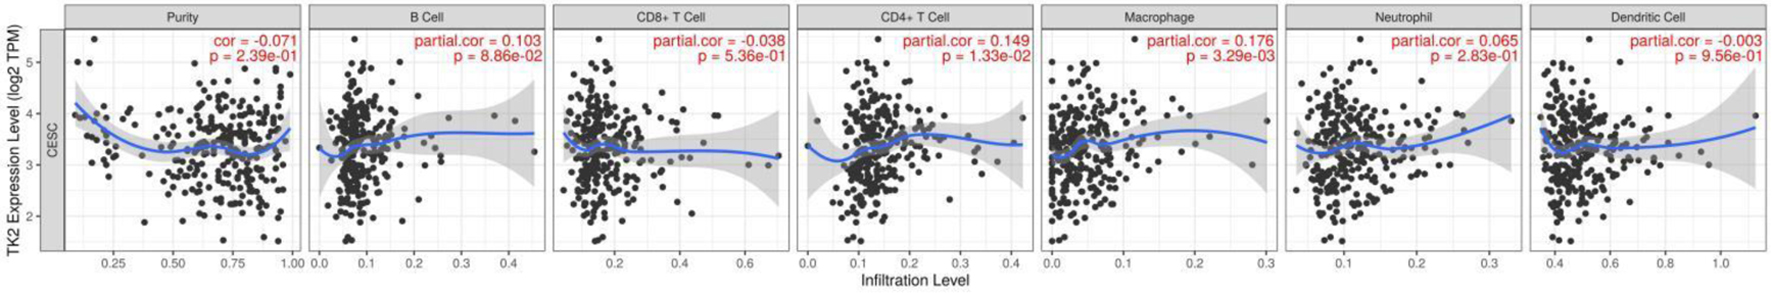
↓ Figure 15. The correlations between TK2
expression and the infiltration level of immune cells in CESC. Scatter plot of the correlations between
TK2 expression and immune infiltration. TPM: transcripts per kilobase million.
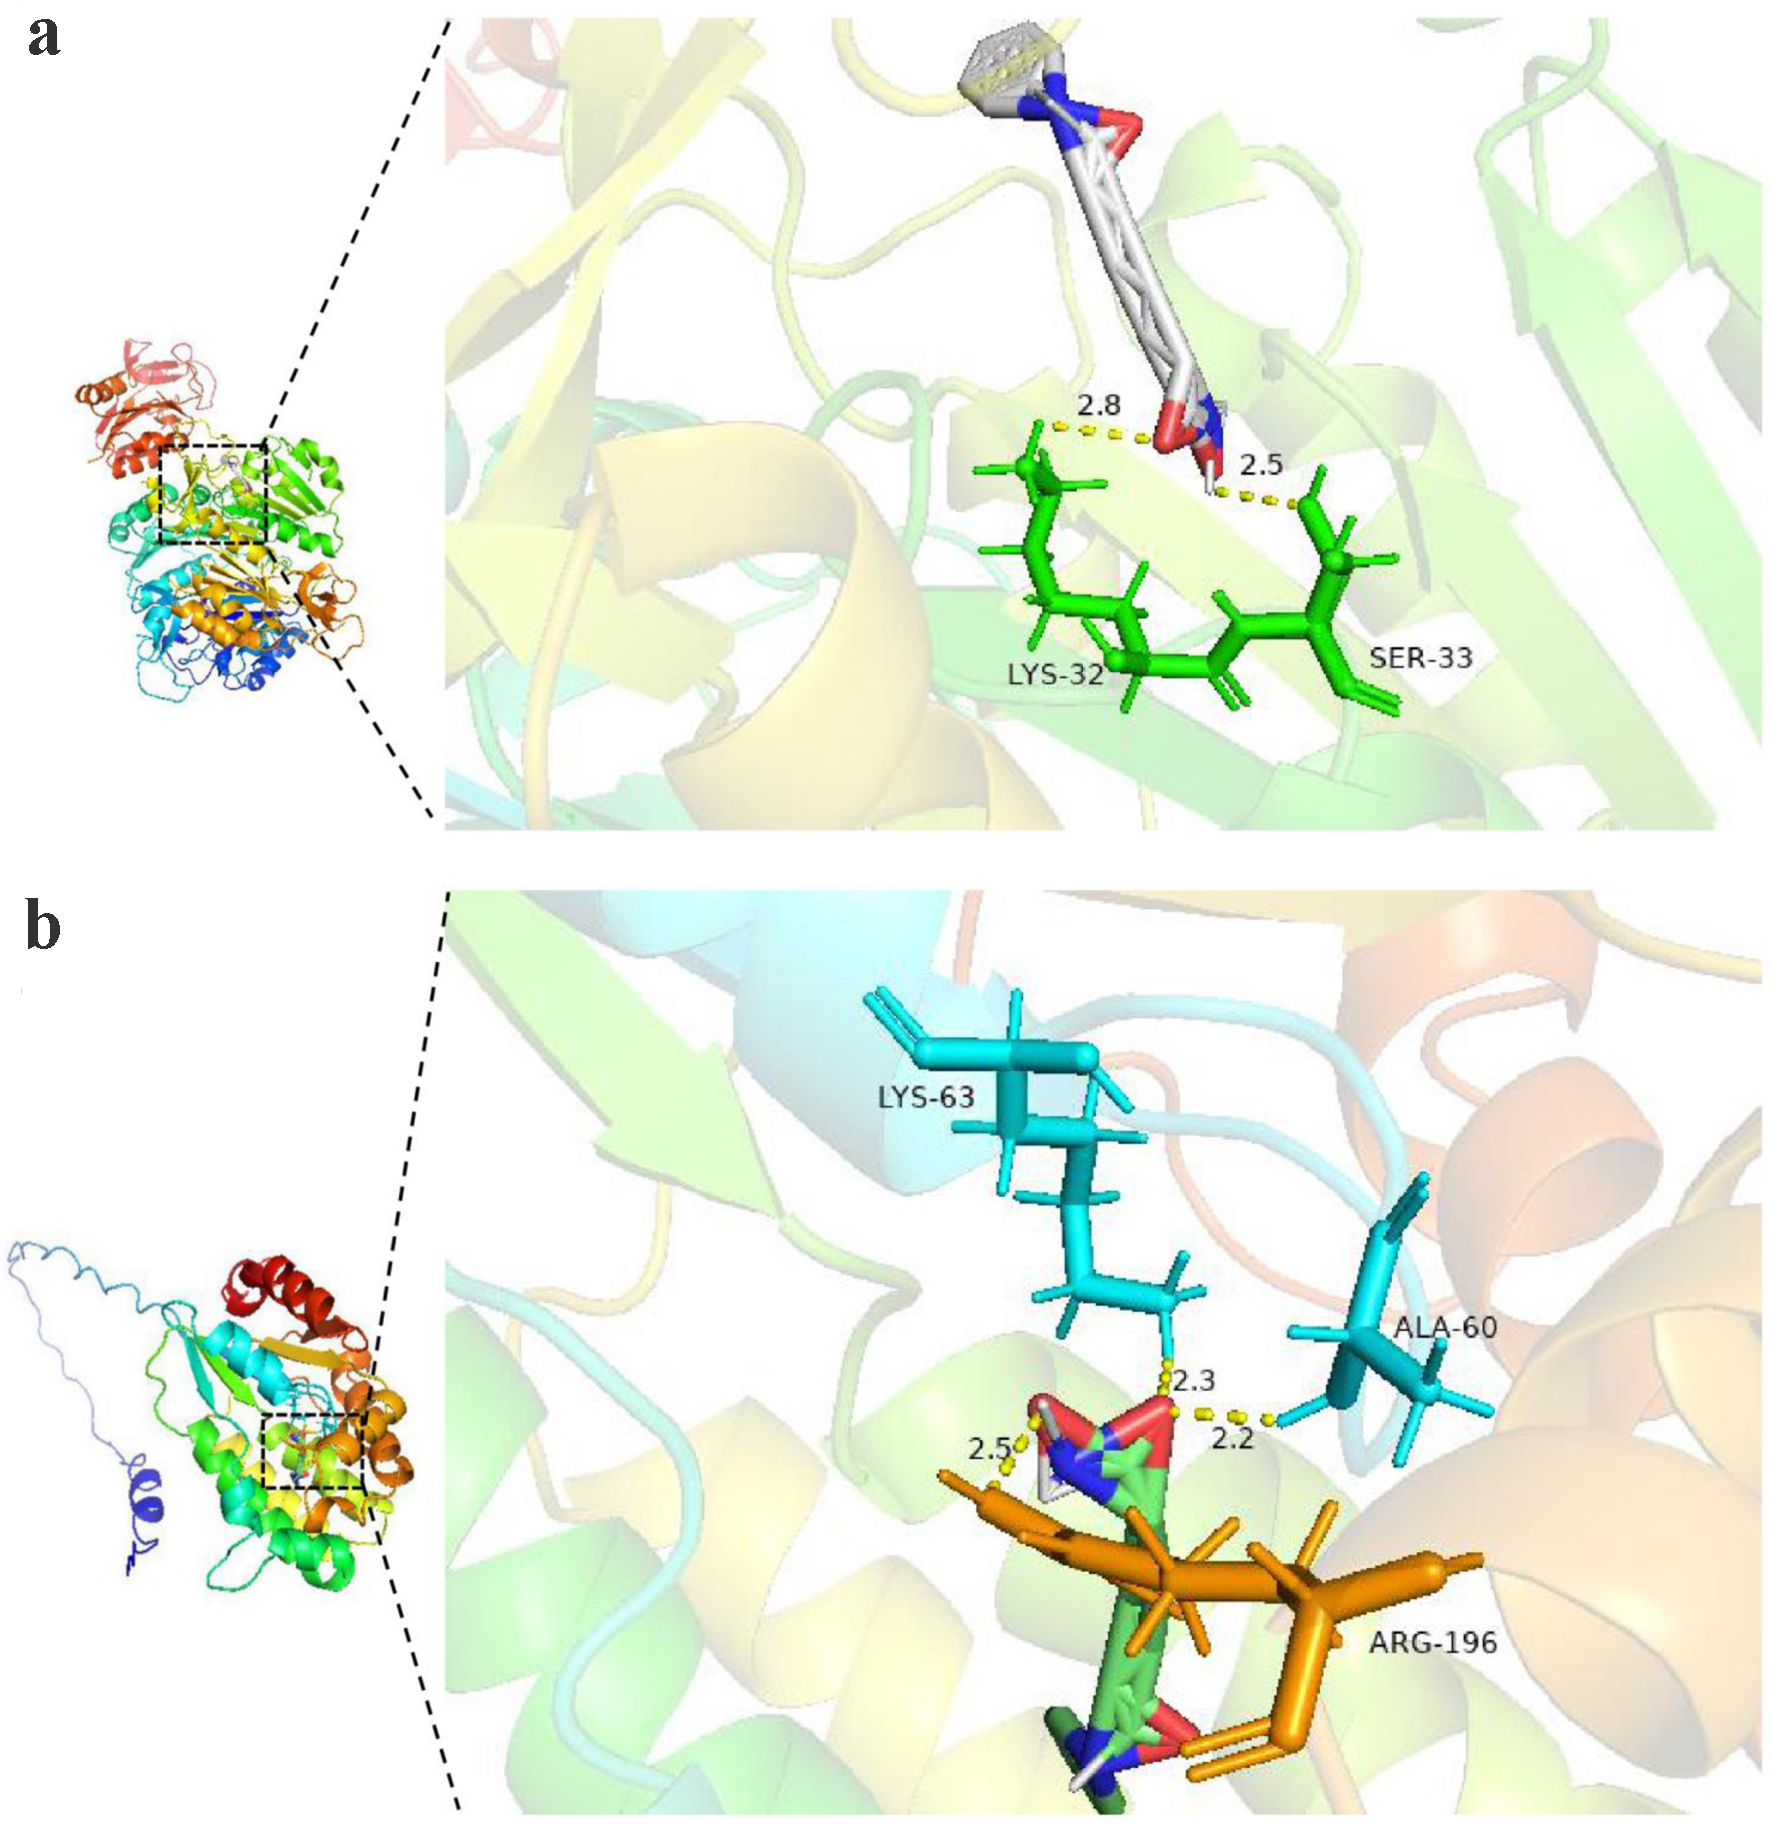
↓ Figure 16. The molecular docking model of
targeted protein and vorinostat (a: TK1 protein; b: TK2 protein).
Tables
↓ Table 1. Basic Information From All Included RNA-seq and Microarray
Datasets of Cervical Cancer
|
Dataset |
Platform |
Country |
First author |
Sample type |
Number of tumor samples |
Number of non-cancer samples |
| GSE7803 |
GPL96 |
USA |
Rork Kuick |
Tissue |
66 |
41 |
| GSE9750 |
GPL96 |
USA |
Murty Vundavalli |
Tissue and cell lines |
|
|
| GSE46857 |
GPL7025 |
India |
Rita Mulherkar |
Tissue |
25 |
4 |
| GSE14404 |
GPL6699 |
India |
Rajkumar T |
Tissue |
28 |
12 |
| GSE29570 |
GPL6244 |
Mexico |
Mariano Guardado-Estrada |
Tissue |
188 |
60 |
| GSE52903 |
GPL6244 |
Mexico |
Ingrid Medina Martinez |
Tissue |
|
|
| GSE52904 |
GPL6244 |
Mexico |
Ingrid Medina Martinez |
Tissue |
|
|
| GSE89657 |
GPL6244 |
Mexico |
Mauricio Salcedo Vargas |
Tissue and cell lines |
|
|
| GSE39001 |
GPL6244 |
Mexico |
Ana Maria Espinosa |
Tissue |
|
|
| GSE27678 |
GPL571 |
United Kingdom |
Ian Roberts |
Tissue and cell lines |
37 |
17 |
| GSE63678 |
GPL571 |
USA |
Prokopios Alexandros Polyzos |
Tissue |
|
|
| GSE6791 |
GPL570 |
USA |
Paul Ahlquist |
Tissue |
100 |
130 |
| GSE27678 |
GPL570 |
United Kingdom |
Ian Roberts |
Tissue and cell lines |
|
|
| GSE63514 |
GPL570 |
USA |
Johan den Boon |
Tissue |
|
|
| GSE4482 |
GPL4926 |
India |
Chandan Kumar |
Tissue |
3 |
4 |
| GSE138080 |
GPL4133 |
Netherlands |
Renske DM Steenbergen |
Tissue |
10 |
10 |
| GSE4482 |
GPL3515 |
India |
Chandan Kumar |
Tissue |
13 |
4 |
| GSE39001 |
GPL201 |
Mexico |
Ana Maria Espinosa |
Tissue |
43 |
12 |
| GSE7410 |
GPL1708 |
Netherlands |
Petra Biewenga |
Tissue |
40 |
5 |
| GSE55940 |
GPL16238 |
China |
Chen Ye |
Tissue |
5 |
5 |
| GSE67522 |
GPL10558 |
United Kingdom |
Sweta Sharma Saha |
Tissue |
20 |
22 |
| GSE26342 |
GPL1053/GPL1052 |
USA |
Natalia Shulzhenko |
Tissue |
34 |
20 |
| TCGA-GTEx |
- |
- |
- |
Tissue |
306 |
14 |
↓ Table 2. Top 10 Drugs With the Smallest Fold Changes Targeting
TK1
| Drug
name |
P
|
q
|
Fold
change |
Specificity |
| Amsacrine |
1.93729 × 10⁻²² |
3.71892 × 10⁻²⁰ |
-3.14512 |
0.000296033 |
| Teniposide |
1.81285 × 10⁻¹⁷ |
2.69123 × 10⁻¹⁵ |
-2.92398 |
0.000296824 |
| Tanespimycin |
2.29969 × 10⁻²² |
1.00411 × 10⁻¹⁹ |
-2.8909 |
0.000137912 |
| MG-132 |
3.37601 × 10⁻¹⁴ |
5.36979 × 10⁻¹¹ |
-2.82185 |
0.000456621 |
| BRD-K68548958 |
9.27931 × 10⁻³² |
1.57734 × 10⁻²⁹ |
-2.8178 |
0.000294118 |
| SA-1919710 |
1.37796 × 10⁻¹³ |
3.83556 × 10⁻¹⁰ |
-2.80677 |
0.001135074 |
| Torin-2 |
1.39394 × 10⁻¹⁷ |
6.33474 × 10⁻¹⁵ |
-2.80657 |
0.000264831 |
| Vorinostat |
6.60819 × 10⁻¹⁷ |
3.75385 × 10⁻¹⁵ |
-2.7822 |
0.000131492 |
| PP-110 |
3.48166 × 10⁻²⁹ |
4.78578 × 10⁻²⁷ |
-2.77853 |
0.000152602 |
↓ Table 3. Top 10 Drugs With the Smallest Fold Changes Targeting
TK2
| Drug name |
P |
q |
Fold change |
Specificity |
| Trichostatin-a |
8.01858 × 10⁻¹¹ |
1.16704 × 10⁻⁸ |
2.23309 |
0.000340136 |
| Trichostatin-a |
7.35718 × 10⁻¹⁴ |
2.08435 × 10⁻¹² |
1.65348 |
0.000168492 |
| BRD-K82750814 |
1.72195 × 10⁻⁶ |
0.000106217 |
1.62714 |
0.000577701 |
| Trichostatin-a |
2.55848 × 10⁻⁶ |
9.05758 × 10⁻⁵ |
1.57637 |
0.000383877 |
| Trichostatin-a |
2.433 × 10⁻¹¹ |
7.10065 × 10⁻¹⁰ |
1.47162 |
0.000194477 |
| Panobinostat |
3.75935 × 10⁻²² |
1.38141 × 10⁻²⁰ |
1.46121 |
0.000128074 |
| Apicidin |
4.55567 × 10⁻¹⁹ |
1.0074 × 10⁻¹⁷ |
1.43291 |
0.000134174 |
| Trichostatin-a |
9.1091 × 10⁻¹¹ |
1.3011 × 10⁻⁹ |
1.4319 |
0.000171028 |
| Tozasertib |
5.76929 × 10⁻⁶ |
0.000052139 |
1.41104 |
0.000120802 |
| Vorinostat |
1.72852 × 10⁻¹⁰ |
2.62555 × 10⁻⁹ |
1.38205 |
0.00017328 |