| World Journal of Oncology, ISSN 1920-4531 print, 1920-454X online, Open Access |
| Article copyright, the authors; Journal compilation copyright, World J Oncol and Elmer Press Inc |
| Journal website https://wjon.elmerpub.com |
Original Article
Volume 16, Number 2, April 2025, pages 210-226
Comprehensive Investigation of a Tyrosine Kinase Inhibitor-Resistant Gene Zeste White 10 in Hepatocellular Carcinoma
Qing Ling Huanga, d, Guan Lan Zhangb, c, d, Qin Yan Sua, Bang Teng Chia, Qian Lina, Shi De Lia, Han Hea, Yu Lu Tanga, Yi Wu Danga, Gang Chena, e, Rong Quan Hec, e
aDepartment of Pathology, The First Affiliated Hospital of Guangxi Medical University, Nanning 530021, Guangxi Zhuang Autonomous Region, China
bDepartment of Gastroenterology, The First Affiliated Hospital of Guangxi Medical University, Nanning 530021, Guangxi Zhuang Autonomous Region, China
cDepartment of Medical Oncology, The First Affiliated Hospital of Guangxi Medical University, Nanning 530021, Guangxi Zhuang Autonomous Region, China
dThese authors contributed equally to this work.
eCorresponding Author: Gang Chen and Rong Quan He, Department of Pathology and Department of Medical Oncology, The First Affiliated Hospital of Guangxi Medical University, Nanning 530021, Guangxi Zhuang Autonomous Region, Chinaand
Manuscript submitted December 19, 2024, accepted February 25, 2025, published online March 9, 2025
Short title: Zeste White 10 in HCC
doi: https://doi.org/10.14740/wjon2514
| Abstract | ▴Top |
Background: Tyrosine kinase inhibitors (TKIs) are first-line therapies for hepatocellular carcinoma (HCC), but the drug resistance restricts the long-term clinical outcomes. This study aimed to investigate the expression patterns and possible clinical significance of a TKI-resistant gene zeste white 10 (ZW10) in HCC.
Methods: Clustered regularly interspaced short palindromic repeats (CRISPR) screening was conducted to obtain TKI-resistant genes. Pan-cancer analysis was employed to analyze the expression landscape of the critical TKI-resistant gene ZW10. Transcriptional expression data for ZW10 were obtained from 76 centers, including 3,312 HCC samples and 2,703 noncancerous tissues. A summary receiver operating characteristic (SROC) curve was built to evaluate ZW10 expression characteristics in HCC. Unpaired two-sample Wilcoxon method was conducted to analyze ZW10 expression levels in HCC of various etiologies. Univariate Cox method was employed to assess the prognostic value of ZW10. Moreover, the gene function within HCC cell lines, the TKI treatment responses, key pathways, and tumor microenvironment of ZW10 were bioinformatically investigated. Drug prediction and molecular docking techniques were used to explore the potency of ZW10 as a novel therapeutic target.
Results: The abundance of small guide RNA (sgRNA) corresponding to ZW10 gene was decreased in the whole genome CRISPR knockout library (LogFC = -1.19), indicating that ZW10 may participate in TKI resistance. The differential expression landscape of ZW10 was found in various malignancies including HCC, which was associated with poorer prognosis. Pooled standardized mean difference (SMD) of ZW10 mRNA expression was 0.47 (95% confidence interval (CI): 0.32 - 0.63), the area under SROC was 0.76 (95% CI: 0.72 - 0.79), the sensitivity was 0.63 (95% CI: 0.53 - 0.72), and the specificity was 0.77 (95% CI: 0.67 - 0.84). ZW10 was investigated significant for the growth of HCC cells. Nucleocytoplasmic transport was the possible pathway that ZW10 involved. High level of ZW10 was reversely associated with TKI responses and the abundance of immune cell infiltration. Mocetinostat and capecitabine were predicted to be the potential inhibitors targeting ZW10 with a minimum binding energy of -8.2 and -7.1 kcal/mol, respectively.
Conclusions: ZW10 is considered a TKI-resistant and tumor-supportive gene, which is also a promising novel prognostic biomarker for HCC or a therapeutic target for overcoming TKI resistance.
Keywords: Hepatocellular carcinoma; Zeste white 10; Tyrosine kinase inhibitor; Resistance; Nucleocytoplasmic transport
| Introduction | ▴Top |
Systemic antitumor therapy is the preferred treatment for advanced hepatocellular carcinoma (HCC) [1]. Tyrosine kinase inhibitors (TKIs) play an important role in first-line and second-line treatment for HCC [2]. However, intrinsic and acquired drug resistance limits the survival benefit of TKIs, extending patient survival by only a few months and restricting long-term clinical outcomes [2, 3]. Therefore, identifying effective biomarkers for guiding TKI-stratified therapy and targeting TKI resistance is crucial for improving patient prognosis.
Clustered regularly interspaced short palindromic repeats (CRISPR) is a powerful genome-wide tool that utilizes small guide RNAs (sgRNAs) to modify genes across the entire genome [4]. Within the CRISPR knockout library, knocking out a drug-resistant gene prevents cell survival under drug treatment, causing lower sgRNA abundance, as detected via DNA sequencing. This study employed CRISPR screening to uncover TKI-sensitive and resistant genes, underscoring its importance in drug resistance research. Notably, zeste white 10 (ZW10) was identified as a critical TKI-resistant gene and a potential therapeutic target for overcoming TKI resistance.
ZW10 plays a crucial role in spindle assembly checkpoint signaling during mitotic chromosome segregation, guiding spindle assembly. Phosphorylation of ZW10 by PLK1 ensures proper chromosome segregation and contributes to the inactivation of the spindle checkpoint, preventing premature mitotic exit [5, 6]. Despite its pivotal function, ZW10 remains underexplored in the field of cancer research, with limited reports indicating its upregulation in colorectal cancer and showing that ZW10 deficiency inhibits cell proliferation [7]. Additionally, loss of ZW10 promotes melanoma resistance to alkylating agents [8]. However, no studies have yet investigated the relationship between ZW10 and HCC, presenting an intriguing avenue for future research.
This research was designed to ascertain the TKI-resistant genes through an in-house CRISPR screen experiment, while also evaluating the expression characteristics in HCC along with the prospective clinical value of the critical TKI-resistant gene ZW10 in HCC. We have collected multicenter mRNA datasets to integrate the expression status of ZW10 gene in HCC tissue. The expression level of ZW10 was analyzed in HCC patients with different etiology backgrounds. Prognostic analyses and biological mechanism analysis were used to further investigate the clinical value of ZW10, while molecular docking techniques were used to explore the possibility of ZW10 as an innovative therapeutic target.
| Materials and Methods | ▴Top |
Genome-wide CRISPR knockout screen
For the materials used in this experiment, Huh7 cell line was sourced from the Cell Bank of the Chinese Academy of Sciences. The human genome-wide CRISPR/Cas9 knockout library v2 (GeCKO v2) covering 65,386 specific sgRNAs (Addgene company, number: 1000000048) and lentiCRISPRv2 vectors carrying Cas9 and puromycin resistance (Addgene company, number: 1000000048) was purchased to construct gene-deficient cell models. During the experiment, to ensure every cell was infested by only one specific sgRNA, the multiplicity of infection was set to less than 0.3. After lentivirus transfection, puromycin treatment was performed to screen the whole genome knockout HCC cells. Subsequently, the HCC cells infected with the lentivirus were treated with anlotinib, a TKI drug produced by Jiangsu Zhengda Tianqing Company, for 21 days. The DNAs of the survived HCC cells were exacted and sequenced by Beijing Noa Zhiyuan Technology Company. To ensure the reliability of the final data, joint data, unknown data, and low-quality data were eliminated and quality control was carried out. Ultimately, the MAGeCK algorithm was utilized for quality assessment and gene expression profiling in the CRISPR/Cas9 genome-wide knockout analysis. Based on the negative screening strategy, the genes with lower sgRNA abundance were considered to be TKI-resistant. The research received Institutional Review Board Approval from the Ethics Committee of the First Affiliated Hospital of Guangxi Medical University and Institutional Animal Care and Use Committee Approval from Guangxi Medical University.
Pan-cancer analysis
To broaden the biological context for investigating ZW10 and to validate its significance across diverse cancers, the transcriptional data and matched clinical information for 33 solid tumors were sourced from The Cancer Genome Atlas (TCGA) database [9]. The differential expression of ZW10 mRNA and its correlation with survival prognosis among various tumors were examined. UALCAN [10] database and The Human Protein Atlas (THPA) database [11] were utilized to demonstrate the ZW10 protein levels within solid tumors.
Gene chip or RNA-sequencing dataset collection
Given the distinct biological nature of HCC compared to other cancer types, this study required further investigation into the impact of ZW10 in HCC to validate the findings observed in the pan-cancer analysis. The Gene Expression Omnibus (GEO) database [12], Sequence Read Archive (SRA) database [13], ArrayExpress database [14], Oncomine database [15], TCGA and the Genotype-Tissue Expression (GTEx) database [16] were retrieved to collect mRNA datasets. The search strategy was as follows: liver neoplasm OR hepatic neoplasm OR hepatocellular cancer OR hepatocellular carcinoma OR hepatic cancer OR hepatic carcinoma OR liver cancer OR cancer of liver. Datasets would be included if the following criteria were met: 1) Homo sapiens; 2) The datasets were mRNA sequencing data in human tissue, containing HCC tissue group and non-cancer hepatic tissue group; 3) The number of HCC samples and non-cancer hepatic samples in each dataset was not less than 3. Datasets would be eliminated for the following conditions: 1) Samples were originated from cell line; 2) Samples were intervened by heat treatment, gene editing or drug treatment; 3) Samples belonged to other subtypes of liver cancer such as cholangiocarcinoma, mixed liver cancer or heterozygous liver cancer; 4) The data could not be obtained or calculated. After data screening, the datasets from the same sequencing platform were merged and batch effects were removed. Besides, log2 (x + 1) normalization was performed for the datasets with large data fluctuation ranges.
Pooled analysis
The standardized mean difference (SMD) was integrated to reflect the mRNA level of ZW10 in HCC through STATA version 17. The overall heterogeneity was estimated using the I2 statistic and Q test. If I2 is greater than 50% and Q test has a P value lower than 0.10, the overall heterogeneity is deemed obvious, requiring the use of a random effect model for SMD combination. A summary receiver operating characteristic (SROC) curve was pictured, along with the computation of the area under the curve (AUC) to further verify ZW10 expression in HCC. Egger’s test was utilized to detect publication bias.
Etiology stratification analysis
To explore the relationship between ZW10 and HCC of different etiologies, statistical analyses were conducted to assess the expression levels of ZW10 mRNA across various HCC subgroups. These subgroups included alcohol consumption, hepatitis (B or C), hepatitis B, hepatitis C, the combination of alcohol consumption and hepatitis (B or C) and non-alcoholic fatty liver disease. The expression data of ZW10 and clinical information of HCC patients used were downloaded from TCGA database. Unpaired two-sample Wilcoxon method was employed for these analyses.
Clinical significance and prognosis
TCGA database provided the prognostic data for HCC patients, where samples lacking complete clinical data were deleted, and parameters containing excessive unknown information were excluded from the analysis. Univariate Cox regression method was utilized to compute the hazard ratios (HRs) of ZW10 transcriptional expression value, age, gender, race, primary tumor stage (pT stage) as well as the American Joint Committee on Cancer (AJCC) stage, and assess the risk of the above factors for HCC death. If an HR is greater than 1, it indicates that the corresponding factor is a risk factor for the occurrence of the event, otherwise is protective. Wilcoxon method was employed to analyze the link between ZW10 mRNA levels with the clinicopathologic features including age, gender, race, pT stage, and AJCC stage. The package “survminer” in R software was employed to compute the optimum cutoff, thereby categorizing all the samples into ZW10-high and ZW10-low level groups based on the expression value. The Kaplan-Meier curves combined with the log-rank test were employed to investigate the association between ZW10 transcriptional level with the overall survival time. When the Kaplan-Meier curves cross, the log-rank test will be unsuitable and replaced with a two-stage test [17].
Gene interference effect
Gene dependence refers to the necessity of genes for cell colony and proliferation. The DepMap team used genome-wide RNAi or CRISPR knockout techniques to analyze the impacts of different gene knockouts on the growth of cancerous cell lines. This study downloaded the “CRISPR (DepMap 22Q2 Public+Score Chronos)” data, extracted the gene effect value of ZW10-deficiency on 20 HCC cell lines and visualized the result by a scatter plot. A gene effect value less than 0 indicates that the effect of gene knockout is to inhibit cell viability.
Investigation of ZW10 expression and TKIs responses
To comprehensively understand ZW10’s potential contribution to resistance against multiple TKI drugs, the authors utilized the “pRRophetic” package to explore the relationship between ZW10 transcription levels and the half-maximal inhibitory concentration (IC50) of various TKI components. The cohort of ZW10 sequencing data was standardized using the transcripts per million (TPM) method based on the LIHC-TCGA dataset. Dependent upon the average of ZW10 transcriptional level, the samples were categorized into ZW10-high and ZW10-low level groups, and the relationships between ZW10 and the effectiveness of TKI drugs were explored using independent samples t-test and Pearson analysis.
Genes with differential expressions and the corresponding biological pathways
The differentially upregulated genes of 371 HCC tissues compared with 50 non-HCC tissues were calculated by “limma” package, with logFC > 1 as the reference standard. Secondly, Pearson correlation coefficients between ZW10 gene expression and other gene expression were calculated, and the genes exhibiting a Pearson correlation coefficient greater than 0.75 and a P value lower than 0.05 were identified as strongly positive correlation genes of ZW10. The intersective genes between differentially upregulated genes and ZW10 strongly positive correlation genes were input into DAVID database [18] for biological mechanism analysis [19].
Tumor microenvironment exploration
The “xCell” is a tool that can predict immune cell abundance in an individual sample through single-sample Gene Set Enrichment Analysis (ssGSEA), founded upon gene expression cohort. Sixty-four cell types, including innate and adaptive immune-associated cells, hematopoietic progenitor cells, epithelial cells, and stromal cells that secrete various factors to regulate the tumor microenvironment, can be predicted [20]. In this study, the “xCell” package was utilized to estimate the tumor microenvironment characteristics of 371 HCC samples. Moreover, the differences in tumor microenvironment characteristics under different ZW10 expression levels were compared with the Wilcoxon test, and the correlations between the ZW10 expression level and the tumor microenvironment cells were investigated using the Spearman method.
Drug prediction and molecular docking simulation
Connectivity Map Linked User (CLUE) database [21] records the gene expression profile of various cell lines after dosing with compounds. The ZW10 strongly positive correlation genes were input into the “Query” option to identify compounds that make the tumor cell expression profiles resemble the input gene profile. A similarity score was used to show the similarity between the effect of small molecule compounds and the input gene set. A positive score indicates that small molecule compounds have a positive effect on the input gene set, otherwise the opposite effect. The compound exhibiting the highest negative score was screened as a candidate inhibitor for ZW10, and the molecular docking simulation between the compound and ZW10 protein structure was performed through Autodock Tools 1.5.6 and Vina tool to analyze the affinity. Although first- and second-line treatments for HCC primarily rely on TKIs, clinical trials have demonstrated that capecitabine shows potential in second- and third-line treatments for HCC. Based on this, molecular docking was further conducted to investigate the binding interaction between ZW10 and capecitabine (PubChem CID: 60953) [22].
Statistical analyses
The statistical software utilized in this study included R (released version 4.1.1), STATA (released version 17), as well as GraphPad Prism (released version 8.0.2). Wilcoxon test and independent samples t-test were employed in the difference analyses between the two groups. Univariate Cox regression method was utilized to compute the HR values and investigate the dangerous factors. The Kaplan-Meier curve, the log-rank test or the two-stage test were conducted for survival prognosis analyses. The Pearson and Spearman methods were employed for correlation analyses. Statistical significance is noted if a P value is less than 0.05.
| Results | ▴Top |
Positive and negative CRISPR screen
DNA sequencing and biological analysis were performed on the survived cells. In the gene profile of the TKI treatment group, the abundance of sgRNA corresponding to ZW10 was decreased (LogFC = -1.19, P = 0.01, Fig. 1), indicating that the HCC cells with ZW10-defect were more sensitive to the TKI and likely to die.
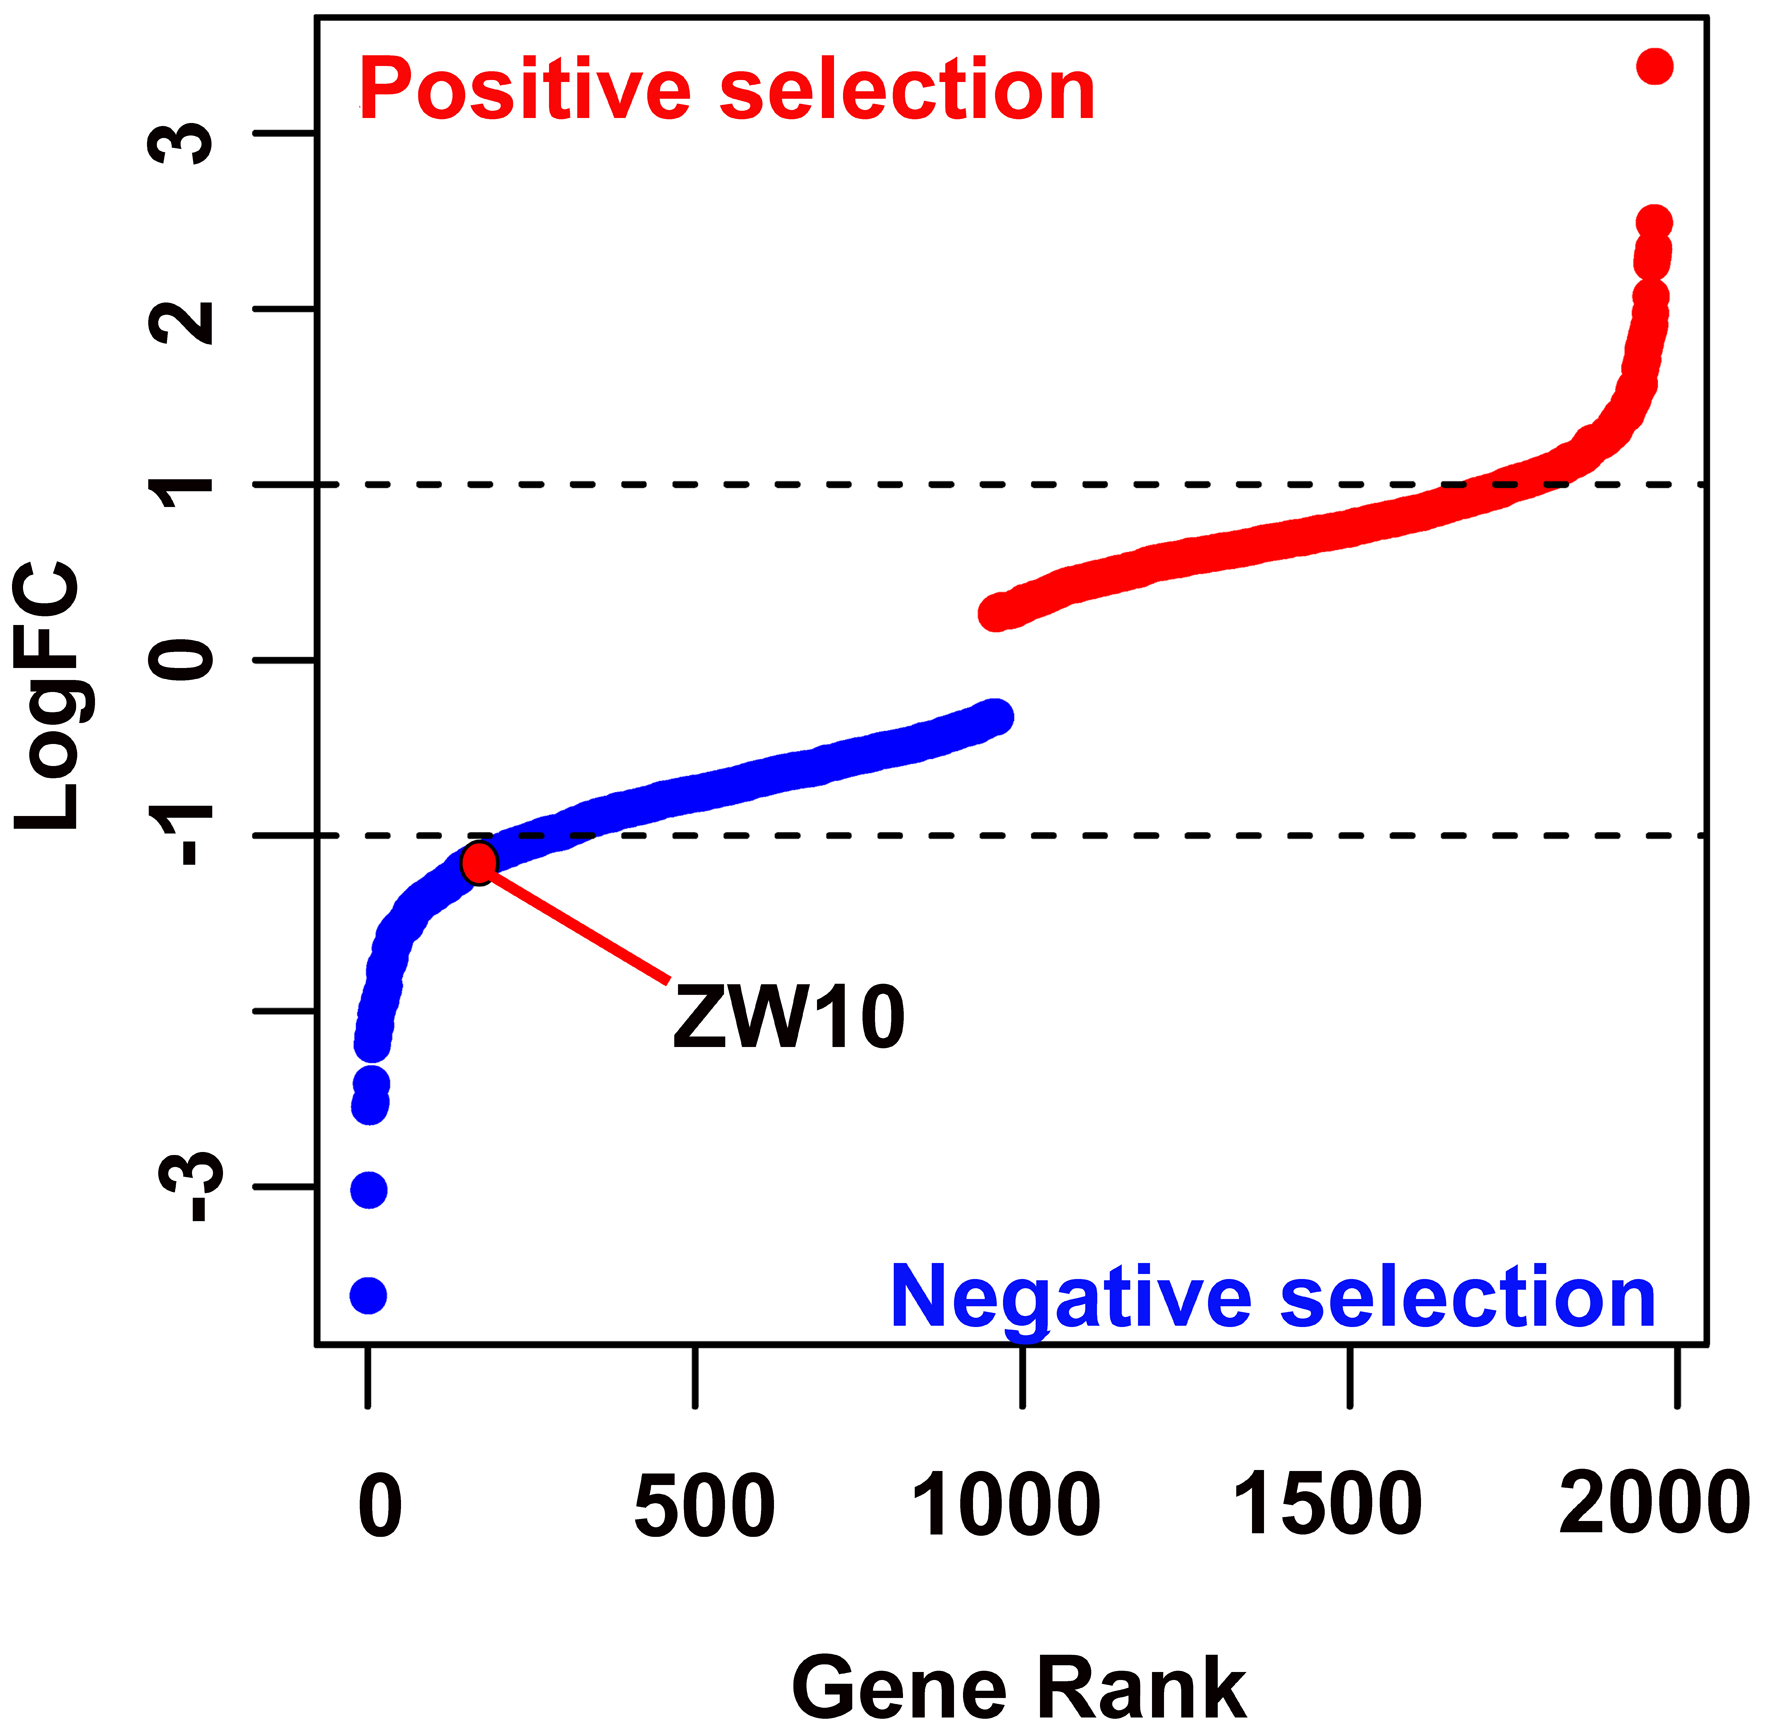 Click for large image | Figure 1. The positive and negative screen of CRISPR screen experiment. CRISPR: clustered regularly interspaced short palindromic repeats. |
ZW10 expression landscape in various malignancies
As exhibited in Figure 2a, the transcriptional level of ZW10 was differentially elevated in BLCA, CESC, CHOL, COAD, ESCA, GBM, HNSC, LIHC, LUAD, LUSC, READ, STAD, and UCEC, and differentially decreased in KIRC, KIRP, and THCA. For the protein expression, ZW10 was highly detected in BRCA, COAD, UCEC, LUAD, HNSC, GBM, and LIHC, and weakly detected in KIRC and PAAD (Fig. 2b). Microscopically, immunohistochemical (IHC) pictures showed that the ZW10 protein was located in the cytoplasm. Compared with the normal tissue, the cells in HCC tissue had enlarged nuclei and higher staining density (Fig. 2c). According to the outcomes of univariate Cox regression analyses, ZW10 was related to the poorer overall survival of ACC, BLCA, KICH, LGG, LIHC, PAAD, PRAD, and SARC (Fig. 3a), poorer disease-specific survival of ACC, BLCA, KICH, LGG, LIHC, PAAD, and SARC (Fig. 3b), poorer disease-free interval of HNSC and PAAD (Fig. 3c), and progression-free interval of ACC, BLCA, HNSC, KICH, LGG, LIHC, and PAAD (Fig. 3d).
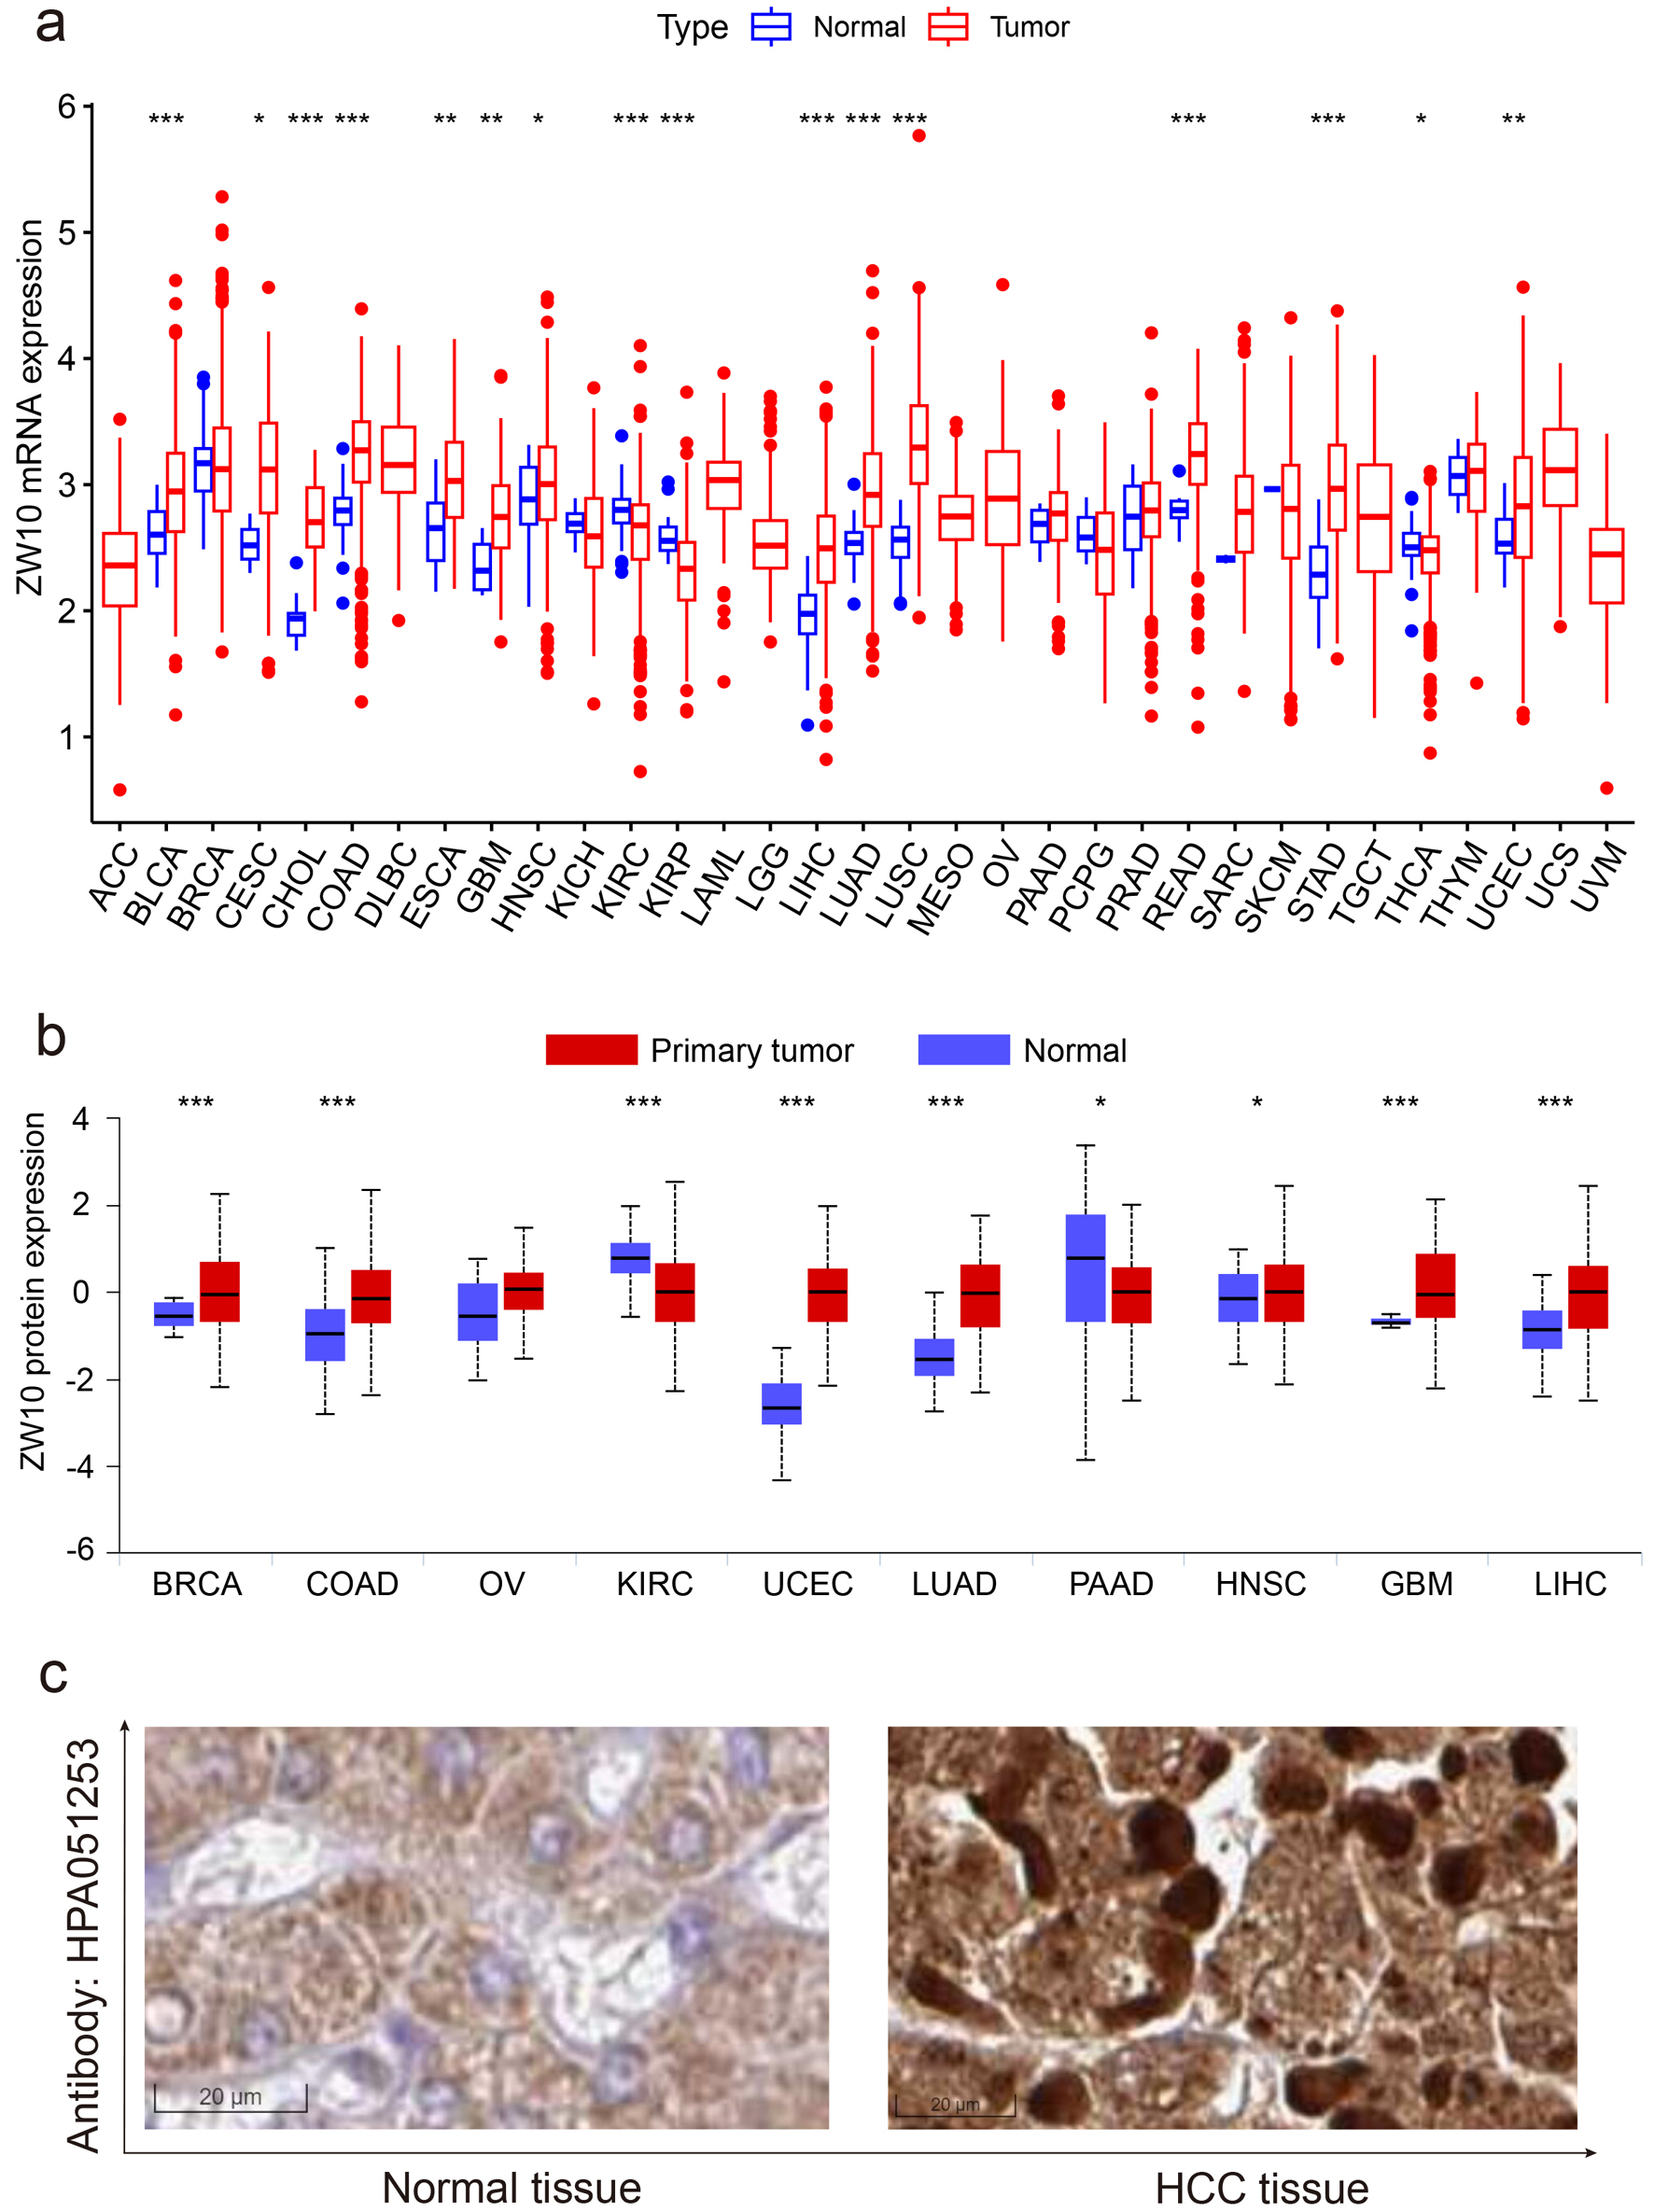 Click for large image | Figure 2. The expression level of ZW10 within primary malignancies. (a) mRNA expression status. (b) Protein expression status. (c) Immunohistochemical staining picture. ACC: adrenocortical carcinoma; BLCA: bladder urothelial carcinoma; BRCA: breast invasive carcinoma; CESC: cervical squamous cell carcinoma and endocervical adenocarcinoma; CHOL: cholangiocarcinoma; COAD: colon adenocarcinoma; DLBC: lymphoid neoplasm diffuse large B-cell lymphoma; ESCA: esophageal carcinoma; GBM: glioblastoma multiforme; HNSC: head and neck squamous cell carcinoma; KICH: kidney chromophobe; KIRC: kidney renal clear cell carcinoma; KIRP: kidney renal papillary cell carcinoma; LAML: acute myeloid leukemia; LGG: brain lower grade glioma; LIHC: liver hepatocellular carcinoma; LUAD: lung adenocarcinoma; LUSC: lung squamous cell carcinoma; MESO: mesothelioma; OV: ovarian serous cystadenocarcinoma; PAAD: pancreatic adenocarcinoma; PCPG: pheochromocytoma and paraganglioma; PRAD: prostate adenocarcinoma; READ: rectum adenocarcinoma; SARC: sarcoma; SKCM: skin cutaneous melanoma; STAD: stomach adenocarcinoma; TGCT: testicular germ cell tumors; THCA: thyroid carcinoma; THYM: thymoma; UCEC: uterine corpus endometrial carcinoma; UCS: uterine carcinosarcoma; UVM: uveal melanoma. |
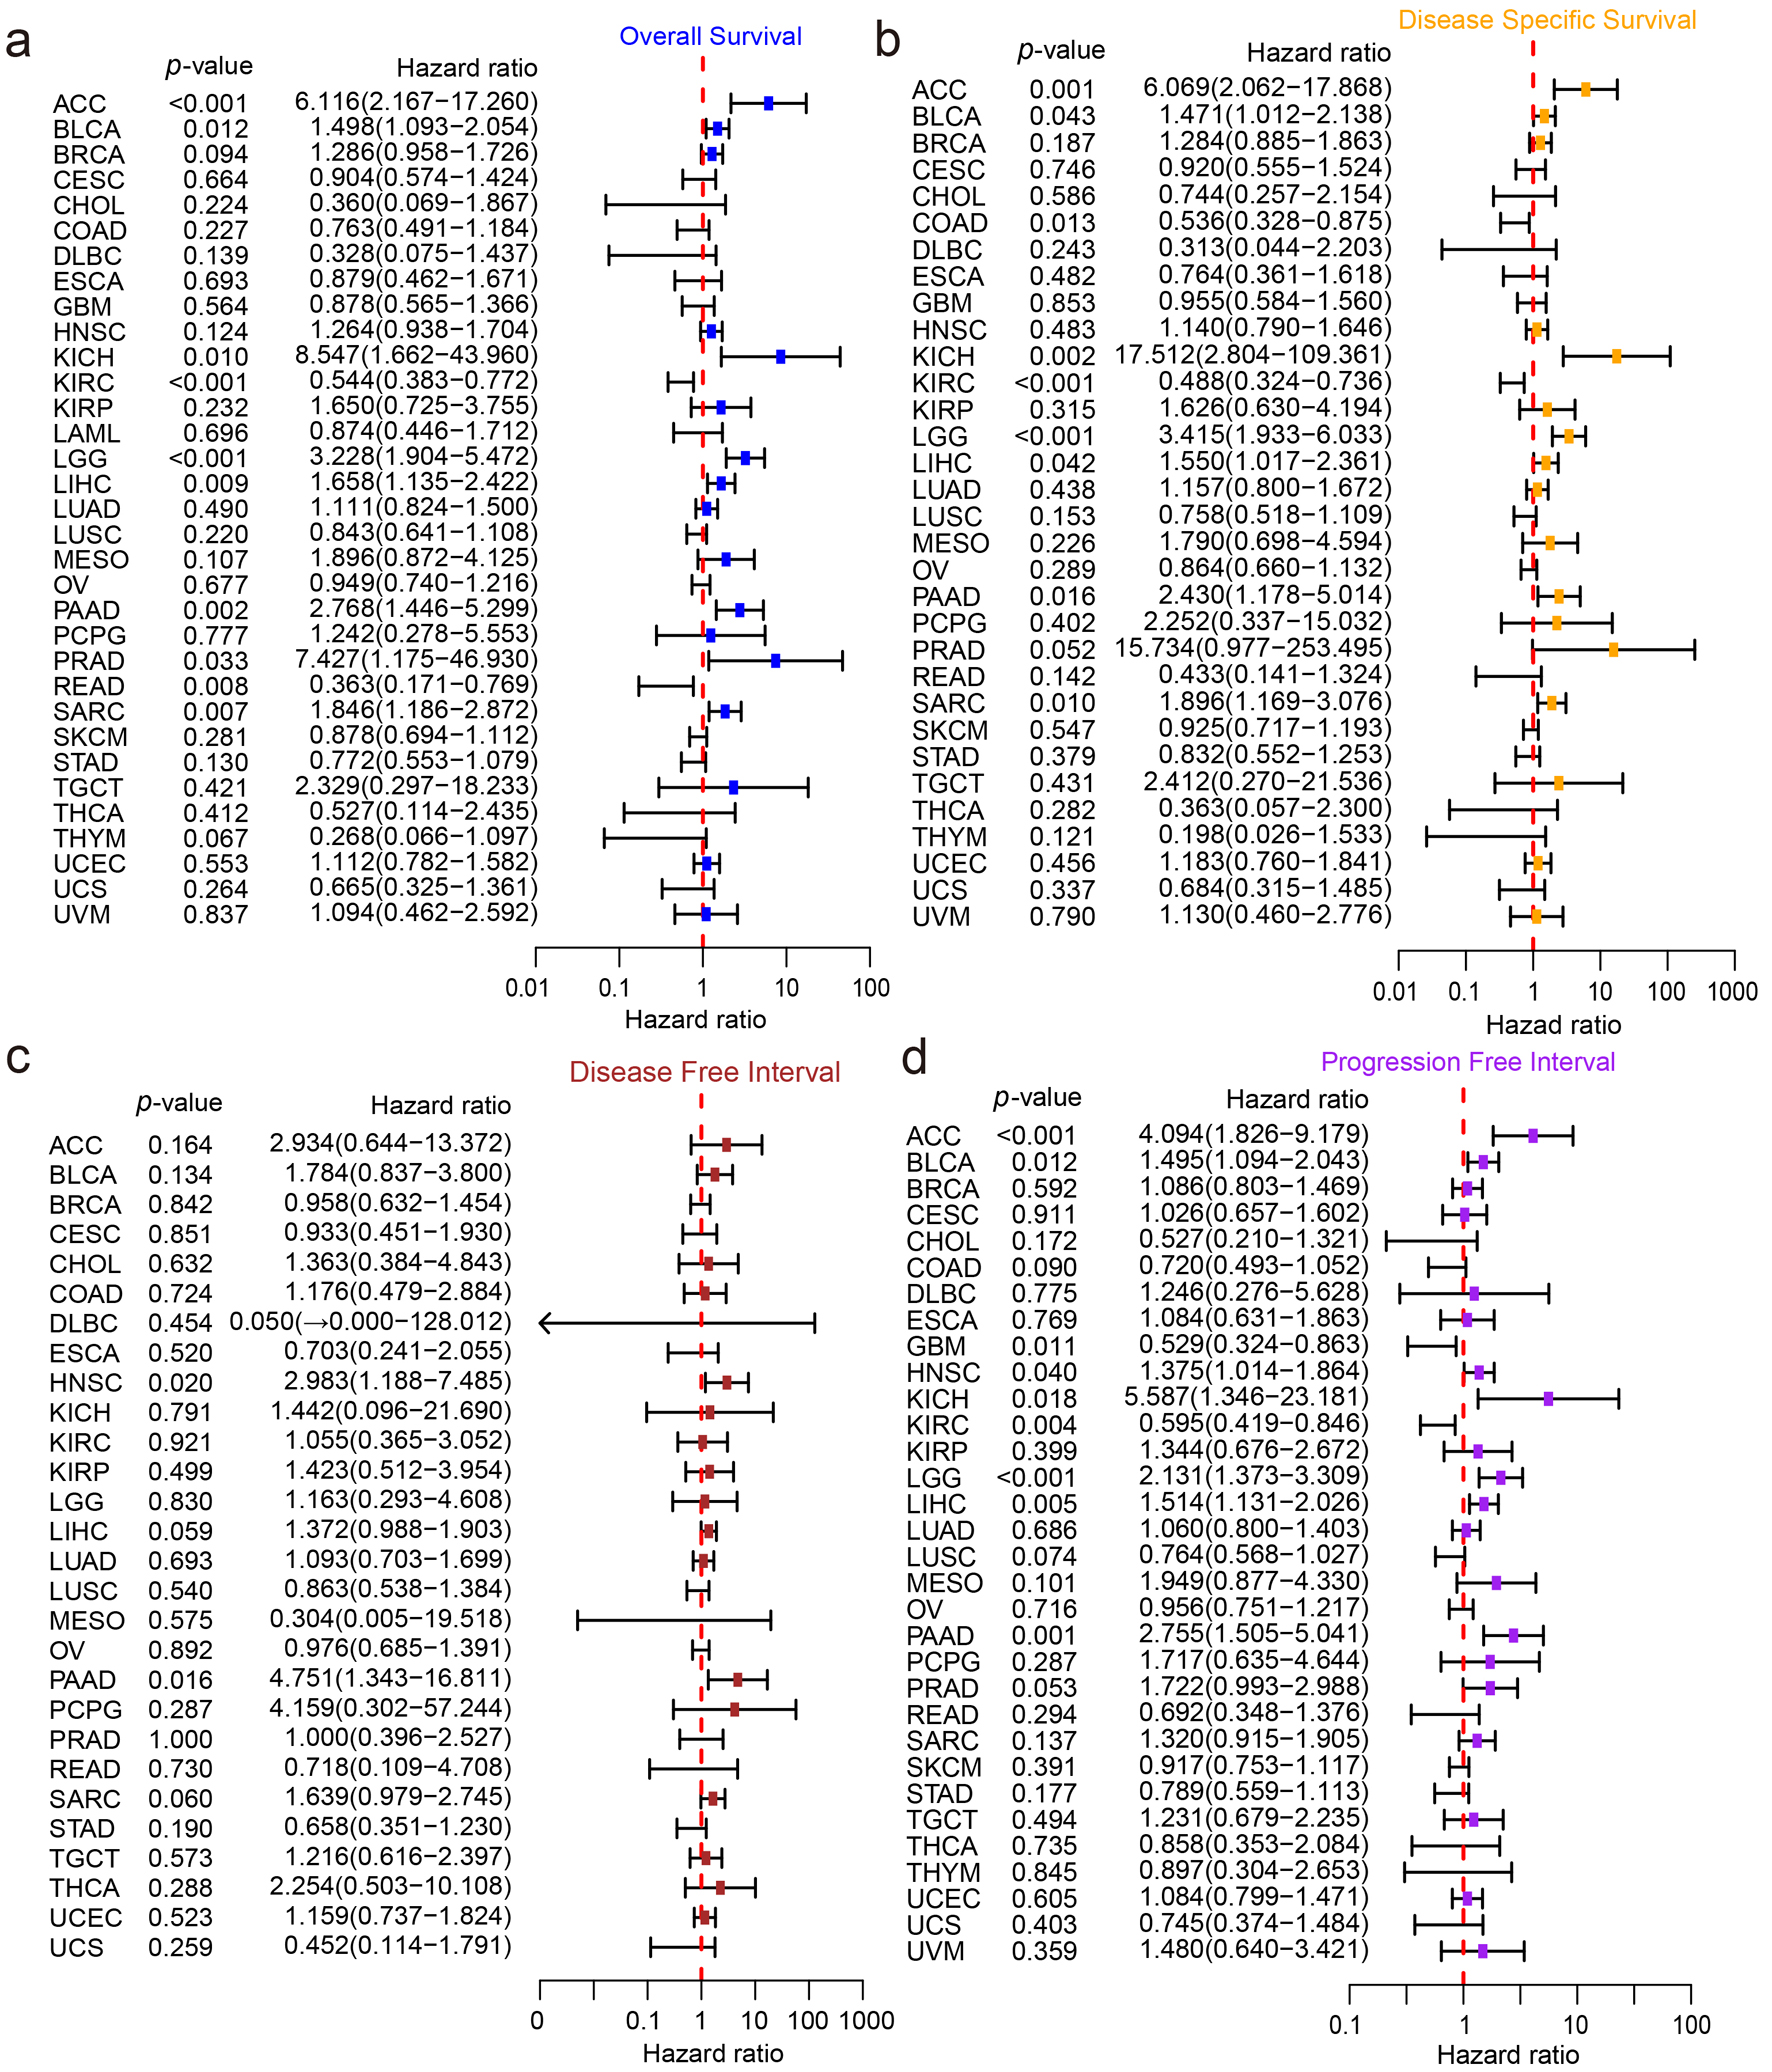 Click for large image | Figure 3. The survival analysis of ZW10 across various cancers. (a) Overall survival analysis. (b) Disease-specific survival analysis. (c) Disease-free interval analysis. (d) Progression-free interval analysis. |
ZW10 expression and discrimination efficacy
Totally 38 datasets containing 3,312 HCC samples and 2,703 non-HCC samples were included from 76 research centers. Based on the results of I2 statistics value and the Q test (Fig. 4a), the overall heterogeneity of the integrated analysis was significant (I2 = 82.9%, P < 0.01) and the random effect was adopted to combine the SMD. The mean value and standard deviation were severally used to describe the central tendency and dispersion of the ZW10 expression level in HCC group compared to non-HCC group (Supplementary Material 1, wjon.elmerpub.com). The expression level of ZW10 gene exhibited an obvious elevation in HCC group (SMD = 0.47, 95% CI: 0.32 - 0.63). The AUC was 0.76 (95% CI: 0.72 - 0.79). The sensitivity and specificity of ZW10 in differentiating HCC were correspondingly 0.63 (95% CI: 0.53 - 0.72) and 0.77 (95% CI: 0.67 - 0.84, Fig. 4b). The included datasets had no obvious publication bias (P = 0.115, Fig. 4c). All of the aforementioned results indicated an upregulation of ZW10 expression in HCC tissues.
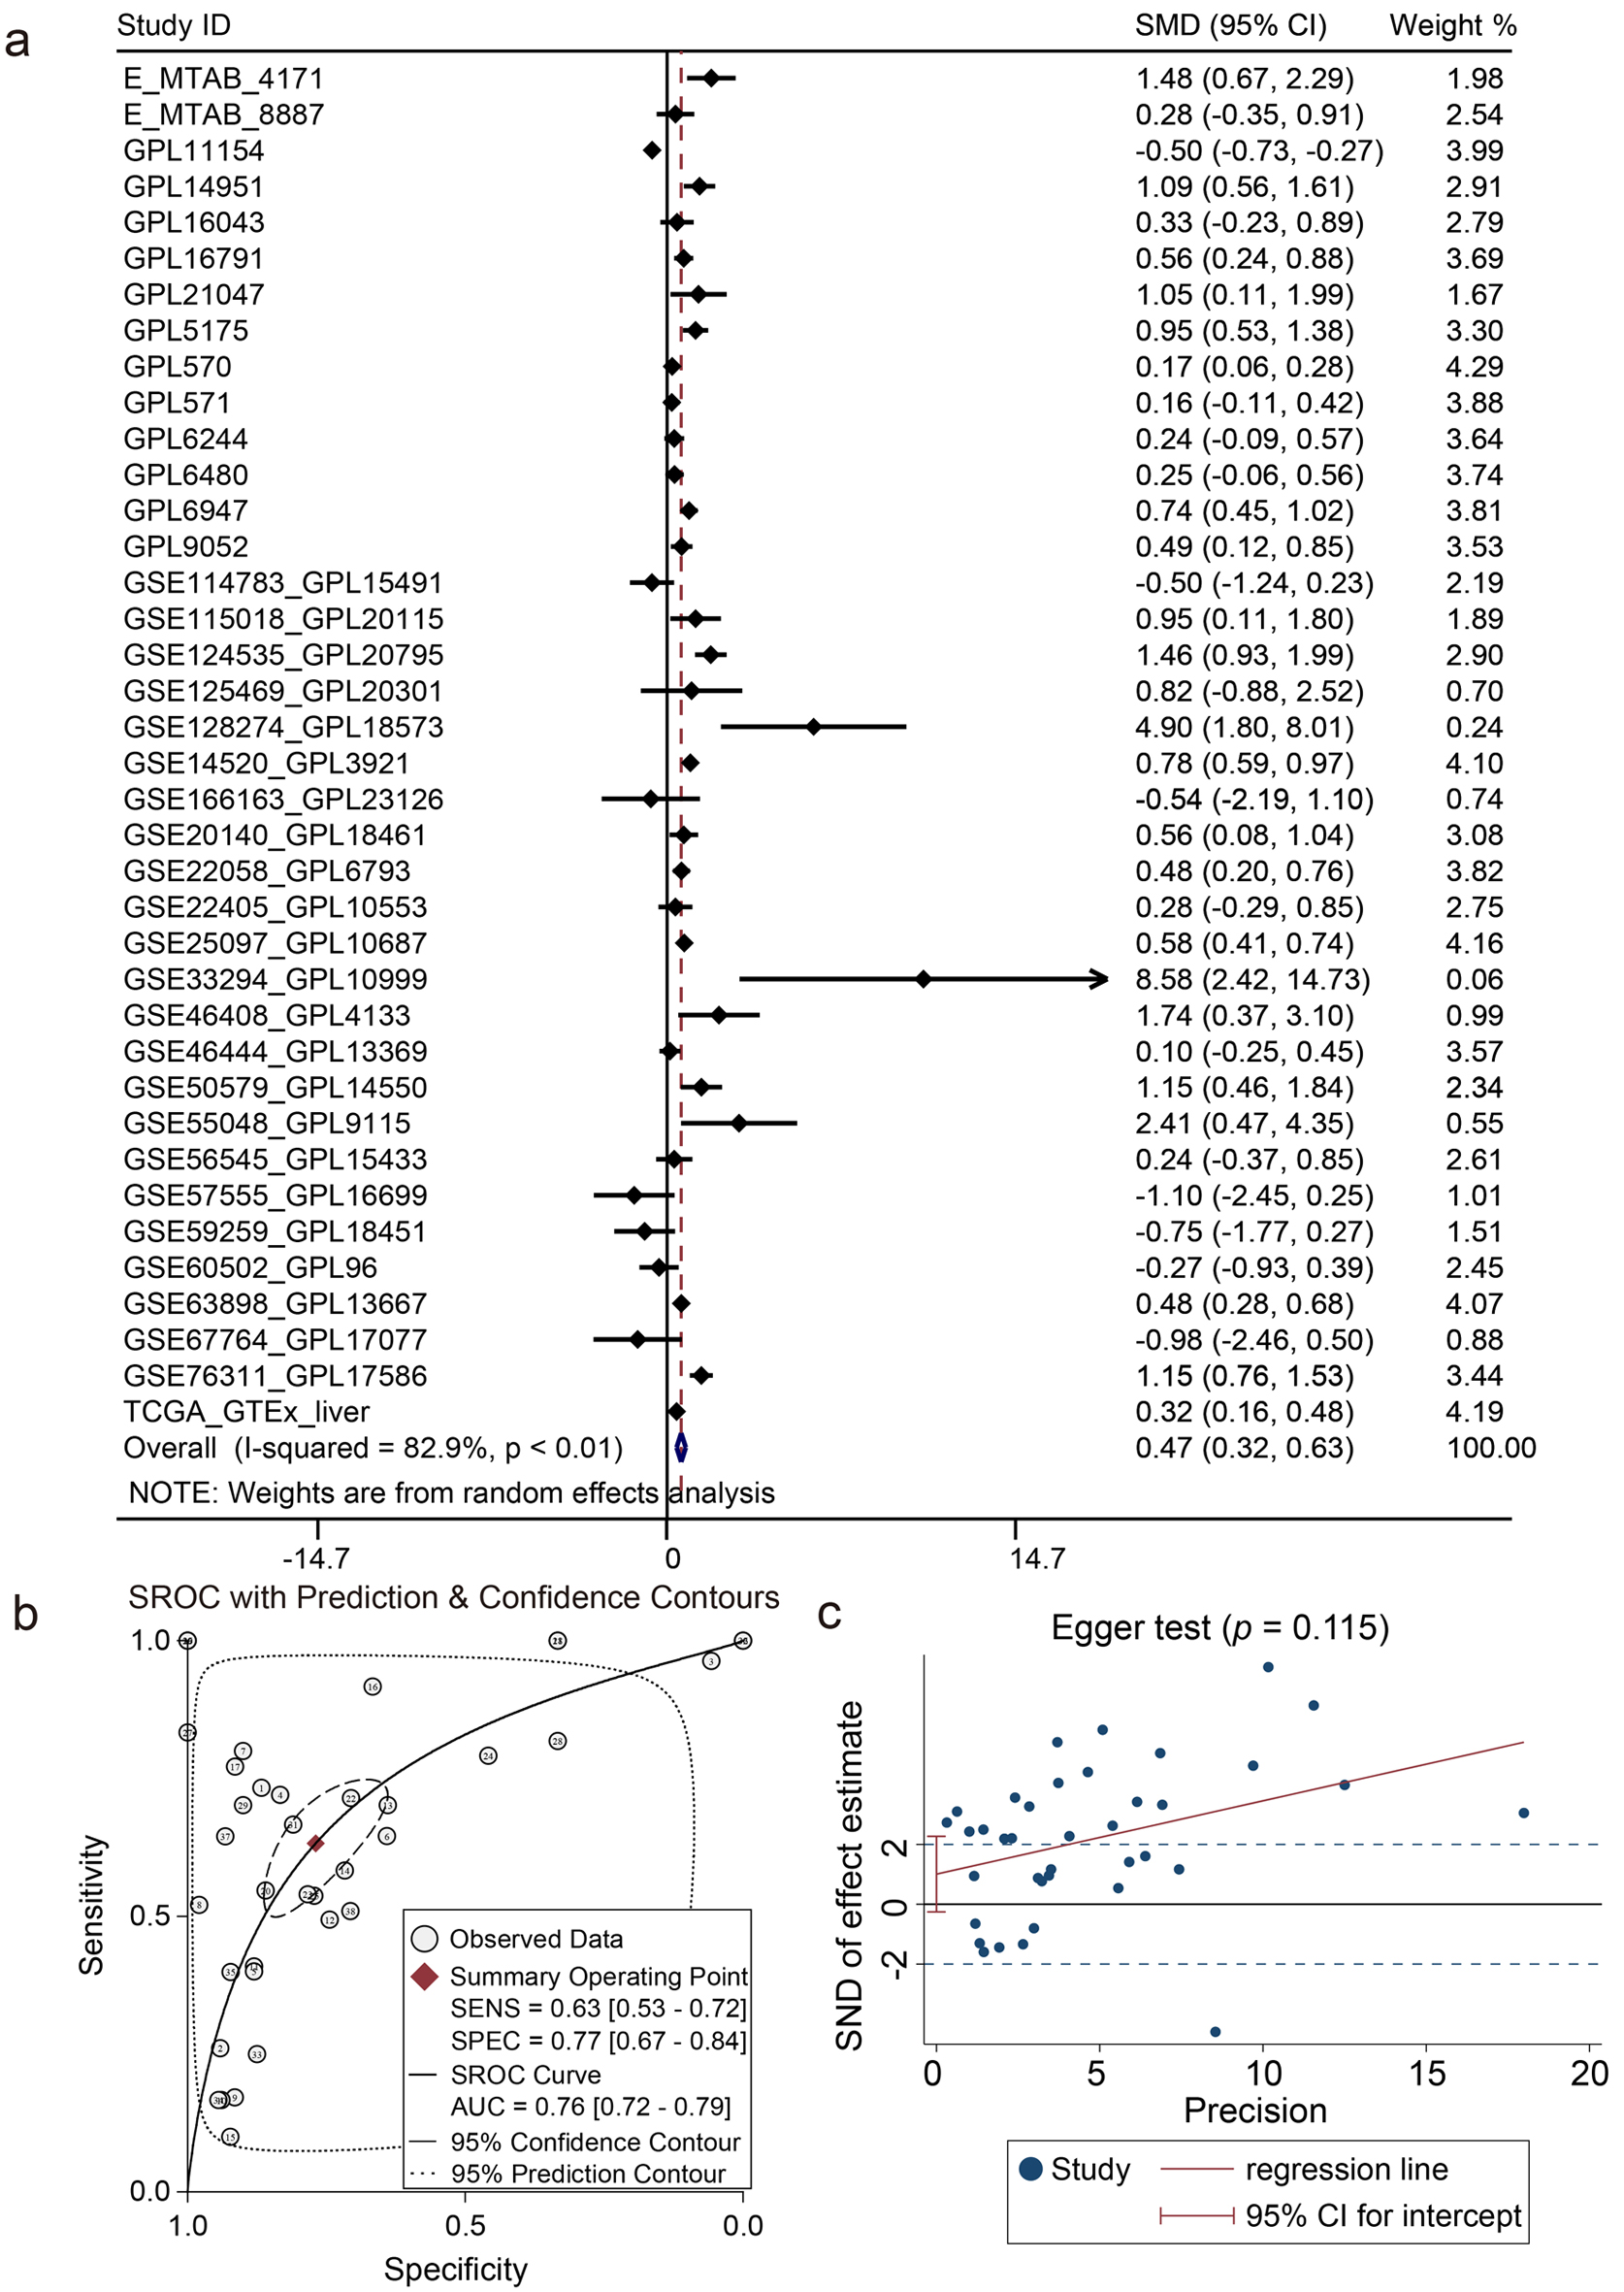 Click for large image | Figure 4. Integrated analysis of ZW10 mRNA expression level. (a) Forest plot of standardized mean difference. (b) Summary receiver operating characteristic curve. (c) Egger funnel plot (P = 0.115). |
Differential expression of ZW10 in different etiological backgrounds of HCC
Compared to the group without causal risk factors, subgroups with alcohol consumption, hepatitis (B or C), hepatitis B, hepatitis C, the combination of alcohol consumption and hepatitis (B or C), non-alcoholic fatty liver disease and paracancerous hepatitis all exhibited significantly higher ZW10 expression in HCC (Fig. 5a-g). However, there was no significant difference in the magnitude of this increased expression among these subgroups.
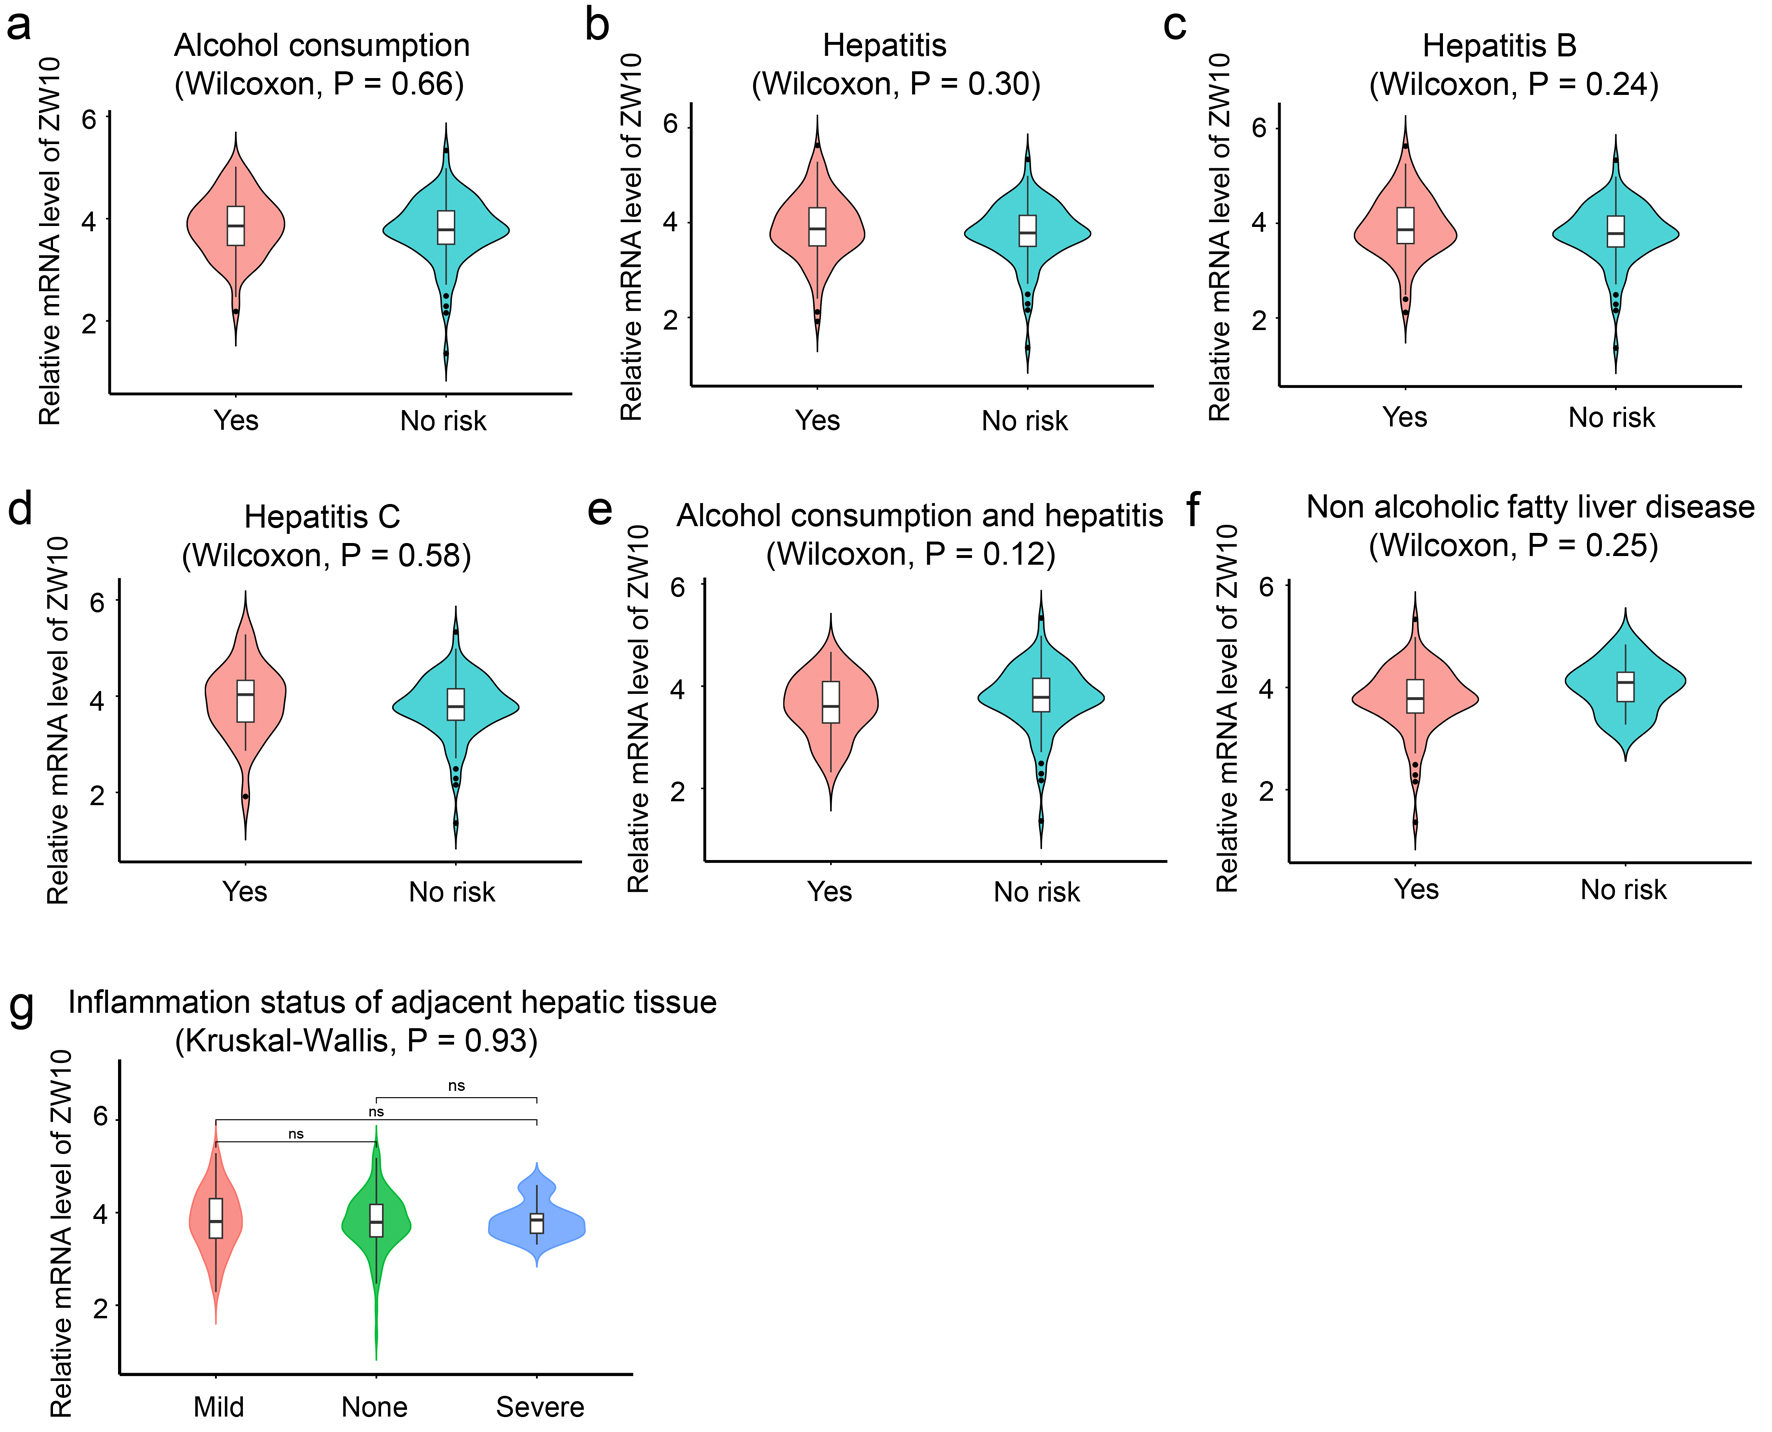 Click for large image | Figure 5. Etiology stratification analysis in different subgroups. (a) Alcohol consumption. (b) Hepatitis (B or C). (c) Hepatitis B. (d) Hepatitis C. (e) The combination of alcohol consumption and hepatitis (B or C). (f) Non-alcoholic fatty liver disease. (g) Inflammation status of adjacent hepatic tissue. |
Prognosis value
Univariate Cox regression was performed in the transcriptional level of ZW10 and the clinicopathological parameters including age, gender, race, pT stage as well as AJCC stage. Individuals with high expression of ZW10 gene had an increased risk of HCC mortality (HR = 1.05, 95% CI: 1.02 - 1.07, P < 0.01, Table 1). Patients in AJCC stage III + IV had an increased ZW10 expression level compared to those in stage I + II (P < 0.01, Fig. 6e) and had a higher risk of mortality (HR = 2.45, 95% CI: 1.67 - 3.58, P < 0.01, Table 1). In comparison to the patients diagnosed with pT1 + pT2, the patients diagnosed with pT3 + pT4 had an elevated ZW10 expression level (P < 0.01, Fig. 6d) and a risk of mortality (HR = 2.47, 95% CI: 1.68 - 3.61, P < 0.01, Table 1). Other factors cannot be considered as dangerous factors for mortality in patients with HCC (P > 0.05, Fig. 6a-c). Besides, the ZW10 high-level group was linked to the overall survival time of patients diagnosed with HCC (two-stage test, P < 0.01, Fig. 6f).
 Click to view | Table 1. Risk Factors Analysis for HCC Based on the TCGA-LIHC Dataset |
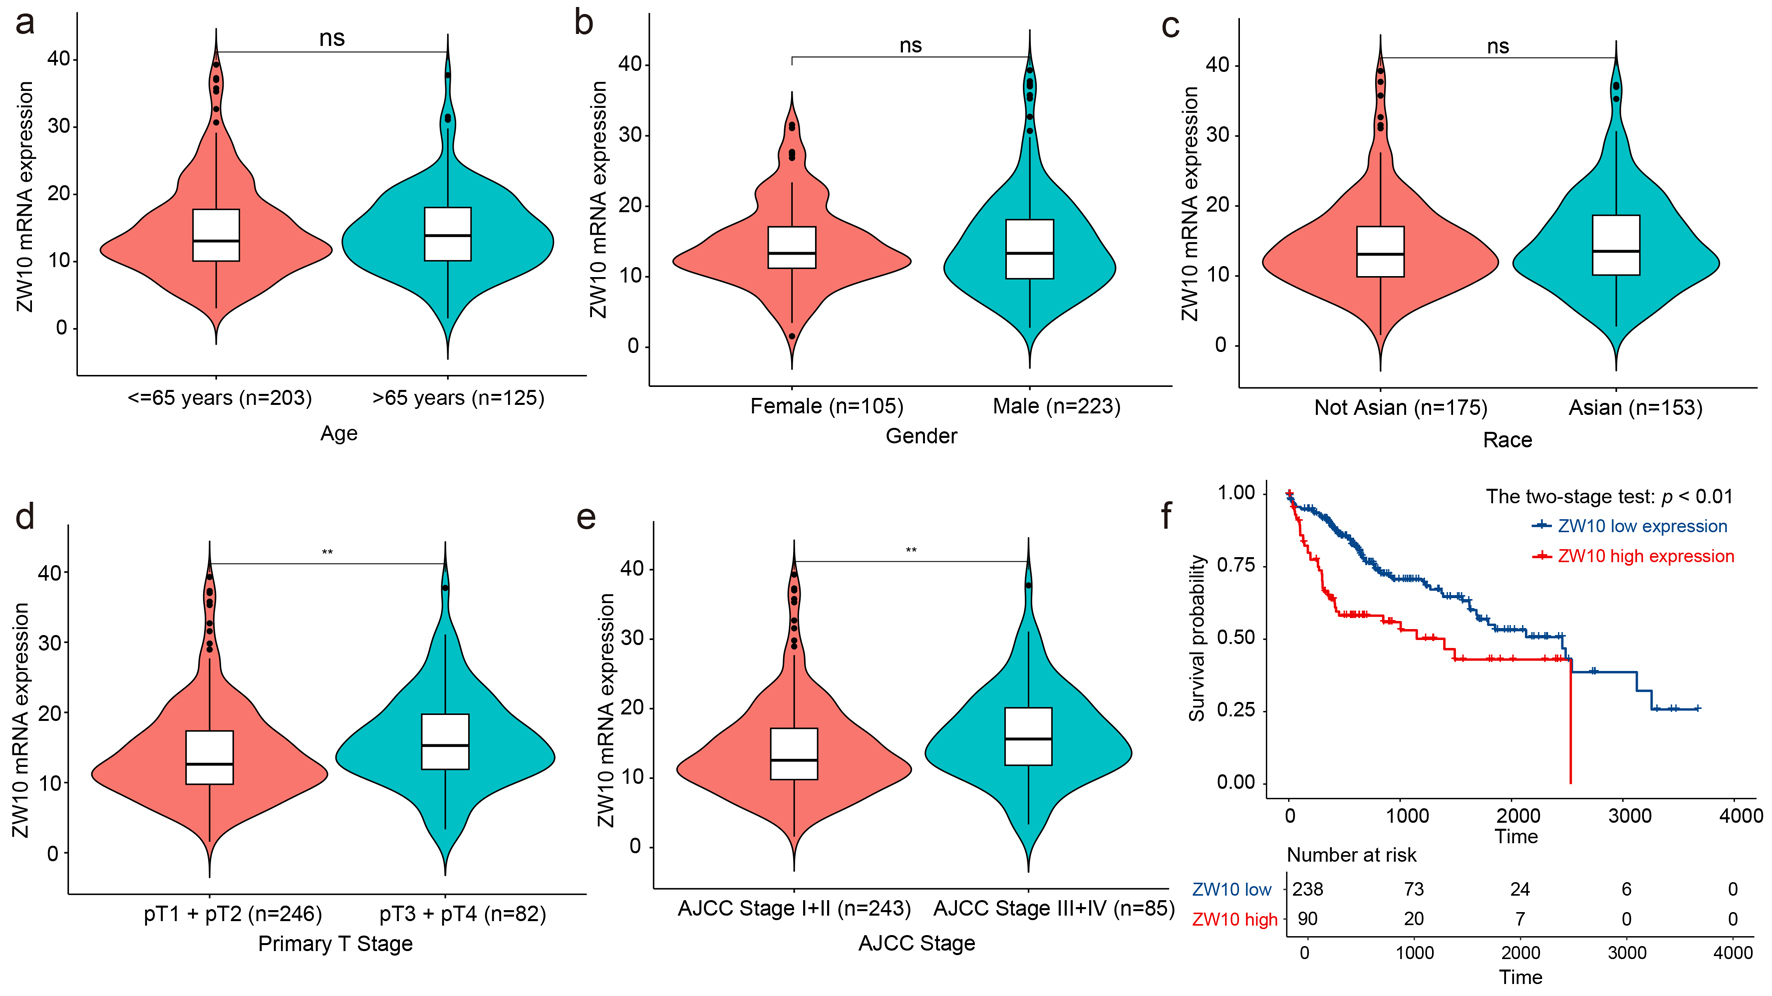 Click for large image | Figure 6. The association between ZW10 mRNA expression status and clinical parameters. (a) Age. (b) Gender. (c) Race. (d) Primary stage. (e) AJCC stage. (f) Overall survival. **P < 0.01, nsP > 0.05. AJCC: American Joint Committee on Cancer. |
Biological function
The gene effect scores of ZW10 knockout for 20 HCC cell lines (PLCPRF5, JHH7, SNU886, HLF, SNU449, SNU475, SKHEP1, JHH6, SNU398, JHH5, HEPG2, JHH1, SNU423, SNU182, HUH7, SNU387, JHH4, HUH1, SNU761, and JHH2) were less than 0, demonstrating that ZW10-defect could inhibit the growth of HCC cells (Fig. 7).
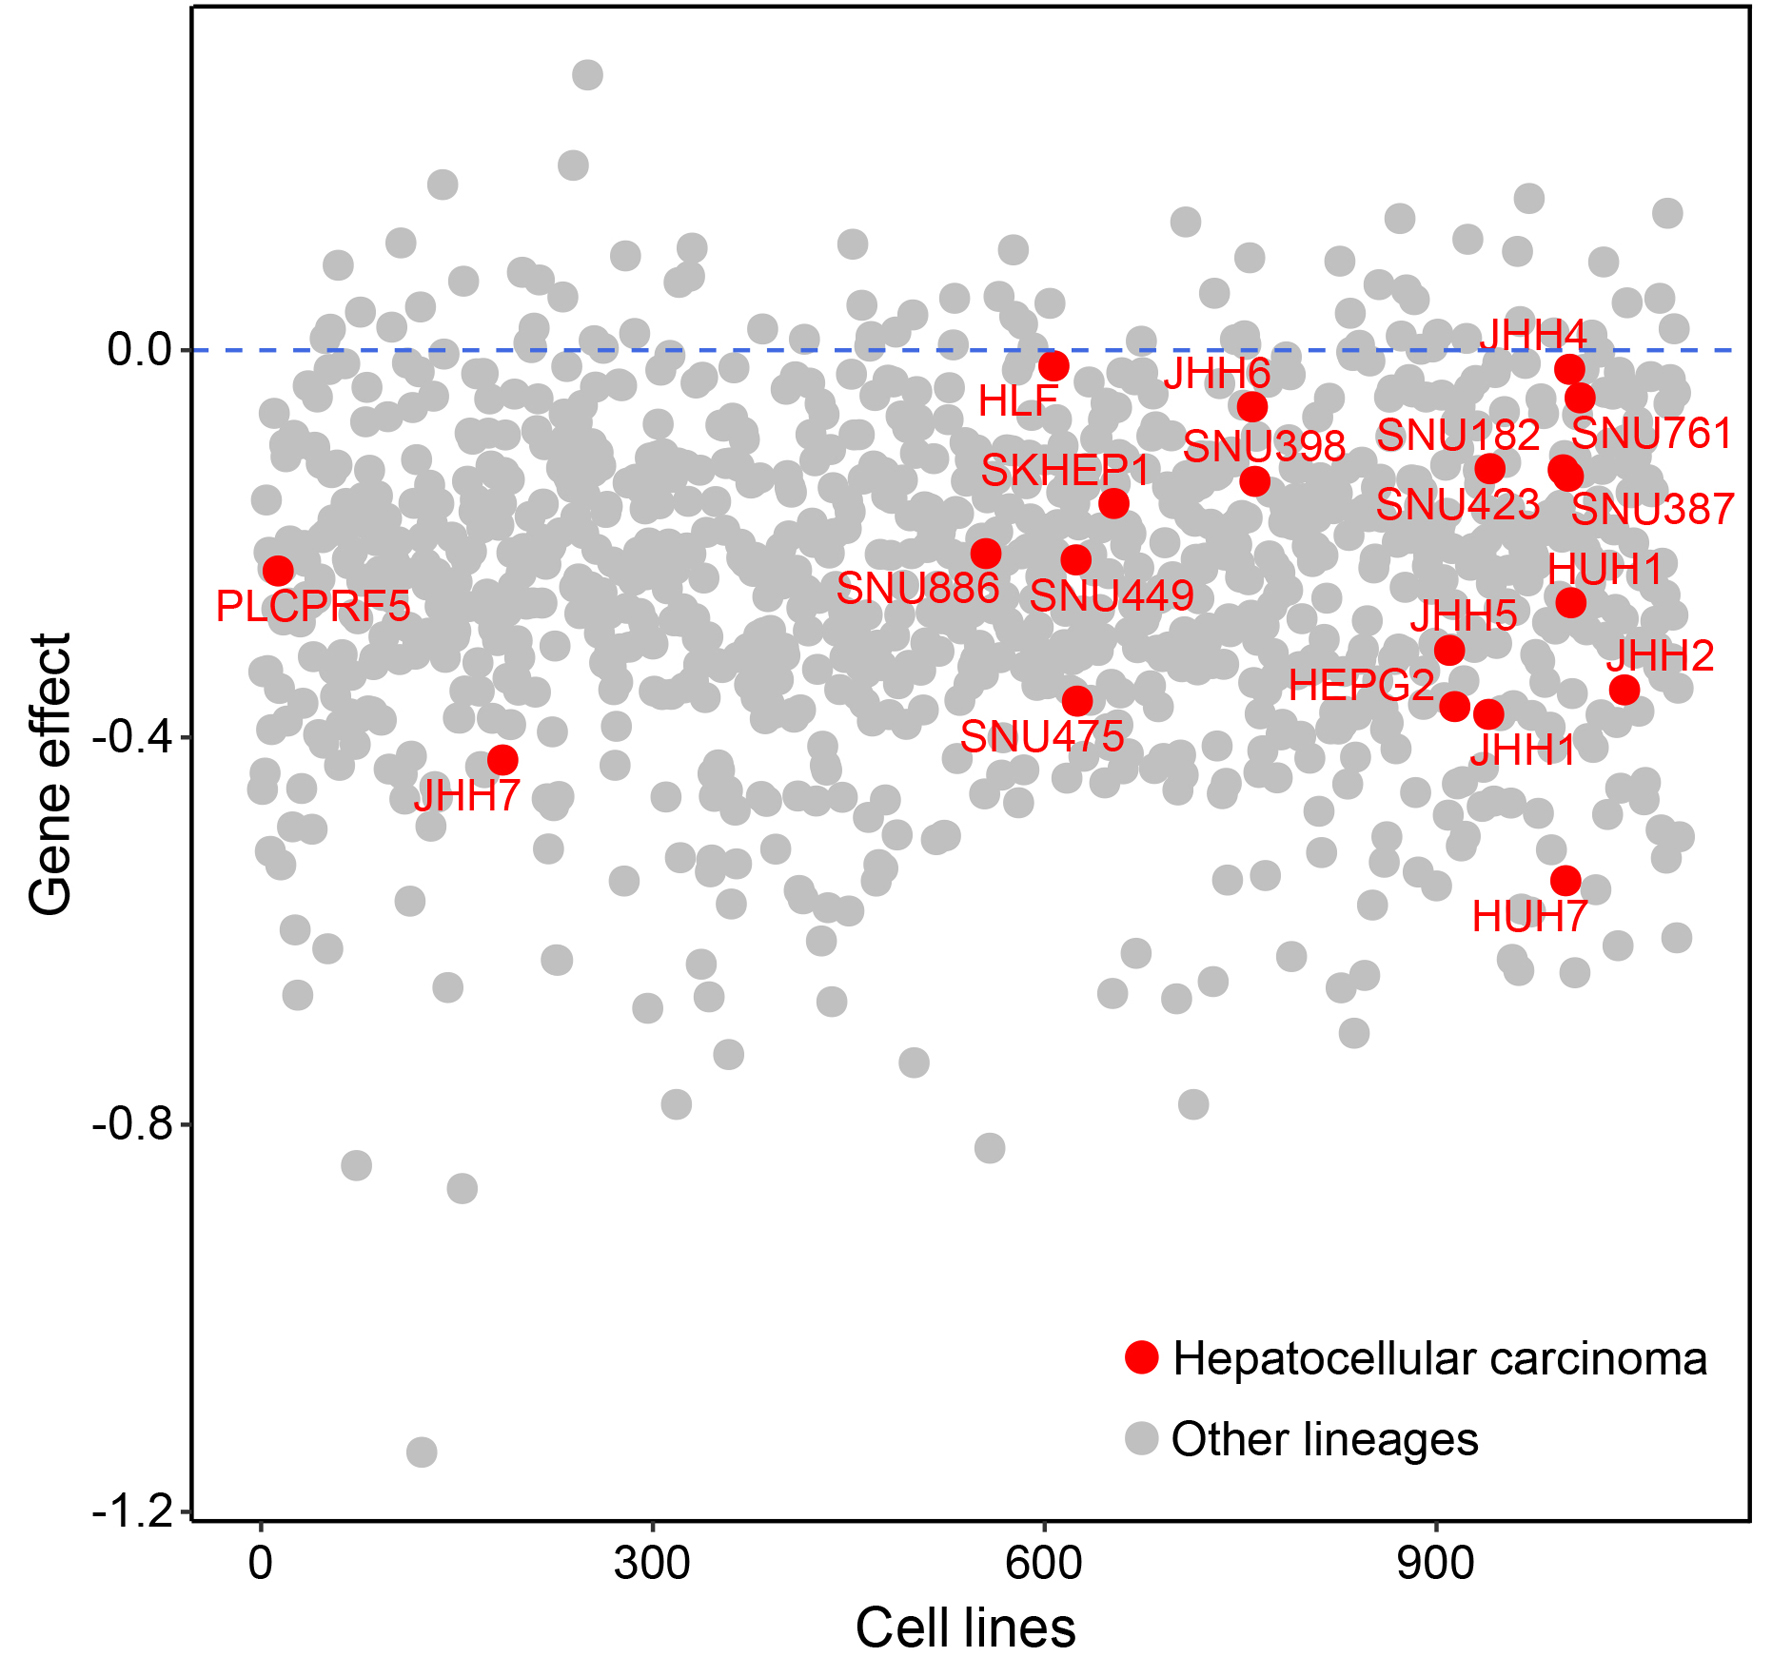 Click for large image | Figure 7. Gene effect of ZW10 for 20 HCC cell lines based on the DepMap database. HCC: hepatocellular carcinoma. |
Sensitivity of TKIs under varying ZW10 expressions
This research predicted the sensitivity of 371 HCC samples (including 157 samples in ZW10-high expression group and 214 samples in ZW10-low expression group) to 10 TKI drugs. Compared to the ZW10-low level group, the ZW10-high level group showed higher IC50 values for axitinib, bosutinib, erlotinib, lapatinib, and sunitinib (P < 0.05, Fig. 8a-e), but no statistical differences were found between the two groups for dasatinib, gefitinib, imatinib, nilotinib, and sorafenib (P > 0.05, Fig. 8f-j). The transcriptional expression of ZW10 exhibited a positive relationship with the IC50 values of axitinib (r = 0.21, P < 0.01), bosutinib (r = 0.21, P < 0.01), lapatinib (r = 0.20, P < 0.01), and sunitinib (r = 0.17, P < 0.01), indicating that the increase in ZW10 expression showed an association with a decrease in response rates to TKIs (Supplementary Material 2, wjon.elmerpub.com).
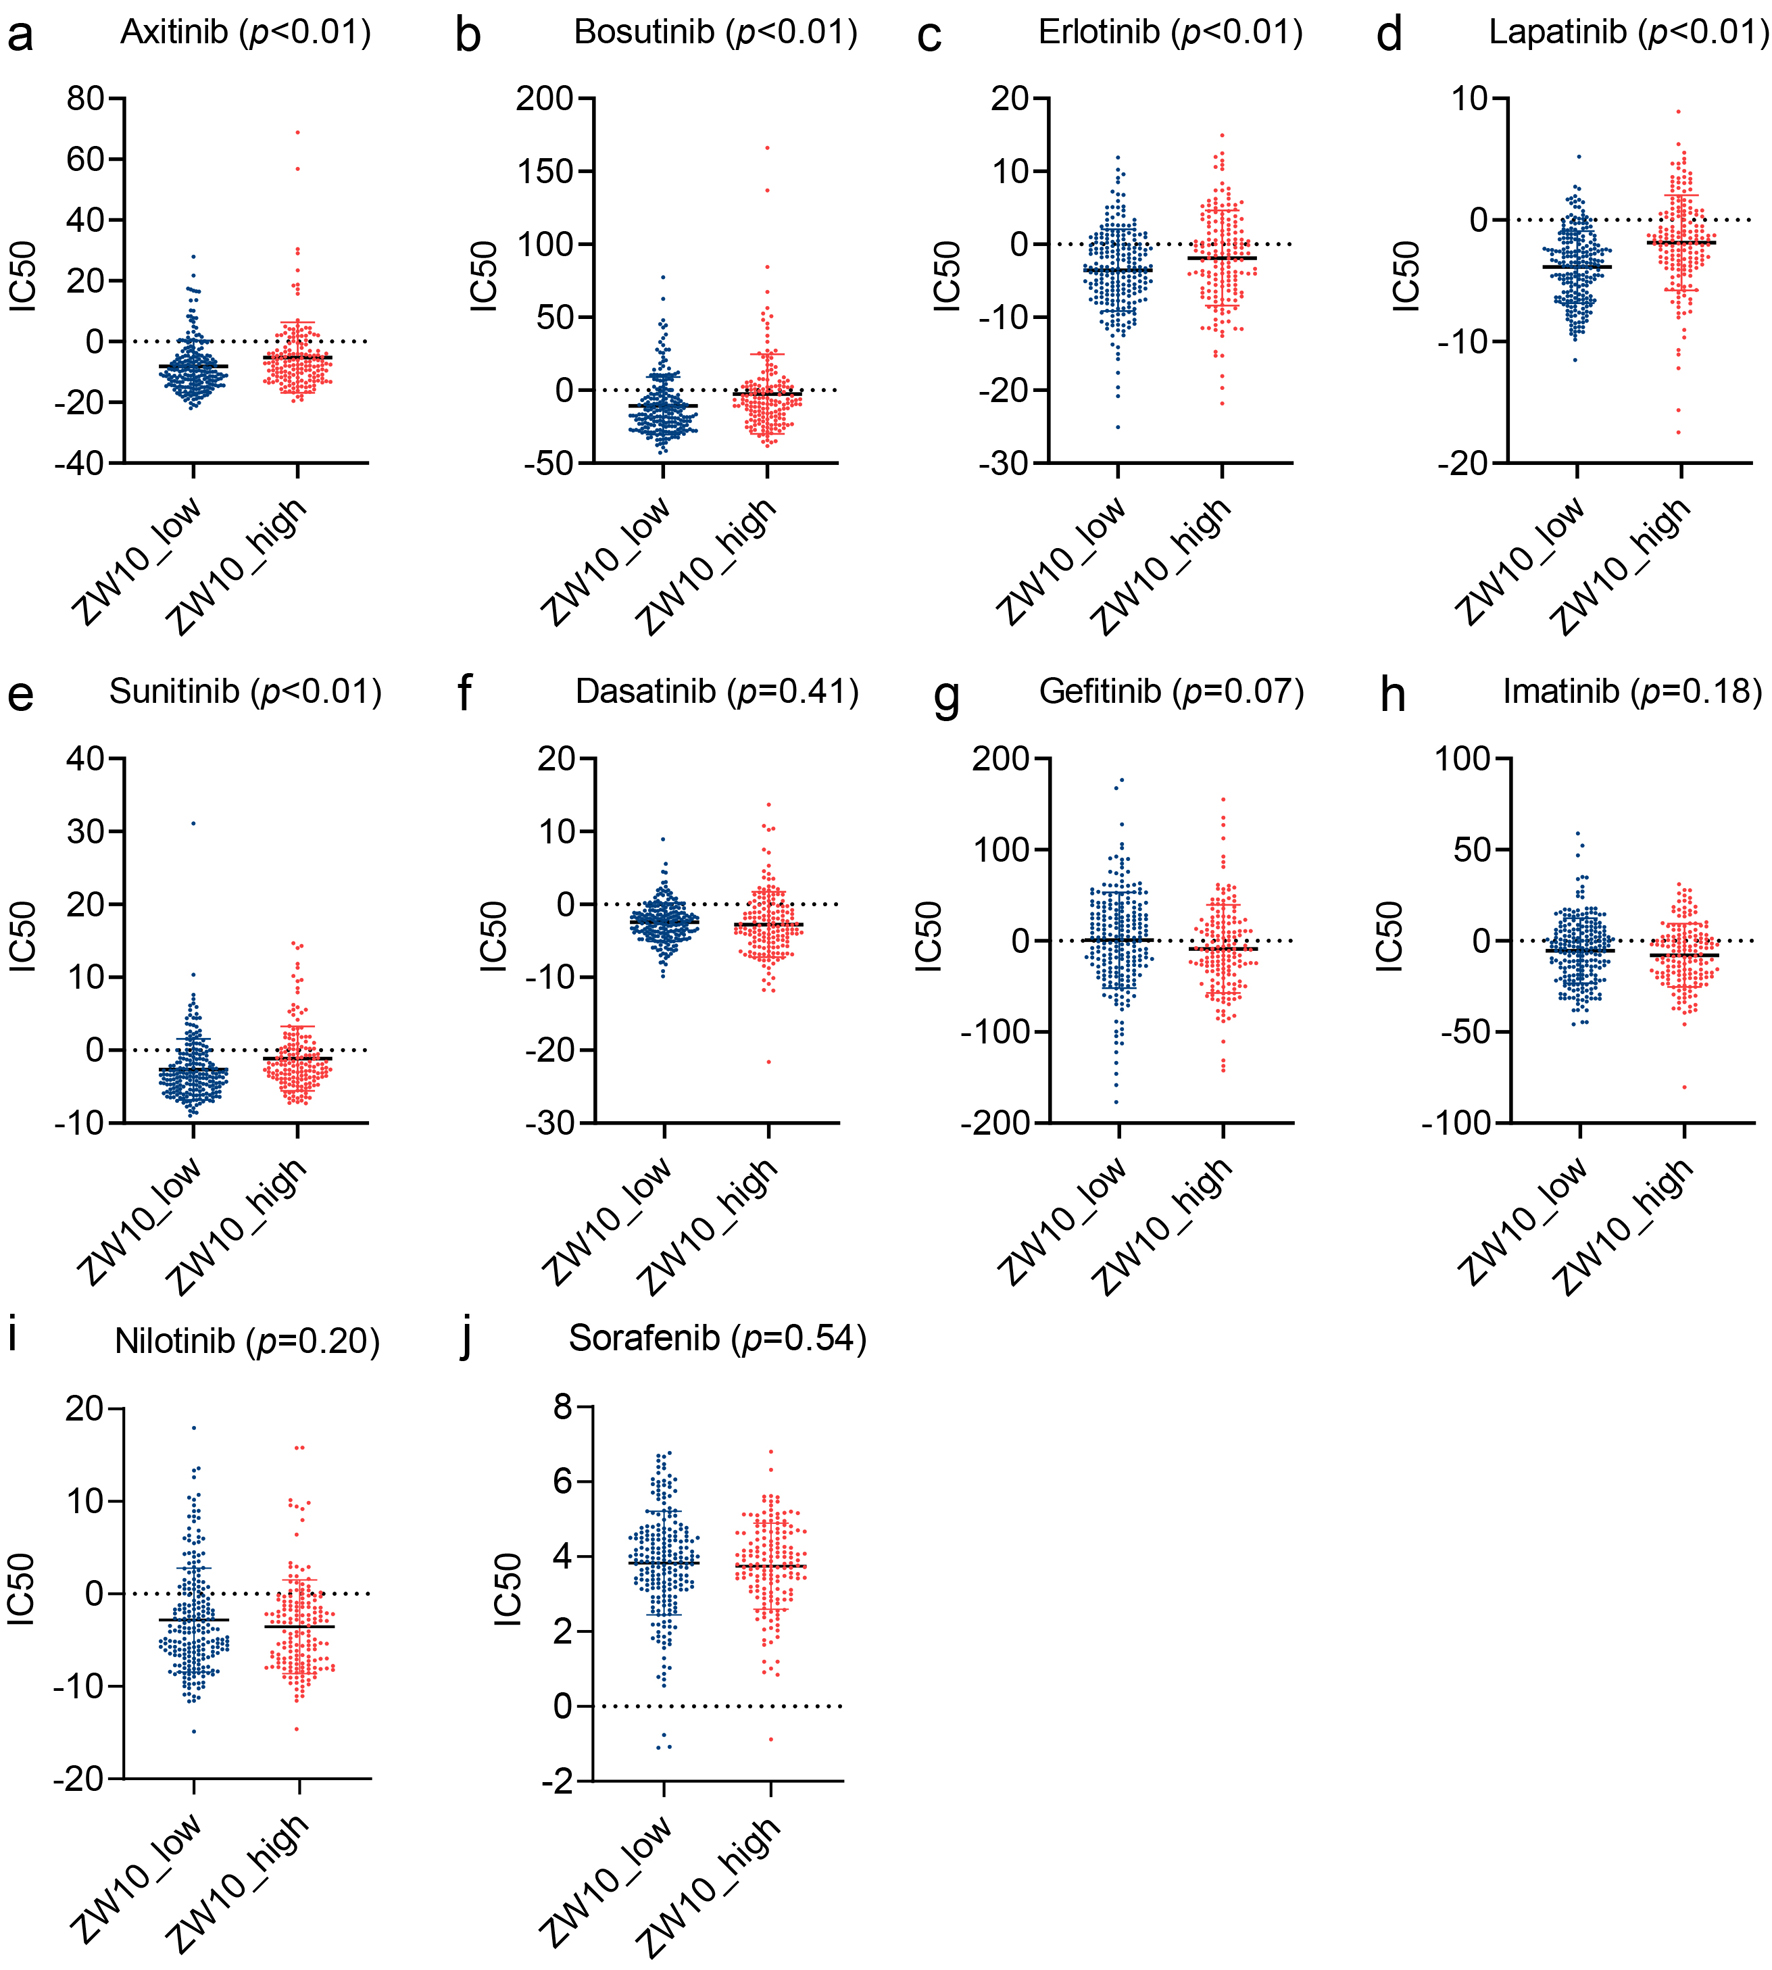 Click for large image | Figure 8. The differences of the predicted half-maximal inhibitory concentration of TKIs in ZW10-high expression and ZW10-low expression groups. (a) Axitinib. (b) Bosutinib. (c) Erlotinib. (d) Lapatinib. (e) Sunitinib. (f) Dasatinib. (g) Gefitinib. (h) Imatinib. (i) Nilotinib. (j) Sorafenib. IC50: half-maximal inhibitory concentration; TKIs: tyrosine kinase inhibitors. |
Pathway enrichment analysis
Totally 42 ZW10 differentially and strongly related genes presented a notable enrichment in the nucleocytoplasmic transport pathway of biological process, the nucleoplasm, kinetochore, nuclear envelope, and nuclear pore pathways of cellular component, and the protein binding pathway of molecular function (Fig. 9, Supplementary Material 3, wjon.elmerpub.com). The nucleocytoplasmic transport pathway was the only enriched mechanism in KEGG analysis (Supplementary Material 3, wjon.elmerpub.com).
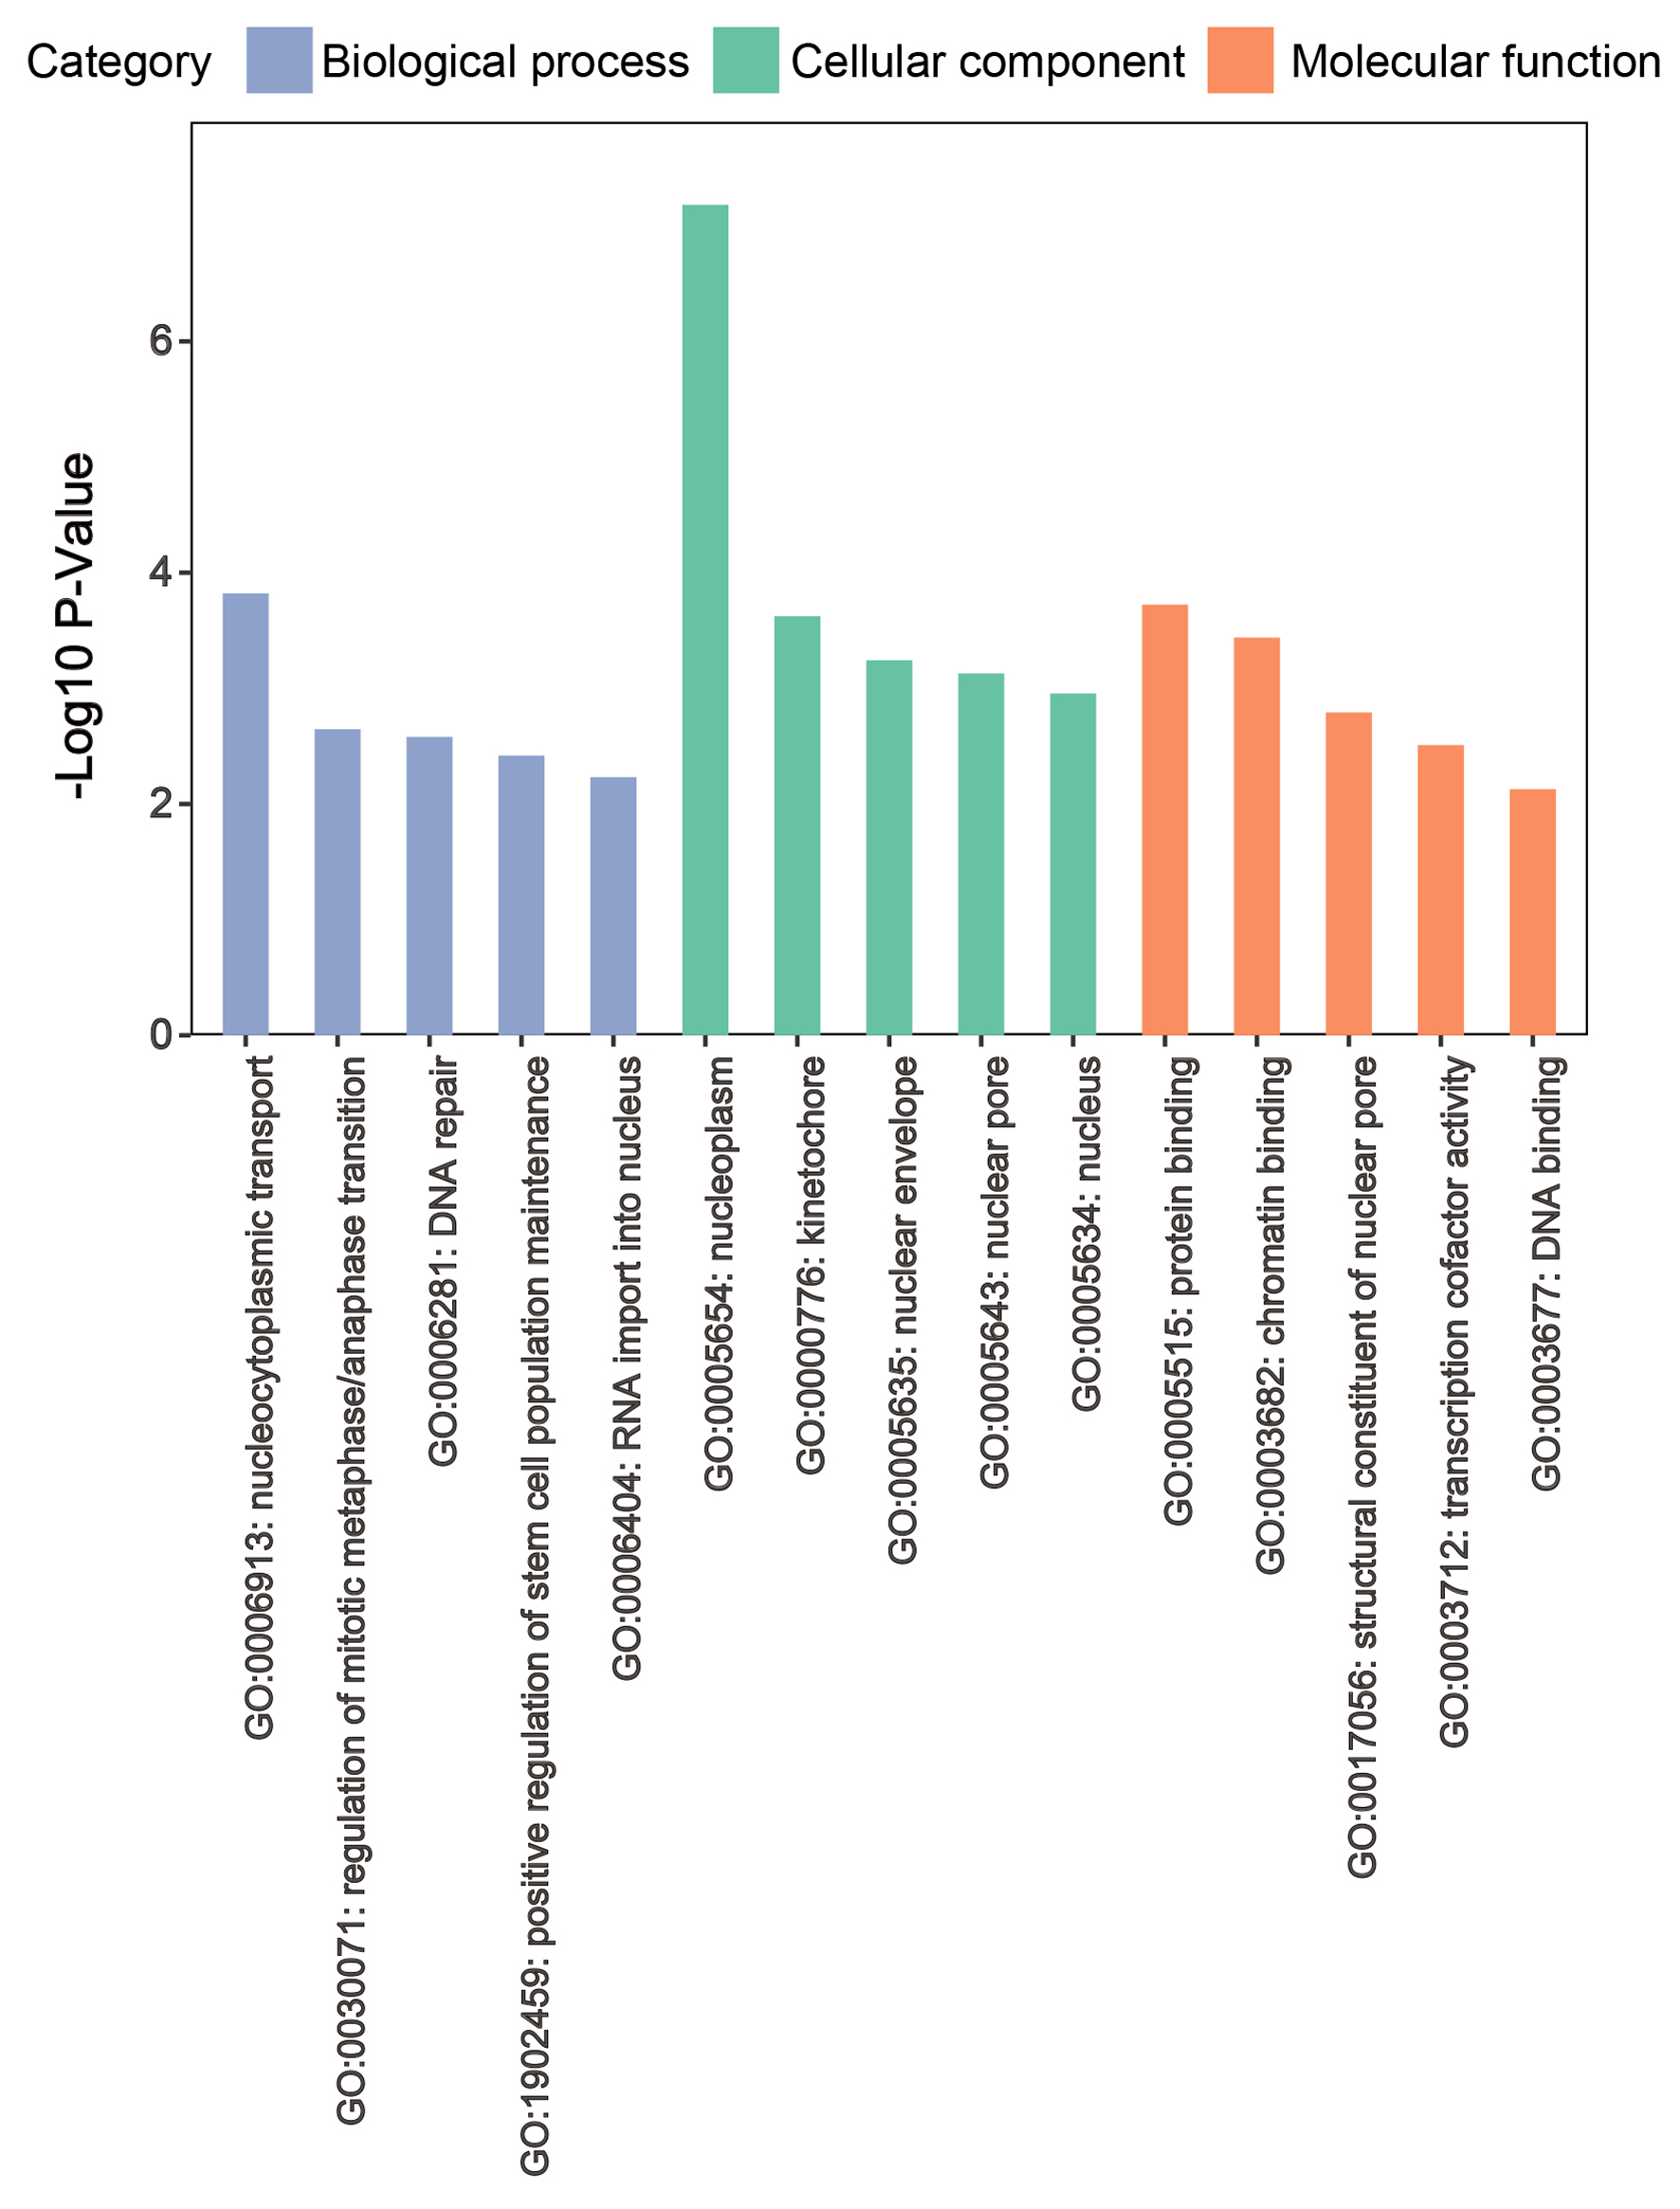 Click for large image | Figure 9. Functional enrichment analysis for ZW10 strongly related and differentially expressed genes. |
Characteristics in HCC microenvironment
All of the 371 HCC samples were classified into ZW10 highly expressed and ZW10 low expressed groups, according to the average level of ZW10 gene. In the differential analyses, lower stroma score, microenvironment score, CD4+ effect memory T cells, CD8+ naive T cells, conventional dendritic cells, immature dendritic cells, macrophages, macrophages M2, mesenchymal stem cells, adipocytes, endothelial cells, lymphatic endothelial cells, microvascular endothelial cells, and hepatocytes were observed in ZW10 elevated expression status (P < 0.05, Fig. 10). Conversely, the infiltrations of CD4+ memory T cells, T-helper 2 cells, common lymphoid progenitor, and mast cells were more abundant in ZW10 high expression group (P < 0.05, Fig. 10). In the correlation analyses, the ZW10 expression value was negatively correlated with the stroma score, microenvironment score, microvascular endothelial cells, macrophages M2, lymphatic endothelial cells, immature dendritic cells, mesenchymal stem cells, hepatocytes, endothelial cells, macrophages, adipocytes, CD8+ naive T cells, conventional dendritic cells, CD4+ effect memory T cells, natural killing T cells, T-helper 1 cells, plasmacytoid dendritic cells, dendritic cells, as well as CD4+ central memory T cells, and exhibited positive correlations with the T-helper 2 cells, mast cells, CD4+ memory T cells, common lymphoid progenitor, and class switched memory B cells (Supplementary Material 4, wjon.elmerpub.com).
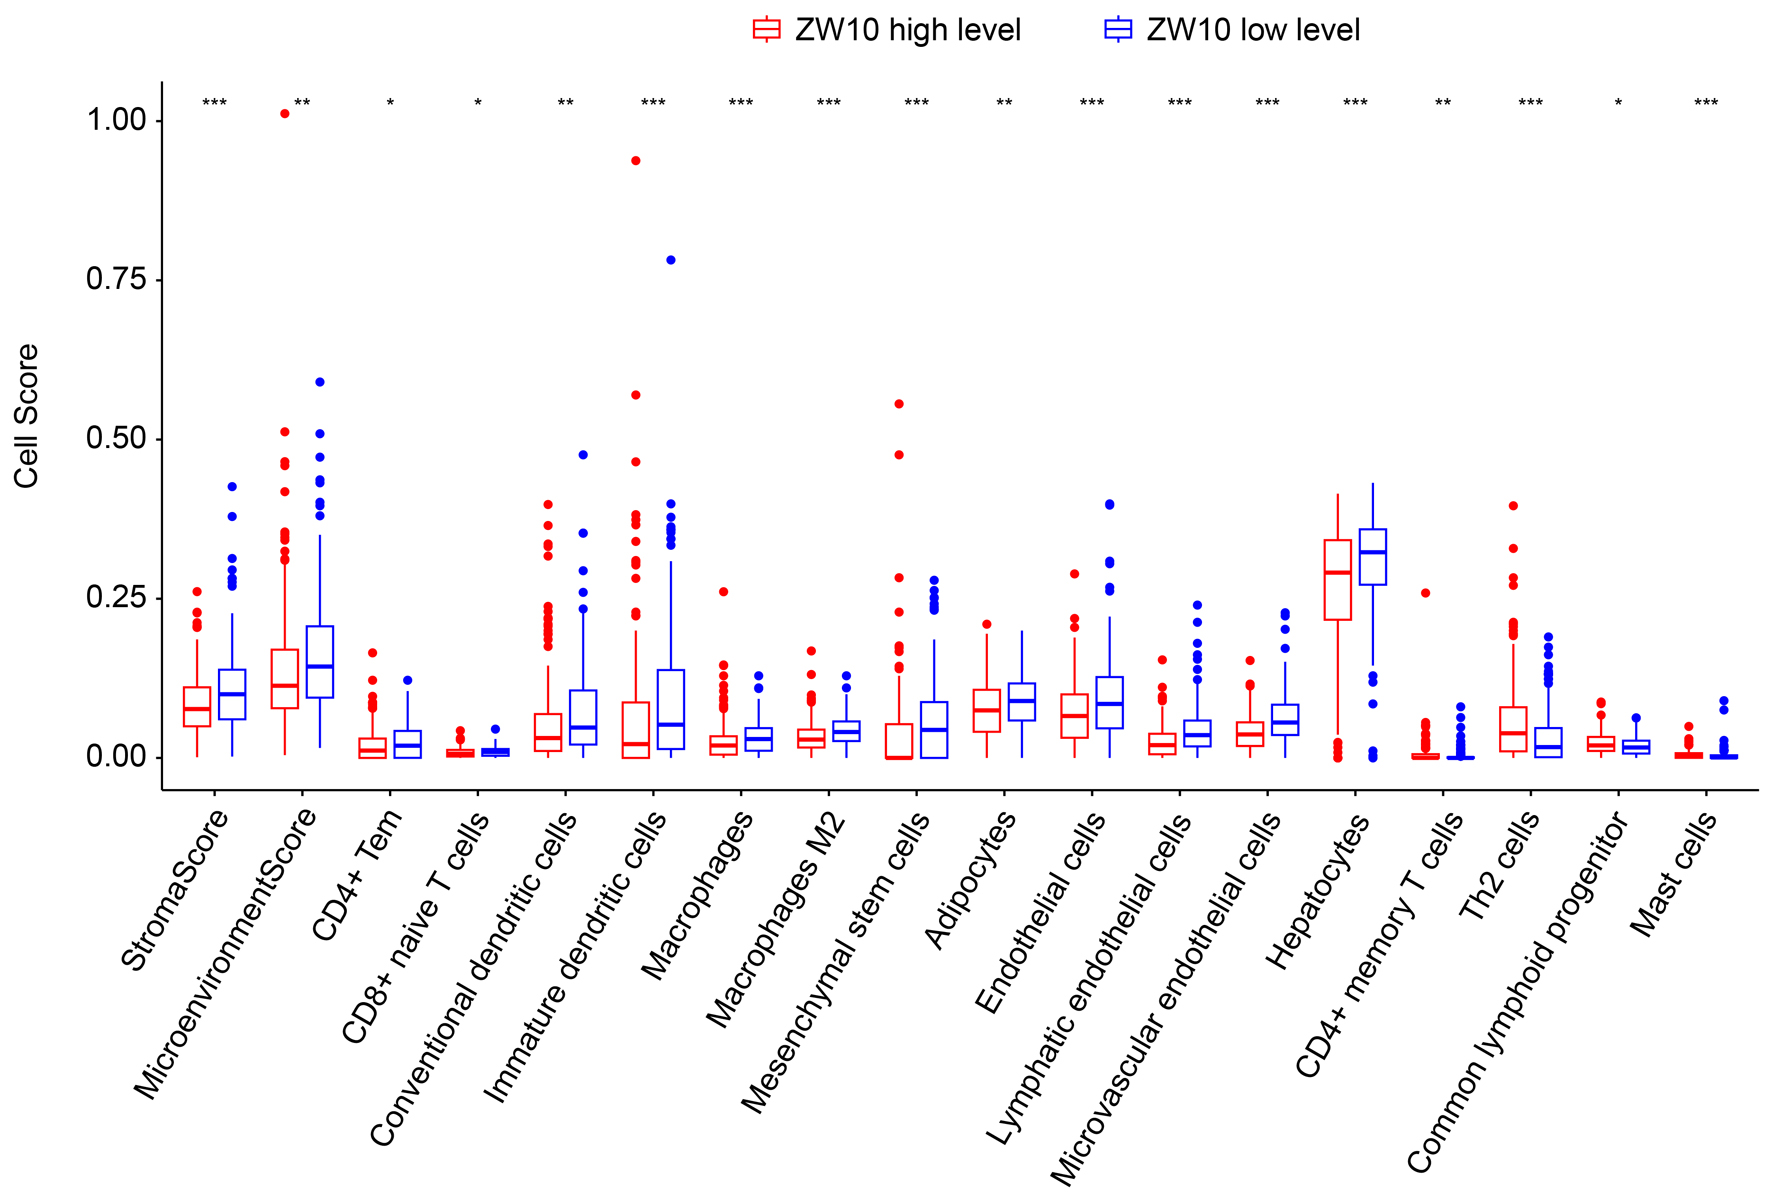 Click for large image | Figure 10. Differential analyses between ZW10 expression and the microenvironment characteristics. ***P < 0.001, **P < 0.01, *P < 0.05. |
Compounds opposing ZW10 protein
A total of 42 ZW10 differentially and strongly related genes were used as input dataset to predict small molecule compounds, and mocetinostat (-99.93) (Fig. 11a), lypressin (-99.89) (Fig. 11b), and indatraline (-99.89) (Fig. 11c) were the top three compounds with negative score (Table 2). For the combination affinities to ZW10 protein (PDB ID: 7QPG), mocetinostat needed the minimum binding energy (-8.2 kcal/mol), followed by lypressin (-7.6 kcal/mol) and indatraline (-7.0 kcal/mol). The combination between mocetinostat and ZW10 protein was simulated and is exhibited in Figure 12a. Mocetinostat formed two hydrogen bonds with TYR and GLU amino acid residues, four hydrophobic bonds with TYR, PHE, ARG, and LEU amino acid residues, and two electrostatic interactions with GLU and ARG amino acid residues of ZW10 protein. The combination between capecitabine and ZW10 protein was simulated and is exhibited in Figure 12b. The minimum binding energy of the molecular docking between ZW10 protein and capecitabine was -7.1 kcal/mol, with the interaction involving three hydrogen bonds, two hydrophobic interactions, and one halogen bond.
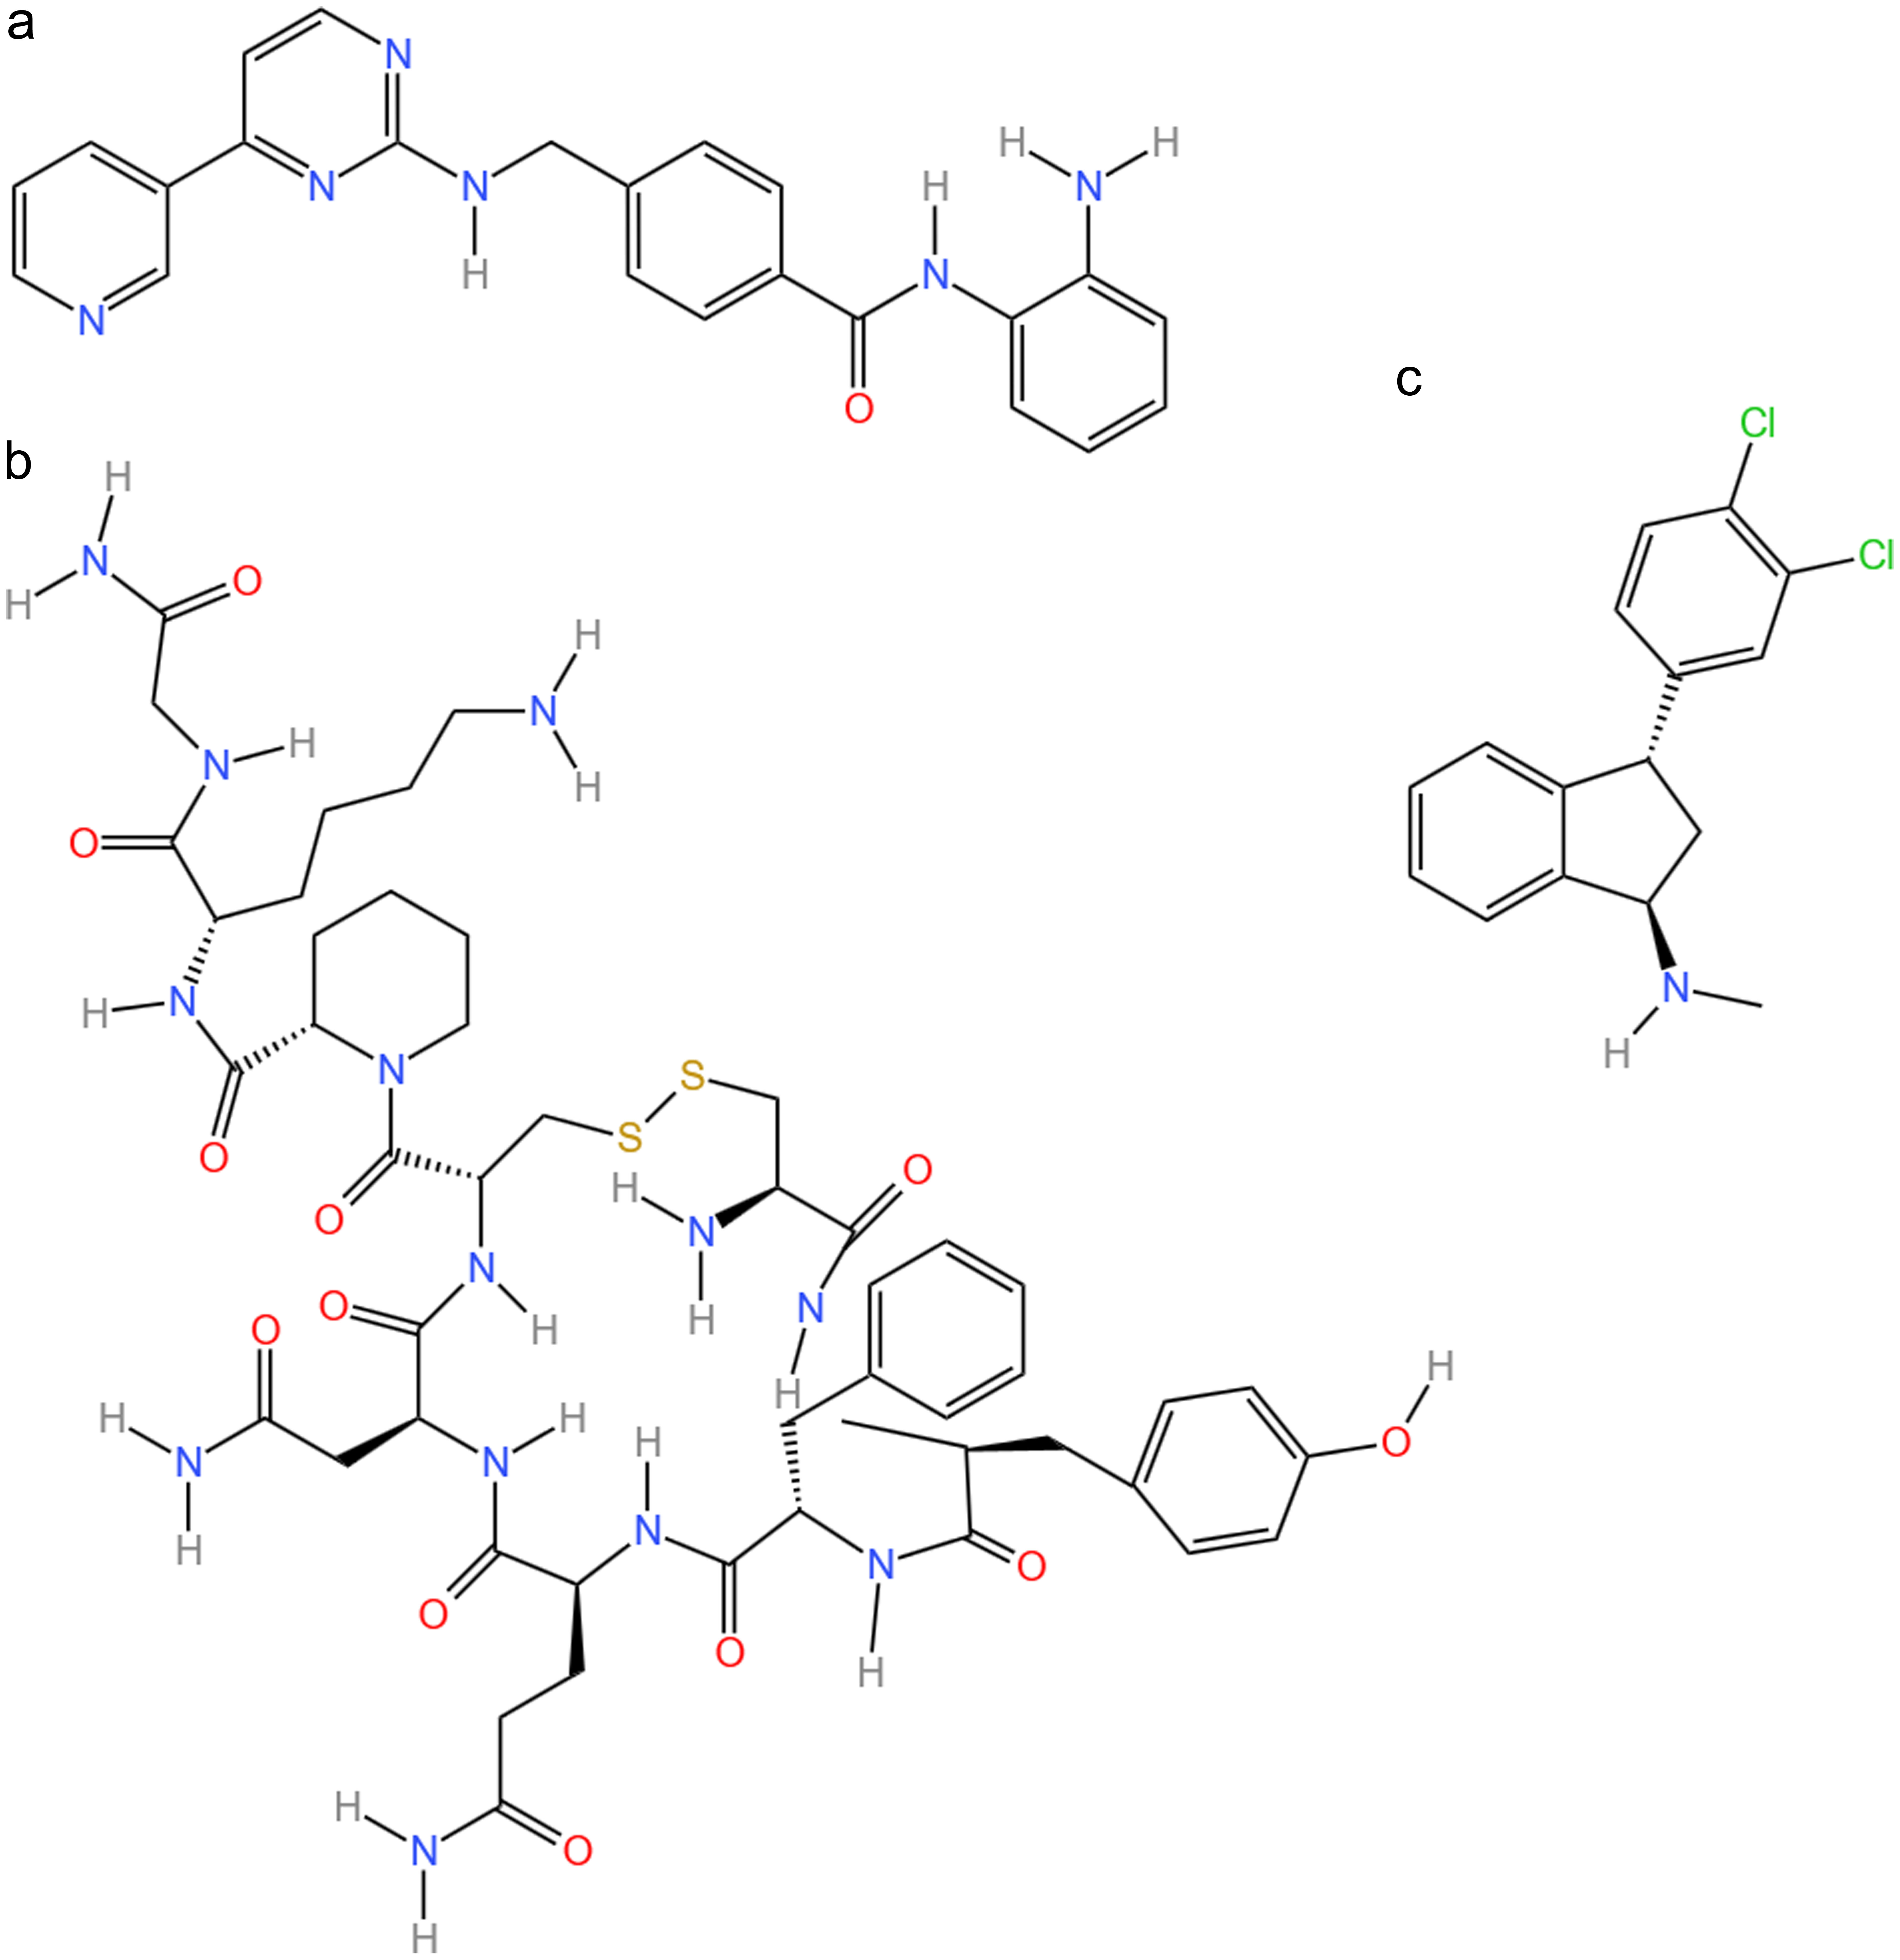 Click for large image | Figure 11. Structure of mocetinostat (a), lypressin (b), and indatraline (c). The structures of the three compounds were downloaded from the PubChem database. |
 Click to view | Table 2. The Top Three Compounds Opposing ZW10 and Their Affinity to ZW10 Protein |
 Click for large image | Figure 12. Three-dimensional and two-dimensional interaction networks of mocetinostat, capecitabine, and ZW10 protein. (a) Mocetinostat binding to ZW10 protein. (b) Capecitabine binding to ZW10 protein. |
| Discussion | ▴Top |
TKIs have become the cornerstone in the first-line or second-line treatment of HCC since 2007. Nevertheless, the response rate to TKIs remains suboptimal in advanced HCC due to the heterogeneity of systemic therapies and the emergence of drug resistance [23]. It is urgent to find effective genetic markers to assist clinical TKI stratification therapy. To solve this problem, this study combined CRISPR screening gene knockout with continuous TKI drug treatment to eliminate the effects of the drug’s transient effects while ensuring the accuracy and comprehensiveness of gene screening. ZW10 was ultimately identified as a potential gene involved in resistance to TKI in HCC [24].
TKI resistance remains a challenge in HCC treatment. Therefore, exploring the expression profile of ZW10 and its prognostic significance in tumors, particularly in HCC, could further elucidate its potential as a biomarker for drug resistance. Pan-cancer analysis confirmed the upregulation of ZW10 across various tumor types, which correlated with poor patient prognosis. Interestingly, ZW10 expression at both mRNA and protein levels was significantly elevated in HCC, and high ZW10 expression was associated with unfavorable outcomes in HCC patients. Notably, while no direct studies have reported a relationship between ZW10 and HCC, a study indicated that ZW10 is involved in KNTC1-induced PI3K/Akt signaling regulation, where silencing KNTC1 inhibits PI3K/Akt signaling and thereby restrains HCC progression [25]. Pan-cancer evidence supports the critical contribution of ZW10 to HCC, highlighting its promise as a therapeutic strategy to overcome TKI resistance.
Building upon the pan-cancer findings, which may overlook the unique characteristics, heterogeneity, and clinical relevance specific to individual malignancies, multi-center HCC samples were further integrated to investigate the expression landscape of ZW10. In a cohort of 3,312 HCC tissue samples, elevated ZW10 mRNA levels were observed. These elevated levels correlated with poor prognosis. Additionally, ZW10 deficiency suppressed HCC cell growth, thus validating the reliability of pan-cancer results. HCC exhibits significant heterogeneity, largely due to the differing impacts of chronic liver diseases [26]. Therefore, a detailed analysis of the specific etiology is crucial. The results of the etiology stratification analysis showed that ZW10 was highly expressed in HCC caused by various etiologies but no significant differences, indicating that high expression of ZW10 may not lead to HCC by affecting a single etiology. Instead, it likely exerts a broad influence across various etiologies that contribute to the development of HCC. Moreover, response analysis to TKIs revealed that lower ZW10 expression was related to superior TKI treatment responses of axitinib, bosutinib, lapatinib, and sunitinib in this research. Taken together, these findings suggest that ZW10 may function as both an oncogene and a key mediator of TKI.
Pathway analysis showed significant enrichment of the nucleocytoplasmic transport pathway in both GO and KEGG pathways. The nucleocytoplasmic transport of oncogenes and proteins plays a pivotal role in driving tumorigenesis, enhancing tumor invasiveness, and promoting the advancement of drug resistance, particularly to TKI therapies [27-30]. Pathway analysis results further indicated that ZW10 may be a promising cancer-promoting and drug-resistant target.
HCC is a tumor characterized by chronic inflammation, and increasing evidence suggests that the tumor microenvironment plays a pivotal role in promoting HCC invasiveness, adverse prognosis, and the development of TKI resistance [26, 31, 32]. In this research, elevated ZW10 status was associated with lower stroma score, microenvironment score, and lower infiltration of various immune cells. Previous studies have demonstrated that high levels of immune infiltration are associated with improved prognosis. Immune cell infiltration into the tumor microenvironment enhances immune surveillance and clearance of tumor cells, thereby improving prognosis in HCC patients. In contrast, lower immune and stroma scores, along with higher tumor purity, are linked to poorer prognosis in HCC [33]. Overall, ZW10 overexpression likely induces an immunosuppressive state in HCC, which could be reversed by drugs targeting ZW10 or immune-related treatments, potentially enhancing antitumor effects and improving prognosis [34, 35].
Based on the potential of ZW10 as a target for TKI resistance and its high expression possibly contributing to immune suppression in HCC, this study further utilized small molecule compounds prediction and molecular docking to predict drugs targeting ZW10. The results showed that both mocetinostat and capecitabine had good docking efficiency with ZW10 protein. Mocetinostat is a class I histone deacetylase inhibitor with antitumor effects [36-39]. Notably, except direct anti-neoplastic properties, mocetinostat can also enhance the therapeutic effectiveness of immune checkpoint inhibitors and be conductive to overcome the problem of immunotherapy resistance, suggesting its potential for improving the immune microenvironment [37, 39, 40]. Capecitabine has recently achieved very satisfactory efficacy and safety in the second-line treatment of HCC [22]. Existing studies have shown that the combination of mocetinostat and capecitabine in cancer treatment can reduce tumor metastasis and demonstrate enhanced tumor-suppressive effects [38, 41]. It is therefore proposed that mocetinostat and capecitabine may reverse TKI resistance by targeting ZW10 protein.
Conclusion
In summary, this study demonstrated that ZW10 may be associated with TKI resistance. The transcriptional expression status of ZW10 was elevated in HCC tissue, and the upregulation of ZW10 was related to poor prognosis. Additionally, ZW10 could promote the growth of HCC cells, and potentially become a therapeutic target to reverse TKI resistance. The functional mechanism of ZW10 in HCC needs further experimental verification.
| Supplementary Material | ▴Top |
Suppl 1. The statistical descriptions, true positive values, false positive values, true negative values, and false negative values of ZW10 transcriptional expression levels.
Suppl 2. The Pearson analyses between the predicted half-maximal inhibitory concentration of TKIs and the expression level of ZW10. (a) Axitinib. (b) Bosutinib. (c) Lapatinib. (d) Sunitinib. (e) Dasatinib. (f) Erlotinib. (g) Gefitinib. (h) Imatinib. (i) Nilotinib. (j) Sorafenib. IC50: half-maximal inhibitory concentration; TPM: transcripts per million.
Suppl 3. Details of the Gene Oncology and the Kyoto Encyclopedia of Genes and Genomes analysis. BP: biological process, CC: cellular component, MF: molecular function.
Suppl 4. Spearman analyses between ZW10 expression and the microenvironment characteristics. CD4+ tem: CD4+ effect memory T cells; CD4+ tcm: CD4+ central memory T cells.
Acknowledgments
The authors would like to thank Guangxi Zhuang Autonomous Region Clinical Medicine Research Center for Molecular Pathology and Intelligent Pathology Precision Diagnosis and Guangxi Key Laboratory of Enhanced Recovery After Surgery for Gastrointestinal Cancer for the technical support.
Financial Disclosure
The research was supported by Joint Project on Regional High-Incidence Diseases Research of Guangxi Natural Science Foundation (2025GXNSFAA069130), National Natural Science Foundation of China (NSFC82460783, NSFC82160762), Guangxi Higher Education Undergraduate Teaching Reform Project (2023JGB163), Guangxi Medical University “Four New” Project (SX202403), China Undergraduate Innovation and Entrepreneurship Training Program (X202410598360), and Future Academic Star of Guangxi Medical University (WLXSZX24073).
Conflict of Interest
The authors declare that they have no conflict of interest.
Informed Consent
This study was not involved in human samples, so there is no need to obtain informed consent.
Author Contributions
Qing Ling Huang, Gang Chen and Rong Quan He designed the study; Qing Ling Huang, Guan Lan Zhang and Qin Yan Su participated in the CRISPR screening experiment; Bang Teng Chi and Qian Lin collected and screened the public datasets; Guan Lan Zhang, Qin Yan Su, Shi De Li and Han He analyzed the data and presented the results; all the authors involved in writing the draft; Yu Lu Tang, Yi Wu Dang, Gang Chen and Rong Quan He revised the manuscript; all the authors have reviewed and approved the final manuscript.
Data Availability
The data supporting this study’s findings are available from the corresponding authors upon reasonable request.
Abbreviations
TKI: tyrosine kinase inhibitor; ZW10: zeste white 10; CRISPR: clustered regularly interspaced short palindromic repeats; SROC: summary receiver operating characteristic; sgRNA: small guide RNA; SMD: standardized mean difference; CI: confidence interval; HCC: hepatocellular carcinoma; TCGA: The Cancer Genome Atlas; THPA: The Human Protein Atlas; GEO: Gene Expression Omnibus; SRA: Sequence Read Archive; GTEx: Genotype-Tissue Expression; AUC: area under the curve; HR: hazard ratio; pT stage: primary tumor stage; AJCC: American Joint Committee on Cancer; IC50: half-maximal inhibitory concentration; TPM: transcripts per million; ssGSEA: single-sample Gene Set Enrichment Analysis; CLUE: Connectivity Map Linked User; IHC: immunohistochemical; ACC: adrenocortical carcinoma; BLCA: bladder urothelial carcinoma; BRCA: breast invasive carcinoma; CESC: cervical squamous cell carcinoma and endocervical adenocarcinoma; CHOL: cholangiocarcinoma; COAD: colon adenocarcinoma; DLBC: lymphoid neoplasm diffuse large B-cell lymphoma; ESCA: esophageal carcinoma; GBM: glioblastoma multiforme; HNSC: head and neck squamous cell carcinoma; KICH: kidney chromophobe; KIRC: kidney renal clear cell carcinoma; KIRP: kidney renal papillary cell carcinoma; LAML: acute myeloid leukemia; LGG: brain lower grade glioma; LIHC: liver hepatocellular carcinoma; LUAD: lung adenocarcinoma; LUSC: lung squamous cell carcinoma; MESO: mesothelioma; OV: ovarian serous cystadenocarcinoma; PAAD: pancreatic adenocarcinoma; PCPG: pheochromocytoma and paraganglioma; PRAD: prostate adenocarcinoma; READ: rectum adenocarcinoma; SARC: sarcoma; SKCM: skin cutaneous melanoma; STAD: stomach adenocarcinoma; TGCT: testicular germ cell tumors; THCA: thyroid carcinoma; THYM: thymoma; UCEC: uterine corpus endometrial carcinoma; UCS: uterine carcinosarcoma; UVM: uveal melanoma; HDAC: histone deacetylase; CD4+ tem: CD4+ effect memory T cells; CD4+ tcm: CD4+ central memory T cells; BP: biological process; CC: cellular component; MF: molecular function
| References | ▴Top |
- Wang Y, Deng B. Hepatocellular carcinoma: molecular mechanism, targeted therapy, and biomarkers. Cancer Metastasis Rev. 2023;42(3):629-652.
doi pubmed - Ladd AD, Duarte S, Sahin I, Zarrinpar A. Mechanisms of drug resistance in HCC. Hepatology. 2024;79(4):926-940.
doi pubmed - Sofer S, Lamkiewicz K, Armoza Eilat S, Partouche S, Marz M, Moskovits N, Stemmer SM, et al. A genome-wide CRISPR activation screen reveals Hexokinase 1 as a critical factor in promoting resistance to multi-kinase inhibitors in hepatocellular carcinoma cells. FASEB J. 2022;36(3):e22191.
doi pubmed - Villiger L, Joung J, Koblan L, Weissman J, Abudayyeh OO, Gootenberg JS. CRISPR technologies for genome, epigenome and transcriptome editing. Nat Rev Mol Cell Biol. 2024;25(6):464-487.
doi pubmed - Bellah SF, Yang F, Xiong F, Dou Z, Yao X, Liu X. ZW10: an emerging orchestrator of organelle dynamics during the cell division cycle. J Mol Cell Biol. 2024;16(7):mjae026.
doi pubmed - Bellah SF, Xiong F, Dou Z, Yang F, Liu X, Yao X, Gao X, et al. PLK1 phosphorylation of ZW10 guides accurate chromosome segregation in mitosis. J Mol Cell Biol. 2024;16(2):mjae008.
doi pubmed - Dang Y, Hu D, Xu J, Li C, Tang Y, Yang Z, Liu Y, et al. Comprehensive analysis of 5-hydroxymethylcytosine in zw10 kinetochore protein as a promising biomarker for screening and diagnosis of early colorectal cancer. Clin Transl Med. 2020;10(3):e125.
doi pubmed - Gao K, Lockwood WW, Li J, Lam W, Li G. Genomic analyses identify gene candidates for acquired irinotecan resistance in melanoma cells. Int J Oncol. 2008;32(6):1343-1349.
doi pubmed - https://portal.gdc.cancer.gov/.
- https://ualcan.path.uab.edu/.
- https://www.proteinatlas.org/.
- https://www.ncbi.nlm.nih.gov/geo/.
- https://trace.ncbi.nlm.nih.gov/Traces/sra/.
- https://www.ebi.ac.uk/arrayexpress/.
- https://www.oncomine.com/.
- https://commonfund.nih.gov/GTEx/.
- Li H, Han D, Hou Y, Chen H, Chen Z. Statistical inference methods for two crossing survival curves: a comparison of methods. PLoS One. 2015;10(1):e0116774.
doi pubmed - https://david.ncifcrf.gov/home.jsp.
- Shen W, Song Z, Zhong X, Huang M, Shen D, Gao P, Qian X, et al. Sangerbox: A comprehensive, interaction-friendly clinical bioinformatics analysis platform. Imeta. 2022;1(3):e36.
doi pubmed - Aran D, Hu Z, Butte AJ. xCell: digitally portraying the tissue cellular heterogeneity landscape. Genome Biol. 2017;18(1):220.
doi pubmed - https://clue.io/.
- Trevisani F, Brandi G, Garuti F, Barbera MA, Tortora R, Casadei Gardini A, Granito A, et al. Metronomic capecitabine as second-line treatment for hepatocellular carcinoma after sorafenib discontinuation. J Cancer Res Clin Oncol. 2018;144(2):403-414.
doi pubmed - Llovet JM, Montal R, Sia D, Finn RS. Molecular therapies and precision medicine for hepatocellular carcinoma. Nat Rev Clin Oncol. 2018;15(10):599-616.
doi pubmed - Li M, Sun J, Shi G. Application of CRISPR screen in mechanistic studies of tumor development, tumor drug resistance, and tumor immunotherapy. Front Cell Dev Biol. 2023;11:1220376.
doi pubmed - Tong H, Liu X, Peng C, Shen B, Zhu Z. Silencing of KNTC1 inhibits hepatocellular carcinoma cells progression via suppressing PI3K/Akt pathway. Cell Signal. 2023;101:110498.
doi pubmed - Giraud J, Chalopin D, Blanc JF, Saleh M. Hepatocellular Carcinoma Immune Landscape and the Potential of Immunotherapies. Front Immunol. 2021;12:655697.
doi pubmed - Zerfaoui M, Dokunmu TM, Toraih EA, Rezk BM, Abd Elmageed ZY, Kandil E. New insights into the link between melanoma and thyroid cancer: role of nucleocytoplasmic trafficking. Cells. 2021;10(2):367.
doi pubmed - Turner JG, Dawson J, Cubitt CL, Baz R, Sullivan DM. Inhibition of CRM1-dependent nuclear export sensitizes malignant cells to cytotoxic and targeted agents. Semin Cancer Biol. 2014;27:62-73.
doi pubmed - Newell S, van der Watt PJ, Leaner VD. Therapeutic targeting of nuclear export and import receptors in cancer and their potential in combination chemotherapy. IUBMB Life. 2024;76(1):4-25.
doi pubmed - Khorashad JS, Eiring AM, Mason CC, Gantz KC, Bowler AD, Redwine HM, Yu F, et al. shRNA library screening identifies nucleocytoplasmic transport as a mediator of BCR-ABL1 kinase-independent resistance. Blood. 2015;125(11):1772-1781.
doi pubmed - Tian X, Yan T, Liu F, Liu Q, Zhao J, Xiong H, Jiang S. Link of sorafenib resistance with the tumor microenvironment in hepatocellular carcinoma: Mechanistic insights. Front Pharmacol. 2022;13:991052.
doi pubmed - Ren Q, Zhang P, Zhang X, Feng Y, Li L, Lin H, Yu Y. A fibroblast-associated signature predicts prognosis and immunotherapy in esophageal squamous cell cancer. Front Immunol. 2023;14:1199040.
doi pubmed - Yan ZJ, Yu CT, Chen L, Wang HY. Development of a TMErisk model based on immune infiltration in tumour microenvironment to predict prognosis of immune checkpoint inhibitor treatment in hepatocellular carcinoma. Brief Bioinform. 2023;24(2):bbad067.
doi pubmed - Fu Y, Liu S, Zeng S, Shen H. From bench to bed: the tumor immune microenvironment and current immunotherapeutic strategies for hepatocellular carcinoma. J Exp Clin Cancer Res. 2019;38(1):396.
doi pubmed - Shen KY, Zhu Y, Xie SZ, Qin LX. Immunosuppressive tumor microenvironment and immunotherapy of hepatocellular carcinoma: current status and prospectives. J Hematol Oncol. 2024;17(1):25.
doi pubmed - Kawata M, McClatchy DB, Diedrich JK, Olmer M, Johnson KA, Yates JR, Lotz MK. Mocetinostat activates Kruppel-like factor 4 and protects against tissue destruction and inflammation in osteoarthritis. JCI Insight. 2023;8(17):e170513.
doi pubmed - Johnson ML, Strauss J, Patel MR, Garon EB, Eaton KD, Neskorik T, Morin J, et al. Mocetinostat in combination with durvalumab for patients with advanced NSCLC: results from a phase I/II study. Clin Lung Cancer. 2023;24(3):218-227.
doi pubmed - Kaya Cakir H, Eroglu O. In vitro anti-proliferative effect of capecitabine (Xeloda) combined with mocetinostat (MGCD0103) in 4T1 breast cancer cell line by immunoblotting. Iran J Basic Med Sci. 2021;24(11):1515-1522.
doi pubmed - Weber JS, Levinson BA, Laino AS, Pavlick AC, Woods DM. Clinical and immune correlate results from a phase 1b study of the histone deacetylase inhibitor mocetinostat with ipilimumab and nivolumab in unresectable stage III/IV melanoma. Melanoma Res. 2022;32(5):324-333.
doi pubmed - Briere D, Sudhakar N, Woods DM, Hallin J, Engstrom LD, Aranda R, Chiang H, et al. The class I/IV HDAC inhibitor mocetinostat increases tumor antigen presentation, decreases immune suppressive cell types and augments checkpoint inhibitor therapy. Cancer Immunol Immunother. 2018;67(3):381-392.
doi pubmed - Kaya Cakir H, Eroglu O. Investigation of the synergic effect of mocetinostat and capecitabine in a triple-negative breast neoplasms mouse model. J Investig Med. 2025.
doi pubmed
This article is distributed under the terms of the Creative Commons Attribution Non-Commercial 4.0 International License, which permits unrestricted non-commercial use, distribution, and reproduction in any medium, provided the original work is properly cited.
World Journal of Oncology is published by Elmer Press Inc.