Figures
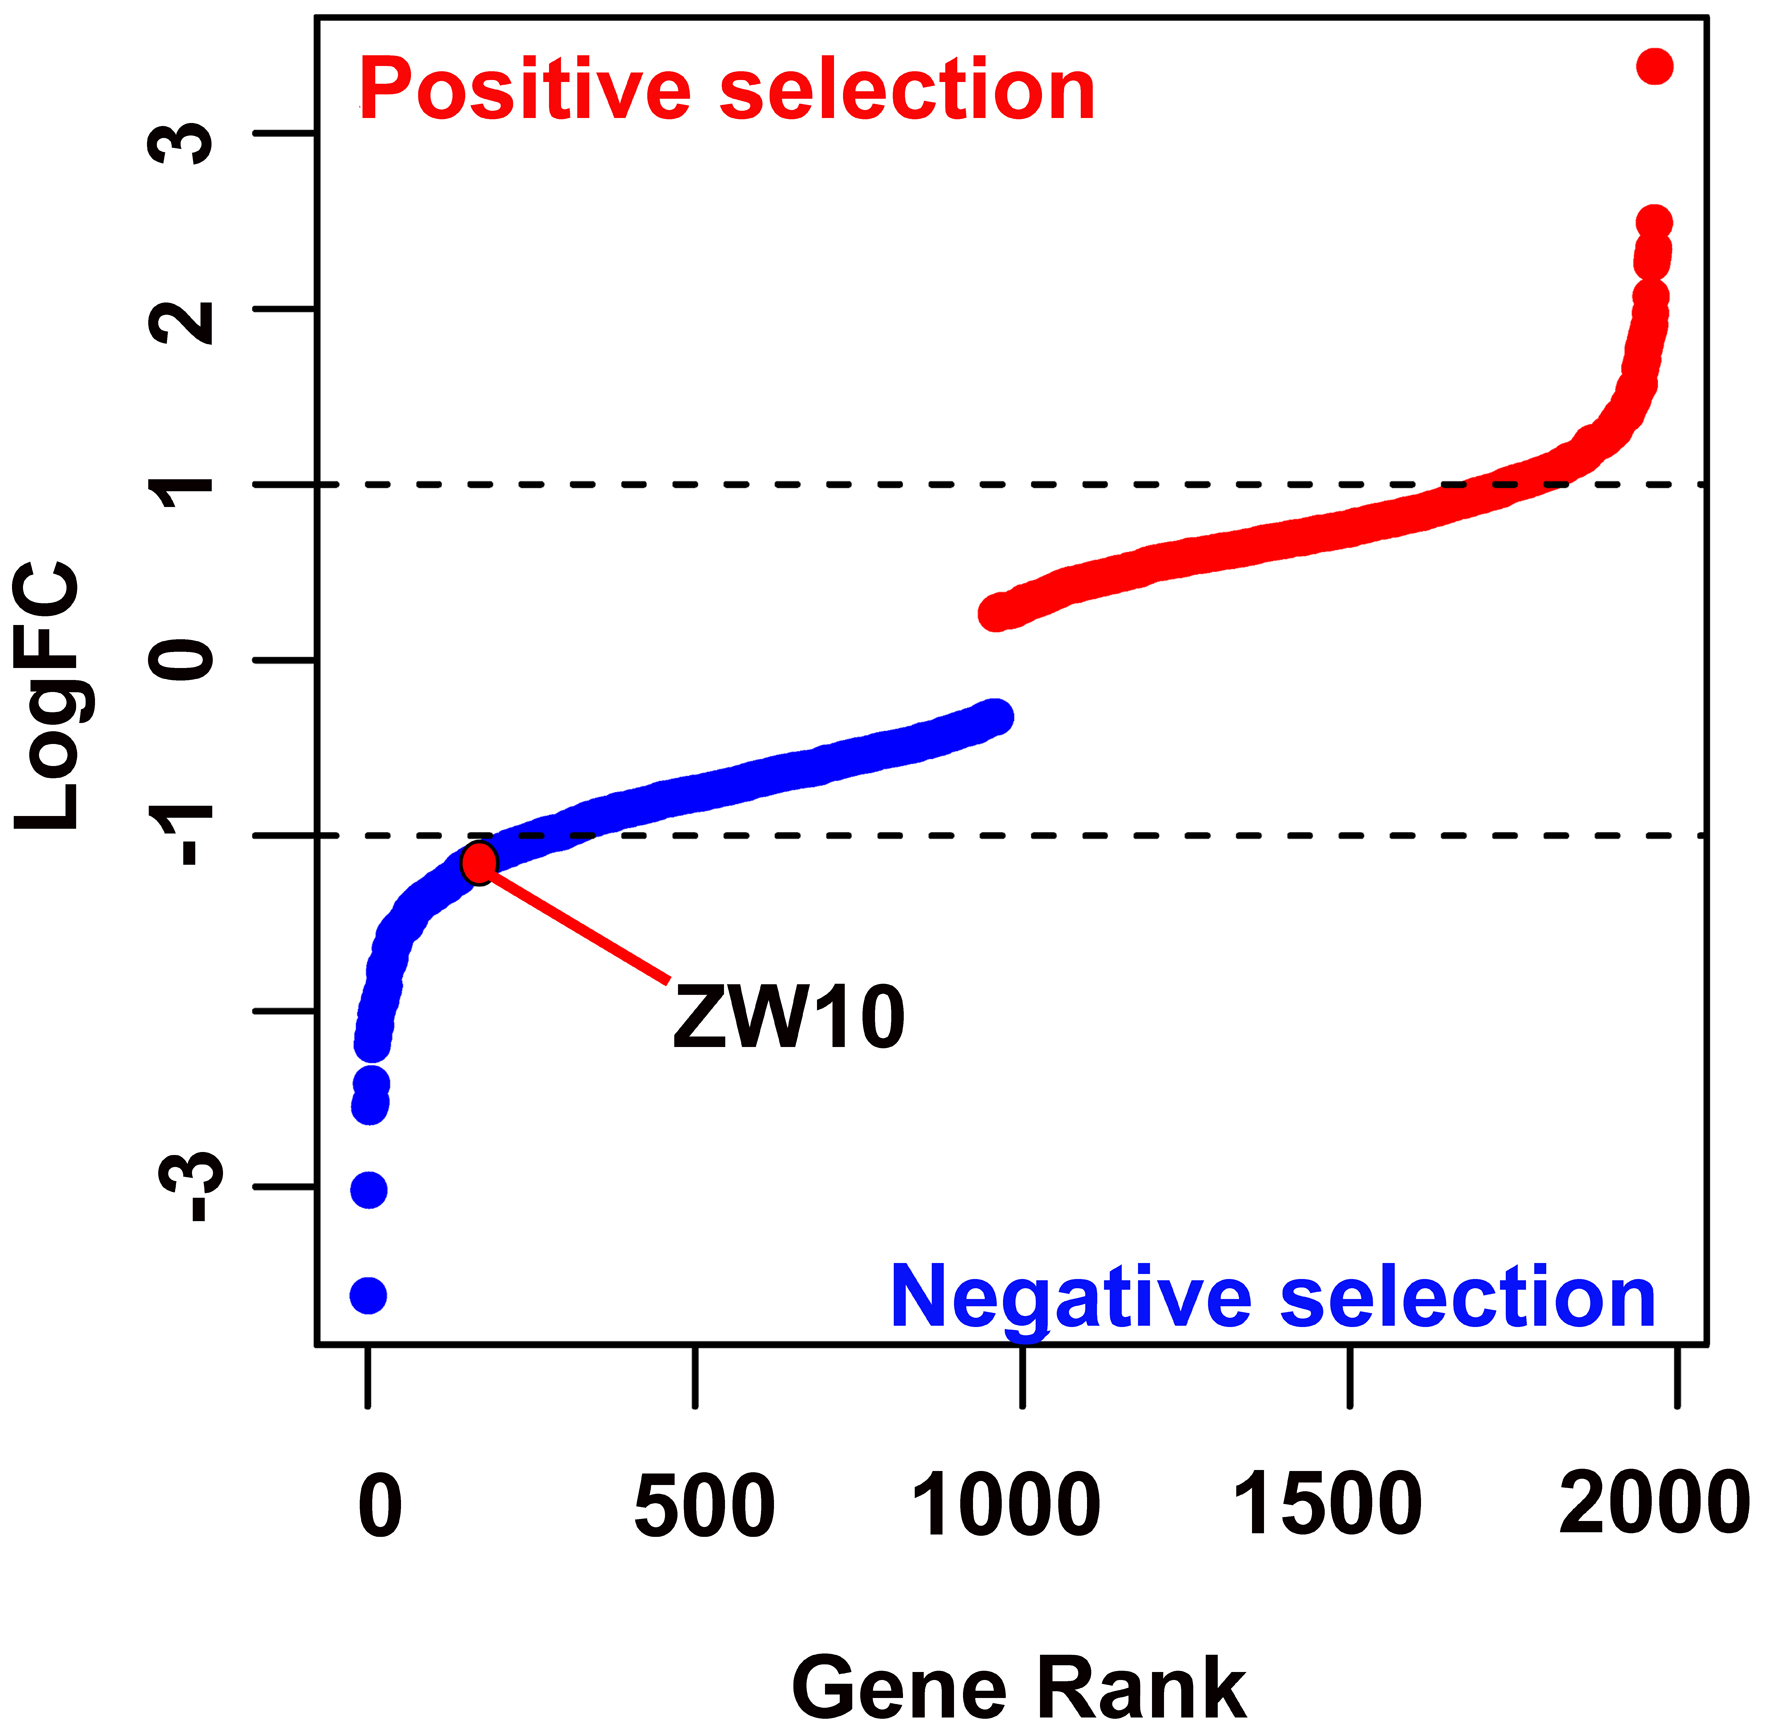
↓ Figure 1. The positive and negative screen of
CRISPR screen experiment. CRISPR: clustered regularly interspaced short palindromic repeats.
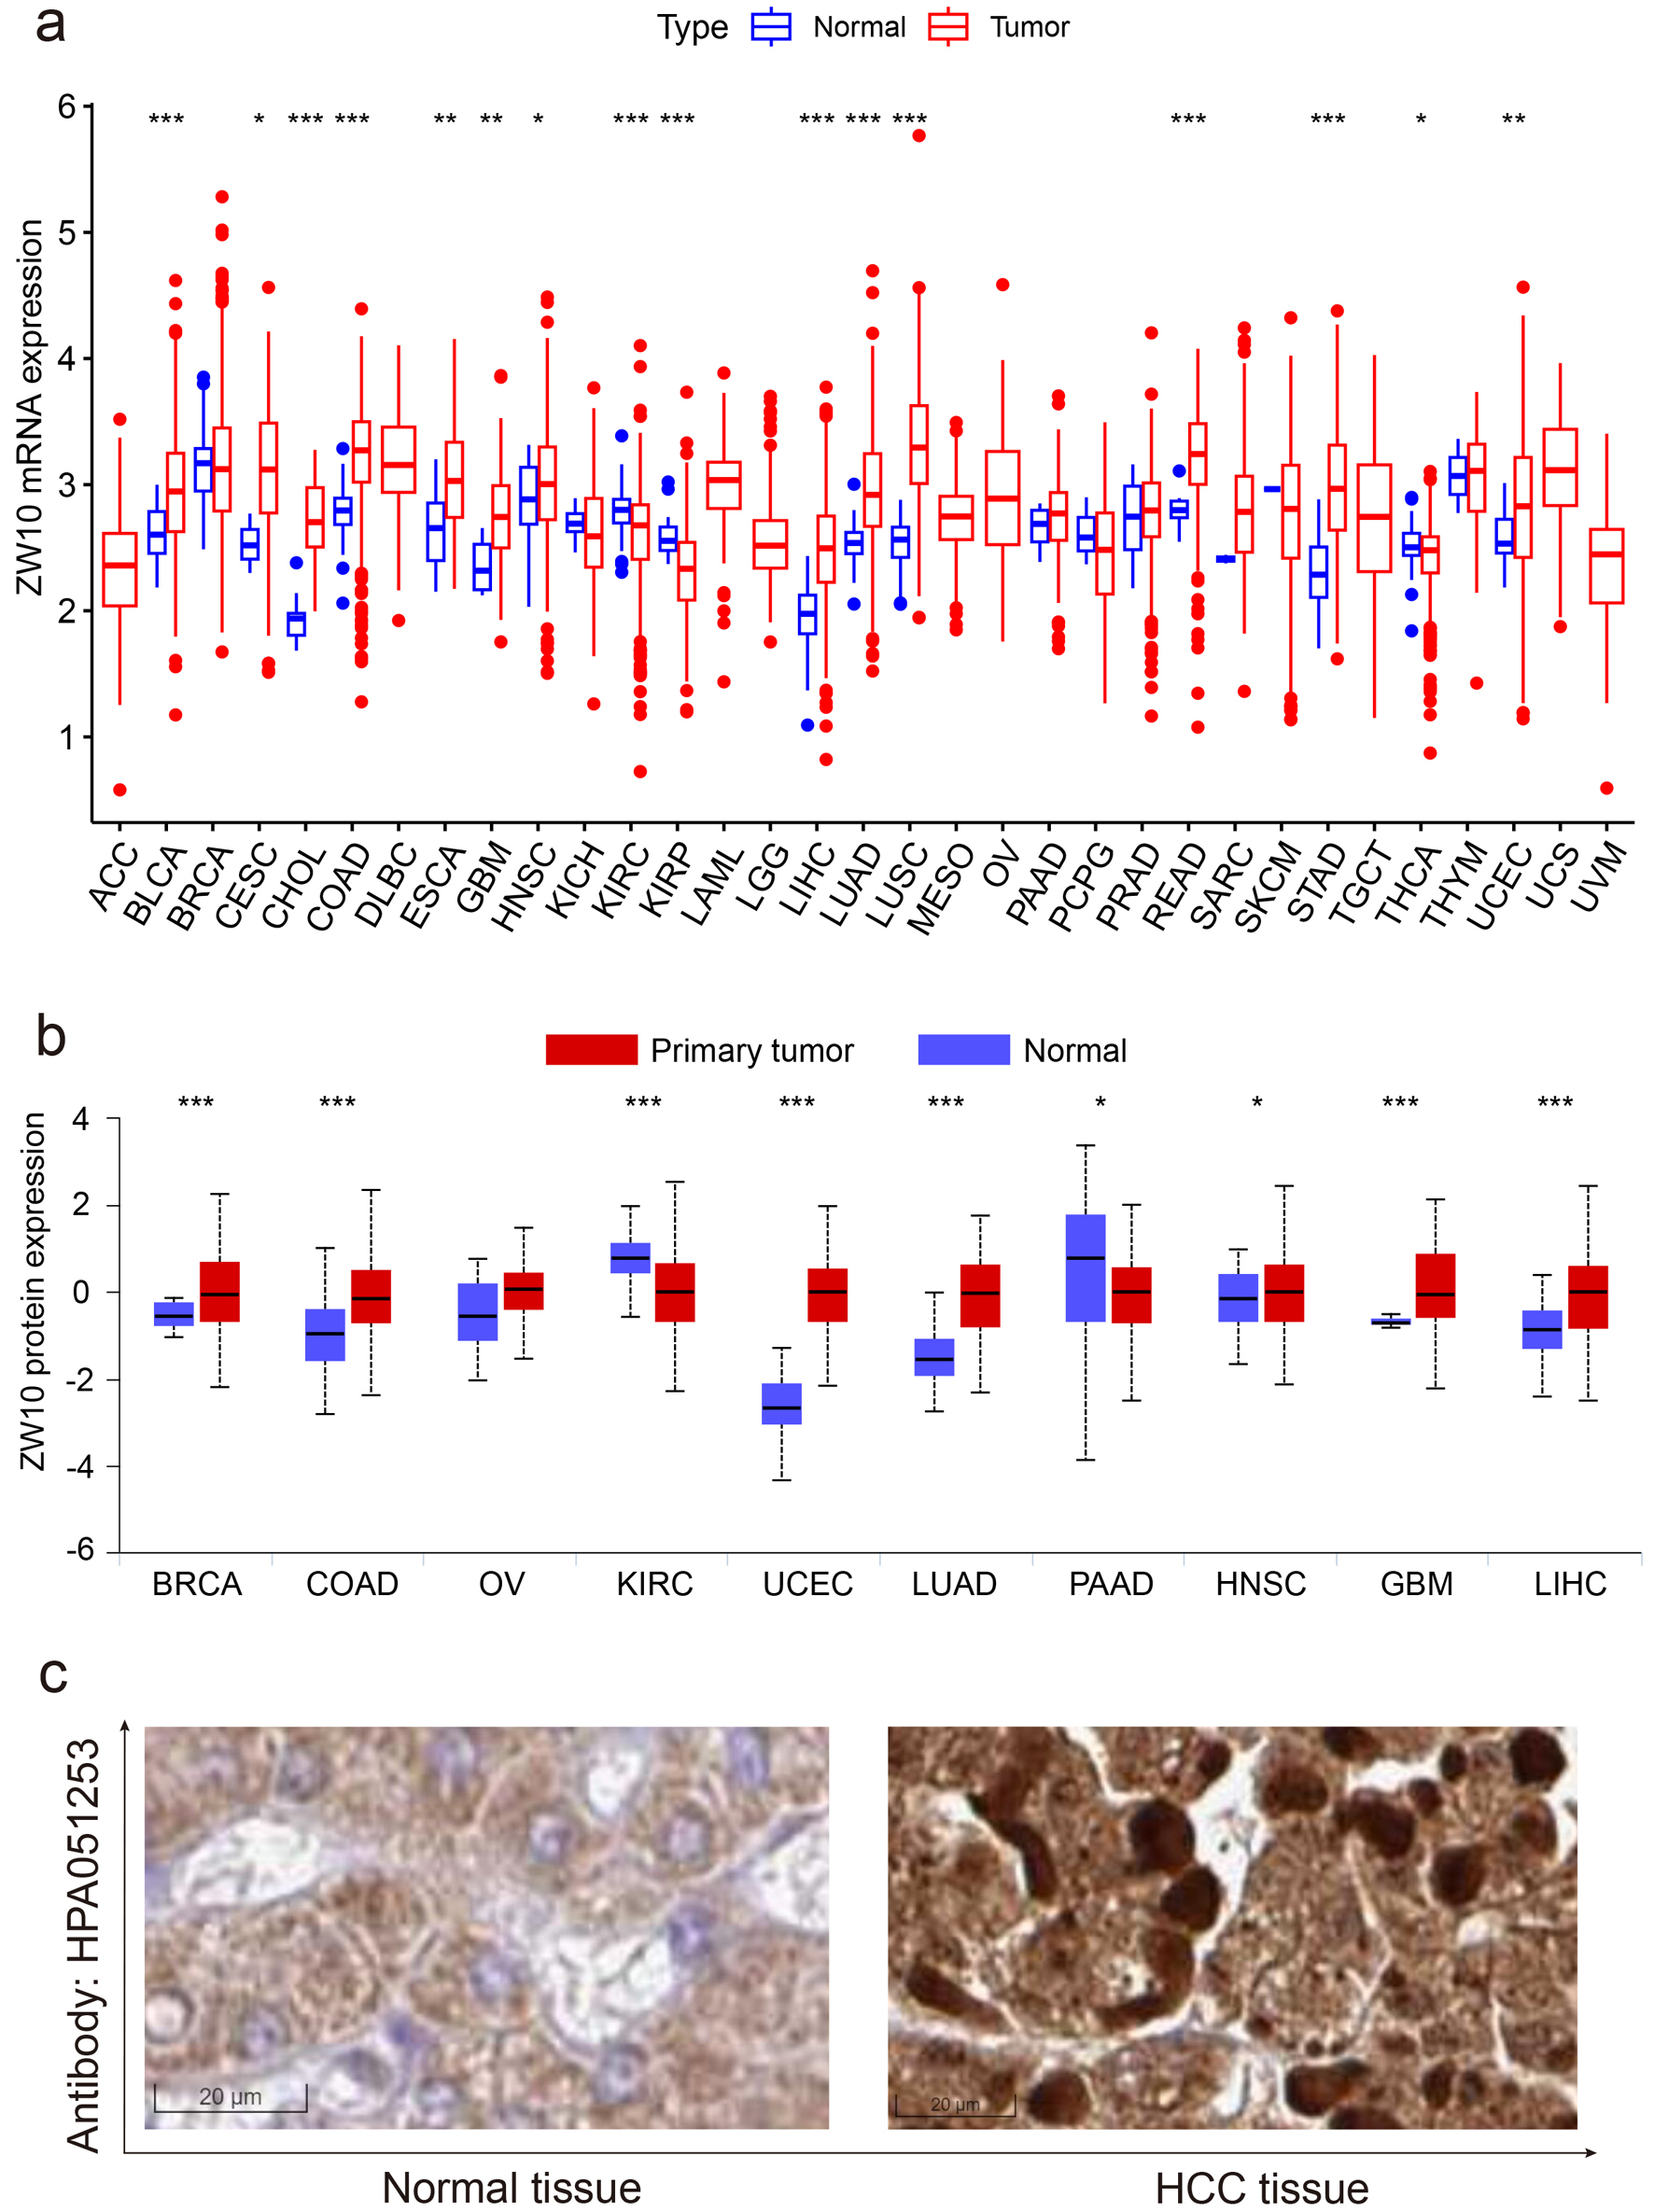
↓ Figure 2. The expression level of ZW10
within primary malignancies. (a) mRNA expression status. (b) Protein expression status. (c)
Immunohistochemical staining picture. ACC: adrenocortical carcinoma; BLCA: bladder urothelial carcinoma;
BRCA: breast invasive carcinoma; CESC: cervical squamous cell carcinoma and endocervical adenocarcinoma;
CHOL: cholangiocarcinoma; COAD: colon adenocarcinoma; DLBC: lymphoid neoplasm diffuse large B-cell
lymphoma; ESCA: esophageal carcinoma; GBM: glioblastoma multiforme; HNSC: head and neck squamous cell
carcinoma; KICH: kidney chromophobe; KIRC: kidney renal clear cell carcinoma; KIRP: kidney renal
papillary cell carcinoma; LAML: acute myeloid leukemia; LGG: brain lower grade glioma; LIHC: liver
hepatocellular carcinoma; LUAD: lung adenocarcinoma; LUSC: lung squamous cell carcinoma; MESO:
mesothelioma; OV: ovarian serous cystadenocarcinoma; PAAD: pancreatic adenocarcinoma; PCPG:
pheochromocytoma and paraganglioma; PRAD: prostate adenocarcinoma; READ: rectum adenocarcinoma; SARC:
sarcoma; SKCM: skin cutaneous melanoma; STAD: stomach adenocarcinoma; TGCT: testicular germ cell tumors;
THCA: thyroid carcinoma; THYM: thymoma; UCEC: uterine corpus endometrial carcinoma; UCS: uterine
carcinosarcoma; UVM: uveal melanoma.
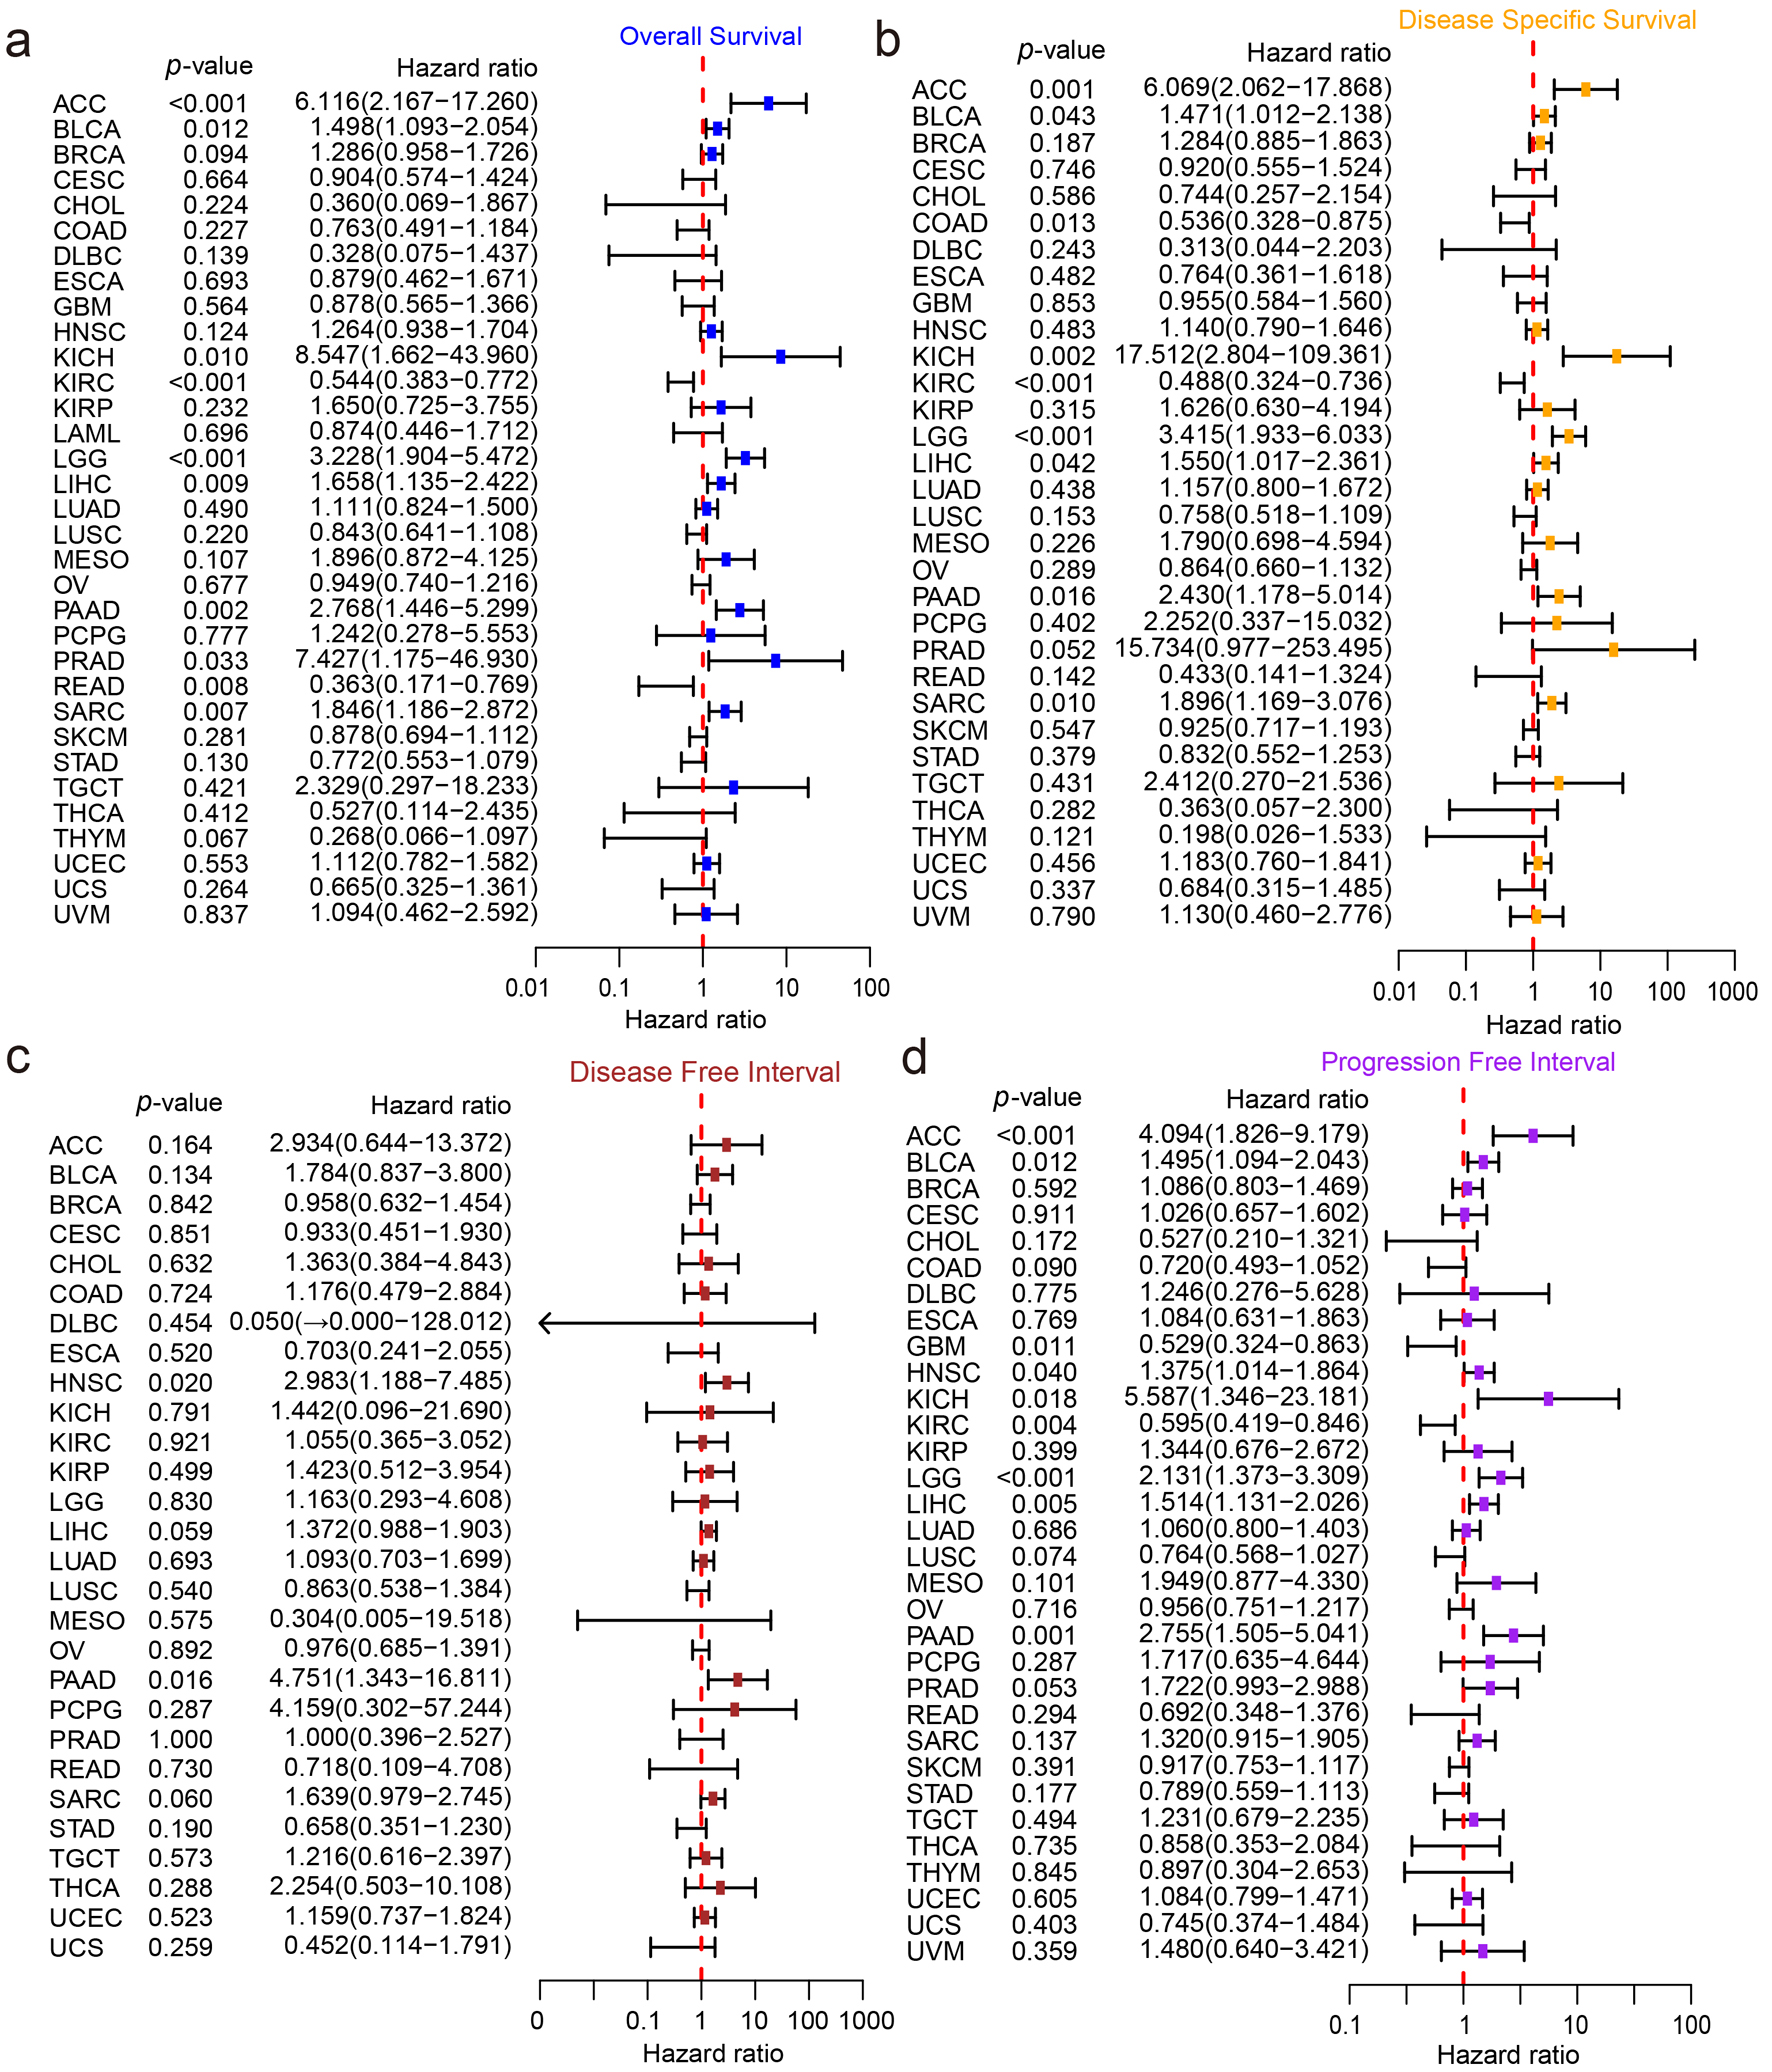
↓ Figure 3. The survival analysis of ZW10
across various cancers. (a) Overall survival analysis. (b) Disease-specific survival analysis. (c)
Disease-free interval analysis. (d) Progression-free interval analysis.
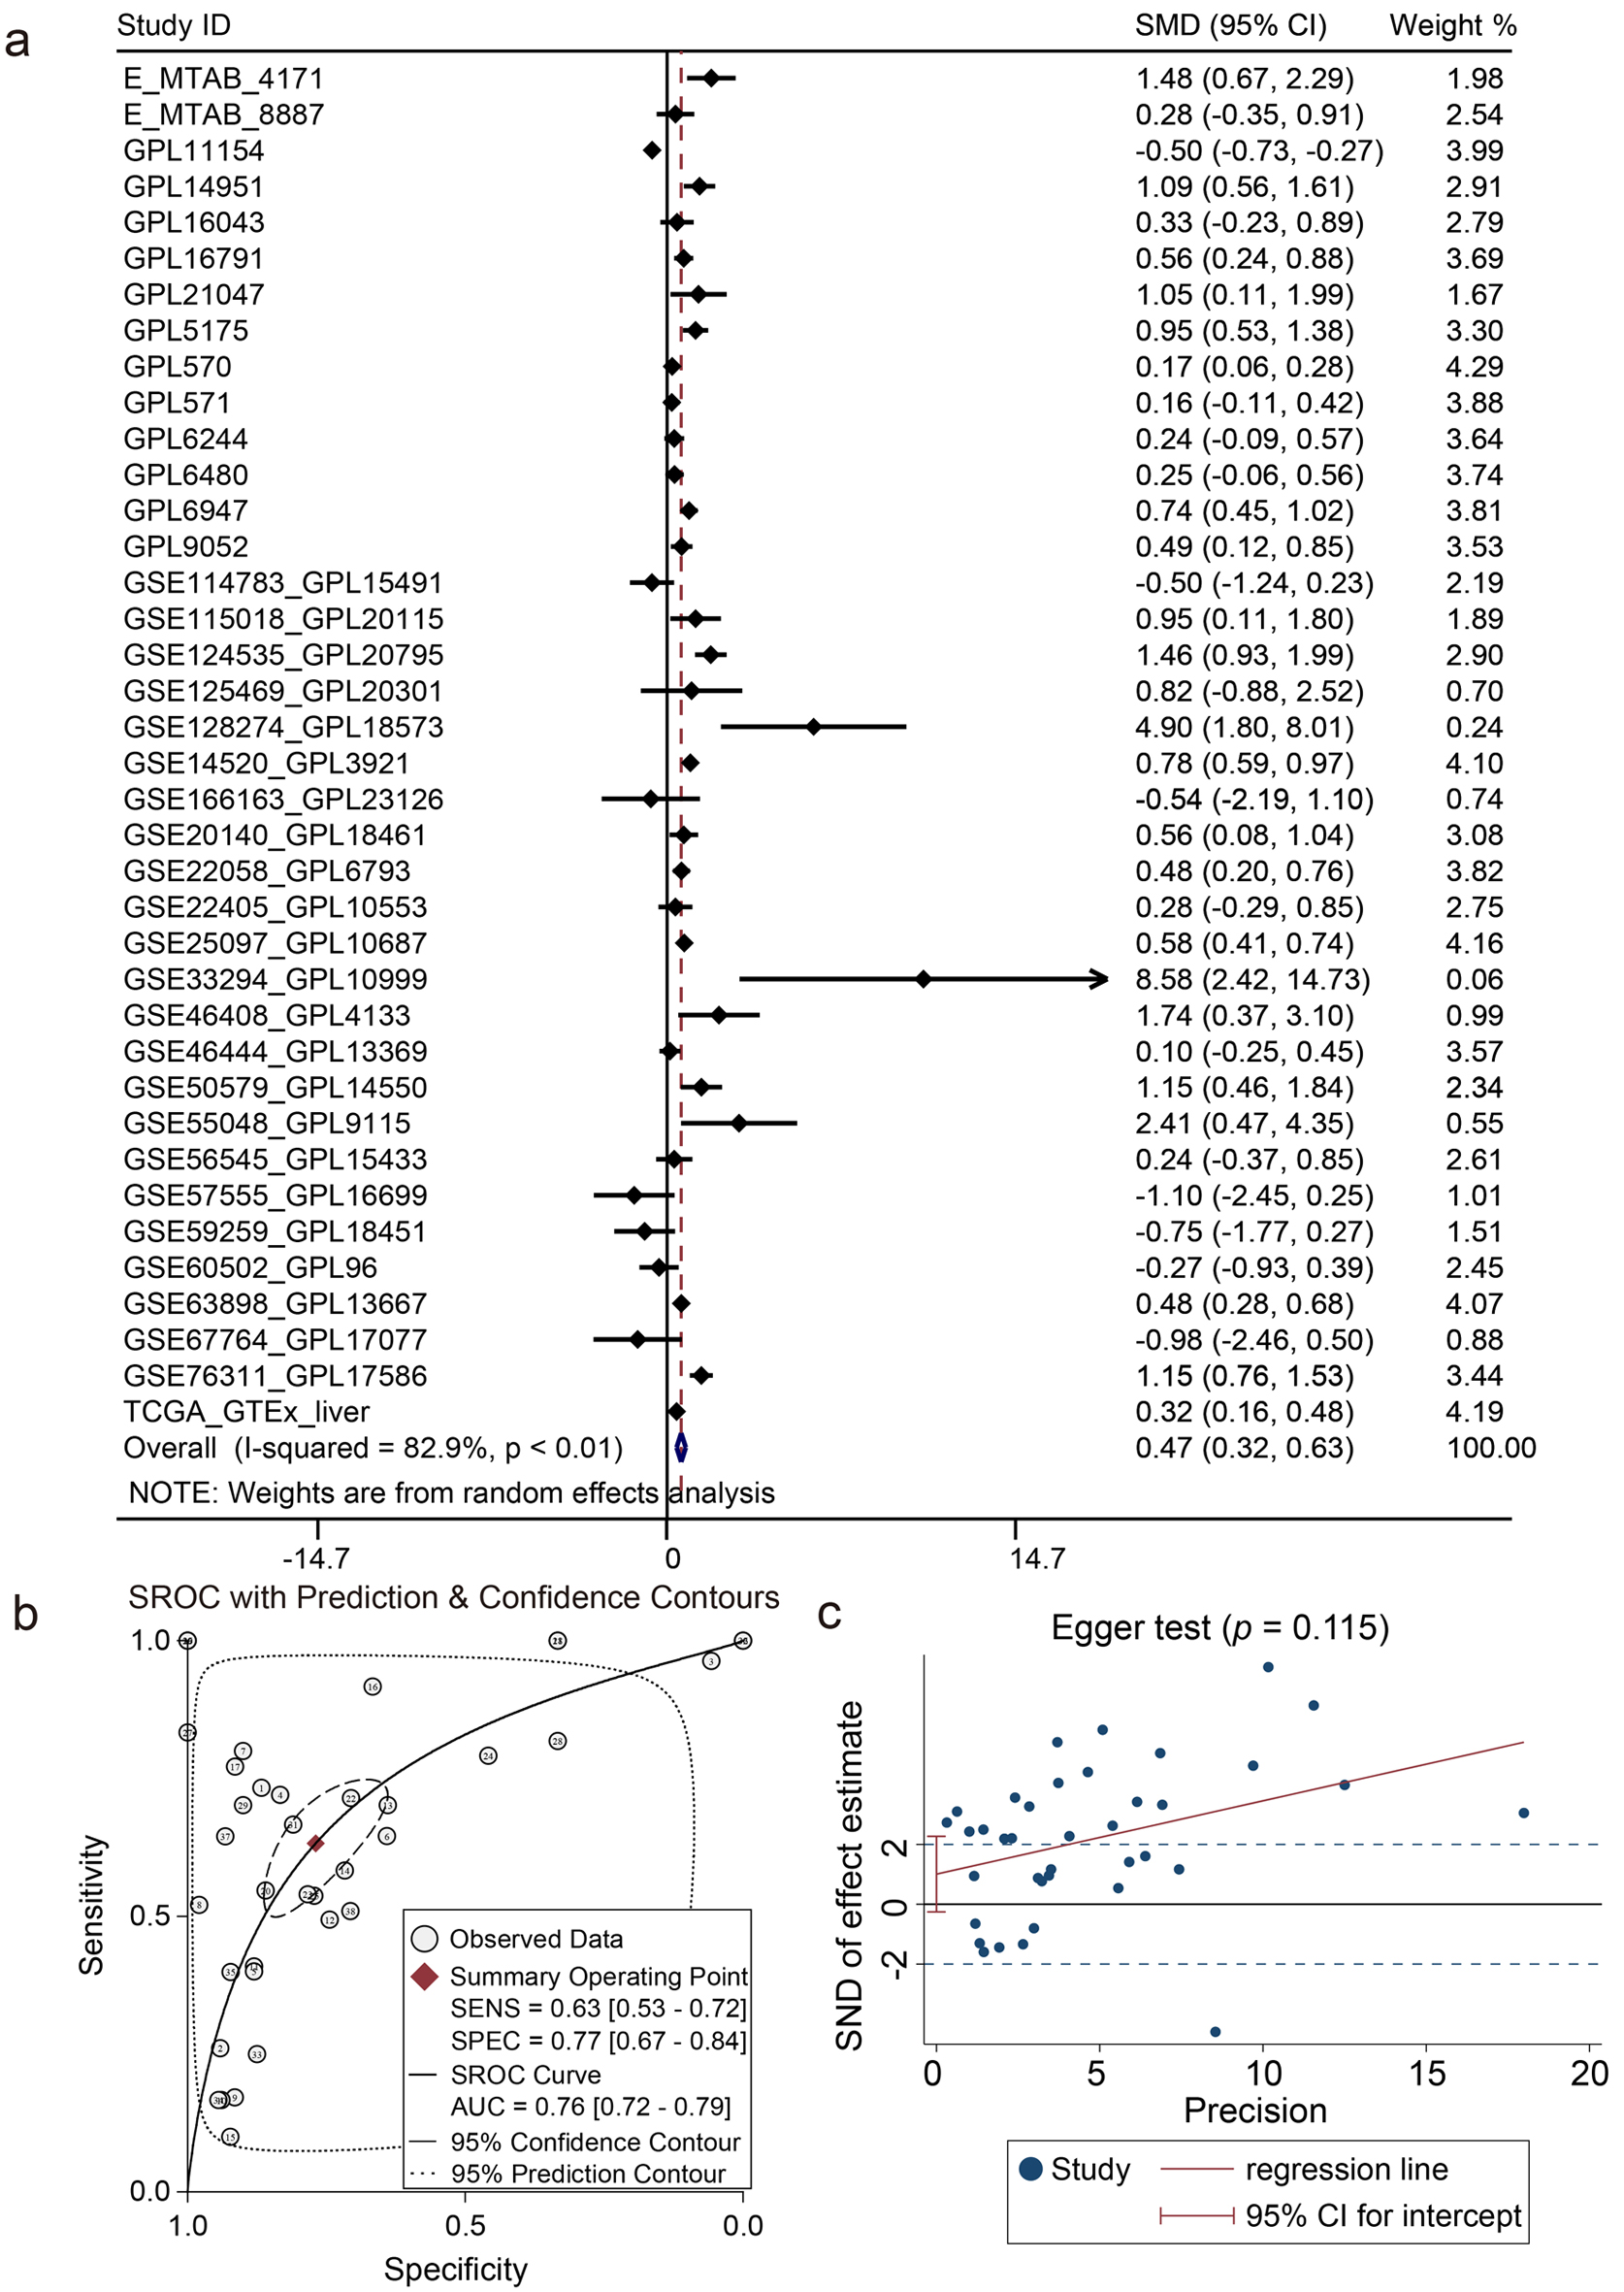
↓ Figure 4. Integrated analysis of ZW10
mRNA expression level. (a) Forest plot of standardized mean difference. (b) Summary receiver operating
characteristic curve. (c) Egger funnel plot (P = 0.115).
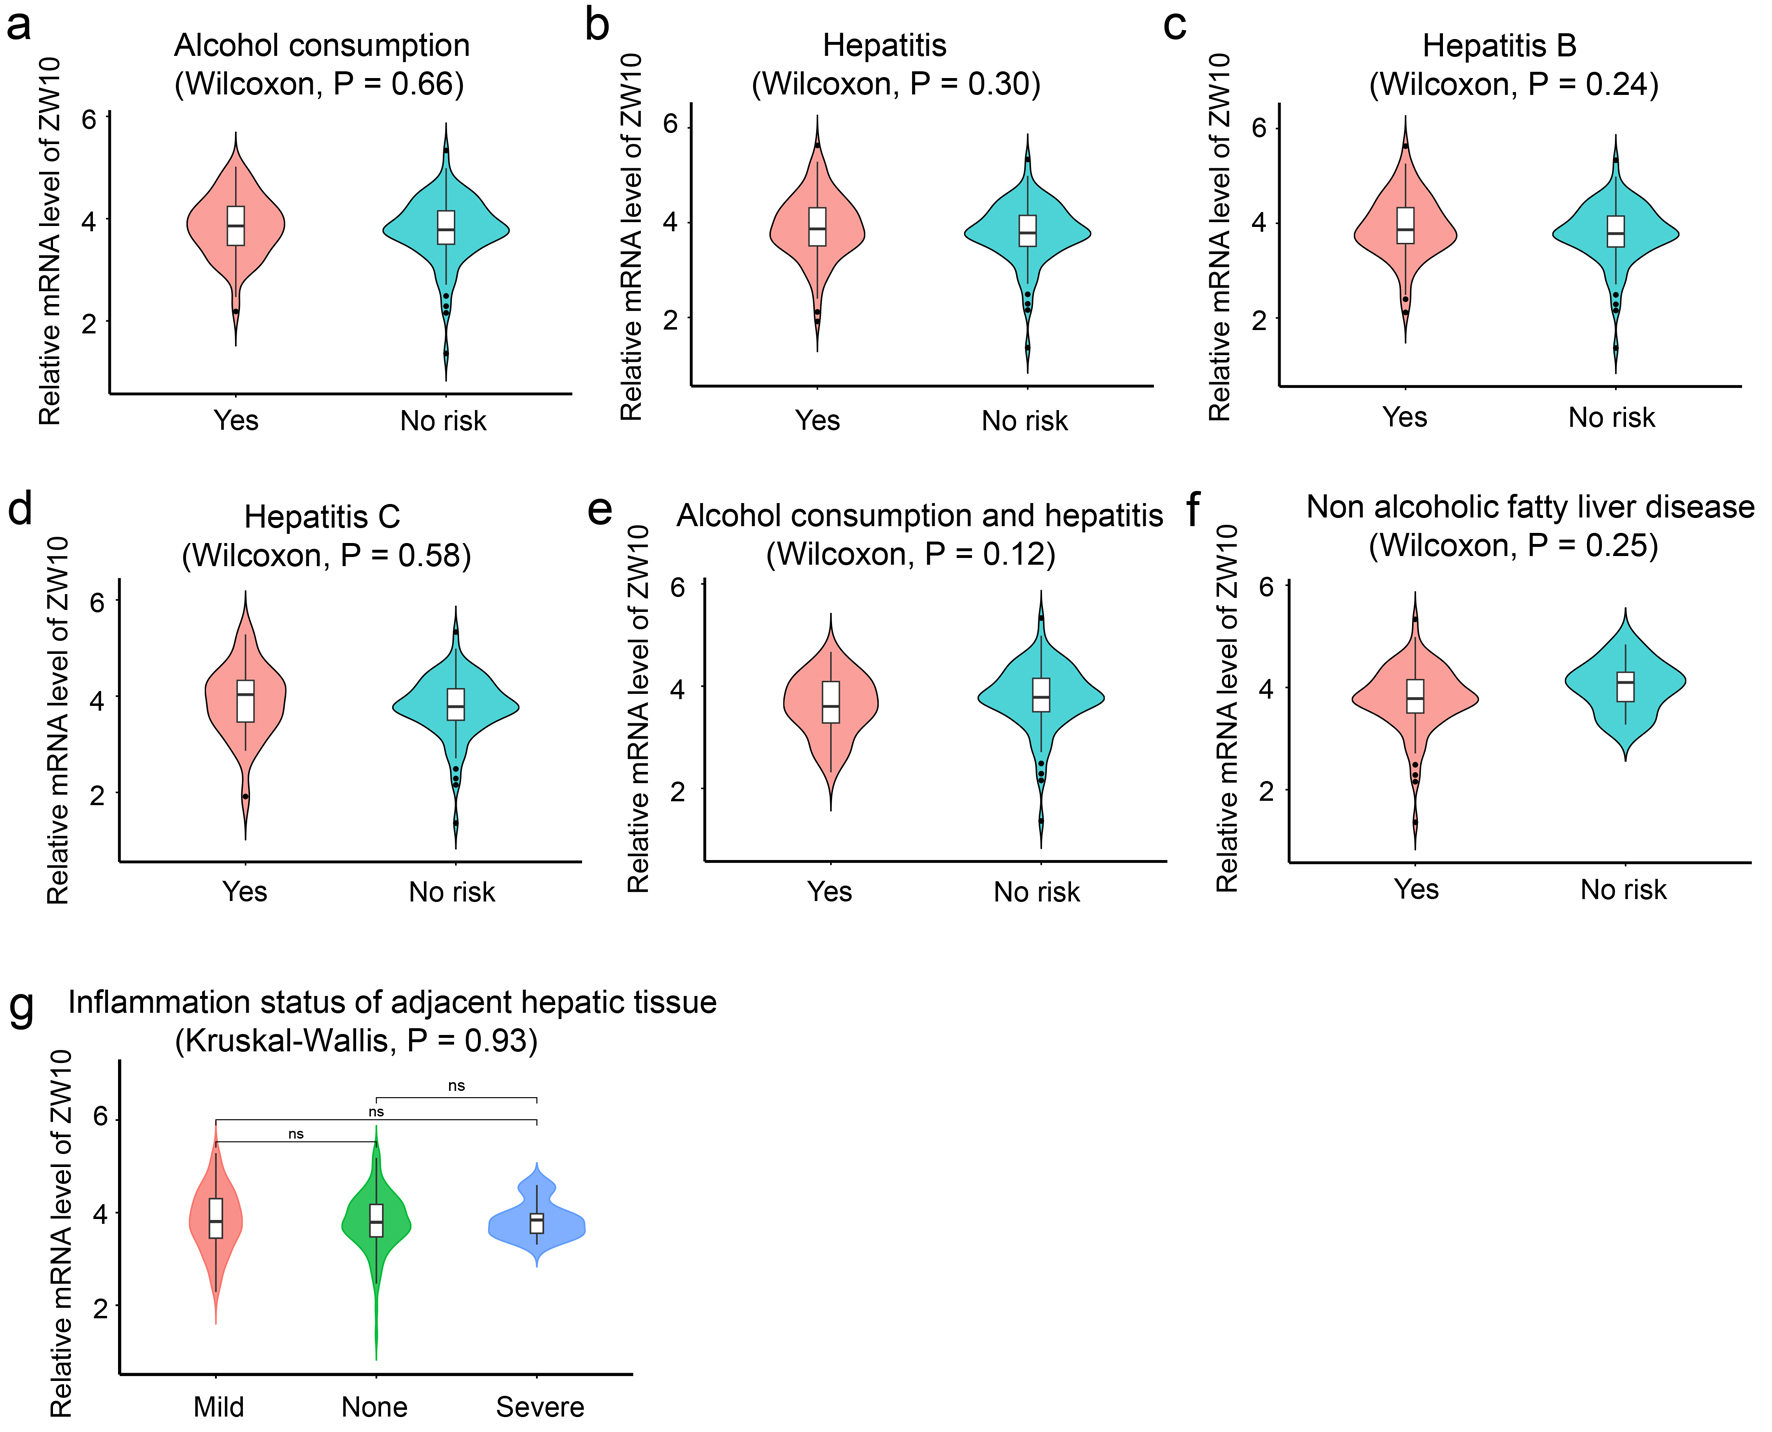
↓ Figure 5. Etiology stratification analysis in
different subgroups. (a) Alcohol consumption. (b) Hepatitis (B or C). (c) Hepatitis B. (d) Hepatitis C.
(e) The combination of alcohol consumption and hepatitis (B or C). (f) Non-alcoholic fatty liver
disease. (g) Inflammation status of adjacent hepatic tissue.
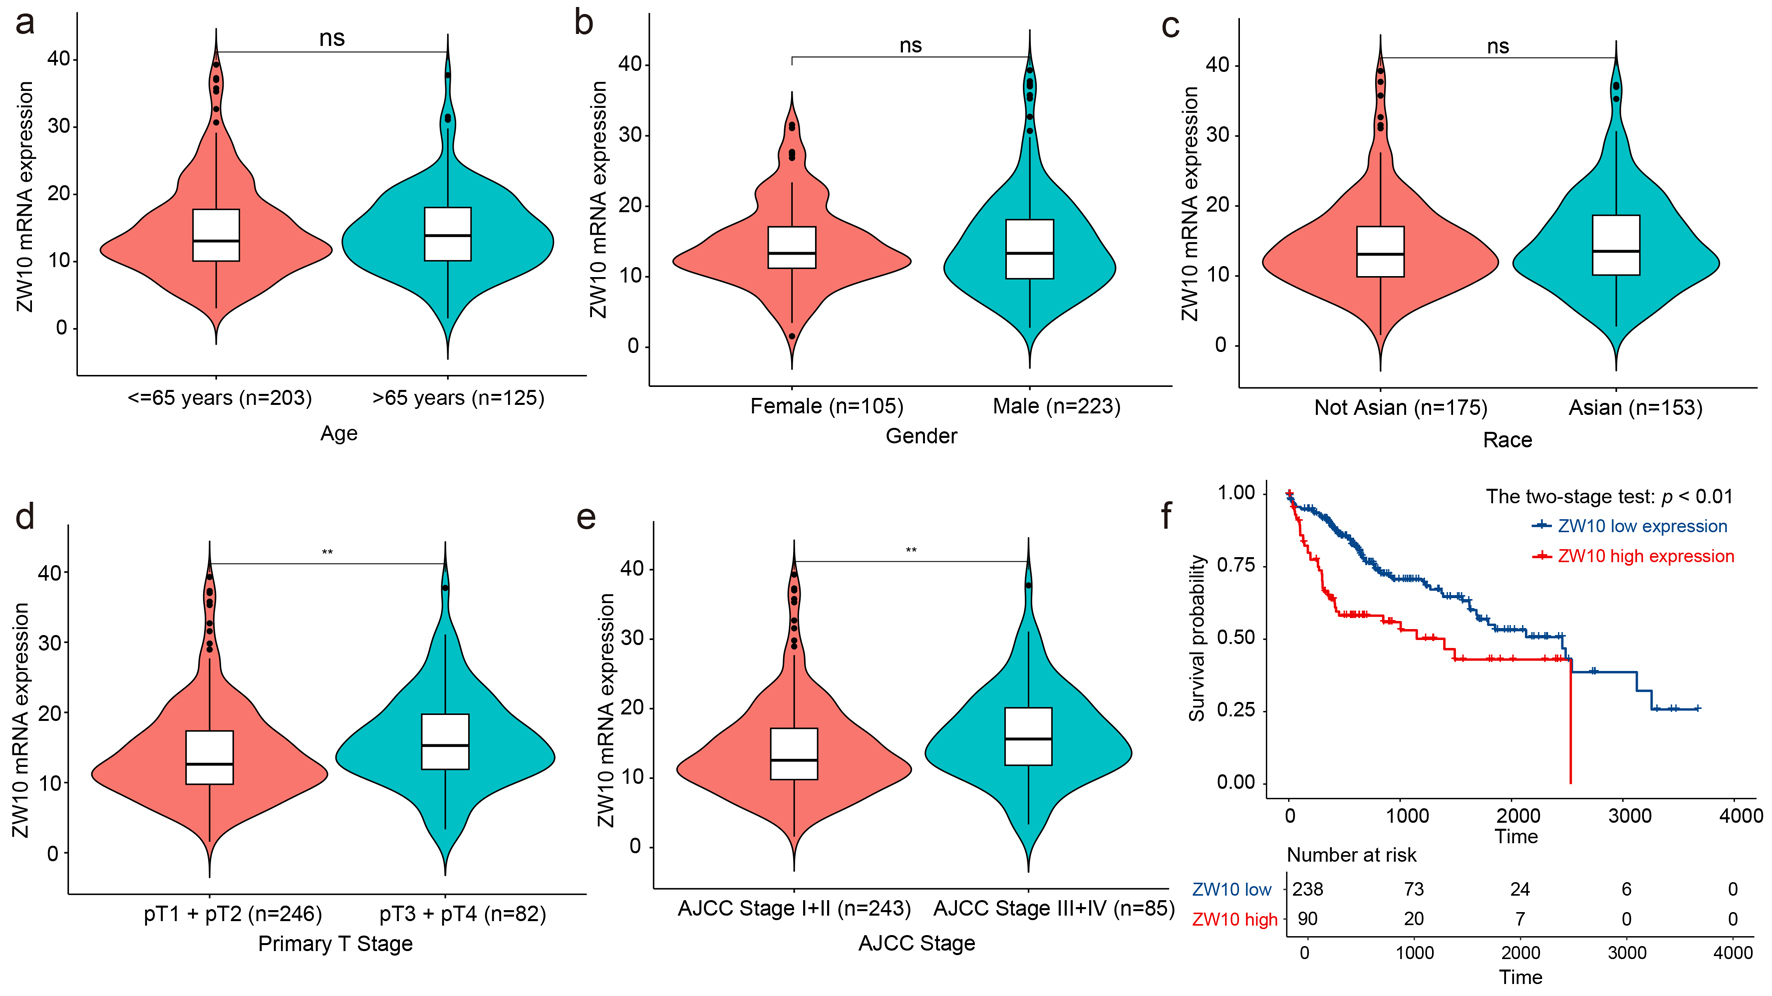
↓ Figure 6. The association between ZW10
mRNA expression status and clinical parameters. (a) Age. (b) Gender. (c) Race. (d) Primary stage. (e)
AJCC stage. (f) Overall survival. **P < 0.01, nsP > 0.05. AJCC: American Joint
Committee on Cancer.
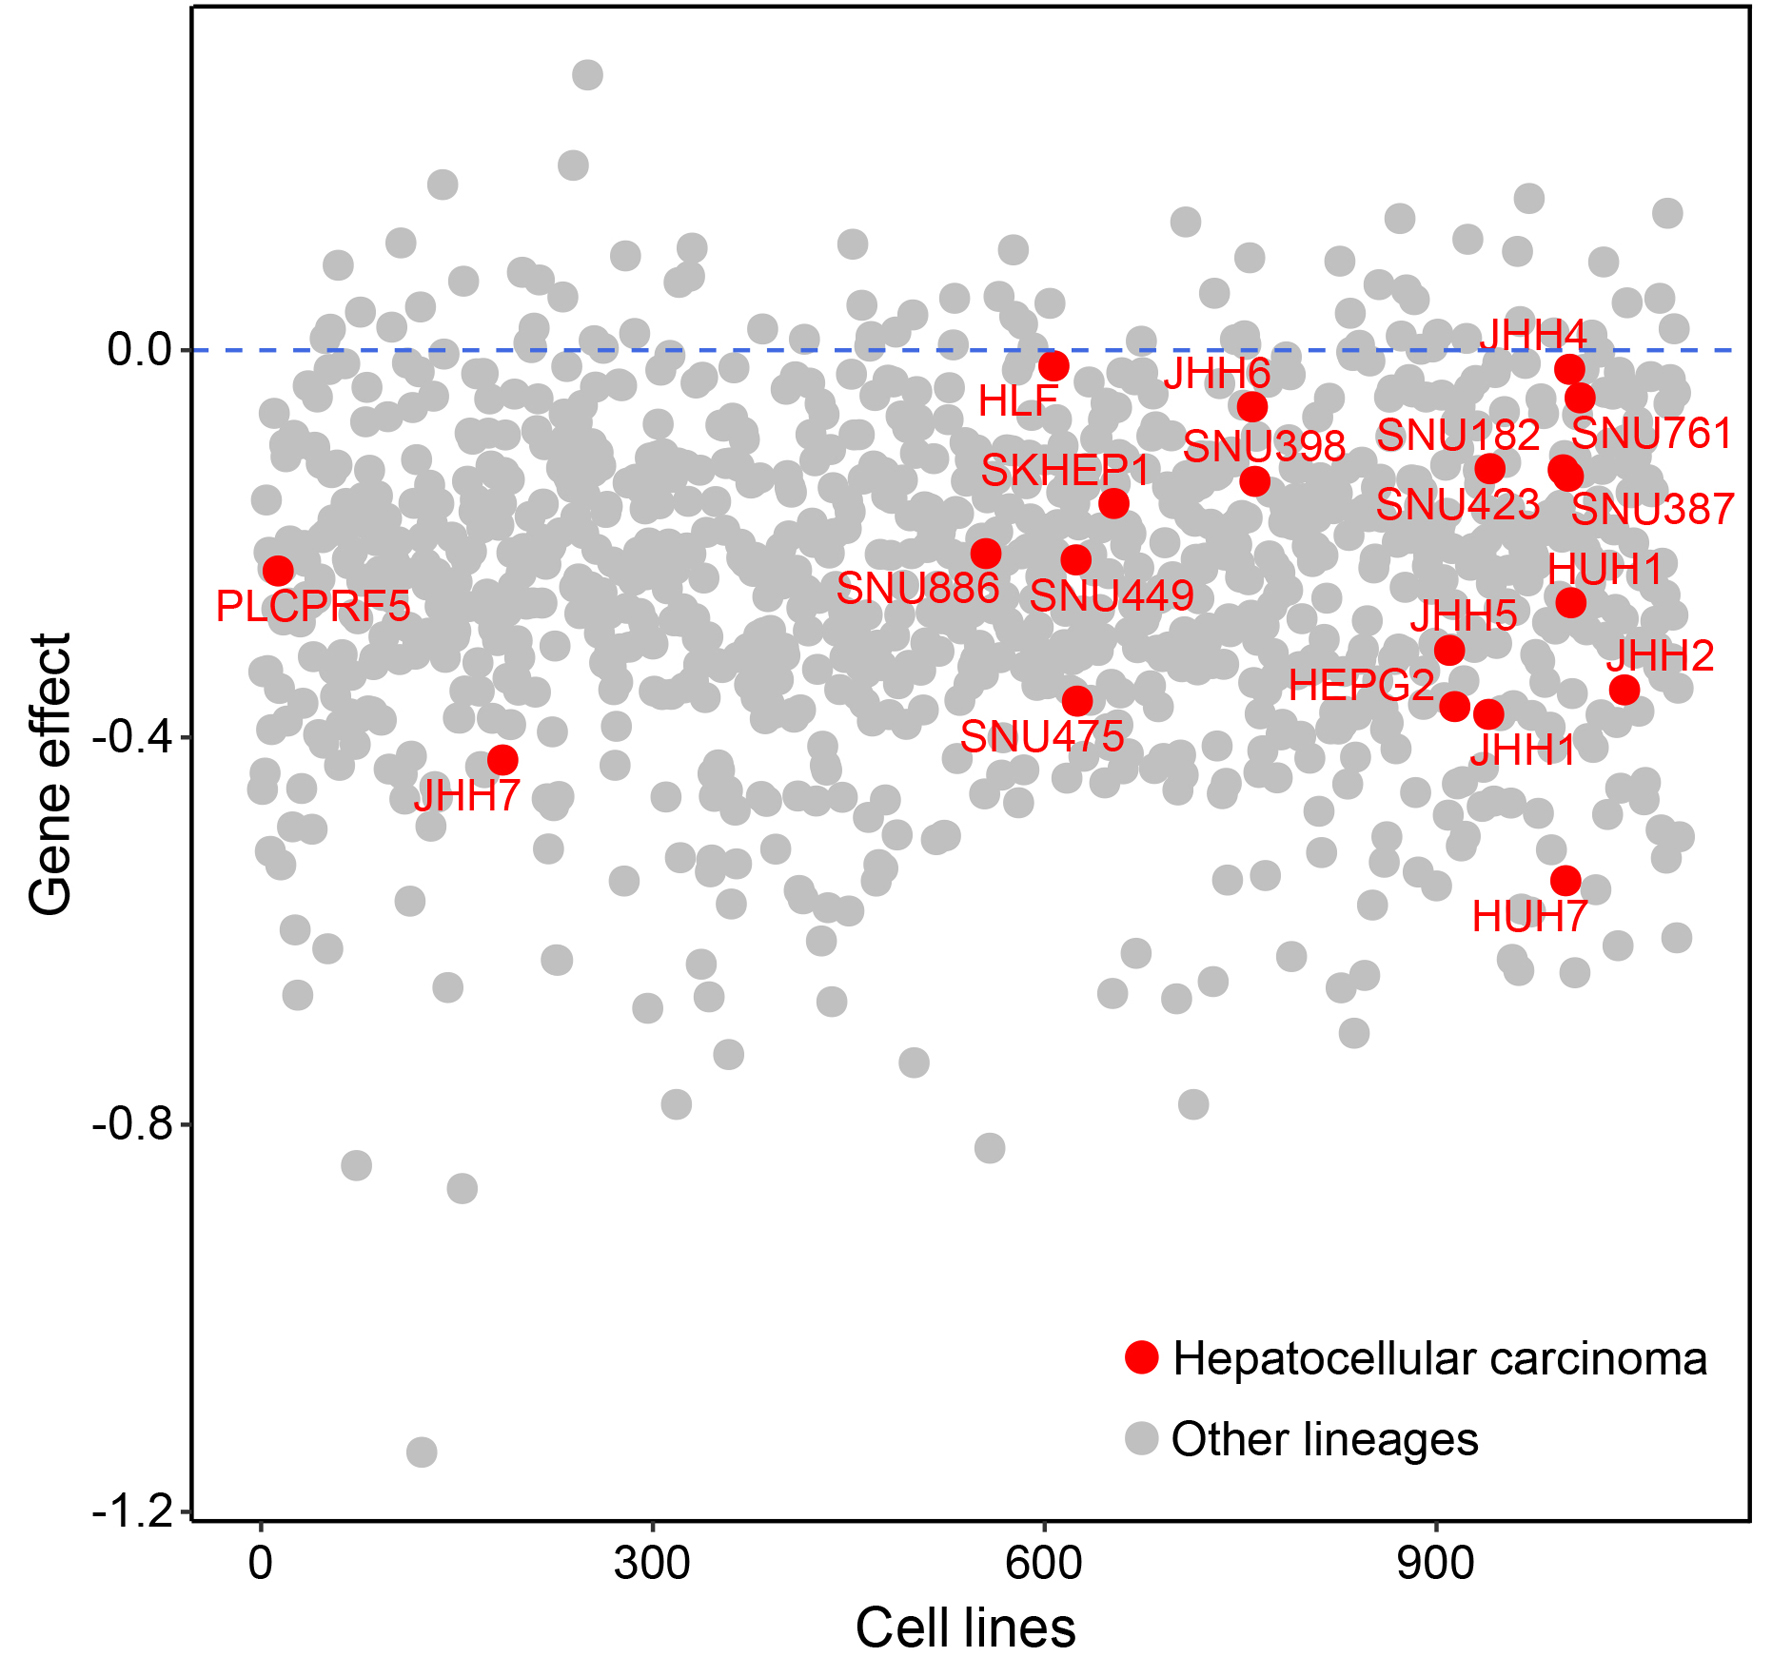
↓ Figure 7. Gene effect of ZW10 for 20 HCC
cell lines based on the DepMap database. HCC: hepatocellular carcinoma.
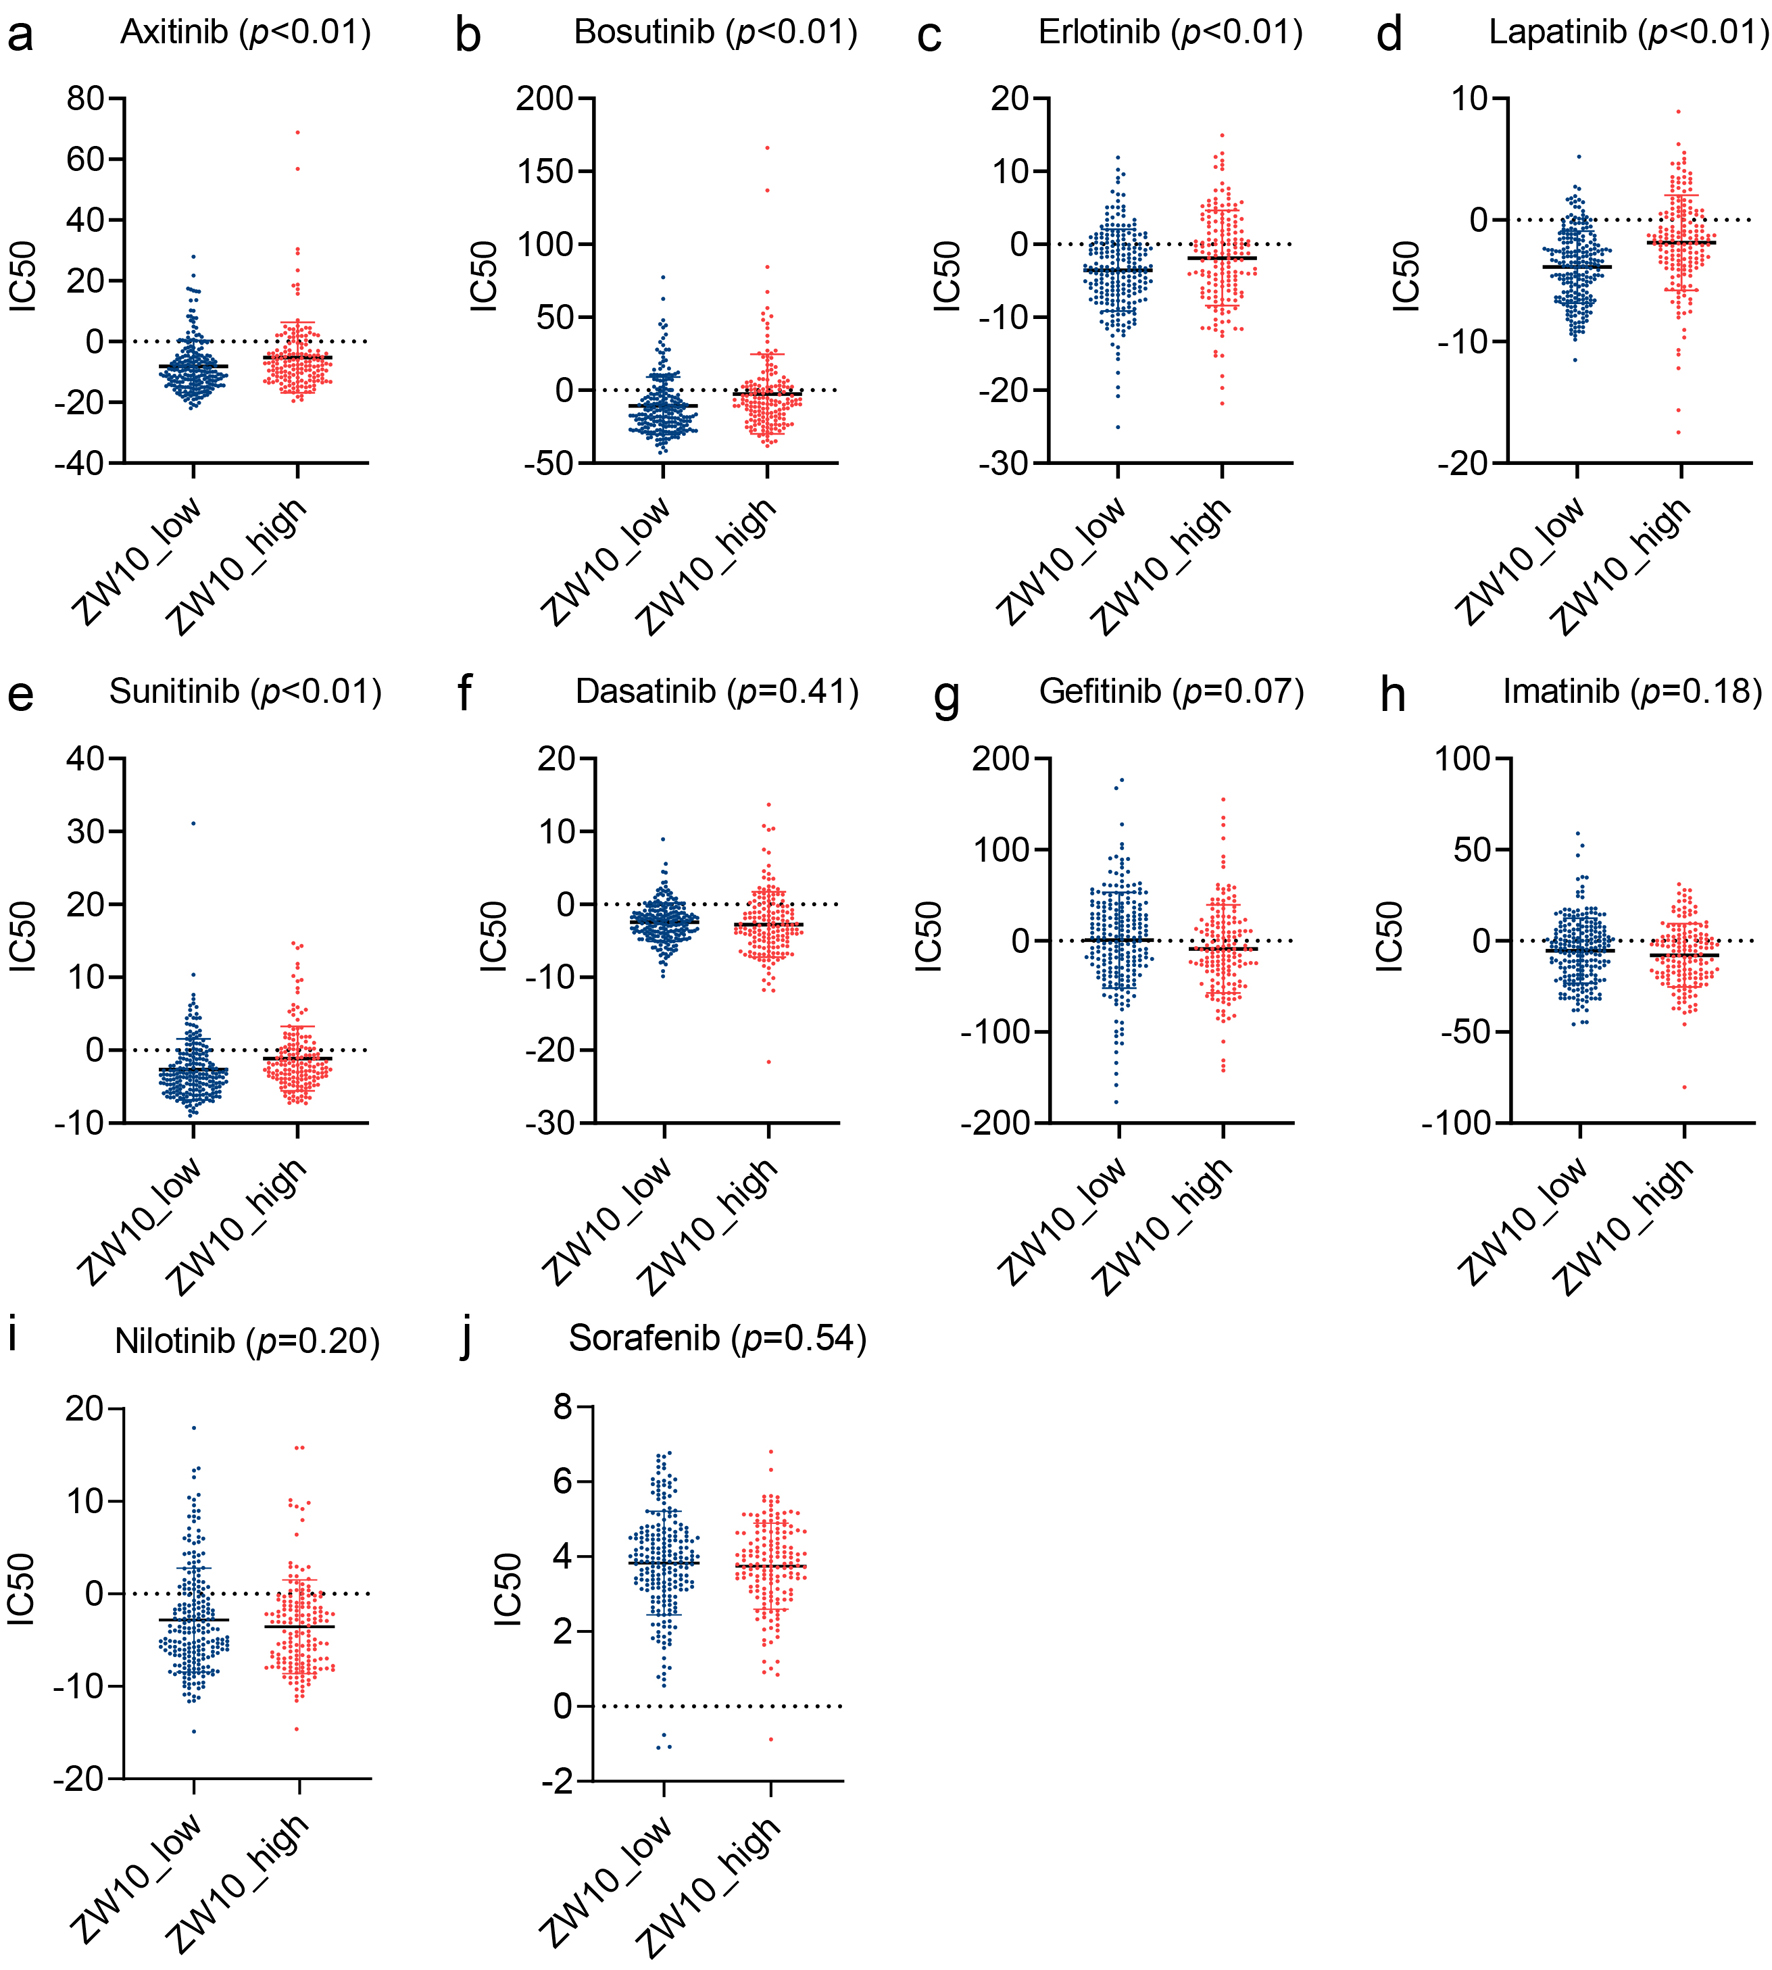
↓ Figure 8. The differences of the predicted
half-maximal inhibitory concentration of TKIs in ZW10-high expression and ZW10-low
expression groups. (a) Axitinib. (b) Bosutinib. (c) Erlotinib. (d) Lapatinib. (e) Sunitinib. (f)
Dasatinib. (g) Gefitinib. (h) Imatinib. (i) Nilotinib. (j) Sorafenib. IC50: half-maximal inhibitory
concentration; TKIs: tyrosine kinase inhibitors.
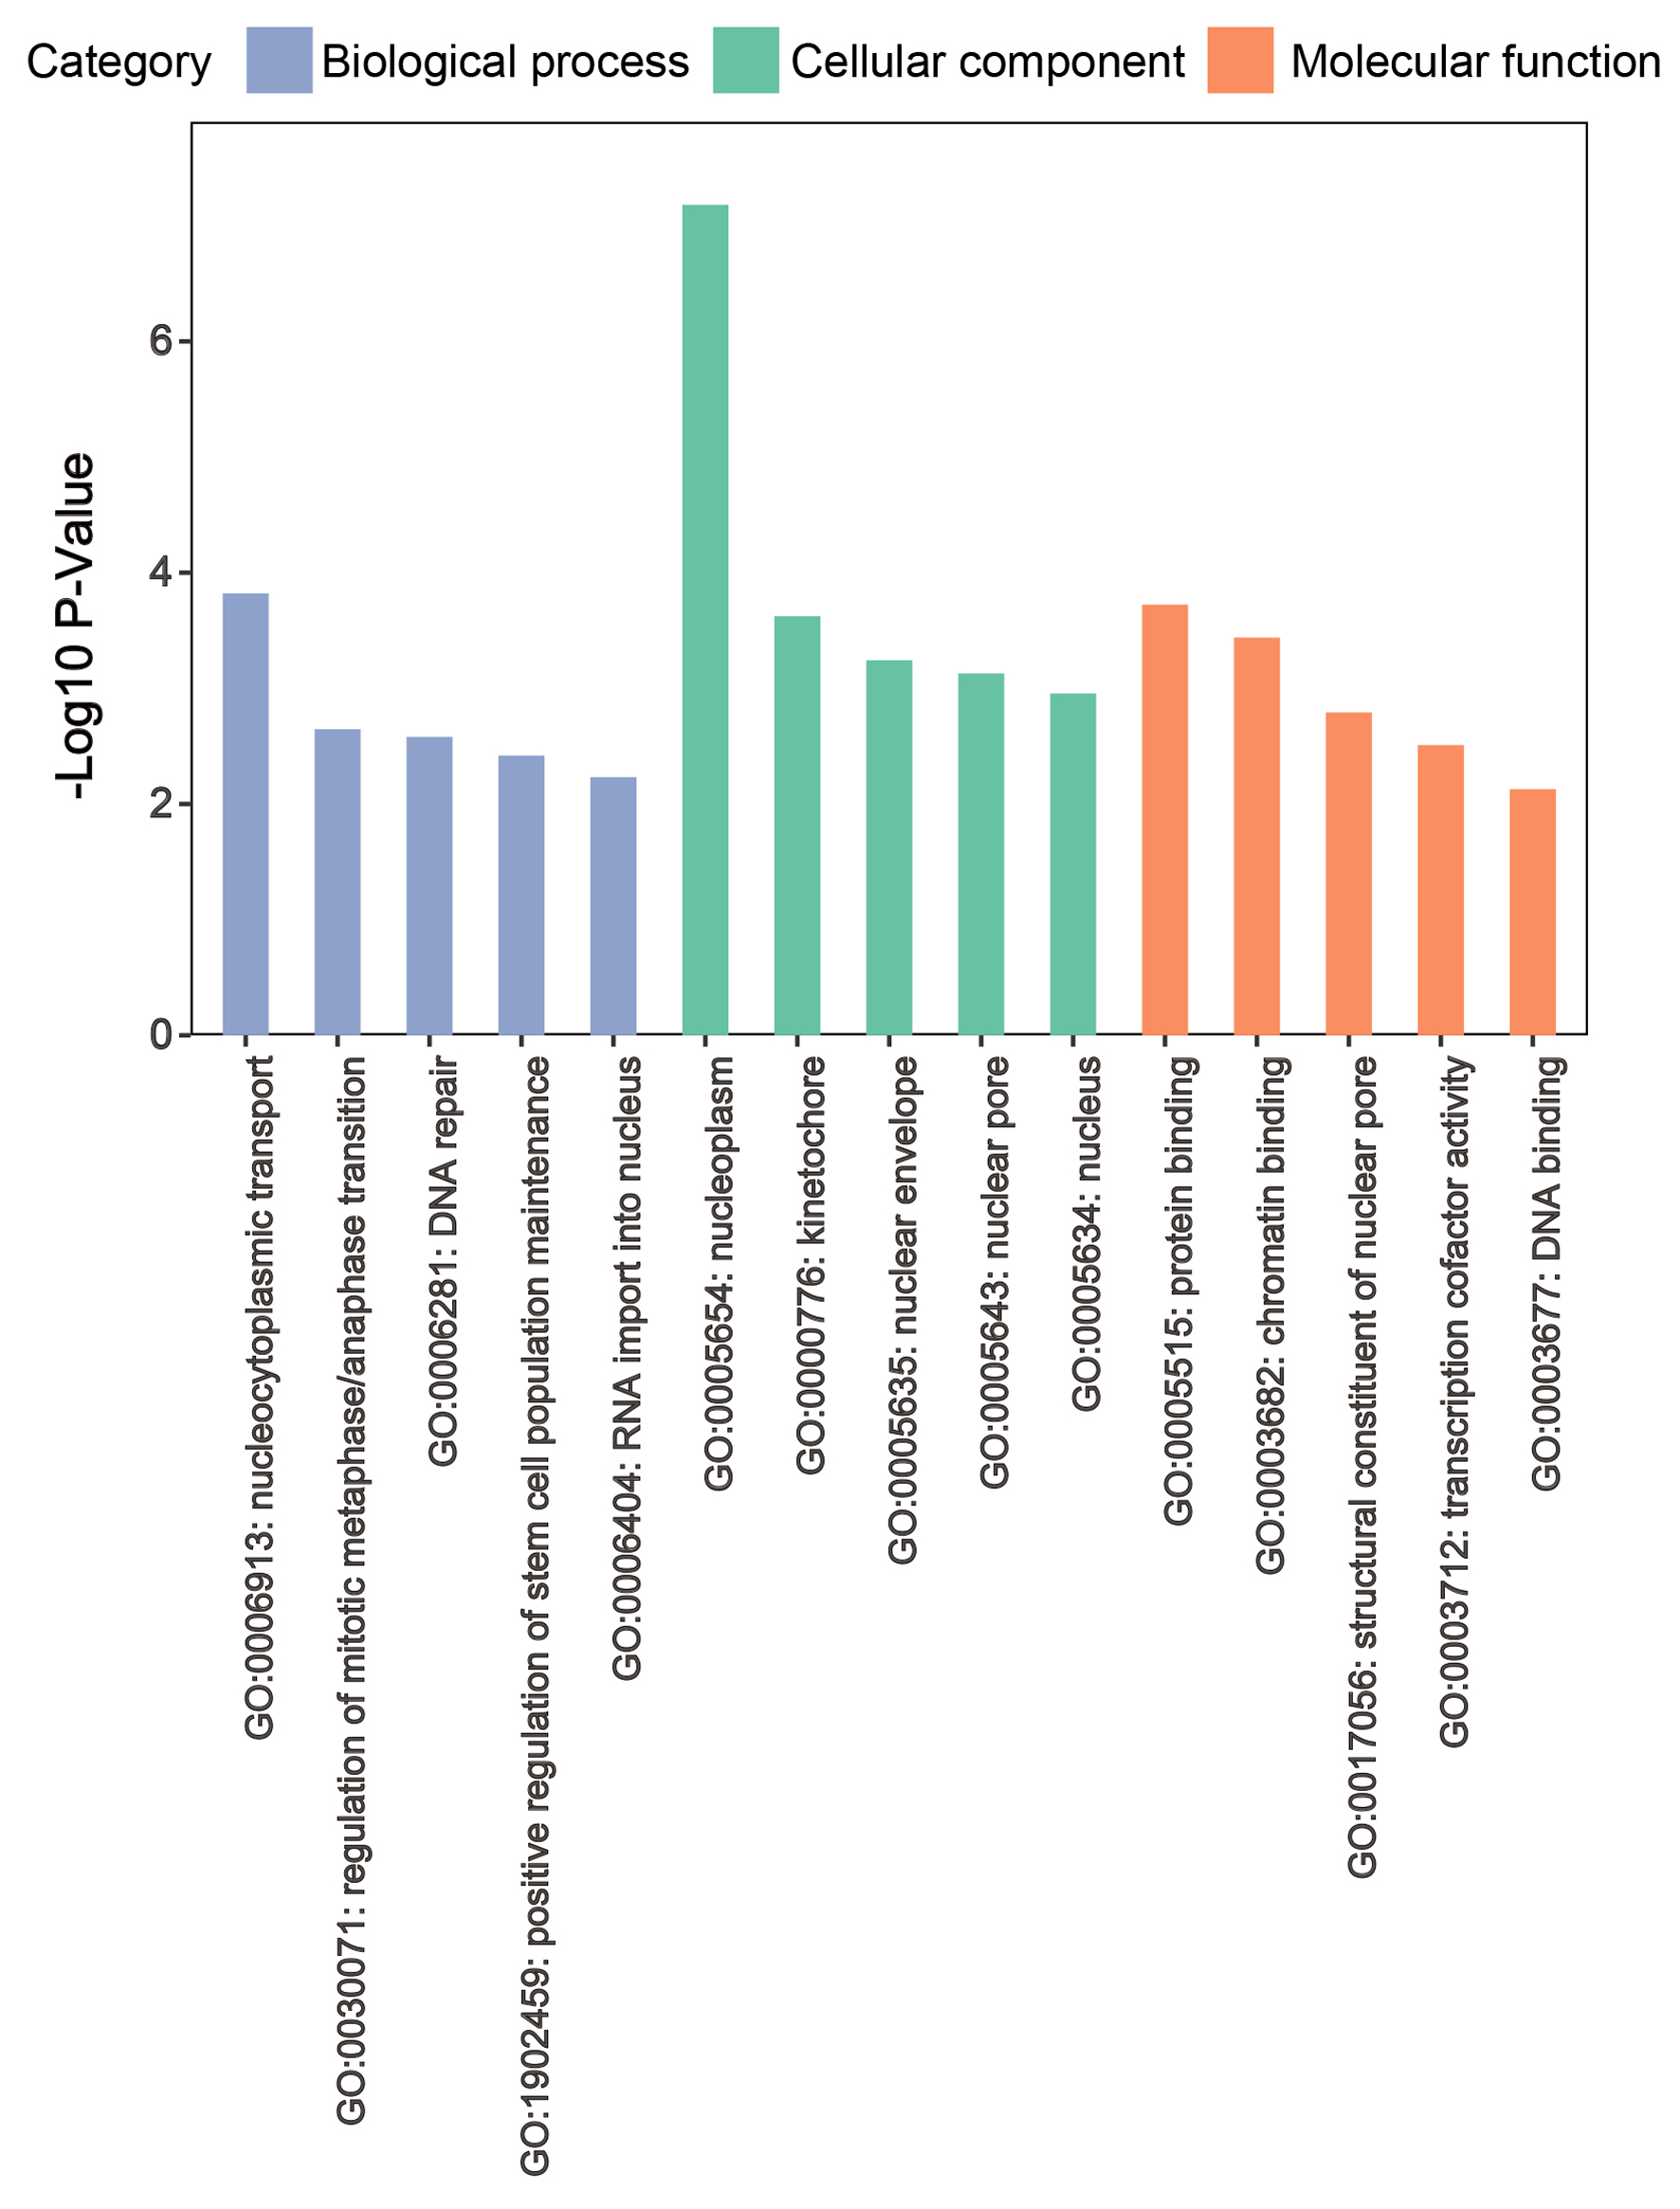
↓ Figure 9. Functional enrichment analysis for
ZW10 strongly related and differentially expressed genes.
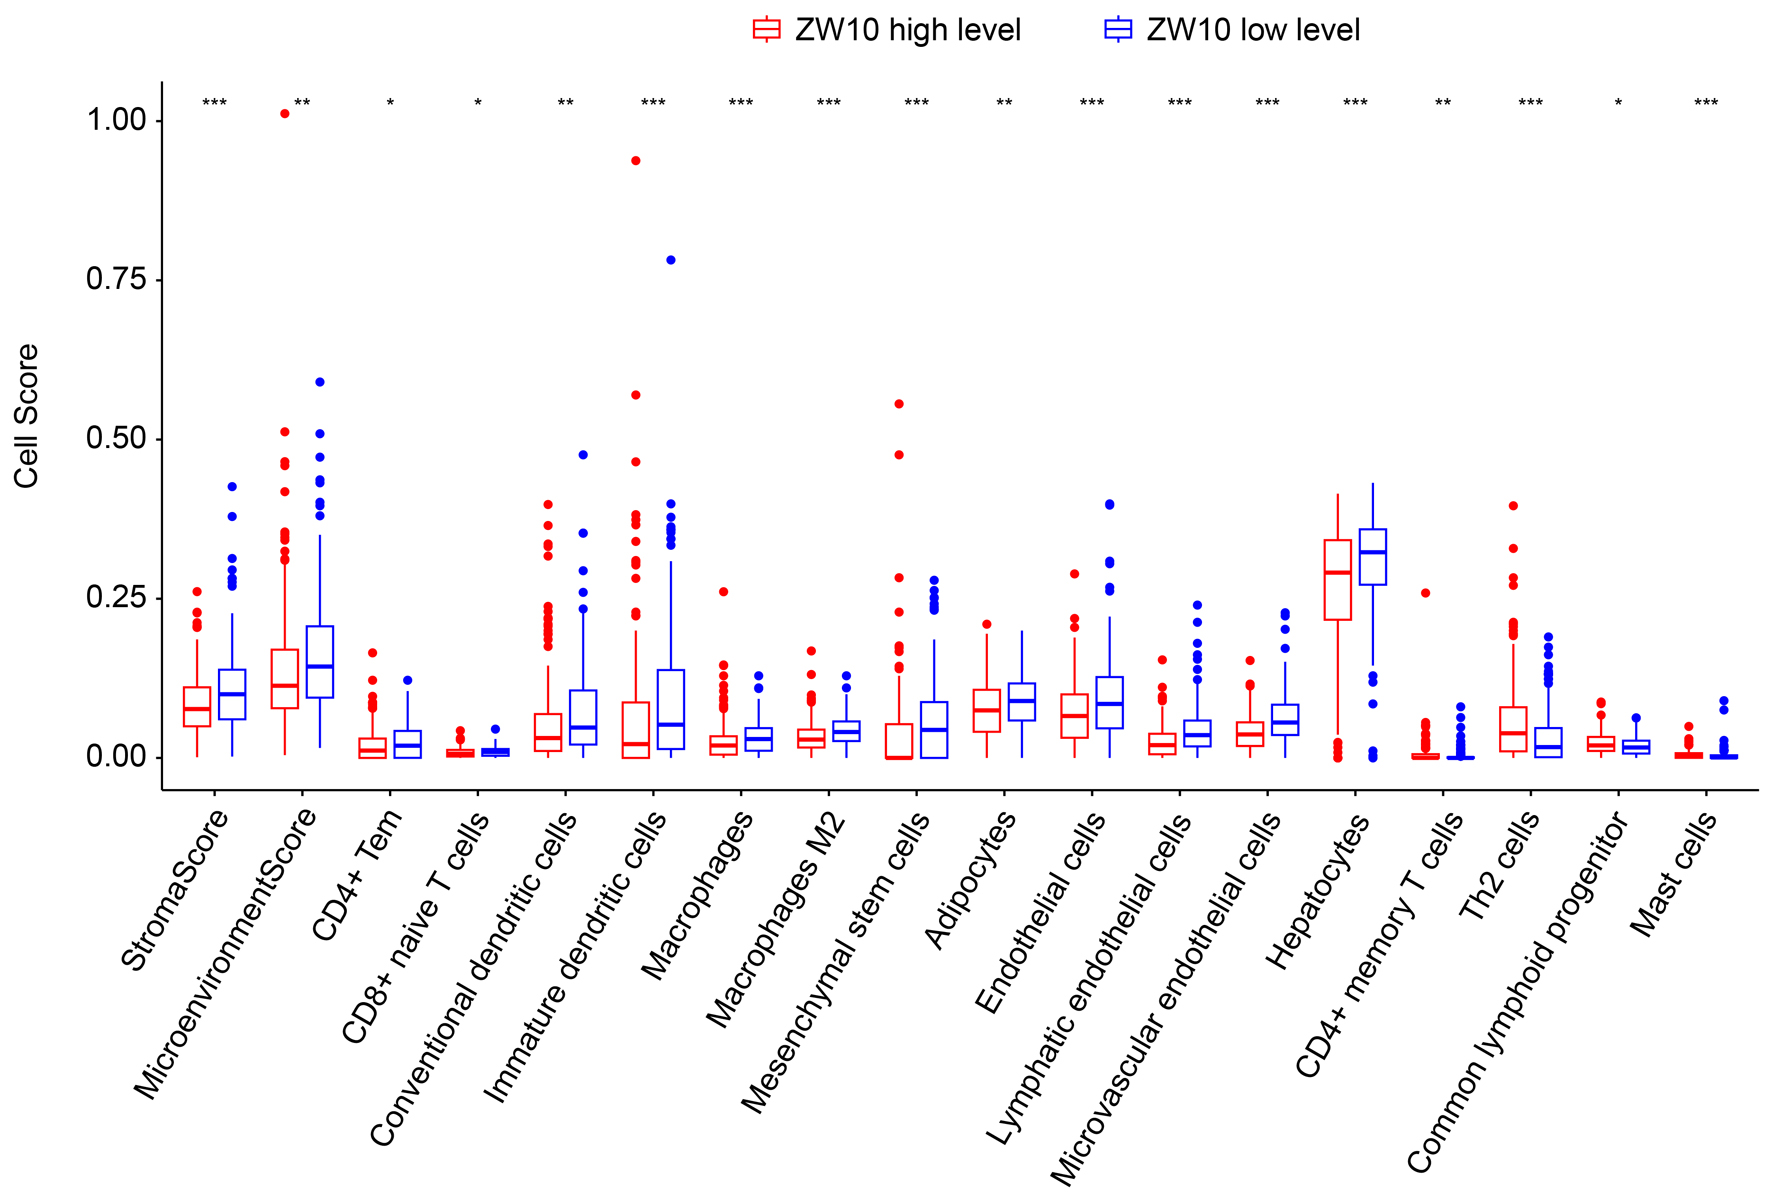
↓ Figure 10. Differential analyses between
ZW10 expression and the microenvironment characteristics. ***P < 0.001, **P < 0.01, *P <
0.05.
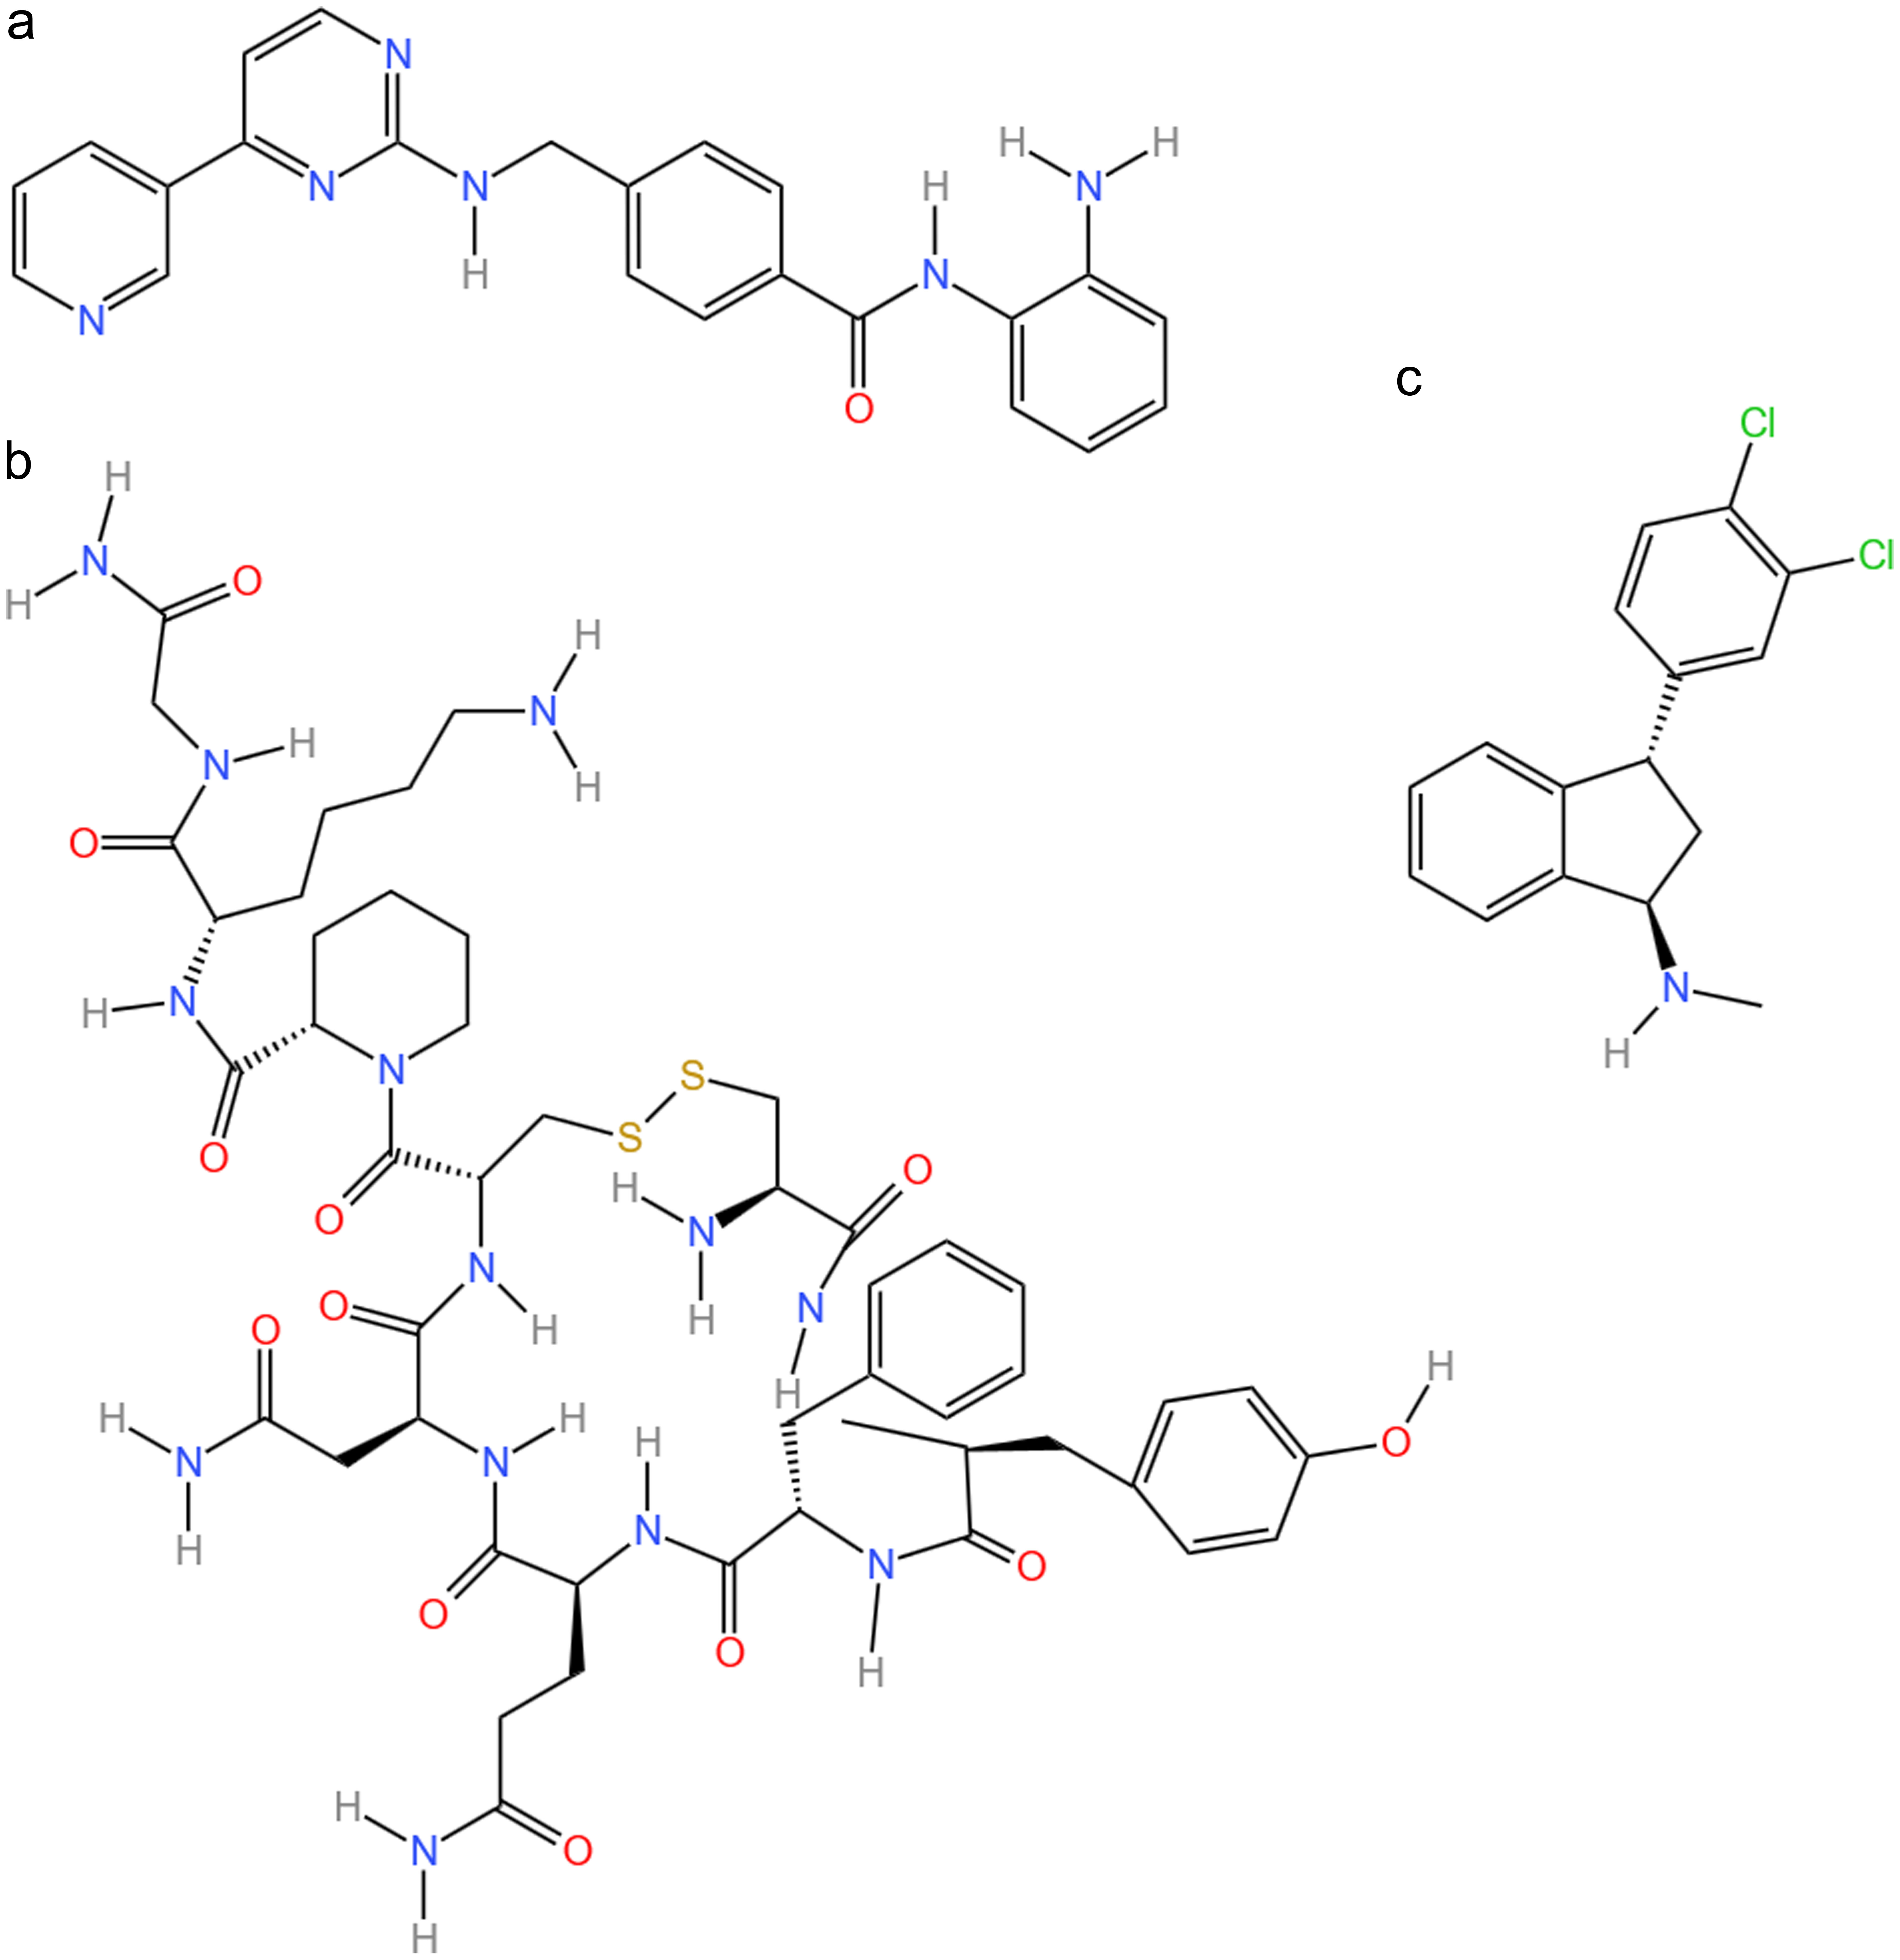
↓ Figure 11. Structure of mocetinostat (a),
lypressin (b), and indatraline (c). The structures of the three compounds were downloaded from the
PubChem database.
↓ Figure 12. Three-dimensional and
two-dimensional interaction networks of mocetinostat, capecitabine, and ZW10 protein. (a)
Mocetinostat binding to ZW10 protein. (b) Capecitabine binding to ZW10 protein.

Tables
↓ Table 1. Risk Factors Analysis for HCC Based on the TCGA-LIHC
Dataset
|
Variables |
HR
(95% CI) |
P-value |
| AJCC: American Joint Committee on Cancer; CI: confidence interval; HCC: hepatocellular
carcinoma; HR: hazard ratio. |
| ZW10 (continuous) |
1.05 (1.02 - 1.07) |
< 0.01 |
| Age (> 65 vs. ≤ 65) |
1.14 (0.78 - 1.67) |
0.49 |
| Gender (male vs. female) |
0.76 (0.52 - 1.12) |
0.17 |
| Race (Asian vs. not-Asian) |
0.81 (0.55 - 1.20) |
0.30 |
| pT (pT3 + pT4 vs. pT1 + pT2) |
2.47 (1.68 - 3.61) |
< 0.01 |
| AJCC stage (III + IV vs. I + II) |
2.45 (1.67 - 3.58) |
< 0.01 |
↓ Table 2. The Top Three Compounds Opposing ZW10 and Their Affinity
to ZW10 Protein
|
Compound |
Description |
Score |
PubChem CID |
Minimum binding energy with ZW10 |
| HDAC: histone deacetylase. |
| Mocetinostat |
HDAC inhibitor |
-99.93 |
9865515 |
-8.2 kcal/mol |
| Lypressin |
Vasopressin receptor agonist |
-99.89 |
644076 |
-7.6 kcal/mol |
| Indatraline |
Norepinephrine transporter inhibitor |
-99.89 |
126280 |
-7.0 kcal/mol |