| World Journal of Oncology, ISSN 1920-4531 print, 1920-454X online, Open Access |
| Article copyright, the authors; Journal compilation copyright, World J Oncol and Elmer Press Inc |
| Journal website https://wjon.elmerpub.com |
Original Article
Volume 17, Number 6, December 2026, pages 872-885

Perineural Invasion Is Associated With Stromal Remodeling, Angiogenesis, and Neural Features in Colorectal Cancer
Reika Matsushitaa, b, i, Kei Kawashimaa, c, d, i, Asuka Takabea, Eslam A. Elsaedya, Steven Nurkina, Mashaal Dhira, Itaru Endoc, Kazuaki Takabea, c, e, f, g, h, j
aDepartment of Surgical Oncology, Roswell Park Comprehensive Cancer Center, Buffalo, NY 14263, USA
bDepartment of General Surgery, NHO Shizuoka Medical Center, Sunto, Shizuoka 411-8611, Japan
cDepartment of Gastroenterological Surgery, Yokohama City University Graduate School of Medicine, Kanagawa 236-0004, Japan
dDepartment of Breast and Endocrine Surgery, Yokohama City University Graduate School of Medicine, Kanagawa, Japan
eDepartment of Surgery, University at Buffalo Jacobs School of Medicine and Biomedical Sciences, the State University of New York, Buffalo, NY, USA
fDivision of Digestive and General Surgery, Niigata University Graduate School of Medical and Dental Sciences, Niigata, Japan
gDepartment of Breast Surgery and Oncology, Tokyo Medical University, Tokyo, Japan
hDepartment of Breast Surgery, Fukushima Medical University, Fukushima, Japan
iThese authors contributed equally to this work.
jCorresponding Author: Kazuaki Takabe, Department of Surgical Oncology, Roswell Park Comprehensive Cancer Center, Buffalo, NY 14263, USA
Manuscript submitted September 29, 2026, accepted October 27, 2026, published online November 11, 2026
Short title: Biology of Perineural Invasion in CRC
doi: https://doi.org/10.14740/wjon2889
| Abstract | ▴Top |
Background: Perineural invasion (PNI) is known as a pathological indicator of aggressive tumor behavior and is associated with poor survival in colorectal cancer (CRC). Although individual biological features associated with PNI have been reported, the relationship between PNI and neural cell attraction and stromal features within the tumor microenvironment remains incompletely understood. We aimed to characterize the clinical, genomic, immune, stromal, vascular, and neural features associated with PNI-positive CRC.
Methods: Clinical and transcriptomic data from 179 CRC patients in The Cancer Genome Atlas (TCGA) were analyzed. PNI status was morphologically determined from pathological records, yidlding 45 PNI-positive and 134 PNI-negative cases. Gene set enrichment analysis (GSEA) using Hallmark gene sets characterized transcriptomic differences. Genomic features, immune cell composition, consensus molecular subtypes (CMS), stromal and vascular features, and neural features were compared between groups.
Results: PNI-positive CRC was associated with advanced T category, distant metastasis, advanced stage, and worse progression-free survival. There was the enrichment of proliferation-related pathways, including E2F targets, the G2M checkpoint and MYC target pathways, in PNI-positive CRC. However, genomic differences were limited, with higher homologous recombination deficiency and TP53 mutation frequency in PNI-positive CRC. PNI was not associated with broad changes in xCell immune scores but showed reduced interferon-α and interferon-γ responses. PNI-positive CRC was enriched in the mesenchymal consensus molecular subtype 4 (CMS4) and showed increased stromal fraction and extracellular matrix gene expression. Vascular features were also increased, including endothelial cells and lymphatic endothelial cells, together with enrichment of angiogenesis and increased transforming growth factor (TGF)-β-related features. Notably, PNI-positive CRC showed increased Schwann cell and neuron projection guidance scores and higher expression of axon guidance genes. These findings identified concurrent stromal, vascular, and neural features associated with PNI-positive CRC.
Conclusions: PNI-positive CRC is characterized by a coordinated mesenchymal and stromal phenotype accompanied by angiogenic and neural features, with relatively limited genomic and immune differences. These findings provide a biological framework that may help explain the aggressive clinical behavior of PNI-positive CRC.
Keywords: Colorectal cancer; Perineural invasion; Tumor microenvironment; Stromal remodeling; CMS4; Angiogenesis; Neural development
| Introduction | ▴Top |
Perineural invasion (PNI) is defined as cancer cell invasion into, around, or through nerves [1]. PNI is a common route of cancer cell spread and a marker of aggressive cancer behavior in many solid malignancies [2–4]. In colorectal cancer (CRC), PNI is an independent adverse prognostic factor [2–4] and is associated with worse overall survival (OS), disease-free survival, cancer-specific survival, local recurrence, and distant metastasis [4–6]. PNI is associated with an increased risk of recurrence [4] and is recognized as a high-risk pathological feature, which is considered in postoperative risk assessment and adjuvant treatment decisions [7]. Despite its clinical significance, the biological features associated with PNI in CRC remain incompletely understood.
There has been a rapid increase in the number of reports on the role of nerves within the tumor microenvironment in promoting cancer growth, invasion and progression [8–11]. Cancer cells can also recruit neural projections through neurotrophic factors [12] and axon-guidance molecules [13, 14]. Our group recently found that a neuron projection guidance (NPG) signature is associated with immune-cold tumor microenvironment and poor outcomes in breast cancer [15]. These findings raise the question of whether PNI reflects cancer cell invasion along nerves alone or is also associated with neural recruitment toward the cancer.
Recent studies have linked PNI in CRC to stromal features, including extracellular matrix remodeling mediated by cancer-associated fibroblast [16, 17]. CMS4, the mesenchymal subtype of CRC, is also characterized by prominent stromal features, including a higher tumor-stroma ratio [16]. Studies in other cancers have associated PNI with increased cancer cell proliferation [18, 19], whereas genomic and immune features associated with PNI in CRC have only recently begun to be characterized [10, 20, 21]. The detailed combinations of these biological features have not been characterized together in PNI-positive CRC.
We sought to investigate the clinical and biological features associated with morphologically determined PNI in patients with CRC in The Cancer Genome Atlas (TCGA) cohort. We aimed to identify the biological features associated with PNI in CRC through comprehensive transcriptomic, genomic, and tumor microenvironmental analyses. We hypothesized that PNI would be associated with stromal remodeling and neural projection guidance. We integrated clinicopathologic data with transcriptomic profiling and gene set enrichment analysis (GSEA) [22] to comprehensively characterize the biological features associated with PNI in CRC.
| Materials and Methods | ▴Top |
Data acquisition
Clinicopathological and gene expression data were obtained from TCGA CRC cohort through cBioportal and UCSC Xena. Among 594 TCGA CRC cases with both clinical and RNA sequencing data available, PNI status was available for 179 cases. A total of 174 cases were obtained from clinical data through UCSC Xena, and the remaining five cases were from pathological text reports converted into text format by Kefeli et al [23] (Fig. 1). The data were searched for the terms “perineural invasion” and “PNI” and were classified as PNI-positive or PNI-negative when the descriptions explicitly indicated the presence or absence of PNI, respectively. Ambiguous descriptions were manually reviewed, and cases without a clear description of PNI status were classified as unavailable rather than automatically considered PNI-negative. The final analytical cohort consisted of 45 PNI-positive and 134 PNI-negative cases and was integrated with TCGA clinical and transcriptomic data for analysis. Figure 1 is a flow diagram showing how the 179 cases with available PNI data were selected from the TCGA cohort. Because TCGA is a publicly available, deidentified database, this study was exempt from Institutional Review Board review. The declaration of ethical compliance with human study was not applicable.
 Click for large image | Figure 1. Patient selection and identification of perineural invasion (PNI) status in the TCGA colorectal cancer cohort. Among 594 patients with both clinical and RNA-sequencing data, PNI status was available for 179 patients. PNI status was obtained from clinical data available through UCSC Xena for 174 patients and from pathological reports for the remaining five patients. CRC: colorectal cancer; TCGA: The Cancer Genome Atlas. |
Cell composition, cytolytic activity (CYT) score, and immune-related scores
To estimate the infiltration levels of immune cell populations within the tumor microenvironment, we applied the xCell algorithm [24] as we have previously reported [25, 26]. The CYT score was calculated using granzyme A (GZMA) and PRF1 expression as previously described by Rooney et al [27] and as we have previously reported [26, 28]. For the assessment of tumor immunogenicity and proliferative activity in the TCGA cohort, we used the precomputed scores reported by Thorsson et al [29].
GSEA
Functional enrichment analysis was performed using GSEA based on differentially expressed genes (DEGs), with the Hallmark gene set collection from the Molecular Signatures Database (MSigDB) [30]. Statistical significance was defined as a false discovery rate (FDR) < 0.25, and enrichment strength was evaluated using the normalized enrichment score (NES). A positive NES indicates enrichment in PNI-positive CRCs, whereas a negative NES indicates enrichment in PNI-negative CRCs. Also, additional gene expressions and GSEA analyses were performed using pathological stage as a covariate to account for differences in tumor stage between groups.
Statistical analysis
All statistical analyses and data visualization were performed using R software. Continuous variables were compared between two independent groups using the Mann–Whitney U test, while categorical variables were compared using Fisher’s exact test. The Kruskal–Wallis test was used for comparisons of continuous variables among three or more independent groups, where applicable. To account for potential confounding by stage, stage-adjusted linear regression analyses were performed for gene expression and pathway, immune, stromal, vascular, and neural-related scores. For the stage-adjusted analyses, multiple comparisons were corrected using the Benjamini–Hochberg procedure to control the FDR. Continuous variables were standardized to Z-scores, and associations with PNI were reported as standardized β coefficients, 95% confidence intervals (CIs), and P values. Multivariable Cox regression analyses were performed for OS and progression-free survival (PFS), adjusting for age and pathological stage. Hazard ratios (HRs), 95% CIs, and P values were reported. A two-sided P value < 0.05 was considered statistically significant.
| Results | ▴Top |
PNI was associated with CRC progression and worse survival
PNI is recognized as an adverse prognostic feature in CRC [2, 3]. Therefore, we first investigated clinicopathological factors and survival outcomes by morphologically determined PNI in TCGA CRC cohort to examine whether this cohort shows similar phenotype. Baseline clinical and pathological characteristics of the overall TCGA CRC cohort and the subset of patients with available PNI status are summarized in Table 1. Patient IDs and corresponding PNI status are provided (Supplementary Material 1, wjon.elmerpub.com). The proportion of PNI positivity was roughly correlated with T categories, with T4 being the highest (P < 0.05) (Fig. 2a). Similarly, in the M-category, PNI positivity was significantly higher in M1 (P < 0.05). PNI positivity was also significantly correlated with stage, with stage 4 being the highest (P < 0.05). There was no statistical significance in N-category, although PNI positivity was higher in N1 than N0 (P = 0.17). PNI-positive CRC was associated with significantly worse PFS (P < 0.05) (Fig. 2b), whereas OS did not reach statistical significance (HR, 2.00; 95% CI, 0.99–4.05; P = 0.05) which may be due to the limited sample size. To assess whether the association between PNI and survival rate was independent of stage and age, we performed a multivariable Cox proportional hazards regression analysis. After adjustment for age and stage, PNI positivity was not significantly associated with PFS (HR, 1.59; 95% CI, 0.83–3.04; P = 0.165). In contrast, stage was independently associated with PFS (HR, 2.21; 95% CI, 1.53–3.18; P < 0.001) (Supplementary Material 2, wjon.elmerpub.com).
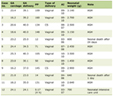 Click to view | Table 1. Clinicopathological Characteristics of the Overall TCGA CRC Cohort |
 Click for large image | Figure 2. PNI association with disease progression and survival. (a) Bar plots showing the percentages of PNI-positive cases across T-category, N-category, M-category, and stage in the TCGA cohort. (b) Kaplan–Meier survival curves for progression-free survival (PFS) and overall survival (OS) comparing PNI-positive (Pos) and PNI-negative (Neg) patients from the TCGA. Blue line represents the PNI-negative and the red line represents the PNI-positive patients. Hazard ratios (HRs) with 95% confidence intervals (CIs) and log-rank test P values are displayed. Below each plot are the numbers at risk. PNI: perineural invasion; TCGA: The Cancer Genome Atlas. |
PNI-positive CRC exhibited minor genomic alterations and cell proliferation
To investigate potential mechanisms underlying the worse prognosis of PNI-positive CRC, we compared genomic instability-related indices and mutation frequencies between PNI-positive and PNI-negative patients (Fig. 3a). Surprisingly, only homologous recombination deficiency (HRD) was significantly higher in PNI-positive patients (P < 0.05) (Fig. 3a) and no other genomic alterations including tumor mutational burden (TMB), intratumor heterogeneity, altered fraction, non-silent mutation rate, silent mutation rate, SNV-derived neoantigens, indel-derived neoantigens (Fig. 3a), microsatellite instability (MSI) (Fig. 3b), or KRAS and BRAF mutation frequencies (Fig. 3c), showed any differences. TP53 mutations alone were significantly more frequent in PNI-positive CRC (P < 0.05) (Fig. 3c). These findings suggest that PNI-positive CRC is characterized by limited genomic alterations rather than widespread genomic instability.
 Click for large image | Figure 3. PNI association with genomic features and cell proliferation. (a) Box plots showing TMB, intratumor heterogeneity, altered fraction, homologous recombination deficiency (HRD), non-silent and silent mutation burdens, and neoantigen load (SNV- and indel-derived) comparing PNI-negative and PNI-positive CRCs. (b) Bar plot comparing the proportion of MSI-high tumors between PNI-negative and PNI-positive cases. (c) Bar plots comparing the mutation frequencies of TP53, BRAF, and KRAS between PNI-negative and PNI-positive CRCs. (d) GSEA enrichment plots for proliferation-related pathways (E2F targets, G2M checkpoint, mitotic spindle, MYC targets v1/v2). NES and FDR are shown for each pathway. (e) Box plots showing expression levels of MKI67, PCNA, TOP2A, and MCM2 in PNI-negative and PNI-positive CRCs. CRC: colorectal cancer; FDR: false discovery rate; NES: normalized enrichment score; PNI: perineural invasion; TMB: tumor mutational burden; GSEA: gene set enrichment analysis; MSI: microsatellite instability. |
Given previous reports that PNI is associated with increased cancer cell proliferation [18, 19], proliferative activity was assessed using GSEA and cell proliferation markers. Most Hallmark cell-proliferation-related gene sets, E2F targets, G2M checkpoint and MYC targets v1/v2, showed significant enrichment in PNI-positive cancers (FDR < 0.25) (Fig. 3d). However, PNI-positive CRC was not associated with an increased proliferation scores or increased expression of MKI67, PCNA or TOP2A (Fig. 3e). We further investigated whether the associations between PNI and proliferation-related features were independent of tumor stage. After adjustment for tumor stage, most proliferation-related features, except for mitotic spindle, MKI67, and TOP2A, showed negative associations with PNI, although most associations did not reach statistical significance (Table 2; Supplementary Material 3, wjon.elmerpub.com).
Click to view | Table 2. Stage-Adjusted Associations of Pathways and Genes in PNI-Positive Versus PNI-Negative CRC |
PNI was associated with lower interferon-α and interferon-γ responses but showed no differences in xCell scores
Given that immune suppression is one of the key factors that promote CRC progression [31], we investigated whether PNI is associated with fewer immune cells inferred by xCell scores. We compared immune cell composition and immune-related pathway activity between PNI-positive and PNI-negative CRCs (Fig. 4). Among the immune cell populations examined, M1 macrophage infiltration was significantly higher in PNI-positive cancers (P < 0.05), and no other cells including B cells (P = 0.47), CD4+ T cells (P = 0.06), CD8+ T cells (P = 0.56), regulatory T cells (P = 0.91), Th1 cells (P = 0.09), Th2 cells (P = 0.42), natural killer (NK) cells (P = 0.54), dendritic cells (P = 0.27), M2 macrophages (P = 0.76), showed any difference in infiltration by PNI (Fig. 4a). Further, there was no suppression in the immune score (P = 0.92), and CYT score (P = 0.95) by PNI (Fig. 4b).
 Click for large image | Figure 4. Association of PNI with immune-related activities and cell composition. (a) Box plots showing xCell-derived deconvolution scores for B cells, CD4+ T cells, CD8+ T cells, Tregs, Th1/Th2 cells, NK cells, dendritic cells (DCs), and macrophages (M1/M2) in PNI-negative and PNI-positive CRCs. (b) Box plots showing immune score and CYT score in PNI-negative and PNI-positive CRCs. (c) GSEA enrichment plots for immune-related pathways (allograft rejection, inflammatory response, interferon-α response, interferon-γ response, IL-2, and IL-6). NES and FDR are shown for each pathway. A positive normalized enrichment score (NES) indicates enrichment in the PNI-positive group, whereas a negative NES indicates enrichment in the PNI-negative group. CRC: colorectal cancer; FDR: false discovery rate; PNI: perineural invasion; CYT: cytolytic activity; GSEA: gene set enrichment analysis; IL: interleukin; NK: natural killer. |
On the other hand, immune activation-related pathways such as allograft rejection, interferon-α, and interferon-γ responses, were significantly less enriched in PNI-positive cancers, whereas inflammatory response, interleukin (IL)-2 signaling, and IL-6 signaling pathways showed little difference between the two groups (Fig. 4c). Taken together, these findings suggest that although PNI-positive CRCs exhibit selective suppression of some immune-related pathways, it is not associated with xCell scores. After adjustment for tumor stage, several immune-related signatures remained positively associated with PNI, including IL-2 signaling, IL-6 signaling, inflammatory response, and interferon-γ responses. Associations with allograft rejection and interferon-α response did not reach statistical significance (Table 2; Supplementary Material 4, wjon.elmerpub.com).
PNI-positive CRC was enriched in mesenchymal CMS4 features
To understand the tumor microenvironment associated with PNI better, we investigated the consensus molecular subtypes (CMS) by PNI status (Fig 5a). Among the subtypes, PNI-positive CRC was significantly more frequent in CMS4 (48.8% vs. 25.4%, P < 0.05) and was significantly less frequent in CMS3 (9.3% vs. 23.7%, P < 0.05), compared with PNI-negative cancers. No significant differences were observed in the proportions of CMS1 (P = 1.00) or CMS2 (P = 0.32) by PNI.
 Click for large image | Figure 5. PNI association with CMS4 and stromal features. (a) Bar plots showing CMS1, CMS2, CMS3, and CMS4 displaying the percentages of PNI-negative and PNI-positive cases. (b) Gene set enrichment analysis (GSEA) enrichment plots for the epithelial-mesenchymal transition pathway. Normalized enrichment score (NES) and false discovery rate (FDR) are shown in the plot. (c) Box plots showing xCell-derived deconvolution scores for fibroblasts and stromal fraction according to PNI status. (d) Box plots showing expression levels of COL1A1, FN1, and POSTN according to PNI status. P values were calculated using the Wilcoxon rank-sum test and error bars indicate the 95% confidence intervals; center lines in boxes indicate the median, and box limits indicate the 25th and 75th percentiles. CMS4: consensus molecular subtype 4; PNI: perineural invasion. |
Because CMS4 represents the mesenchymal subtype of CRC [32, 33], we next investigated mesenchymal and stromal features by PNI. GSEA demonstrated significant enrichment of Hallmark epithelial-mesenchymal transition (EMT) pathway in PNI-positive cancers (FDR < 0.001) (Fig. 5b). Consistent with this finding, stromal fraction was significantly higher in PNI-positive cancers (P < 0.05), although fibroblast scores were comparable between the two groups (P = 0.76) (Fig. 5c). Furthermore, extracellular matrix-related genes, including COL1A1, FN1, and POSTN, were significantly upregulated in PNI-positive cancers (all P < 0.05) (Fig. 5d). These findings suggest that PNI-positive CRC preferentially exhibits mesenchymal CMS4 features characterized by stromal remodeling and extracellular matrix activation. Also, the associations between PNI and EMT pathway and relevant gene expressions remained positive with statistical significance in additional analysis adjusted for tumor stage (Table 2; Supplementary Material 5, wjon.elmerpub.com).
PNI was associated with angiogenesis and transforming growth factor (TGF)-β-related features
Since nerves and blood vessels share developmental pathways that contribute to neural and vascular networks within the tumor microenvironment [34], and TGF-β signaling is a major driver of the mesenchymal features in cancer [35, 36], we next investigated vascular cell populations, TGF-β-related features, and pathway activity according to PNI status (Fig. 6). Lymphovascular invasion (LVI) was significantly more frequent in PNI-positive cancers than in PNI-negative cancers (Fig. 6a). Consistent with this finding, endothelial cells, lymphatic endothelial cells, and pericyte scores were significantly higher in PNI-positive cancers (all P < 0.05) (Fig. 6b). Furthermore, both the TGF-β score and TGF-β response score were significantly higher in PNI-positive cancers (both P < 0.05) (Fig. 6c), and the expressions of TGF-β1, TGF-β2, and TGF-β3 were significantly increased in PNI-positive cancers, whereas SMAD4 expression did not differ between the two groups (Fig. 6d). GSEA also suggested enrichment of the angiogenesis pathway in PNI-positive cancers (FDR = 0.24), whereas lymphangiogenesis and TGF-β signaling pathways were not significantly enriched (Fig. 6e). The associations between PNI and angiogenesis and TGF-β pathways and relevant gene expressions remained positive with statistical significance in additional analysis adjusted for tumor stage (Table 2; Supplementary Material 6, wjon.elmerpub.com).
 Click for large image | Figure 6. PNI association with angiogenesis and lymphangiogenesis. (a) Bar plot comparing the proportion of PNI-positive cases among LVI-negative and LVI-positive cases. (b) Box plots showing xCell-derived scores of stromal cell populations, including endothelial cell, ly/mv endothelial cells, and pericytes, according to PNI status. (c) Box plot showing TGF-β signaling scores according to PNI status. (d) Box plots showing expression levels of TGFB1 and SMAD4 according to PNI status. (e) GSEA enrichment plots of angiogenesis, lymphangiogenesis, and TGF-β signaling pathways. NES and FDR are shown for each pathway. FDR: false discovery rate; GSEA: gene set enrichment analysis; LVI: Lymphovascular invasion; NES: normalized enrichment score; PNI: perineural invasion; TGF: transforming growth factor; ly/mv: lymphovascular/microvascular. |
PNI positive CRC was associated with abundant nerve fibers and with signals that attract neural projection
Because PNI involves interactions between cancer cells and peripheral nerves [37], we investigated whether PNI reflects cancer cell invasion around nerves alone or whether cancer cells are associated with neural projection toward the tumor microenvironment. To this end, we compared neuron-related scores and the expression of representative genes related to axon guidance according to PNI status (Fig. 7). PNI-positive cancers had significantly higher Schwann cell scores, which may reflect the presence of nerve fibers, and higher NPG score [15], which reflects the expression of genes involved in nerve growth and guidance, than PNI-negative cancers (both P < 0.05) (Fig. 7a). The genes used to calculate these scores are listed (Supplementary Material 7, 8, wjon.elmerpub.com), respectively. Consistent with these findings, the expression of genes related to neural guidance and remodeling [38, 39], including NRP1, NRP2, ROBO1, and SLIT2, were significantly higher in PNI-positive cancers (all P < 0.05) (Fig. 7b). Those associations remained positive with statistical significance in the analysis adjusted for tumor stage (Table 2; Supplementary Material 9, wjon.elmerpub.com).
 Click for large image | Figure 7. Association of PNI with neural-related features. (a) Box plots showing xCell-derived neuron score and signature-based Schwann cell and neuron projection guidance scores according to PNI status. (b) Box plots showing expression levels of axon guidance-related genes, including NRP1, NRP2, ROBO1, and SLIT2 according to PNI status. PNI: perineural invasion. |
| Discussion | ▴Top |
PNI is a well-known histopathologic feature of CRC and is associated with aggressive tumor behavior and adverse clinical outcomes [2, 3]. Despite its clinical importance, the biological differences between PNI-positive and PNI-negative CRC remain incompletely characterized. In this study, we performed an integrated transcriptomic and genomic analysis using the TCGA cohort to characterize the biological features associated with PNI-positive CRC. PNI was associated with CRC progression and worse survival, with the association remaining significant after adjusted for stage. PNI-positive CRC exhibited limited genomic differences compared to PNI-negative CRC. There was no increase in proliferation markers in the PNI-positive group despite the enrichment of proliferation-related pathways, suggesting that differences between PNI-positive and PNI-negative CRC were observed at the pathway level but were not reflected in the expression of individual markers. PNI was not associated with few immune cells inferred by xCell scores, but with lower interferon-α and interferon-γ response. PNI-positive CRC was enriched in the mesenchymal CMS4 subtype and showed stromal remodeling, angiogenic features, and TGF-β-related features. We found that PNI-positive CRC also showed increased Schwann cell and NPG scores, as well as higher expression of axon guidance-related genes.
One notable finding was that nearly half of PNI-positive CRCs were classified as the mesenchymal CMS4 subtype. This observation was supported by concordant transcriptomic and stromal features, including Hallmark EMT enrichment, increased stromal fraction, and extracellular matrix gene expression. Interestingly fibroblast was not significantly infiltrated in the PNI-positive tumors, however, this may suggest the fact that the biological features of mesenchymal subtype may not be a simple reflection of fibroblast infiltration. PNI-positive CRCs also showed angiogenic features. CMS4 is the mesenchymal subtype of CRC [32] and is characterized by stromal features [40], TGF-β activation, and poor prognosis [32, 33, 41]. Several components of CMS4 biology, including cancer-associated fibroblasts, extracellular matrix remodeling, and TGF-β signaling, have also been associated with PNI [18]. Although Hallmark EMT was enriched in PNI-positive CRC, EMT enrichment in bulk transcriptomic data may partly reflect increased stromal contribution rather than EMT in cancer cells alone. Although SMAD4 expression did not differ between the two groups, this finding does not necessarily contradict the enrichment of TGF-β-related features, as SMAD4 expression alone does not fully capture pathway activity. The observed TGF-β-related features may also reflect contributions from stromal and other cellular compartments in the tumor microenvironment. Our findings showed that these mesenchymal and stromal features occurred together with angiogenic and neural developmental programs. Thus, these findings may represent a coordinated transcriptomic phenotype associated with PNI.
Alterations in immune cell infiltration are often observed in aggressive cancers [26, 28]. However, the relevant xCell scores were not altered in PNI-positive CRC. Only M1 macrophages differed significantly between groups, whereas most immune cell populations and immune scores were comparable. This isolated difference should be interpreted cautiously, particularly given the lack of adjustment for multiple comparisons. Allograft rejection, interferon-α response and interferon-γ response were less enriched in PNI-positive CRC despite no changes in immune cell abundance. Previous experimental work has suggested that neural-associated molecules may also influence the tumor immune microenvironment. In pancreatic cancer, Minegishi et al reported that CRMP4 promoted tumor growth in mice and was associated with increased M2 macrophages and myeloid-derived suppressor cells [42]. In our study, however, PNI-positive CRC did not show broad changes in xCell scores. These findings suggest that PNI-positive CRC may involve changes in immune activity rather than broad remodeling of the immune microenvironment. However, localized immune alterations associated with PNI cannot be determined from bulk transcriptomic data. Furthermore, because multiple comparisons across immune cell populations and signatures were not adjusted for multiple testing, these findings should be interpreted cautiously. Future studies using spatial transcriptomics or single-cell sequencing, with appropriate correction for multiple comparisons, may better define immune changes surrounding nerves.
Previous experimental studies have shown that Schwann cells can promote cancer cell migration and invasion toward nerves [9]. Similar effects have also been reported in CRC [11]. Cancer cells may also induce neural growth and remodeling, while neural signaling can further promote cancer progression [37]. These findings suggest reciprocal interactions between cancer cells and nerves. However, whether these neural processes are associated with PNI in CRC and how they relate to other features of the tumor microenvironment remain unclear. In our study, PNI-positive CRC showed increased Schwann cell and NPG score, together with higher expression of NRP1, NRP2, ROBO1, and SLIT2. While NPG score is exploratory in CRC, those findings suggest that PNI-positive CRCs are associated with neural guidance-related activities. Of note, these findings are derived from bulk transcriptomic analyses and do not directly demonstrate active nerve recruitment or a causal mechanism, thus we expect our results to be hypothesis-generating.
As another limitation, we were unable to validate nor perform sensitivity analysis of ascertainment of PNI since we did not have access to the pathology slides of the TCGA patients. Furthermore, the PNI information available for this study did not distinguish intramural from extramural PNI [43, 44]; however, this distinction could provide further insight into the biological heterogeneity of PNI in CRC [43, 44]. Future studies incorporating detailed pathological annotations of PNI location may help identify distinct transcriptomic features associated with this difference.
In addition to these neural features, PNI-positive CRC showed more frequent LVI. Previous clinical studies have similarly shown that PNI and LVI are associated with advanced CRC and lymph node involvement, supporting a relationship between these two invasive phenotypes [45, 46]. In a transcriptomic study of pancreatic ductal adenocarcinoma, LVI-positive cancers were also more frequently associated with PNI and showed enrichment of several pathways related to aggressive tumor behavior [46]. In our study, PNI-positive CRC also showed increased endothelial cells, lymphatic endothelial cells, and pericyte scores, as well as enrichment of angiogenesis. These findings suggest that vascular features are part of the biological phenotype associated with PNI. Together, these findings suggest that PNI-positive CRC shows changes involving both neural and vascular components of the tumor microenvironment.
These neural and vascular features occurred together with CMS4 enrichment and stromal remodeling, whereas broad immune remodeling and genomic alterations were limited. Our findings therefore show that PNI-positive CRC is associated with a broader biological pattern involving neural, stromal, mesenchymal, and angiogenic features. This integrated characterization provides a biological framework for understanding the aggressive behavior of PNI-positive CRC. Although we cannot establish causal relationships from the present study, interactions among cancer cells, nerves, and vascular components may contribute to PNI and cancer progression. Further studies are warranted to determine how these stromal, vascular, and neural features interact and contribute to PNI and cancer progression.
Stage-adjusted analyses provided further insight into the biological features associated with PNI. Proliferation-related features showed reversed directions or attenuated strength of association after adjustment for tumor stage, with most associations not reaching statistical significance. In contrast, stromal, angiogenesis-related, neural, and several immune-related features remained positively associated with PNI after adjustment. These findings suggest that the associations between PNI and the tumor microenvironment may extend beyond differences attributable to tumor stage. Given the established association between PNI and poor prognosis, these features may provide insights into the biological context of PNI-positive CRC, although their independent prognostic significance requires further investigation.
Clinical implications of our finding for treatment decisions also need further investigation. In patients with early-stage CRC following local or endoscopic excision, PNI is among the pathological risk features considered when planning completion surgery [47]. In stage II colon cancer, PNI is also recognized as a high-risk feature that may inform discussions regarding adjuvant chemotherapy [48]. Although the transcriptomic associations do not establish the benefit of additional surgery or adjuvant therapy, further studies are needed to evaluate whether the molecular features associated with PNI can improve risk stratification and inform clinical decision-making.
Several limitations should be acknowledged. First, this study was retrospective and based on the TCGA cohort, for which information on neoadjuvant therapy was unavailable. Second, because bulk RNA sequencing analyzes whole tumor tissue, cell type-specific transcriptional changes and spatial interactions among cancer cells, stromal cells, immune cells, and nerves could not be directly evaluated. Third, PNI status was determined from pathological records without information regarding the extent or anatomical distribution of neural invasion. Additionally, some exploring analysis including immune-related and neuronal features and lack of external validation require cautious interpretation for the relevant results and further validation in independent cohorts with appropriate correction for multiple comparisons. Finally, transcriptomic analyses cannot establish causality, and functional studies will be required to determine the mechanisms linking stromal remodeling, vascular and neural developmental programs, and aggressive tumor behavior in PNI-positive CRC.
Conclusions
PNI is an adverse prognostic feature of CRC with unclear biology. Using TCGA transcriptomic data, we found that PNI in CRC is characterized by CMS4 enrichment, stromal remodeling, angiogenic features, and neural developmental programs, with relatively limited genomic and immune differences. These findings provide a biological framework that may help explain the aggressive clinical behavior of PNI-positive CRC. Future studies are needed to clarify how cancer cells, stromal cells, and nerves interact during the development and progression of PNI.
| Supplementary Material | ▴Top |
Suppl 1. TCGA patient IDs and PNI status.
Suppl 2. Association of PNI with disease progression and survival adjusted for clinicopathological factors.
Suppl 3. PNI association with disease progression adjusted for tumor stage.
Suppl 4. PNI association with immune-related features adjusted by tumor stage.
Suppl 5. PNI association with stromal features adjusted by tumor stage.
Suppl 6. PNI association with angiogenesis adjusted for tumor stage.
Suppl 7. Genes used to calculate Schwann cell score.
Suppl 8. Genes used to calculate neuron projection guidance score.
Suppl 9. PNI association of PNI with neural-related features adjusted for tumor stage.
Acknowledgments
Kazuaki Takabe would like to thank the National Institutes of Health, USA, and the US Department of Defense BCRP for their financial support.
Financial Disclosure
KT is supported by the US National Institutes of Health (grant number R01CA287731, R01CA250412, and R37CA248018), and the US Department of Defense BCRP (grant number W81XWH-19-1-0674 and HT9425-24-1-0762). Roswell Park Comprehensive Cancer Center is supported by the US National Institute of Health Cancer Center Support Grant (grant number P30CA016056).
Conflict of Interest
The authors do not have any conflict of interest to declare.
Informed Consent
Institutional Review Board approval was waived as no patient-identifying information was available in the dataset utilized. Informed consent was not obtained separately for this study.
Author Contributions
R. Matsushita: data curation, visualization, and writing (original draft). K. Kawashima: study design, data analysis, writing (original draft, review and editing), conceptualization, and methodology. A. Takabe: visualization and writing (original draft, review and editing). E. Elsaedy, S. Nurkin, M. Dhir, and I. Endo: writing (review and editing). K. Takabe: supervision, funding, and writing (review and editing).
Data Availability
The authors declare that data supporting the findings of this study are available within the article.
| References | ▴Top |
- Liebig C, Ayala G, Wilks JA, Berger DH, Albo D. Perineural invasion in cancer: a review of the literature. Cancer. 2009;115(15):3379-3391.
doi pubmed - Leijssen LGJ, Dinaux AM, Taylor MS, Deshpande V, Kunitake H, Bordeianou LG, Berger DL. Perineural invasion is a prognostic but not a predictive factor in nonmetastatic colon cancer. Dis Colon Rectum. 2019;62(10):1212-1221.
doi pubmed - Cao Y, Deng S, Yan L, Gu J, Li J, Wu K, Cai K. Perineural invasion is associated with poor prognosis of colorectal cancer: a retrospective cohort study. Int J Colorectal Dis. 2020;35(6):1067-1075.
doi pubmed - Knijn N, Mogk SC, Teerenstra S, Simmer F, Nagtegaal ID. Perineural invasion is a strong prognostic factor in colorectal cancer: a systematic review. Am J Surg Pathol. 2016;40(1):103-112.
doi pubmed - Liebig C, Ayala G, Wilks J, Verstovsek G, Liu H, Agarwal N, Berger DH, et al. Perineural invasion is an independent predictor of outcome in colorectal cancer. J Clin Oncol. 2009;27(31):5131-5137.
doi pubmed - Wu X, Zhang J, Cheng F. Development and validation of a predictive and prognostic model of perineural invasion in colorectal cancer. World J Surg Oncol. 2026;24(1).
doi pubmed - National Comprehensive Cancer Network. NCCN Clinical Practice Guidelines in Oncology: Colon Cancer. Version 1. 2026. Plymouth Meeting, PA: National Comprehensive Cancer Network; 2026.
- Magnon C, Hall SJ, Lin J, Xue X, Gerber L, Freedland SJ, Frenette PS. Autonomic nerve development contributes to prostate cancer progression. Science. 2013;341(6142):1236361.
doi pubmed - Deborde S, Omelchenko T, Lyubchik A, Zhou Y, He S, McNamara WF, Chernichenko N, et al. Schwann cells induce cancer cell dispersion and invasion. J Clin Invest. 2016;126(4):1538-1554.
doi pubmed - Chen S, Chen M. Schwann cells promote the migration and invasion of colorectal cancer cells via the activated NF-kappaB/IL-8 axis in the tumor microenvironment. Front Oncol. 2022;12:1026670.
doi pubmed - Saloman JL, Albers KM, Li D, Hartman DJ, Crawford HC, Muha EA, Rhim AD, et al. Ablation of sensory neurons in a genetic model of pancreatic ductal adenocarcinoma slows initiation and progression of cancer. Proc Natl Acad Sci U S A. 2016;113(11):3078-3083.
doi pubmed - Faulkner S, Jobling P, March B, Jiang CC, Hondermarck H. Tumor neurobiology and the war of nerves in cancer. Cancer Discov. 2019;9(6):702-710.
doi pubmed - Madeo M, Colbert PL, Vermeer DW, Lucido CT, Cain JT, Vichaya EG, Grossberg AJ, et al. Cancer exosomes induce tumor innervation. Nat Commun. 2018;9(1):4284.
doi pubmed - Silverman DA, Martinez VK, Dougherty PM, Myers JN, Calin GA, Amit M. Cancer-associated neurogenesis and nerve-cancer cross-talk. Cancer Res. 2021;81(6):1431-1440.
doi pubmed - Kawashima K, Chida K, Oshi M, Yamada A, Narui K, Gandhi S, Ebos JML, et al. A neuron projection guidance signature associates with immune-cold tumor microenvironment and poor outcomes in breast cancer. Ann Surg Oncol. 2026;33(12):10425-10435.
doi pubmed - Jakab A, Patai AV, Darvas M, Tormassi-Bely K, Micsik T. Microenvironment, systemic inflammatory response and tumor markers considering consensus molecular subtypes of colorectal cancer. Pathol Oncol Res. 2024;30:1611574.
doi pubmed - Chen M, Cai Y, Han F, Li B, Xu Z, Cui K, Bai W, et al. Single-cell and bulk RNA-sequencing reveal PRRX2-driven cancer-associated fibroblast-mediated perineural invasion for predicting the immunotherapy outcome in colorectal cancer. Front Cell Dev Biol. 2025;13:1620388.
doi pubmed - Fromont G, Godet J, Pires C, Yacoub M, Dore B, Irani J. Biological significance of perineural invasion (PNI) in prostate cancer. Prostate. 2012;72(5):542-548.
doi pubmed - Ayala GE, Dai H, Ittmann M, Li R, Powell M, Frolov A, Wheeler TM, et al. Growth and survival mechanisms associated with perineural invasion in prostate cancer. Cancer Res. 2004;64(17):6082-6090.
doi pubmed - Liu H, Deng Y, Yang Y, Xue J, Maimaitiming N, Wang B, Xin Y, et al. Cross-talk between Schwann cells and CD4+ T cells promotes perineural invasion in colorectal cancer. Cancer Res. 2026;86(20):5063-5088.
doi pubmed - Kennel KB, Greten FR. The immune microenvironment of colorectal cancer. Nat Rev Cancer. 2025;25(12):945-964.
doi pubmed - Subramanian A, Tamayo P, Mootha VK, Mukherjee S, Ebert BL, Gillette MA, Paulovich A, et al. Gene set enrichment analysis: a knowledge-based approach for interpreting genome-wide expression profiles. Proc Natl Acad Sci U S A. 2005;102(43):15545-15550.
doi pubmed - Kefeli J, Tatonetti N. TCGA-Reports: A machine-readable pathology report resource for benchmarking text-based AI models. Patterns (N Y). 2024;5(3):100933.
doi pubmed - Aran D, Hu Z, Butte AJ. xCell: digitally portraying the tissue cellular heterogeneity landscape. Genome Biol. 2017;18(1):220.
doi pubmed - Sharma P, Chida K, Wu R, Tung K, Hakamada K, Ishikawa T, Takabe K. VEGFA gene expression in breast cancer is associated with worse prognosis, but better response to chemotherapy and immunotherapy. World J Oncol. 2025;16(1):120-130.
doi pubmed - Vaghjiani R, Wu R, Tung KH, Ishikawa T, Takabe K. Angiogenesis is associated with aggressive biology that counterbalances with tumor immunogenicity in hepatocellular carcinoma. World J Oncol. 2025;16(2):173-181.
doi pubmed - Rooney MS, Shukla SA, Wu CJ, Getz G, Hacohen N. Molecular and genetic properties of tumors associated with local immune cytolytic activity. Cell. 2015;160(1-2):48-61.
doi pubmed - Yee G, Wu R, Ishikawa T, Takabe K. Invasive lobular carcinoma has higher immune response than invasive ductal carcinoma in estrogen receptor-positive/human epidermal growth factor receptor 2-negative breast cancers. World J Oncol. 2025;16(5):446-456.
doi pubmed - Thorsson V, Gibbs DL, Brown SD, Wolf D, Bortone DS, Ou Yang TH, Porta-Pardo E, et al. The immune landscape of cancer. Immunity. 2018;48(4):812-830.e814.
doi pubmed - Liberzon A, Birger C, Thorvaldsdottir H, Ghandi M, Mesirov JP, Tamayo P. The Molecular Signatures Database (MSigDB) hallmark gene set collection. Cell Syst. 2015;1(6):417-425.
doi pubmed - Trimaglio G, Tilkin-Mariame AF, Feliu V, Lauzeral-Vizcaino F, Tosolini M, Valle C, Ayyoub M, et al. Colon-specific immune microenvironment regulates cancer progression versus rejection. Oncoimmunology. 2020;9(1):1790125.
doi pubmed - Guinney J, Dienstmann R, Wang X, de Reynies A, Schlicker A, Soneson C, Marisa L, et al. The consensus molecular subtypes of colorectal cancer. Nat Med. 2015;21(11):1350-1356.
doi pubmed - Isella C, Terrasi A, Bellomo SE, Petti C, Galatola G, Muratore A, Mellano A, et al. Stromal contribution to the colorectal cancer transcriptome. Nat Genet. 2015;47(4):312-319.
doi pubmed - Acevedo LM, Barillas S, Weis SM, Gothert JR, Cheresh DA. Semaphorin 3A suppresses VEGF-mediated angiogenesis yet acts as a vascular permeability factor. Blood. 2008;111(5):2674-2680.
doi pubmed - Gungor MZ, Uysal M, Senturk S. The bright and the dark side of TGF-beta signaling in hepatocellular carcinoma: mechanisms, dysregulation, and therapeutic implications. Cancers (Basel). 2022;14(4):940.
doi pubmed - Wang M, Estrella JS, Katz MH, Kim M, Rashid A, Lee JE, Maitra A, et al. Expression of epithelial-mesenchymal transition markers in treated pancreatic ductal adenocarcinoma. Pancreas. 2019;48(10):1367-1372.
doi pubmed - Amit M, Na'ara S, Gil Z. Mechanisms of cancer dissemination along nerves. Nat Rev Cancer. 2016;16(6):399-408.
doi pubmed - Hung YH, Hou YC, Hsu SH, Wang LY, Tsai YL, Shan YS, Su YY, et al. Pancreatic cancer cell-derived semaphorin 3A promotes neuron recruitment to accelerate tumor growth and dissemination. Am J Cancer Res. 2023;13(8):3417-3432.
pubmed - Secq V, Leca J, Bressy C, Guillaumond F, Skrobuk P, Nigri J, Lac S, et al. Stromal SLIT2 impacts on pancreatic cancer-associated neural remodeling. Cell Death Dis. 2015;6(1):e1592.
doi pubmed - Bakir B, Chiarella AM, Pitarresi JR, Rustgi AK. EMT, MET, plasticity, and tumor metastasis. Trends Cell Biol. 2020;30(10):764-776.
doi pubmed - Calon A, Espinet E, Palomo-Ponce S, Tauriello DV, Iglesias M, Cespedes MV, Sevillano M, et al. Dependency of colorectal cancer on a TGF-beta-driven program in stromal cells for metastasis initiation. Cancer Cell. 2012;22(5):571-584.
doi pubmed - Minegishi Y, Hiroshima Y, Yazawa K, Sato S, Yabushita Y, Homma Y, Matsuyama R, et al. CRMP4 up-regulates M2 macrophages and myeloid-derived suppressor cells to promote pancreatic cancer in mice. Anticancer Res. 2022;42(2):791-799.
doi pubmed - Ueno H, Shirouzu K, Eishi Y, Yamada K, Kusumi T, Kushima R, Ikegami M, et al. Characterization of perineural invasion as a component of colorectal cancer staging. Am J Surg Pathol. 2013;37(10):1542-1549.
doi pubmed - Ozer L, Senocak Tasci E, Mutlu AU, Piyade B, Ramoglu N, Ajredini M, Gurleyik D, et al. Intramural component of venous, lymphatic, and perineural invasion in colon cancer: a threat or an illusion? Balkan Med J. 2022;39(6):436-443.
doi pubmed - Al-Sukhni E, Attwood K, Gabriel EM, LeVea CM, Kanehira K, Nurkin SJ. Lymphovascular and perineural invasion are associated with poor prognostic features and outcomes in colorectal cancer: A retrospective cohort study. Int J Surg. 2017;37:42-49.
doi pubmed - Takahashi H, Katsuta E, Yan L, Tokumaru Y, Katz MHG, Takabe K. Transcriptomic profile of lymphovascular invasion, a known risk factor of pancreatic ductal adenocarcinoma metastasis. Cancers (Basel). 2020;12(8):2033.
doi pubmed - Vogel JD, Felder SI, Bhama AR, Hawkins AT, Langenfeld SJ, Shaffer VO, Thorsen AJ, et al. The American society of colon and rectal surgeons clinical practice guidelines for the management of colon cancer. Dis Colon Rectum. 2022;65(2):148-177.
doi pubmed - Baxter NN, Kennedy EB, Bergsland E, Berlin J, George TJ, Gill S, Gold PJ, et al. Adjuvant therapy for stage II colon cancer: ASCO guideline update. J Clin Oncol. 2022;40(8):892-910.
doi pubmed
This article is distributed under the terms of the Creative Commons Attribution 4.0 International License (CC BY 4.0), which permits unrestricted use, distribution, and reproduction in any medium, including commercial use, provided the original work is properly cited.
World Journal of Oncology is published by Elmer Press Inc.