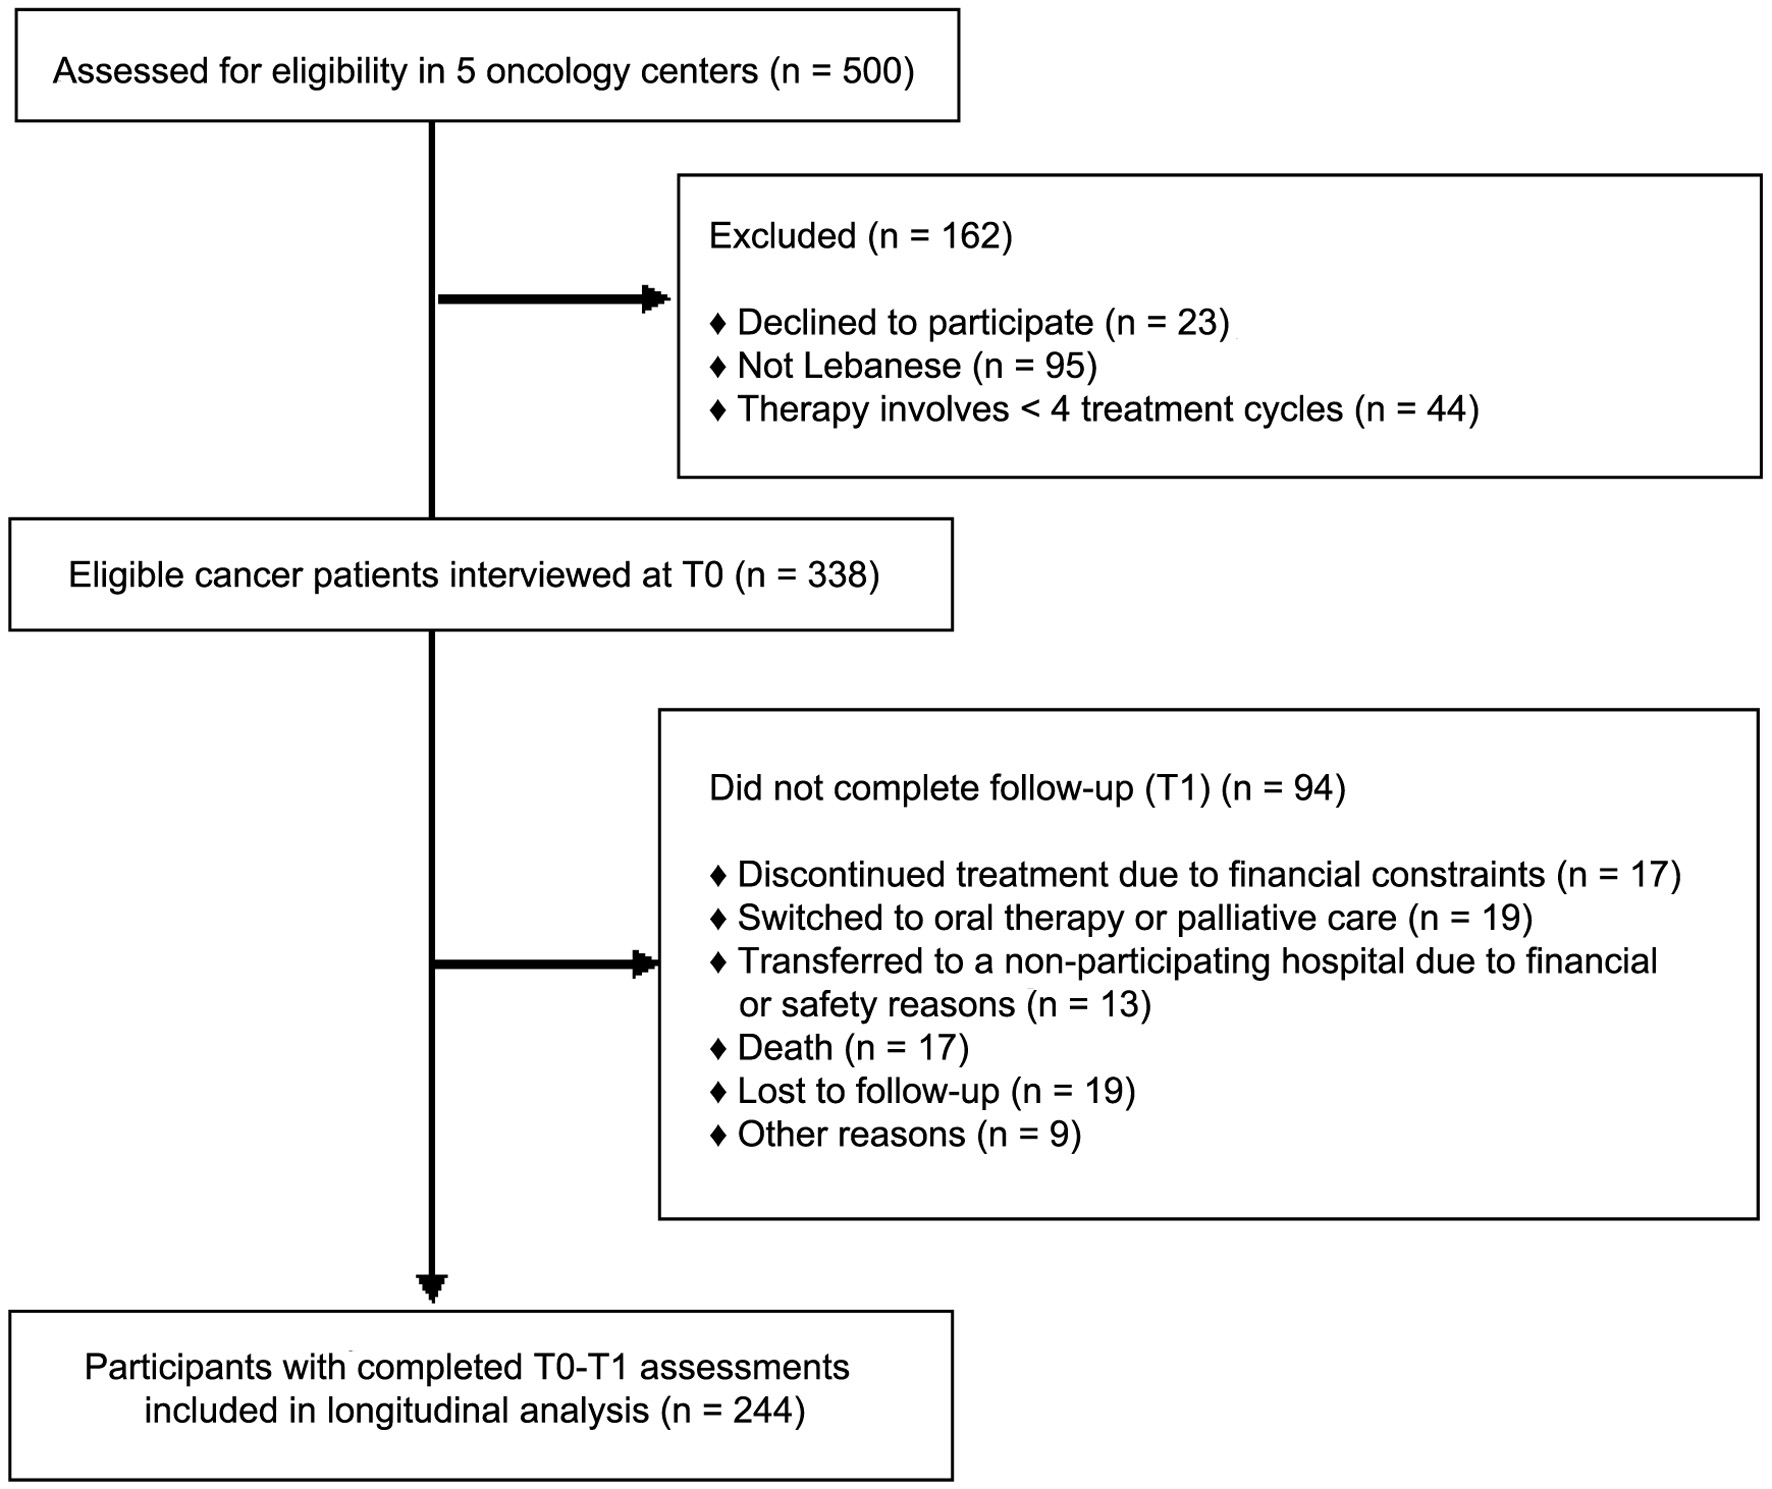
↓ Figure 1. Study flowchart of participant recruitment and follow-up. T0: baseline assessment; T1: follow-up assessment.
| World Journal of Oncology, ISSN 1920-4531 print, 1920-454X online, Open Access |
| Article copyright, the authors; Journal compilation copyright, World J Oncol and Elmer Press Inc |
| Journal website https://wjon.elmerpub.com |
Original Article
Volume 000, Number 000, September 2026, pages 000-000
Socioeconomic Changes During Cancer Therapy and Their Associations With Functional Decline and Treatment Delivery: A Multicenter Prospective Study
Figure
Tables
| Variables | Definition |
|---|---|
| ECOG: Eastern Cooperative Oncology Group; NCCN: National Comprehensive Cancer Network. | |
| Socioeconomic factors | |
| Change in occupational status | Defined as a deterioration in occupational status between baseline (T0) and follow-up (T1). Participants were categorized as having occupational loss if they transitioned from employment at T0 to unemployment at T1. |
| Change in household monthly income | Defined as a decrease in the family monthly income range by more than 200 USD between the baseline (T0) and the follow-up (T1). Participants were categorized as having decreased income vs stable or increased income. |
| Change in income type | Defined as the transition from reliance on a stable income source at baseline (T0) to an unstable or unfixed income source as assistance, transfers, debts, donations, or loans at follow-up (T1). |
| Change in insurance access | Defined as a transition from insured at baseline (T0) to uninsured at follow-up (T1). The outcome variable was categorized as loss of insurance coverage versus no change in coverage (reference category). |
| Change in insurance coverage | Defined as the transition in a patient’s insurance coverage between baseline (T0) and follow-up (T1), based on reported categories (hospital fees and treatment, hospital fees only, treatment only, no coverage benefits, uninsured). The variable captures whether the same level of coverage was maintained or reduced over time. A reduction is defined as moving from any insured category at T0 to a lower level of coverage at T1. |
| Change in payment type | Defined as the change in a patient’s healthcare payment composition between T0 and T1. It captures the transition from the baseline healthcare payment arrangement to a less favorable payment arrangement at follow-up, including increased reliance on out-of-pocket payments, loss of assistance, or other changes indicating reduced financial protection. |
| Conflict-related change in household setting | Participants were categorized as “unaffected” versus those reporting any Lebanese 2024 conflict-related major change between the two timepoints (including relocation, renting a new residence, or moving in with family or others). |
| Outcome variables | |
| ECOG performance decline | Defined as a worsening in the patient’s ECOG performance status score between baseline (T0) and follow-up (T1), indicated by an increase in ECOG grade over time. |
| NCCN compliance decline | Defined as a transition from NCCN-compliant care at baseline (T0) to noncompliant care at follow-up (T1). |
| Deterioration in treatment receipt | Defined as a decline in treatment receipt between baseline (T0) and follow-up (T1). Participants were classified as having a deterioration in treatment receipt if they reported fully receiving their prescribed treatment at T0 but reported either an incomplete treatment regimen or a reduced treatment dose at T1. |
| Variables | N | % |
|---|---|---|
| Gender | ||
| Female | 144 | 59.02 |
| Male | 100 | 40.98 |
| Age group (years) | ||
| 18–29 | 9 | 3.69 |
| 30–44 | 24 | 9.84 |
| 45–59 | 64 | 26.23 |
| 60–74 | 113 | 46.31 |
| 75–90 | 34 | 13.93 |
| Educational attainment | ||
| Illiterate | 12 | 4.92 |
| Primary education | 33 | 13.52 |
| Secondary education | 52 | 21.31 |
| High school education | 46 | 18.85 |
| Higher education | 101 | 41.39 |
| Hospital type | ||
| Governmental | 23 | 9.43 |
| Private | 221 | 90.57 |
| Type of admission | ||
| Inpatient | 51 | 20.90 |
| Outpatient | 193 | 79.09 |
| Clinical parameter | T0, n (%) | T1, n (%) | Change variable, n (%) |
|---|---|---|---|
| aParticipants may report several payment methods; hence percentages do not sum to 100. ECOG: Eastern Cooperative Oncology Group; NCCN: National Comprehensive Cancer Network. | |||
| Socio-economic factors | |||
| Mean delta dependent children number, mean (SD) | 0.59 (1.05) | 1.54 (0.88) | 0.95 (2.3) |
| Mean elderly number, mean (SD) | 1.78 (0.8) | 1.78 (0.8) | No change |
| Occupational status | |||
| Employed | 72 (29.5) | 65 (26.6) | |
| Retired | 29 (11.9) | 20 (8.2) | |
| Student | 5 (2.0) | 5 (2.0) | |
| Unemployed | 138 (56.6) | 154 (63.1) | |
| Change in occupational status | |||
| Remained the same | 209 (85.7) | ||
| Lost job | 35 (14.3) | ||
| Household monthly income | |||
| < $200 | 10 (4.1) | 11 (4.5) | |
| $200–$500 | 78 (32.0) | 102 (41.8) | |
| $500–$700 | 53 (21.7) | 48 (19.7) | |
| $700–$1,000 | 36 (14.8) | 37 (15.2) | |
| $1,000–$1,500 | 32 (13.1) | 38 (15.6) | |
| > $1,500 | 35 (14.3) | 8 (3.3) | |
| Change in household monthly income | |||
| Stable or increased | 148 (60.7) | ||
| Decrease in income | 96 (39.3) | ||
| Type of income | |||
| Fixed | 171 (70.1) | 148 (60.7) | |
| Unfixed | 73 (29.9) | 96 (39.3) | |
| Change in income type | |||
| No change | 192 (78.7) | ||
| Lost fixed income | 52 (21.3) | ||
| Medical insurance | |||
| No | 105 (43.0) | 101 (41.4) | |
| Yes | 139 (57.0) | 143 (58.6) | |
| Change in insurance access | |||
| No change | 229 (93.8) | ||
| Lost medical insurance | 15 (6.1) | ||
| Insurance coverage | |||
| Hospital fees and treatment | 72 (29.5) | 86 (35.3) | |
| Hospital fees only | 22 (9.0) | 8 (3.3) | |
| Treatment only | 4 (1.6) | 2 (0.8) | |
| No coverage or uninsured | 146 (59.9) | 148 (60.7) | |
| Change in insurance coverage | |||
| Same coverage | 228 (93.4) | ||
| Lower level of coverage | 16 (6.6) | ||
| Payment typea | |||
| Insurance | 147 (60.2) | 179 (73.4) | |
| Assistance | 89 (36.5) | 58 (23.8) | |
| Cash | 159 (65.2) | 163 (66.8) | |
| Change in payment type | |||
| No major difference | 196 (80.3) | ||
| Lost cash or assistance | 48 (19.7) | ||
| Conflict-related change in household setting | |||
| Unaffected | 177 (72.5) | ||
| Affected | 67 (27.5) | ||
| Outcome variables | |||
| ECOG status | |||
| No decline | 163 (66.8) | ||
| Decline | 81 (33.2) | ||
| NCCN compliance | |||
| Non-compliance decrease | 194 (79.5) | ||
| Non-compliance increase | 50 (20.5) | ||
| Overall treatment | |||
| No decline | 142 (58.2) | ||
| Increase in reduced doses/incomplete regimen | 102 (41.8) | ||
| Variables | ECOG grade | NCCN compliance | Overall treatment receipt | ||||||
|---|---|---|---|---|---|---|---|---|---|
| No decline, N (%) | Decline, N (%) | Sig. | No decline, N (%) | Decline, N (%) | Sig. | No decline, N (%) | Decline, N (%) | Sig. | |
| *P values are significant. ECOG: Eastern Cooperative Oncology Group; NCCN: National Comprehensive Cancer Network. | |||||||||
| Age group (years) | 0.001* | 0.504 | 0.344 | ||||||
| 18–29 | 9 (5.5%) | 0 (0%) | 6 (3.1%) | 3 (6.0%) | 4 (2.8%) | 5 (4.9%) | |||
| 30–44 | 22 (13.5% | 2 (2.5%) | 20 (10.3%) | 4 (8.0%) | 17 (12.0%) | 7 (6.9%) | |||
| 45–59 | 51 (31.3% | 13 (16.0%) | 51 (26.3%) | 13 (26.0%) | 36 (25.3%) | 28 (27.4%) | |||
| 60–74 | 59 (36.2%) | 54 (66.7%) | 93 (47.9%) | 20 (40.0%) | 69 (48.6%) | 44 (43.1%) | |||
| 75–90 | 22 (13.5%) | 12 (14.8%) | 24 (12.4%) | 10 (20.0%) | 16 (11.3%) | 18 (17.6%) | |||
| Gender | 0.438 | 0.258 | 0.268 | ||||||
| Male | 99 (60.7%) | 45 (55.6%) | 118 (60.8%) | 26 (52.0%) | 88 (62.0%) | 56 (54.9%) | |||
| Female | 64 (39.3%) | 36 (44.4%) | 76 (39.2%) | 24 (48.0%) | 54 (38.0%) | 46 (45.1%) | |||
| Educational level | 0.611 | 0.676 | 0.316 | ||||||
| High school | 28 (17.2%) | 18 (22.2%) | 81 (41.7%) | 20 (40.0%) | 29 (20.4%) | 17 (16.7%) | |||
| University | 71 (43.6%) | 30 (37.0%) | 39 (20.1%) | 7 (14.0%) | 56 (39.4%) | 45 (44.1%) | |||
| Secondary | 37 (22.7%) | 15 (18.5%) | 41 (21.1%) | 11 (22.0%) | 35 (24.6%) | 17 (16.7%) | |||
| Primary | 20 (12.3%) | 13 (16.0%) | 25 (12.9%) | 8 (16.0%) | 15 (10.6%) | 18 (17.6%) | |||
| Illiterate | 7 (4.3%) | 5 (6.2%) | 8 (4.1%) | 4 (8.0%) | 7 (4.9%) | 5 (4.9%) | |||
| Center | 0.085 | < 0.001* | 0.534 | ||||||
| A | 42 (25.8%) | 12 (14.8%) | 46 (23.7%) | 8 (16.0%) | 34 (23.9%) | 20 (19.6%) | |||
| B | 33 (20.2%) | 14 (17.3%) | 33 (17.0%) | 14 (28.0%) | 27 (19.0%) | 20 (19.6%) | |||
| C | 12 (7.4%) | 4 (4.9%) | 11 (5.7%) | 5 (10.0%) | 7 (4.9%) | 9 (8.8%) | |||
| D | 11 (6.7%) | 12 (14.8%) | 11 (5.7%) | 12 (24.0%) | 11 (7.7%) | 12 (11.8%) | |||
| E | 65 (39.9%) | 39 (48.1%) | 93 (47.9%) | 11 (22.0%) | 63 (44.4%) | 41 (40.2%) | |||
| Factors | Decline in ECOG status (Yes vs. No -ref-) | Decline in NCCN compliance (Yes vs. No -ref-) | Decline in overall treatment (Yes vs. No -ref-) | |||||||||
|---|---|---|---|---|---|---|---|---|---|---|---|---|
| Decline, N (%) | Univariate, OR (95% CI) | Multivariate, AORa (95% CI) | Sig. | Decline, N (%) | Univariate, OR (95% CI) | Multivariate, AORb (95% CI) | Sig. | Decline, N (%) | Univariate, OR (95% CI) | Multivariate, AOR (95% CI) | Sig. | |
| aAdjusted for possible confounders: age, gender. bAdjusted age, gender, and center. *P values are significant. 1 is ref. cat. AOR: adjusted odds ratio; CI: confidence interval; ECOG: Eastern Cooperative Oncology Group; NCCN: National Comprehensive Cancer Network; OR: odds ratio. | ||||||||||||
| Mean change in number of children | 0.53 (0.3) | 0.9 (0.80–1.02) | −0.52 (0.37) | 0.95 (0.1) | 1.07 (0.96–1.19) | 1.1 (0.98–1.23) | 0.103 | |||||
| Mean change in number of elderly | 0.78 (0.05) | 1.75 (1.25–2.45) | 1.66 (1.16–2.37) | 0.005* | −0.07 (0.12) | −0.08 (0.1) | 1.14 (0.83–1.57) | 1.22 (0.87–1.70) | 0.235 | |||
| Change in occupational status | ||||||||||||
| Remained same | 64 (79.0) | 1 | 1 | 0.010* | 47 (94.0) | 1 | 1 | 0.117 | 88 (86.3) | 1 | 1 | 0.94 |
| Lost job | 17 (21.0) | 2.13 (1.03–4.42) | 2.78 (1.27–6.07) | 3 (6.0) | 0.32 (0.09–1.10) | 0.38 (0.12–1.27) | 14 (13.8) | 0.91 (0.44–1.90) | 0.97 (0.44–2.09) | |||
| Change in household monthly income | ||||||||||||
| Stable or increased | 50 (61.7) | 1 | 63 (61.7) | 1 | 1 | 0.792 | ||||||
| Decrease in income | 31 (38.3) | 0.93 (0.54–1.62) | 39 (38.2) | 0.92 (0.55–1.56) | 0.92 (0.53–1.57) | |||||||
| Change in income source | ||||||||||||
| No change | 67 (82.3) | 1 | 39 (78.0) | 1 | 1 | 0.869 | 81 (79.4) | 1 | 1 | 0.5 | ||
| Lost fixed income | 14 (17.3) | 0.69 (0.35–1.36) | 11 (22.0) | 1.05 (0.50–2.23) | 0.93 (0.42–2.15) | 21 (20.6) | 0.93 (0.50–1.73) | 0.79 (0.41–1.54) | ||||
| Change in insurance access | ||||||||||||
| No change | 77 (95.1) | 1 | 46 (92.0) | 95 (93.1) | 1 | 1 | 0.034* | |||||
| Lost medical insurance | 4 (5.0) | 2.02 (1.29–32.8) | 4 (8.0) | 7 (6.9) | 1.23 (0.43–3.51) | 2.39 (1.07–5.34) | ||||||
| Change in insurance coverage | ||||||||||||
| Same coverage | 77 (97.5) | 1 | 47 (94.0) | 1 | 1 | 0.548 | 97 (95.1) | 1 | 1 | 0.122 | ||
| Lower level of coverage | 2 (2.5) | 0.26 (0.12–32.8) | 3 (6.0) | 0.89 (0.24–3.25) | 2.28 (0.51–10.24) | 5 (4.9) | 1.62 (0.54–4.84) | 3.27 (0.72–14.72) | ||||
| Change in payment type | ||||||||||||
| No major difference | 64 (79.0) | 1 | 1 | 0.238 | 41 (82.0) | 1 | 1 | 0.814 | 80 (78.4) | 1 | 1 | 0.027* |
| Lost cash or assistance | 17 (21.0) | 1.13 (0.58–2.19) | 1.66 (0.72–3.85) | 9 (18.0) | 0.87 (0.39–1.95) | 1.12 (0.44–2.85) | 22 (21.6) | 1.23 (0.65–2.32) | 1.30 (1.03–1.64) | |||
| 2024 Conflict-related change in household setting | ||||||||||||
| Unaffected | 56 (69.1) | 1 | 1 | 0.067 | 73 (71.6) | 1 | 1 | 0.451 | ||||
| Affected | 25 (30.9) | 1.29 (0.71–2.31) | 2.04 (0.95-4.37) | 29 (28.4) | 1.08 (0.61–1.91) | 0.95 (0.65–1.78) | ||||||