World Journal of Oncology, ISSN 1920-4531 print, 1920-454X online, Open Access
Article copyright, the authors; Journal compilation copyright, World J Oncol and Elmer Press Inc
Journal website https://wjon.elmerpub.com

Review

Volume 17, Number 5, October 2026, pages 599-613


Magnitude of Survival Benefit Associated With Tyrosine Kinase Inhibitors in Advanced Thyroid Carcinoma: A Systematic Review and Meta-Analysis Incorporating Updated Long-Term Evidence From SELECT (Lenvatinib) and COSMIC-311 (Cabozantinib) Trials

Figures

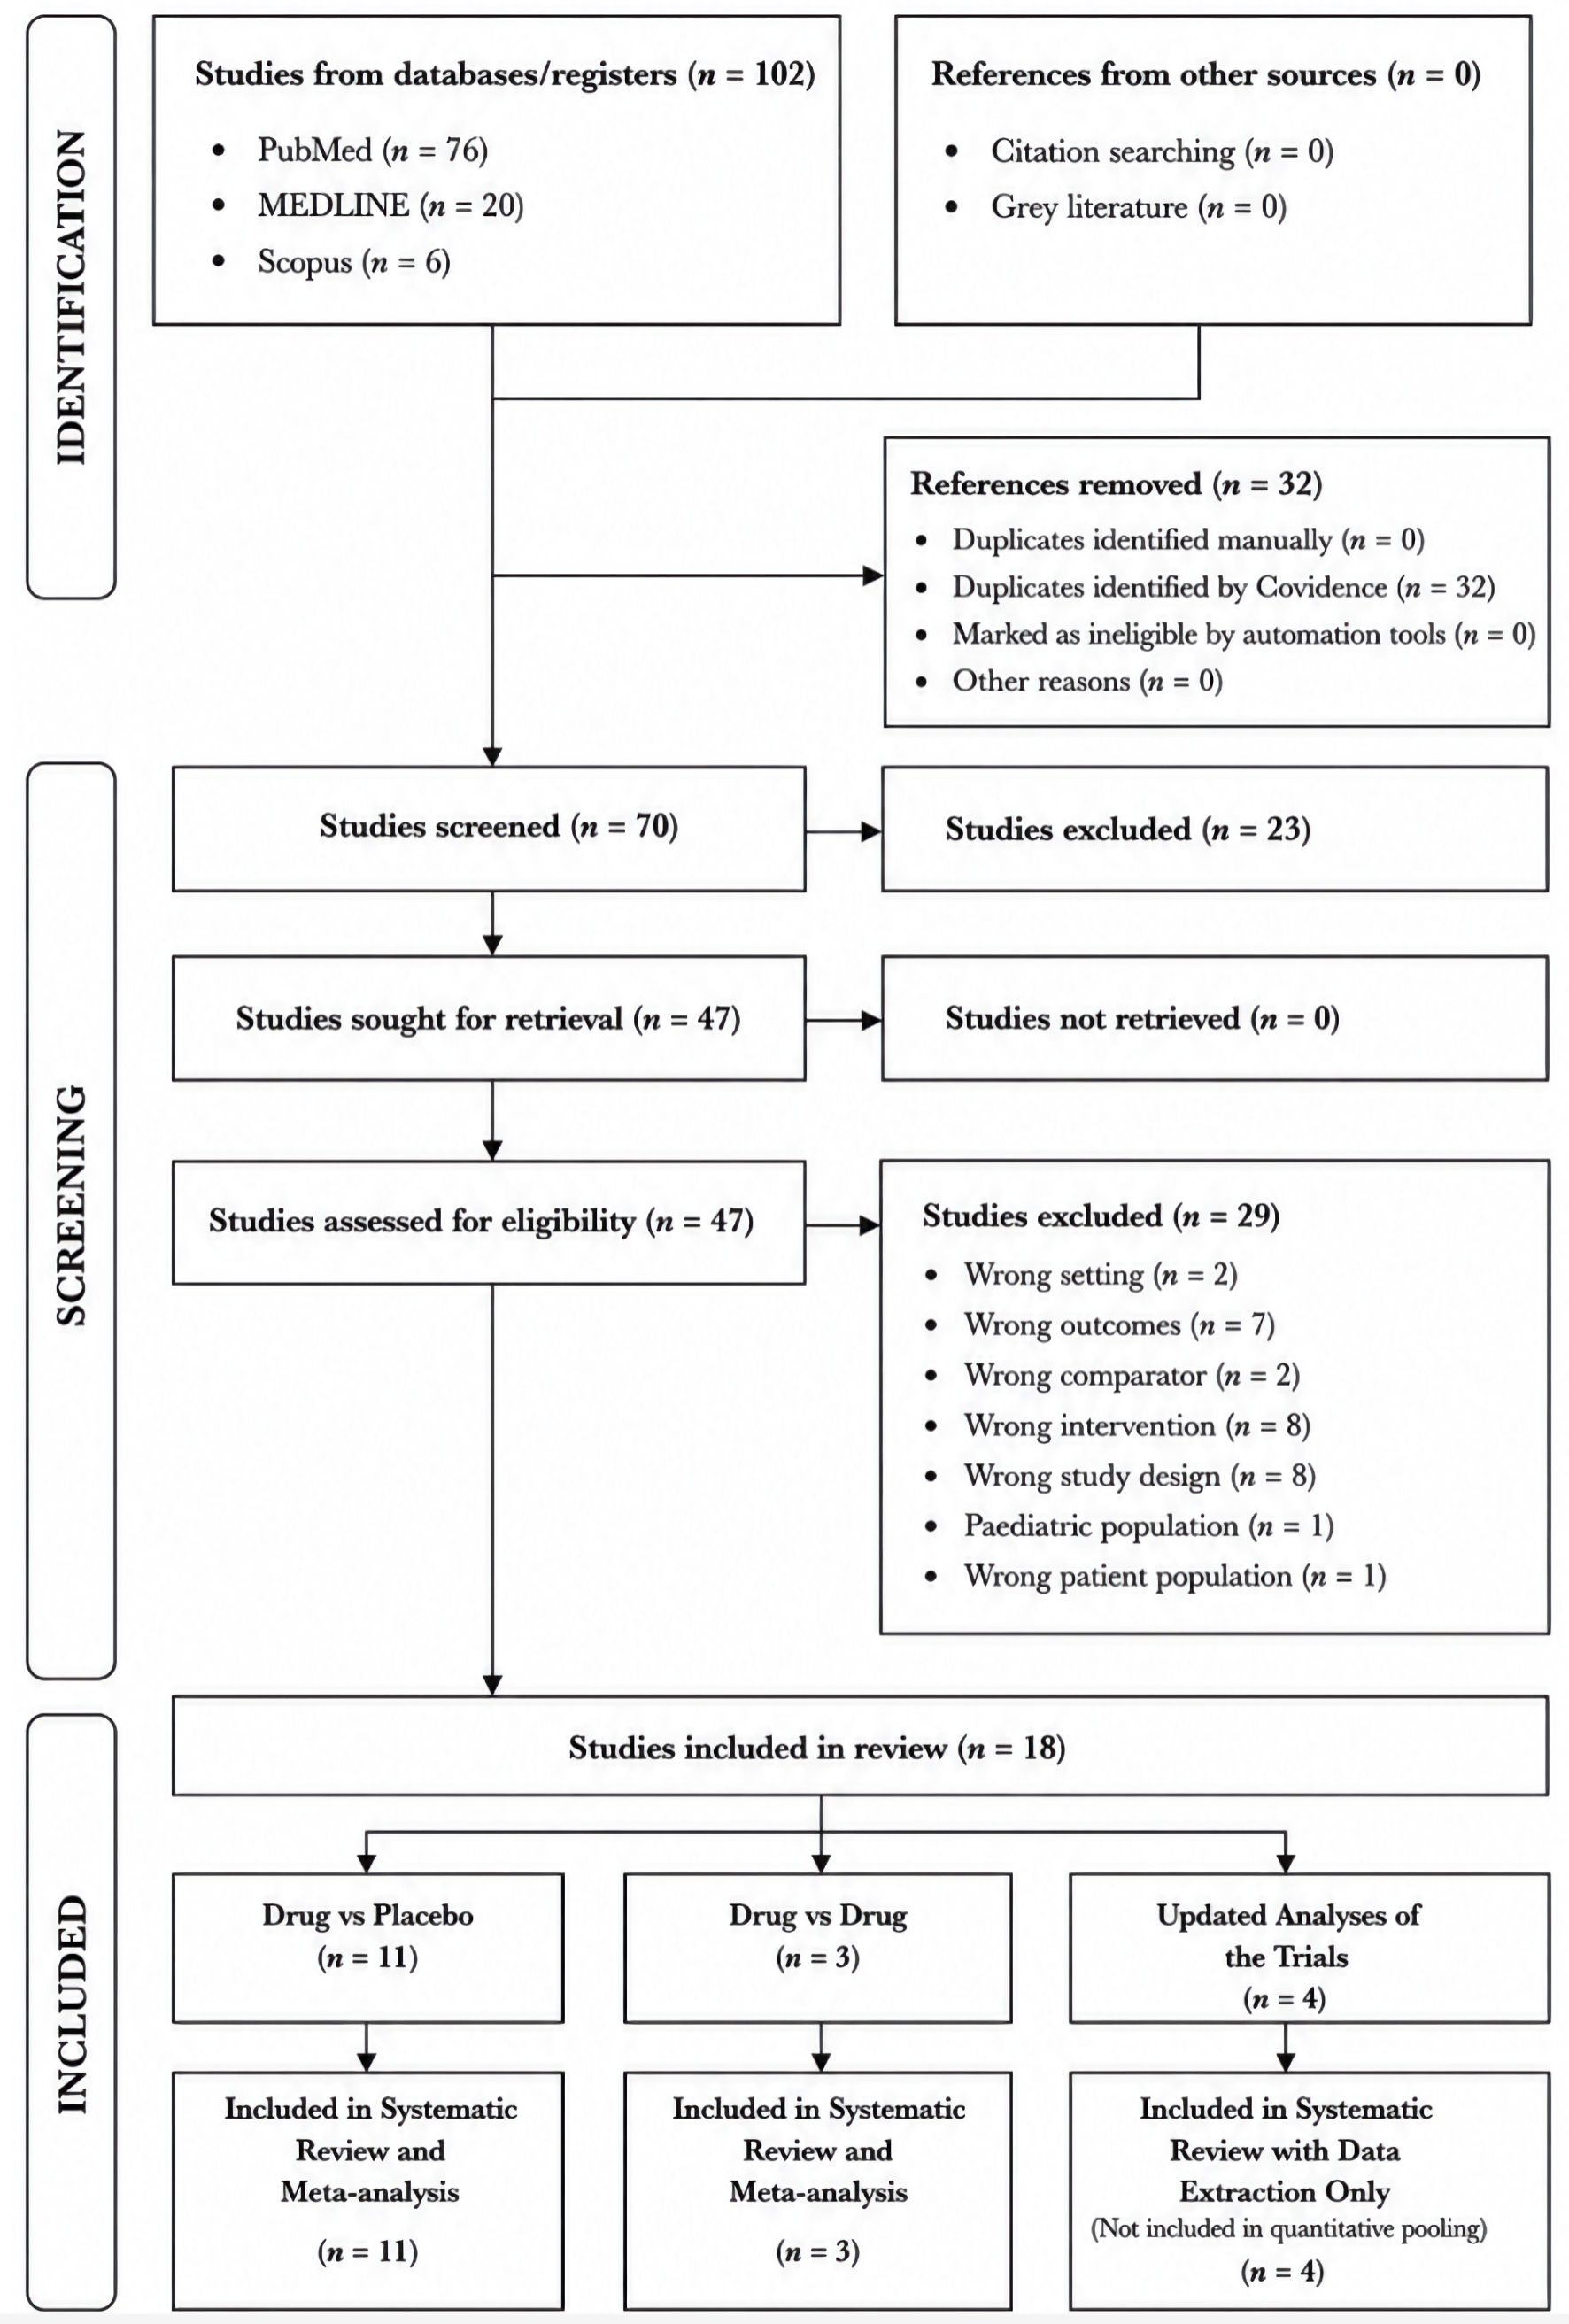
↓  Figure 1. PRISMA flow chart demonstrating search strategy for inclusion of studies reporting randomized controlled trials for tyrosine kinase inhibitors in thyroid carcinoma. PRISMA: Preferred Reporting Items for Systematic Reviews and Meta-Analyses.
Figure 1.
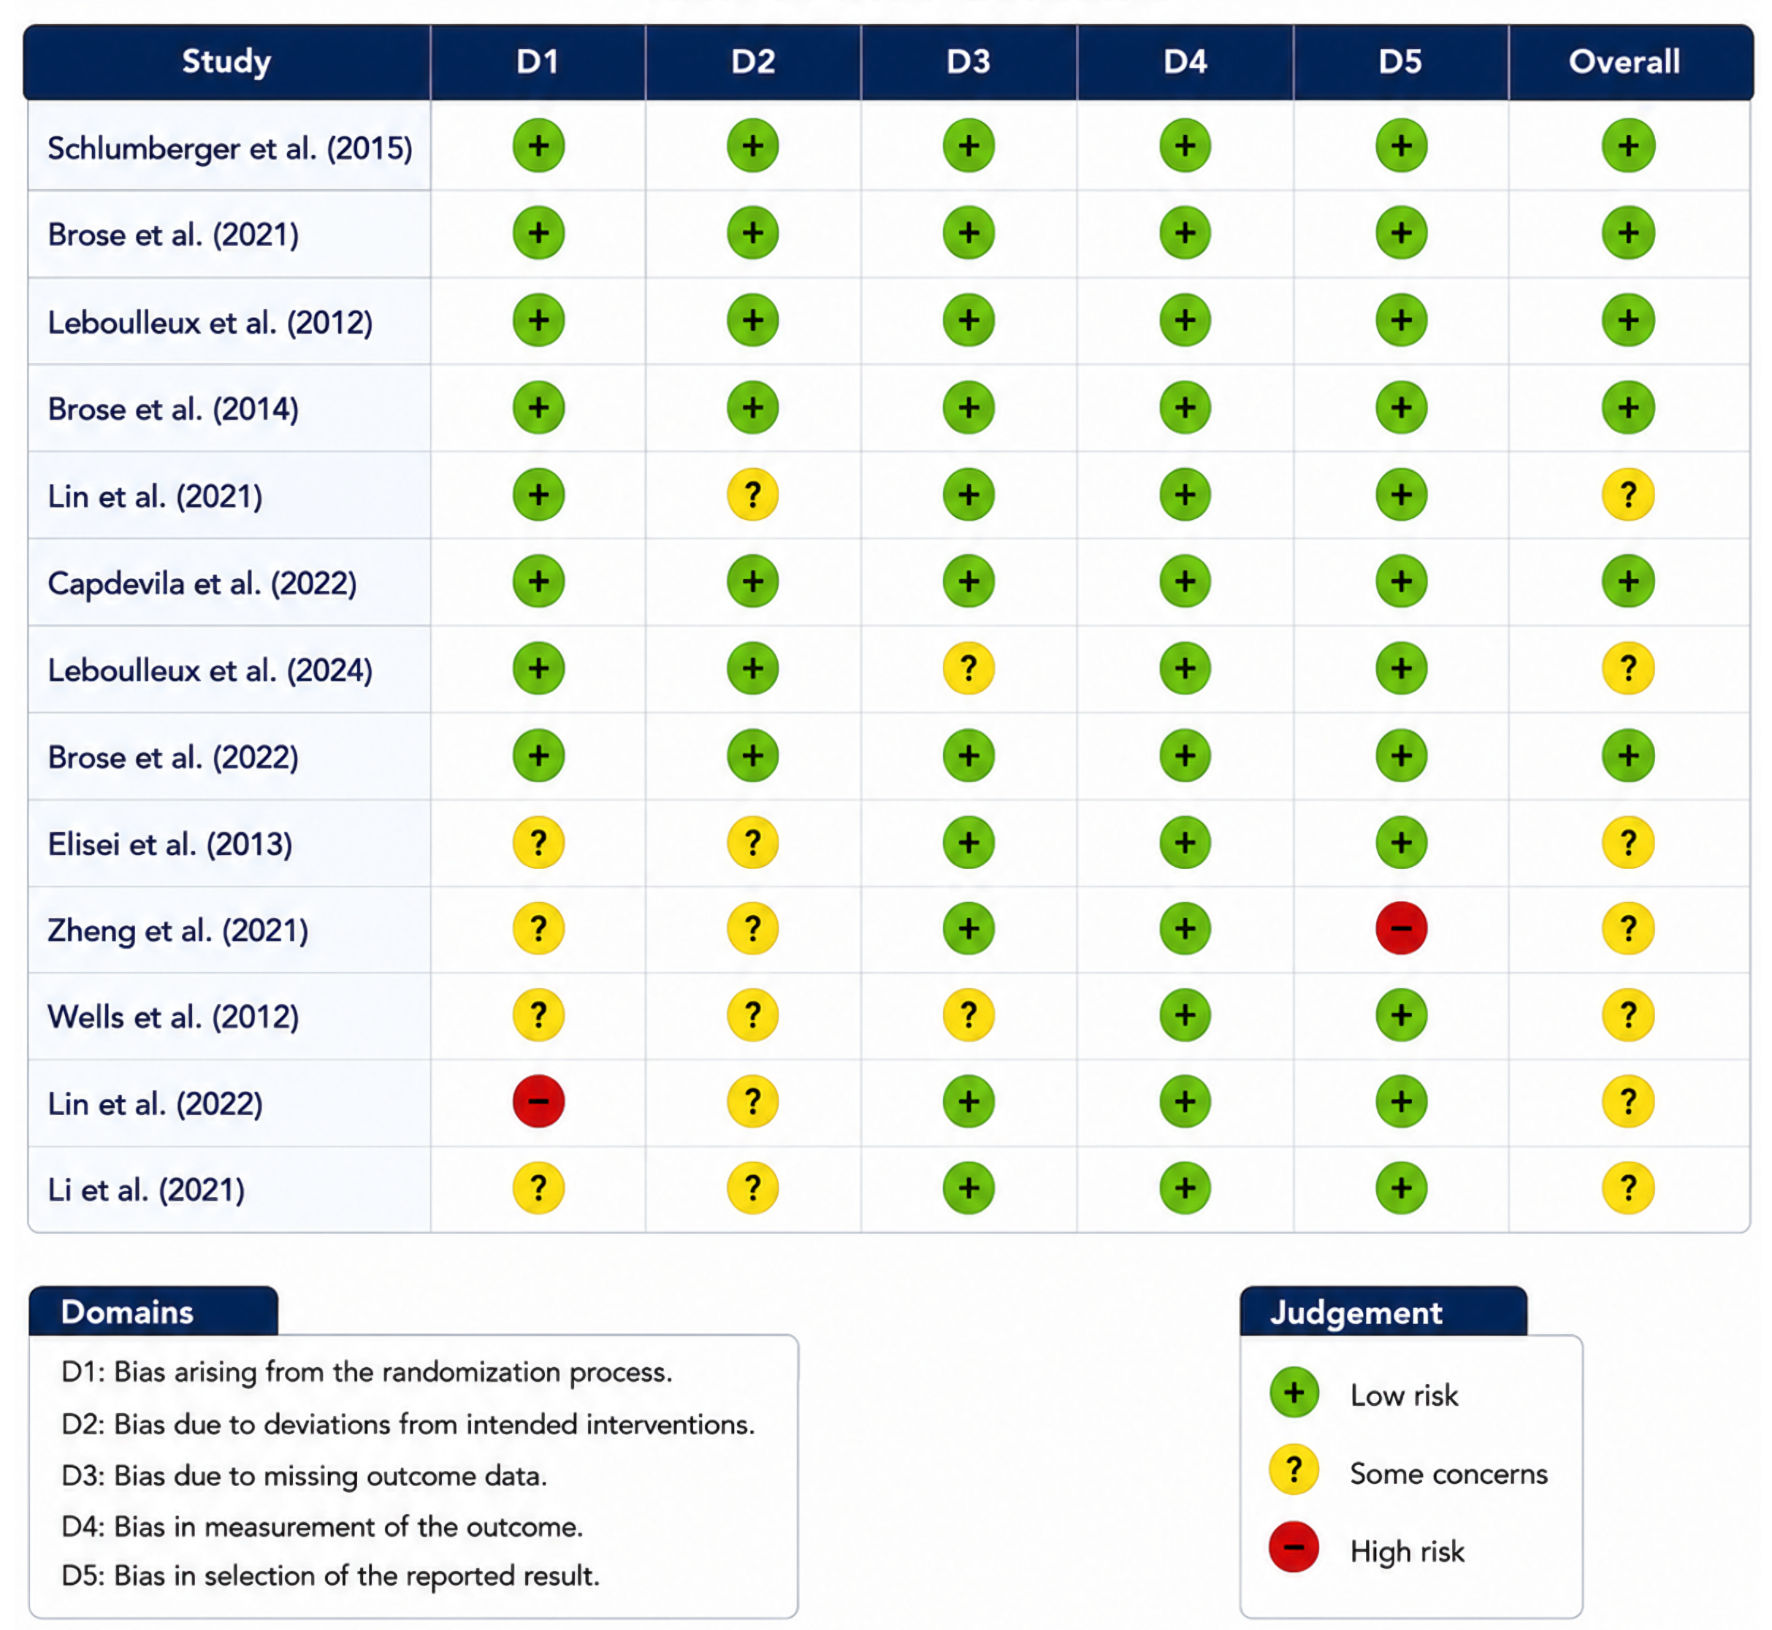
↓  Figure 2. Risk of bias assessment for the included trials.
Figure 2.
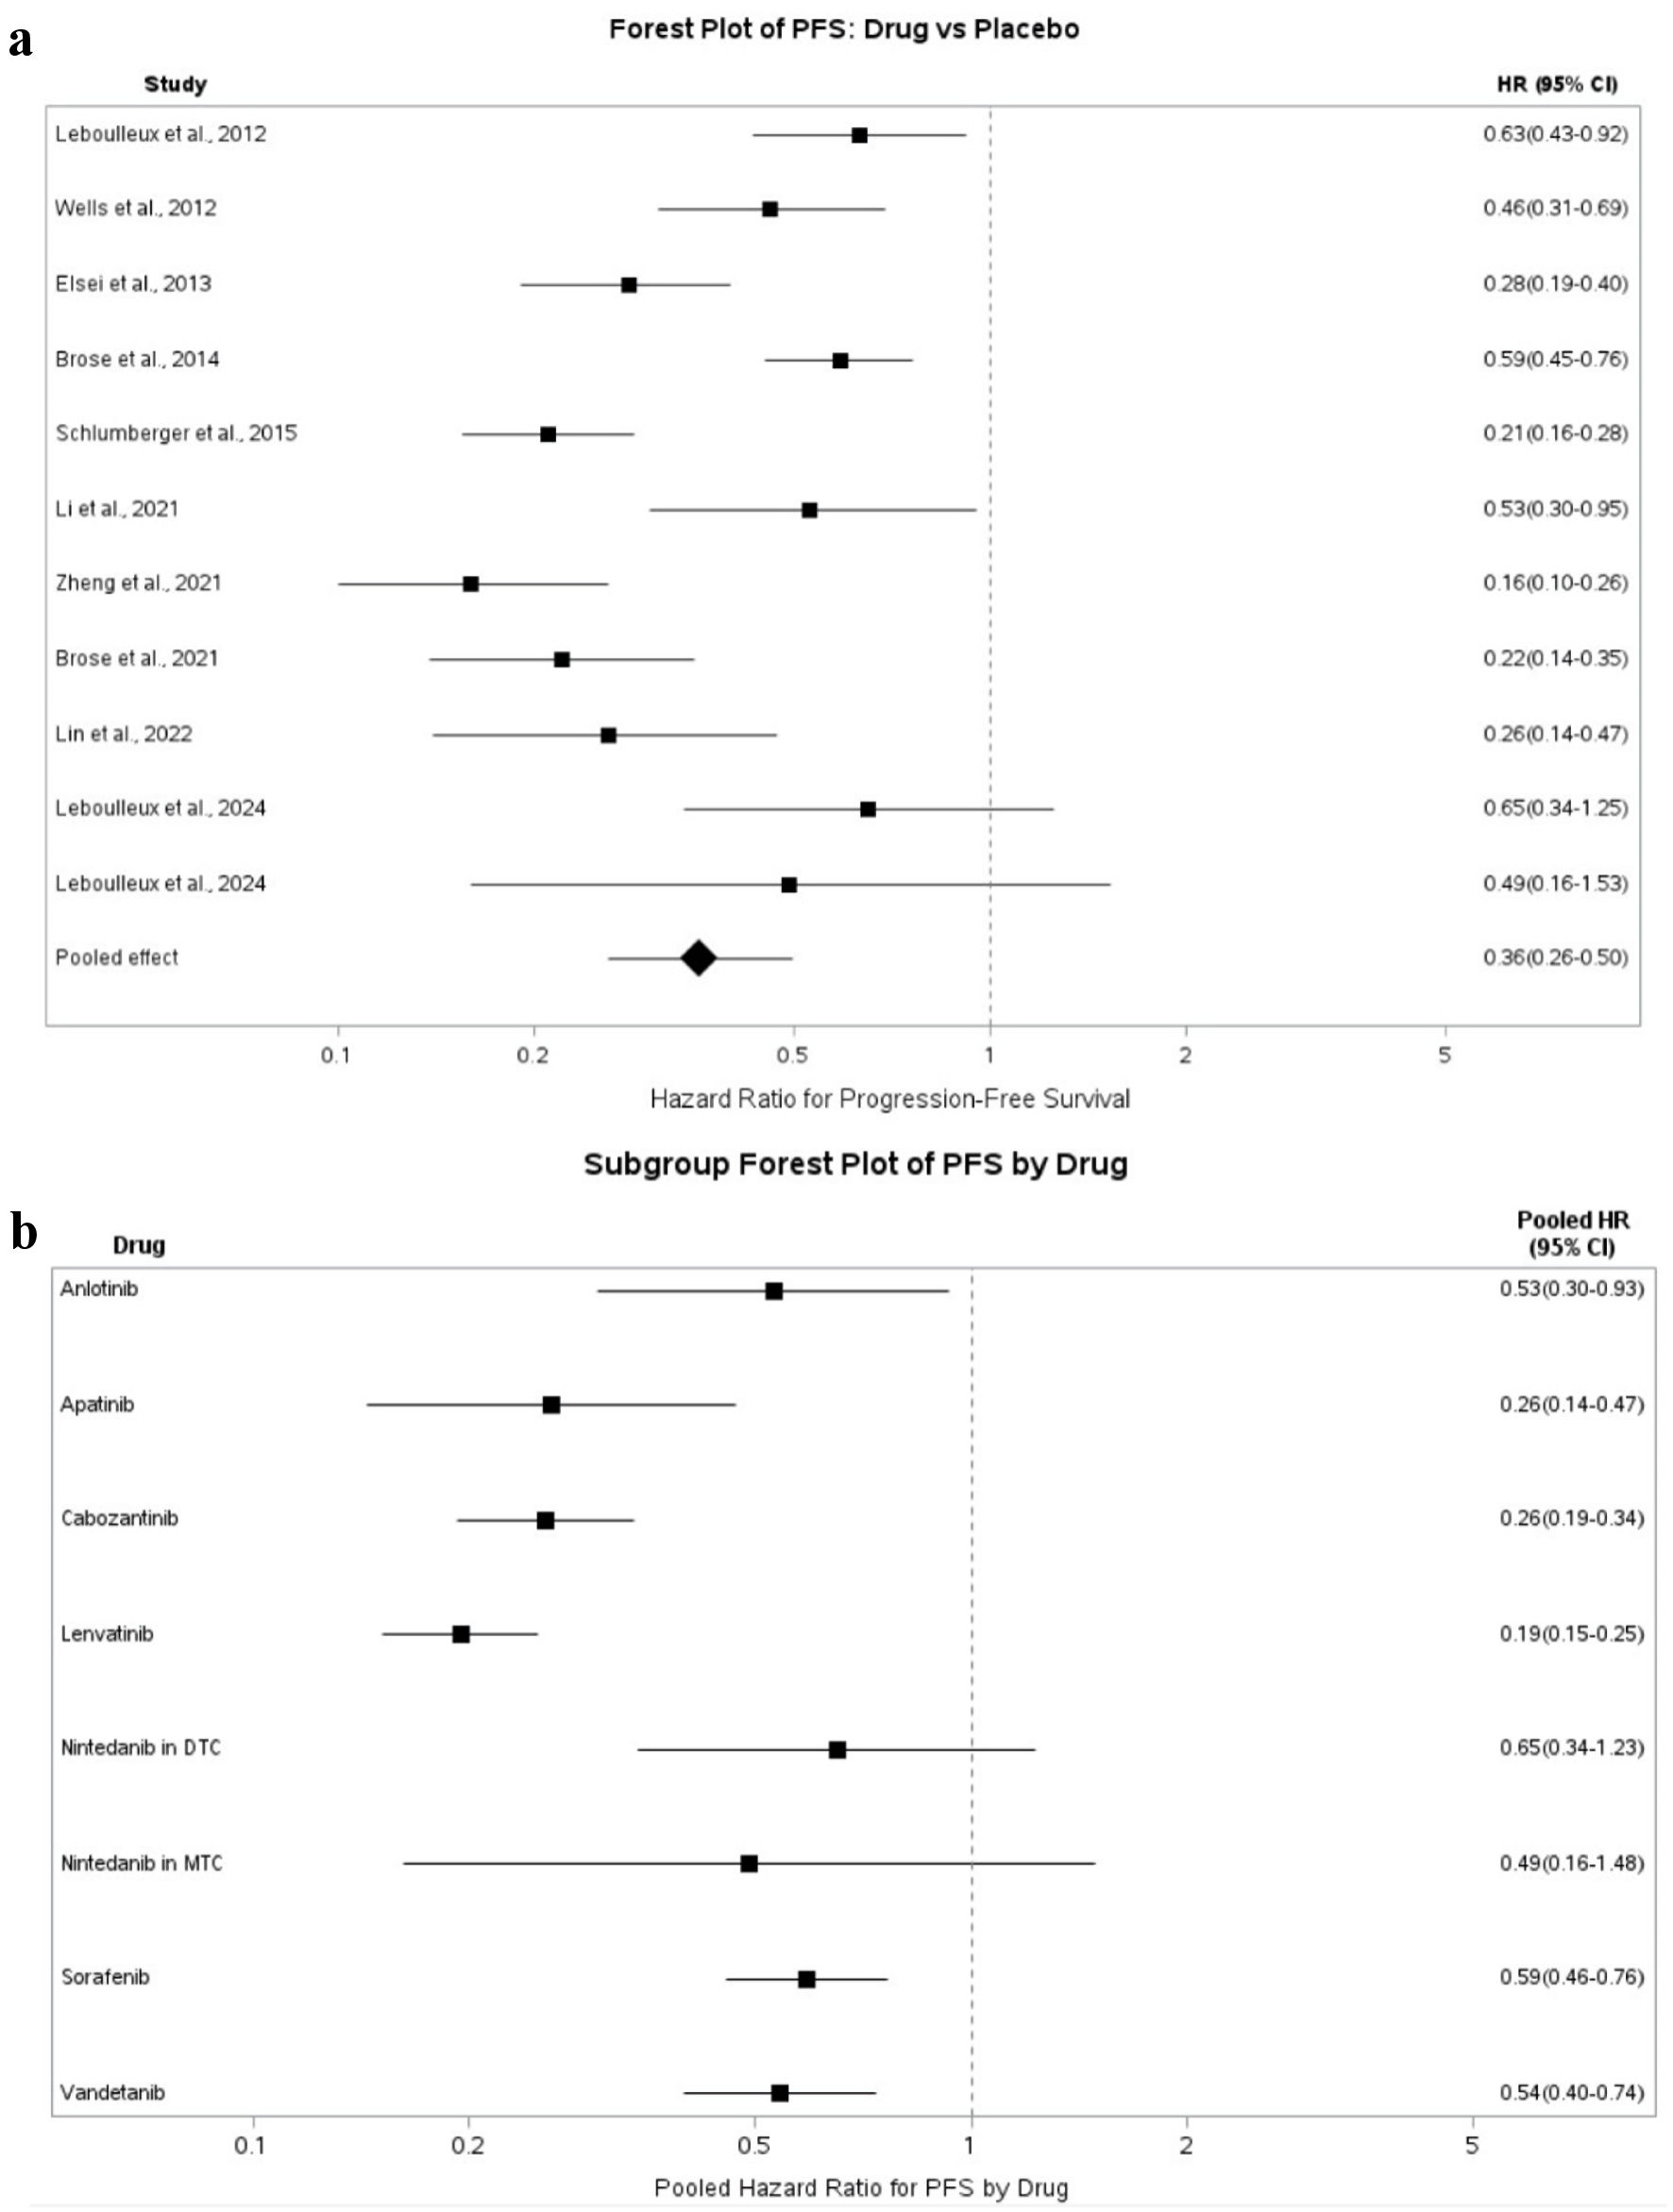
↓  Figure 3. Forest plots of progression free survival (PFS). (a) Drug vs placebo. (b) Drug specific subgroup analysis. HR: hazard ratio; CI: confidence interval; MTC: medullary thyroid carcinoma; DTC: differentiated thyroid cancer.
Figure 3.
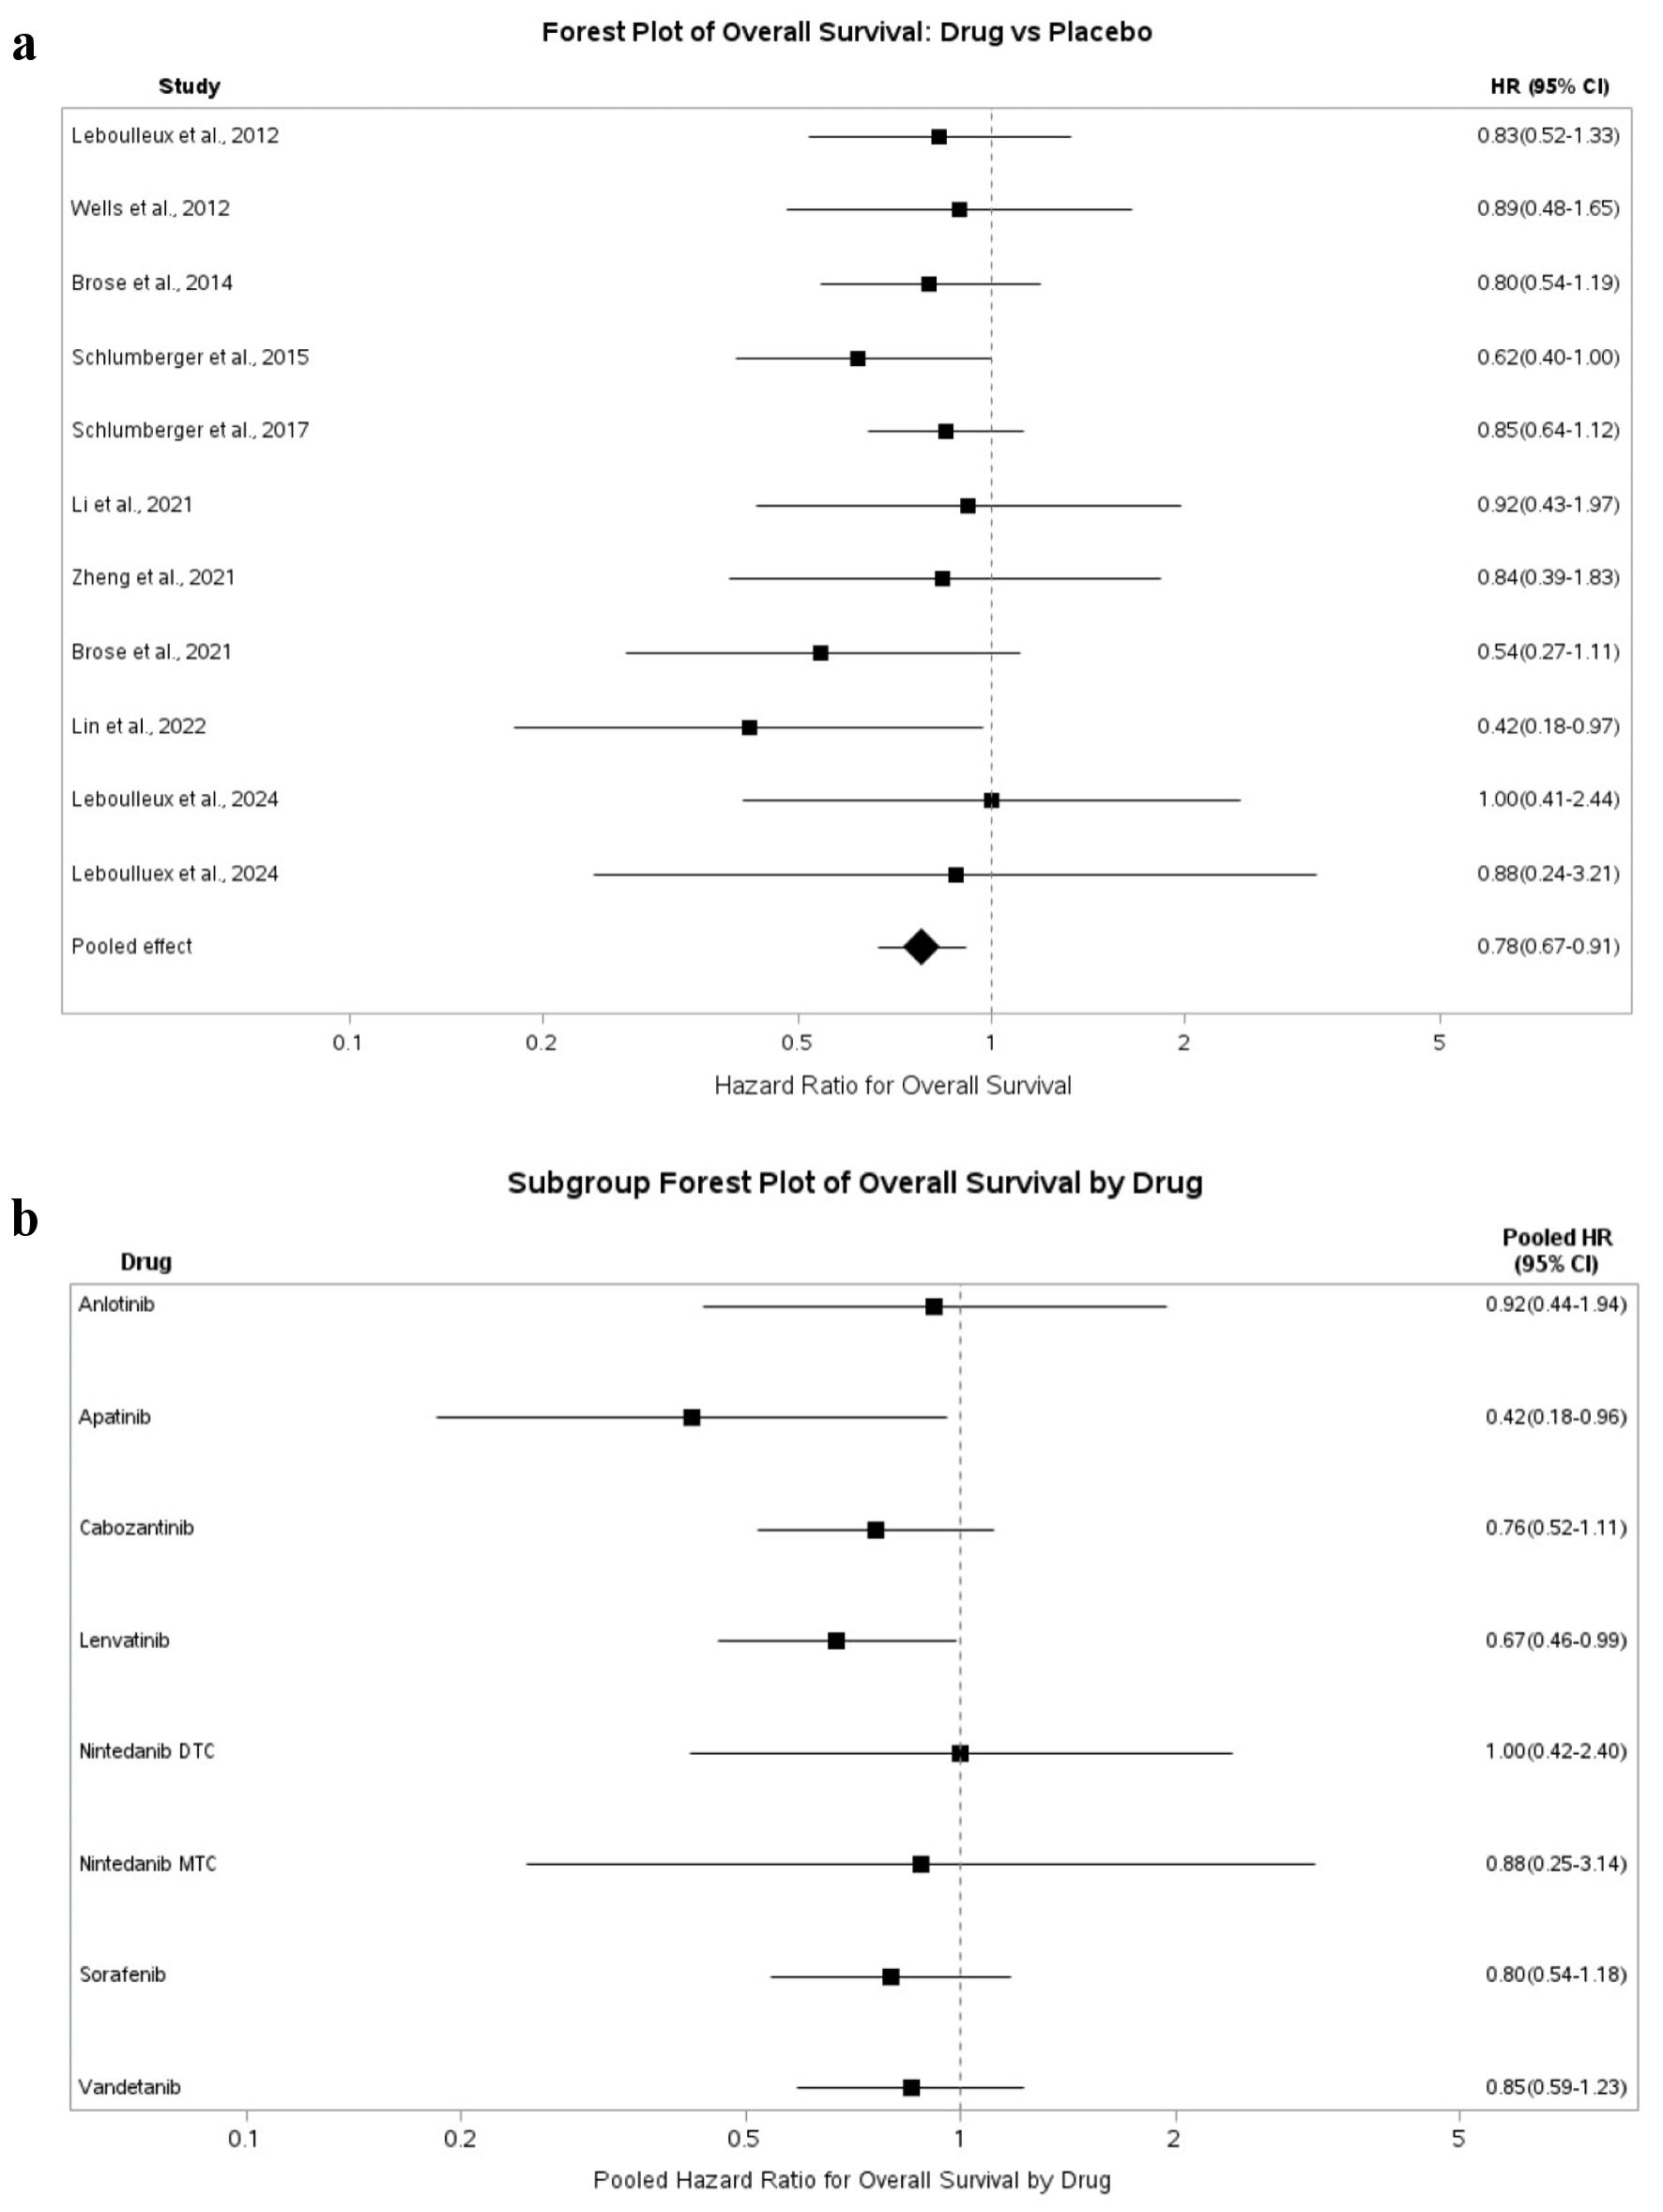
↓  Figure 4. Forest plots of overall survival (OS). (a) Drug vs placebo. (b) Drug specific subgroup analysis. HR: hazard ratio; CI: confidence interval.
Figure 4.

Tables

↓  Table 1. Baseline Characteristics of Placebo-Controlled Targeted Therapy Trials
 
StudyRegistration IDMalignancyPhaseNumber of patientsSex of patientsIntervention vs comparatorOS HR (95% CI)Median follow -up timeaMedian PFS in months (drug)Median PFs in months (placebo)PFS HR (95% CI)
aD: drug; P: placebo. MTC: medullary thyroid carcinoma; RR-DTC: radioiodine-refractory differentiated thyroid cancer; BID: twice daily; PFS: progression-free survival; OS: overall survival; HR: hazard ratio; CI: confidence interval; DTC: differentiated thyroid cancer.
Wells et al, 2012 [37]NCT00410761MTCIII331Male: 58%/56%Vandetanib 300 mg vs placebo0.89 (0.48–1.65)D (24)/P (24)30.519.30.46 (0.31–0.69)
Leboulleux et al, 2012 [48]NCT00537095RR-DTCII145Male: 54%/53%Vandetanib 300 mg vs placebo0.83 (0.52–1.33)D (18.9)/P (19.5)11.15.90.63 (0.43–0.92)
Elisei et al, 2013 [40]NCT00704730MTCIII330Male: 68.9%/63.1%Cabozantinib 140 mg vs placebo0.98 (0.63–1.52)D (13.9)/P (13.9)11.240.28 (0.19–0.40)
Brose et al, 2014 [39]NCT00984282RR-DTCIII417Male: 50.2%/45.2%Sorafenib 400 mg BID vs placebo0.80 (0.54–1.19)D (16.2)/P (16.2)10.85.80.59 (0.45–0.76)
Schlumberger et al, 2015 [25]NCT01321554RR-DTCIII392Male: 47.9%/57.3%Lenvatinib 24 mg vs placebo0.62 (0.40–1.00)D (17.1)/P (17.4)18.33.60.21 (0.14–0.31)
Schlumberger et al, 2017 [38]NCT00704730MTCIII330Male: 68.9%/63.1%Cabozantinib 140 mg vs placebo0.85 (0.64–1.12)Not foundNot availableNot available0.28 (0.19–0.40)
Li et al, 2021 [46]NCT02586350MTCIIB91Male: 68%/62%Anlotinib 12 mg vs placebo0.92 (0.43–1.97)D (25.8)/P (24.8)20.711.10.53 (0.30–0.95)
Lin et al, 2022 [45]NCT03048877RR-DTCIII92Male: 41.3%/37.0%Apatinib 500 mg vs placebo0.42 (0.18–0.97)D (18.1)/P (18.1)20.24.50.26 (0.14–0.47)
Zheng et al, 2021 [47]NCT02966093RR-DTCIII151Male: 55.3%/43.8%Lenvatinib 24 mg vs placebo0.84 (0.39–1.83)D (14.8)/P (15.6)23.93.70.16 (0.10–0.26)
Brose et al, 2021 [42]NCT03690388RR-DTCIII187Male: 46%/45%Cabozantinib 60 mg vs placebo0.54 (0.27–1.11)D (6.2)/P (6.2)Not reached1.90.22 (0.13–0.36)
Leboulleux et al, 2024 [33]NCT01788982RR-DTC + MTCII101DTC male: 44.3%; MTC male: 74.2%Nintedanib vs placeboDTC: 1.00 (0.41–2.44); MTC: 0.88 (0.24–3.21)DTC (D (26.3)/P (19.8)); MTC (D (48.4)/P (19.7))DTC (3.7)/MTC (7)DTC (2.9)/MTC (3.9)DTC: 0.65 (0.34–1.25); MTC: 0.49 (0.16–1.53)


↓  Table 2. Baseline Characteristics of Active-Comparator (Dose vs Dose) Targeted Therapy Trials
 
StudyRegistration IDMalignancyPhaseNumber of patientsSex of patientsIntervention vs comparatorOS HR (95% CI)Median follow -up timeaMedian PFS in months (drug)Median PFs in months (drug)PFS HR (95% CI)
aD: drug; P: placebo. MTC: medullary thyroid carcinoma; RR-DTC: radioiodine-refractory differentiated thyroid cancer; PFS: progression-free survival; OS: overall survival; HR: hazard ratio; CI: confidence interval.
Brose et al, 2022 [35]NCT02702388RR-DTCII152Male: 54.7%/48.1%Lenvatinib 24 mg vs lenvatinib 18 mgNot reportedD (12.8)/D (11.2)24 mg (not reached)18 mg (24.4)1.44 (0.76–2.74)
Capdevila et al, 2022 [36]NCT01896479MTCIV247Male: 73%/60%Cabozantinib 60 mg vs 140 mg1.12 (0.77–1.63)D (30)/D (30)60 mg (11)140 mg (13.9)1.24 (0.90–1.70)
Lin et al, 2021 [32]NCT02870569/CTR20160220RR-DTCII35Not clearly extractedDonafenib 300 mg vs 200 mgNot reportedNot reported300 mg (14.98)200 mg (9.44)0.678 (0.298–1.547)


↓  Table 3. Updated Analysis of SELECT (Lenvatinib) and COSMIC-311 (Cabozantinib) Trials With Key Outcomes
 
StudyTrial numberExperimental vs comparatorSubgroup/analysis typePFS findings: drug vs placeboKey outcome reported
NQ: not quantifiable; PFS: progression-free survival; DTC: differentiated thyroid cancer; RR-DTC: radioiodine-refractory differentiated thyroid cancer; RAI: radioactive iodine; TKI: tyrosine kinase inhibitor; HR: hazard ratio; CI: confidence interval.
Kiyota et al, 2017 [43]NCT01321554Lenvatinib 24 mg/day vs placeboNo RAI uptake: 275 patientsNQ vs 3.7 monthsTreatment outcomes were comparable regardless of the RR-DTC definition used, suggesting that different diagnostic criteria identify clinically similar patient populations.
Disease progression despite RAI avidity: 235 patients16.5 vs 3.7 months
Extensive RAI exposure: 73 patients18.7 vs 3.6 months
Gianoukakis et al, 2018 [44]NCT01321554Lenvatinib 24 mg/day vs placeboOverall updated SELECT analysis19.4 vs 3.7 months; HR 0.24; 99% CI, 0.17–0.35The updated SELECT analysis confirmed sustained PFS benefit with lenvatinib, with responders showing significantly longer PFS than non-responders.
Responders vs non-respondersResponders: 33.1 months vs 7.9 months in non-responders
Brose et al, 2022 [34]NCT03690388Cabozantinib 60 mg/day vs placeboOverall updated COSMIC: 311 analyses11.0 vs 1.9 months; HR 0.22; 96% CI, 0.15–0.32Long-term follow-up supported the sustained efficacy of cabozantinib in previously treated RAIR-DTC, while maintaining a consistent safety profile.
Capdevila et al, 2024 [41]NCT03690388Cabozantinib 60 mg/day vs placeboPrior sorafenib only16.6 vs 3.2 months; HR 0.13; 95% CI, 0.06–0.26Cabozantinib consistently improved PFS across all treatment history and histological subgroups, indicating that its therapeutic benefit is maintained regardless of prior TKI exposure or differentiated thyroid carcinoma subtype.
Prior lenvatinib only5.8 vs 1.9 months; HR 0.28; 95% CI, 0.16–0.48
Prior sorafenib + lenvatinib7.6 vs 1.9 months; HR 0.27; 95% CI, 0.13–0.54
Papillary DTC9.2 vs 1.9 months; HR 0.27; 95% CI, 0.17–0.43
Follicular DTC11.2 vs 2.5 months; HR 0.18; 95% CI, 0.10–0.31
Oncocytic DTC11.2 vs 2.5 months; HR 0.06; 95% CI, 0.02–0.21
Poorly differentiated DTC7.4 vs 1.8 months; HR 0.18; 95% CI, 0.08–0.43