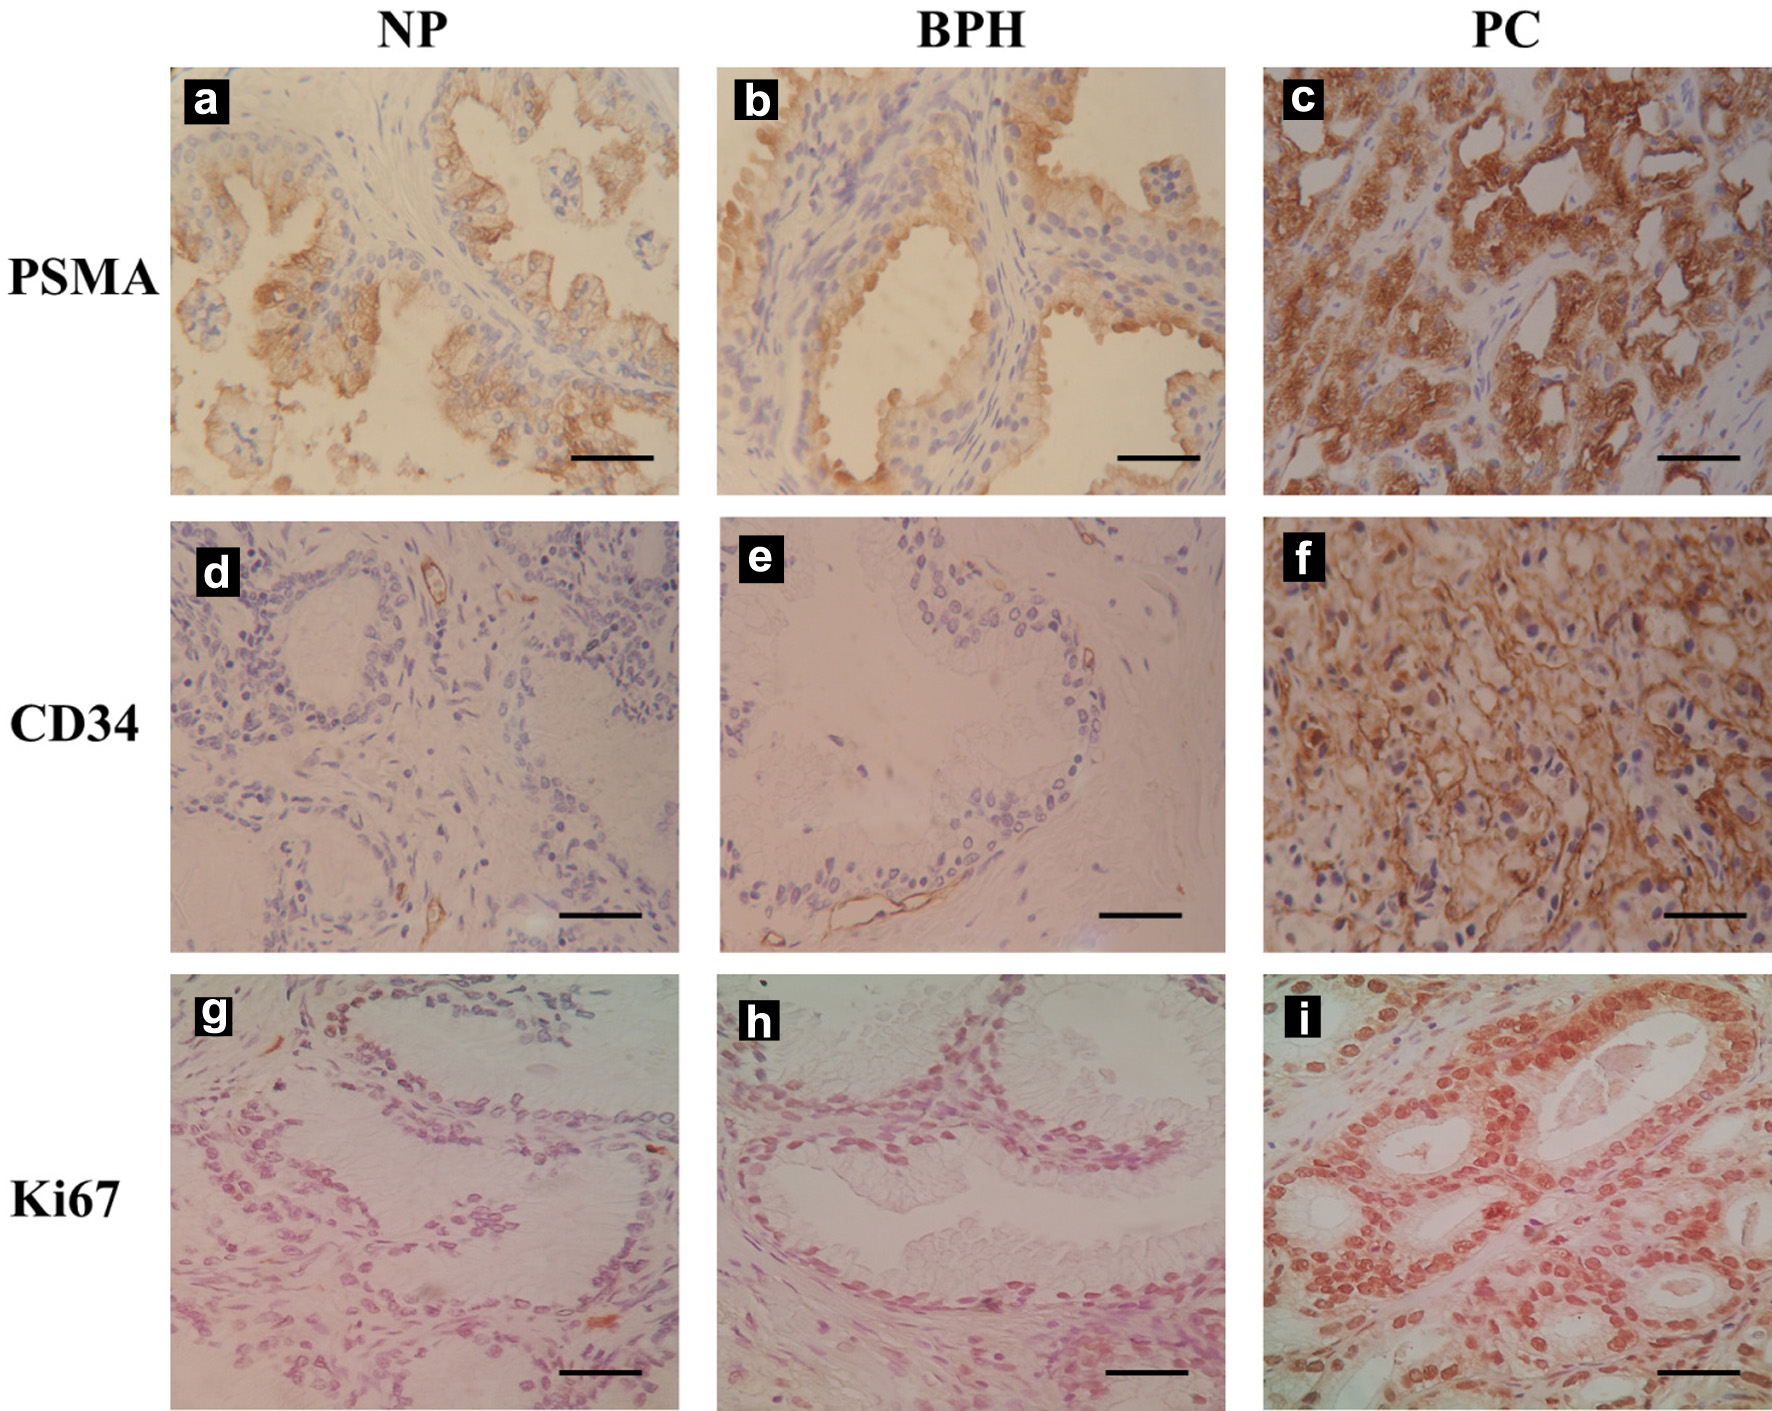
↓ Figure 1. Prostate-specific membrane antigen (PSMA), CD34, and Ki67 immunohistochemical staining patterns in normal prostate (NP), benign prostate hyperplasia (BPH), and prostate cancer (PC). PSMA revealed low to moderate staining in luminal cells of NP (a) and BPH (b), while it exhibited strong cytoplasmic and membranous staining in neoplastic cells of PC samples (c). CD34 showed low to moderate immunoexpression in endothelial cells of NP (d) and BPH (e), whereas strong staining is found in endothelial cells of prostate adenocarcinoma samples (f). Ki67 showed low to moderate expression in the nuclei of cells in NP (g) and BPH (h), while strong staining is observed in nuclei of neoplastic cells in PC tissues (i). Scale bar: 100 µm.
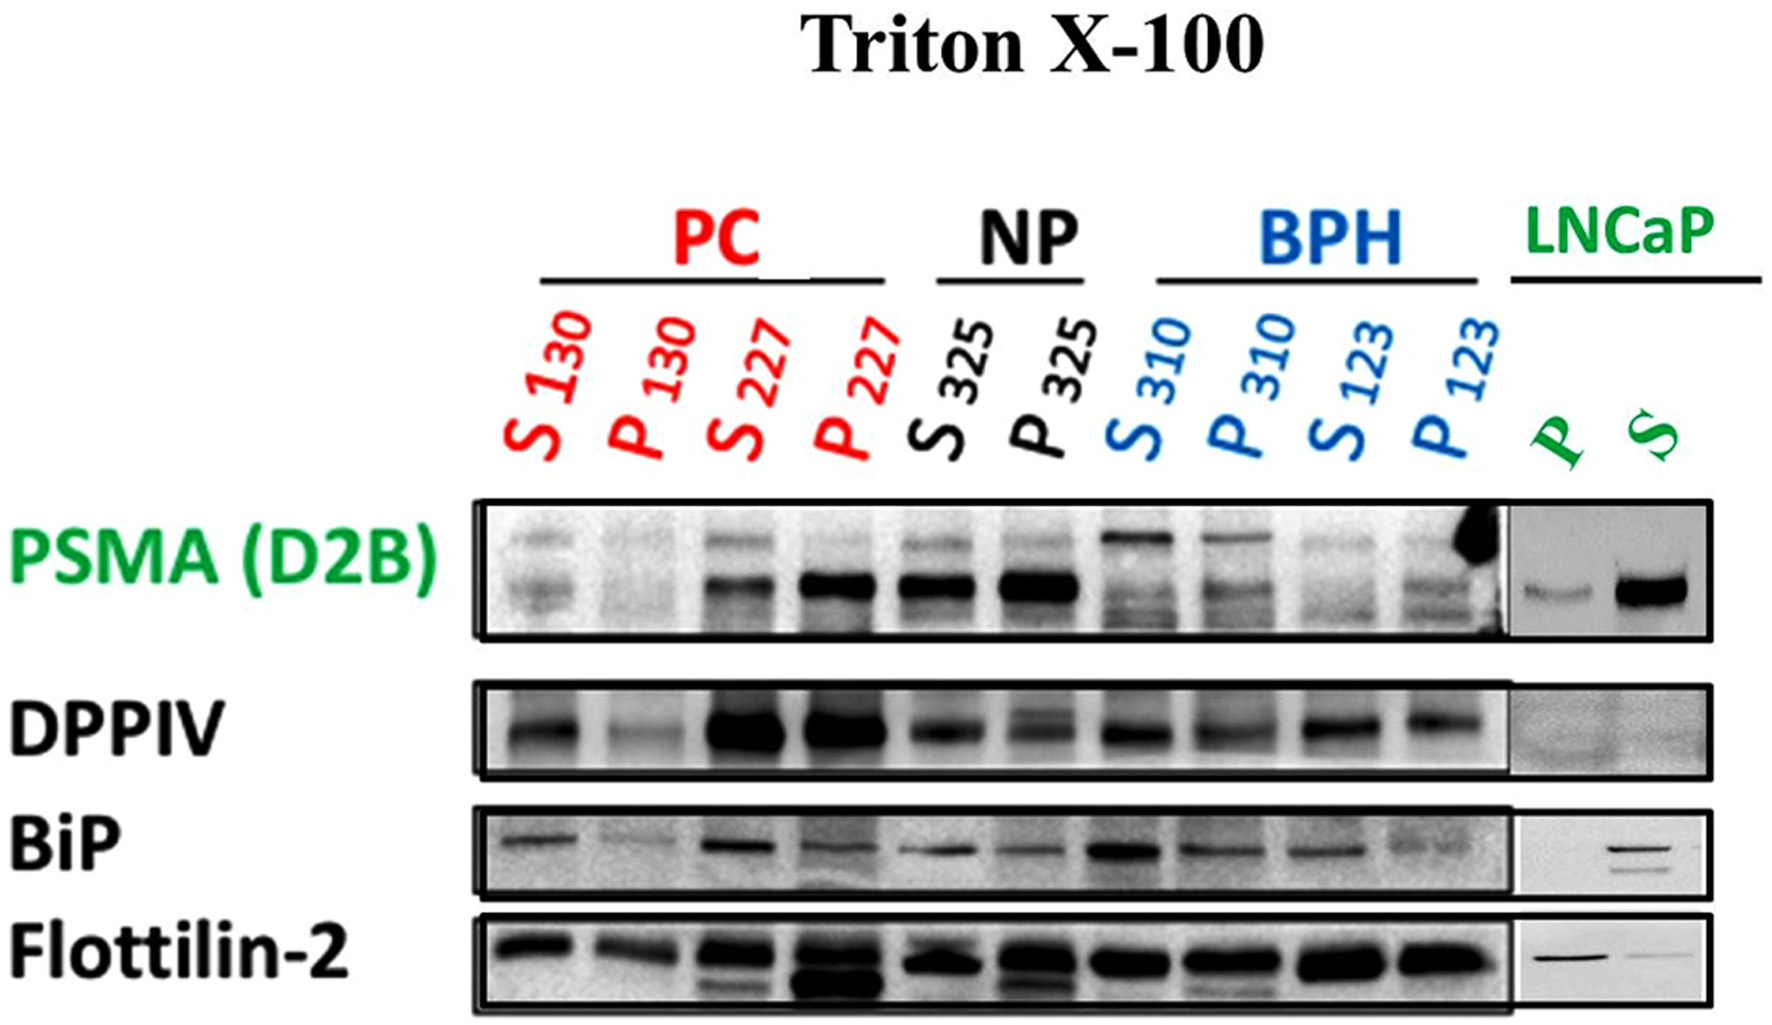
↓ Figure 2. Western blot analysis of prostate-specific membrane antigen (PSMA), dipeptidyl peptidase IV (DPPIV), binding immunoglobulin protein (BiP), and Flottinlin-2 after prostate samples and LNCaP cells were solubilized with 1% Triton X-100 (w/v) in phosphate-buffered saline (PBS). Lysates were subjected to centrifugation at 100,000 × g for 90 min in order to separate the insoluble (P) detergent-resistant membrane (DRM)-fraction and the soluble (S) material. After centrifugation the insoluble fraction (P) was solubilized with a lysis-buffer containing 0.5% (w/v) Triton X-100 and 0.5% (w/v) sodium-deoxycholate. Equal amounts of total protein loaded for each lane on 8% polyacrylamide gel electrophoresis. The lanes showing a band correspond to a positively stained prostate of each group. NP: normal prostate; BPH: benign prostate hyperplasia; PC: prostate carcinoma; P: pellet (insoluble fraction); S: soluble fraction.
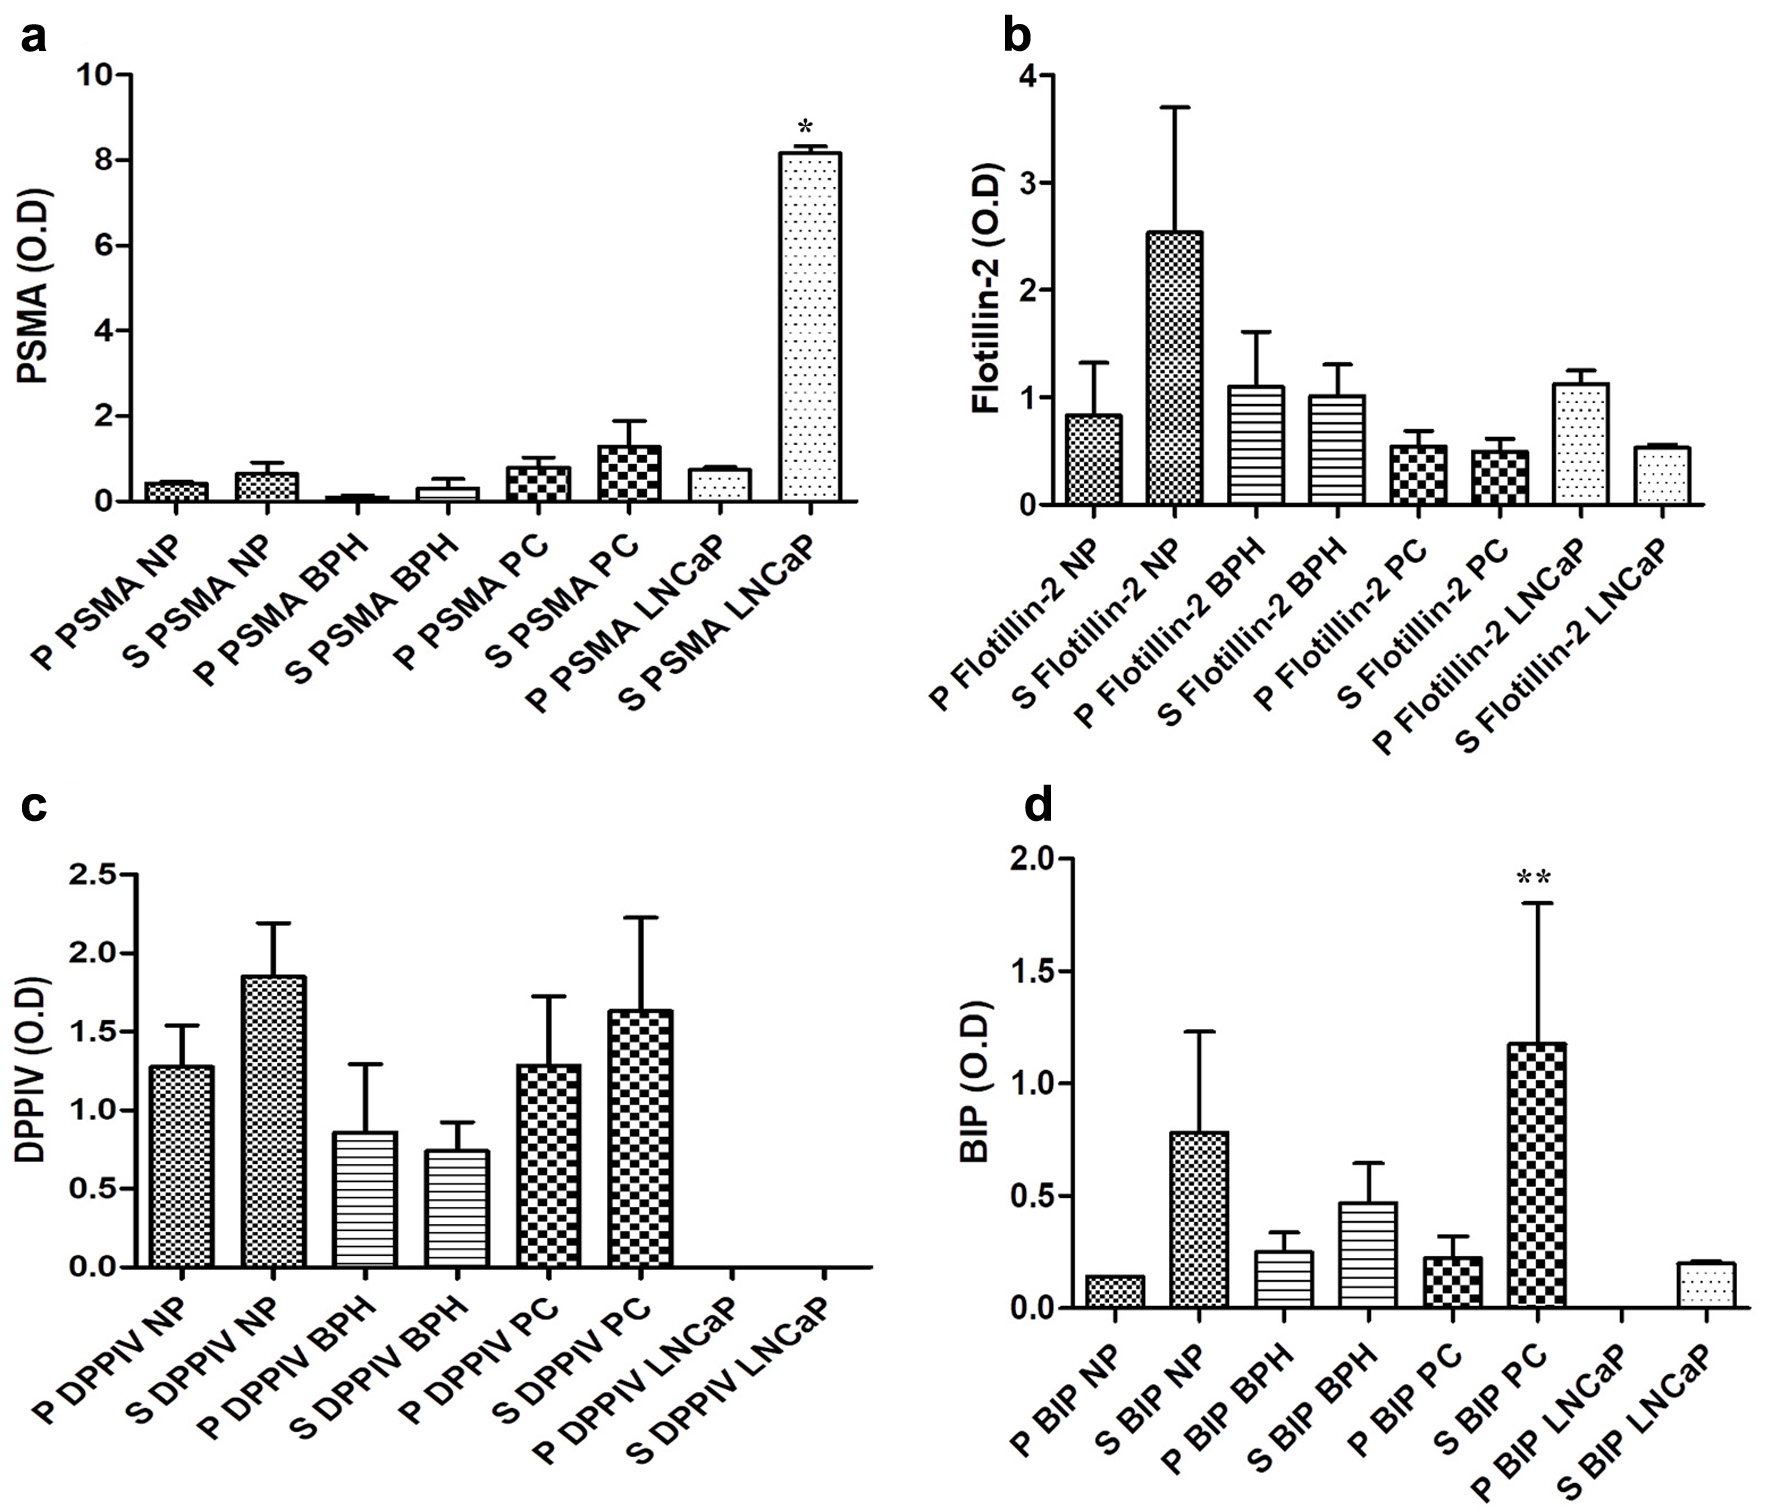
↓ Figure 3. Comparison of immunostaining intensities (measured as average optical density ± standard deviation (SD)) in Western blot analysis in normal prostate (NP), benign prostate hyperplasia (BPH), prostate carcinoma (PC), and LNCaP cells for prostate-specific membrane antigen (PSMA) (a), Flottilin-2 (b), dipeptidyl peptidase IV (DPPIV) (c), and binding immunoglobulin protein (BiP) (d) after prostate samples and LNCaP cells were solubilized with 1% Triton X-100 (w/v) in phosphate-buffered saline (PBS). Average optical densities were evaluated only in patients showing positive immunoreactions. P: pellet; S: supernatant. Significance was accepted when P < 0.05. *P < 0.05, **P < 0.01.