Figures
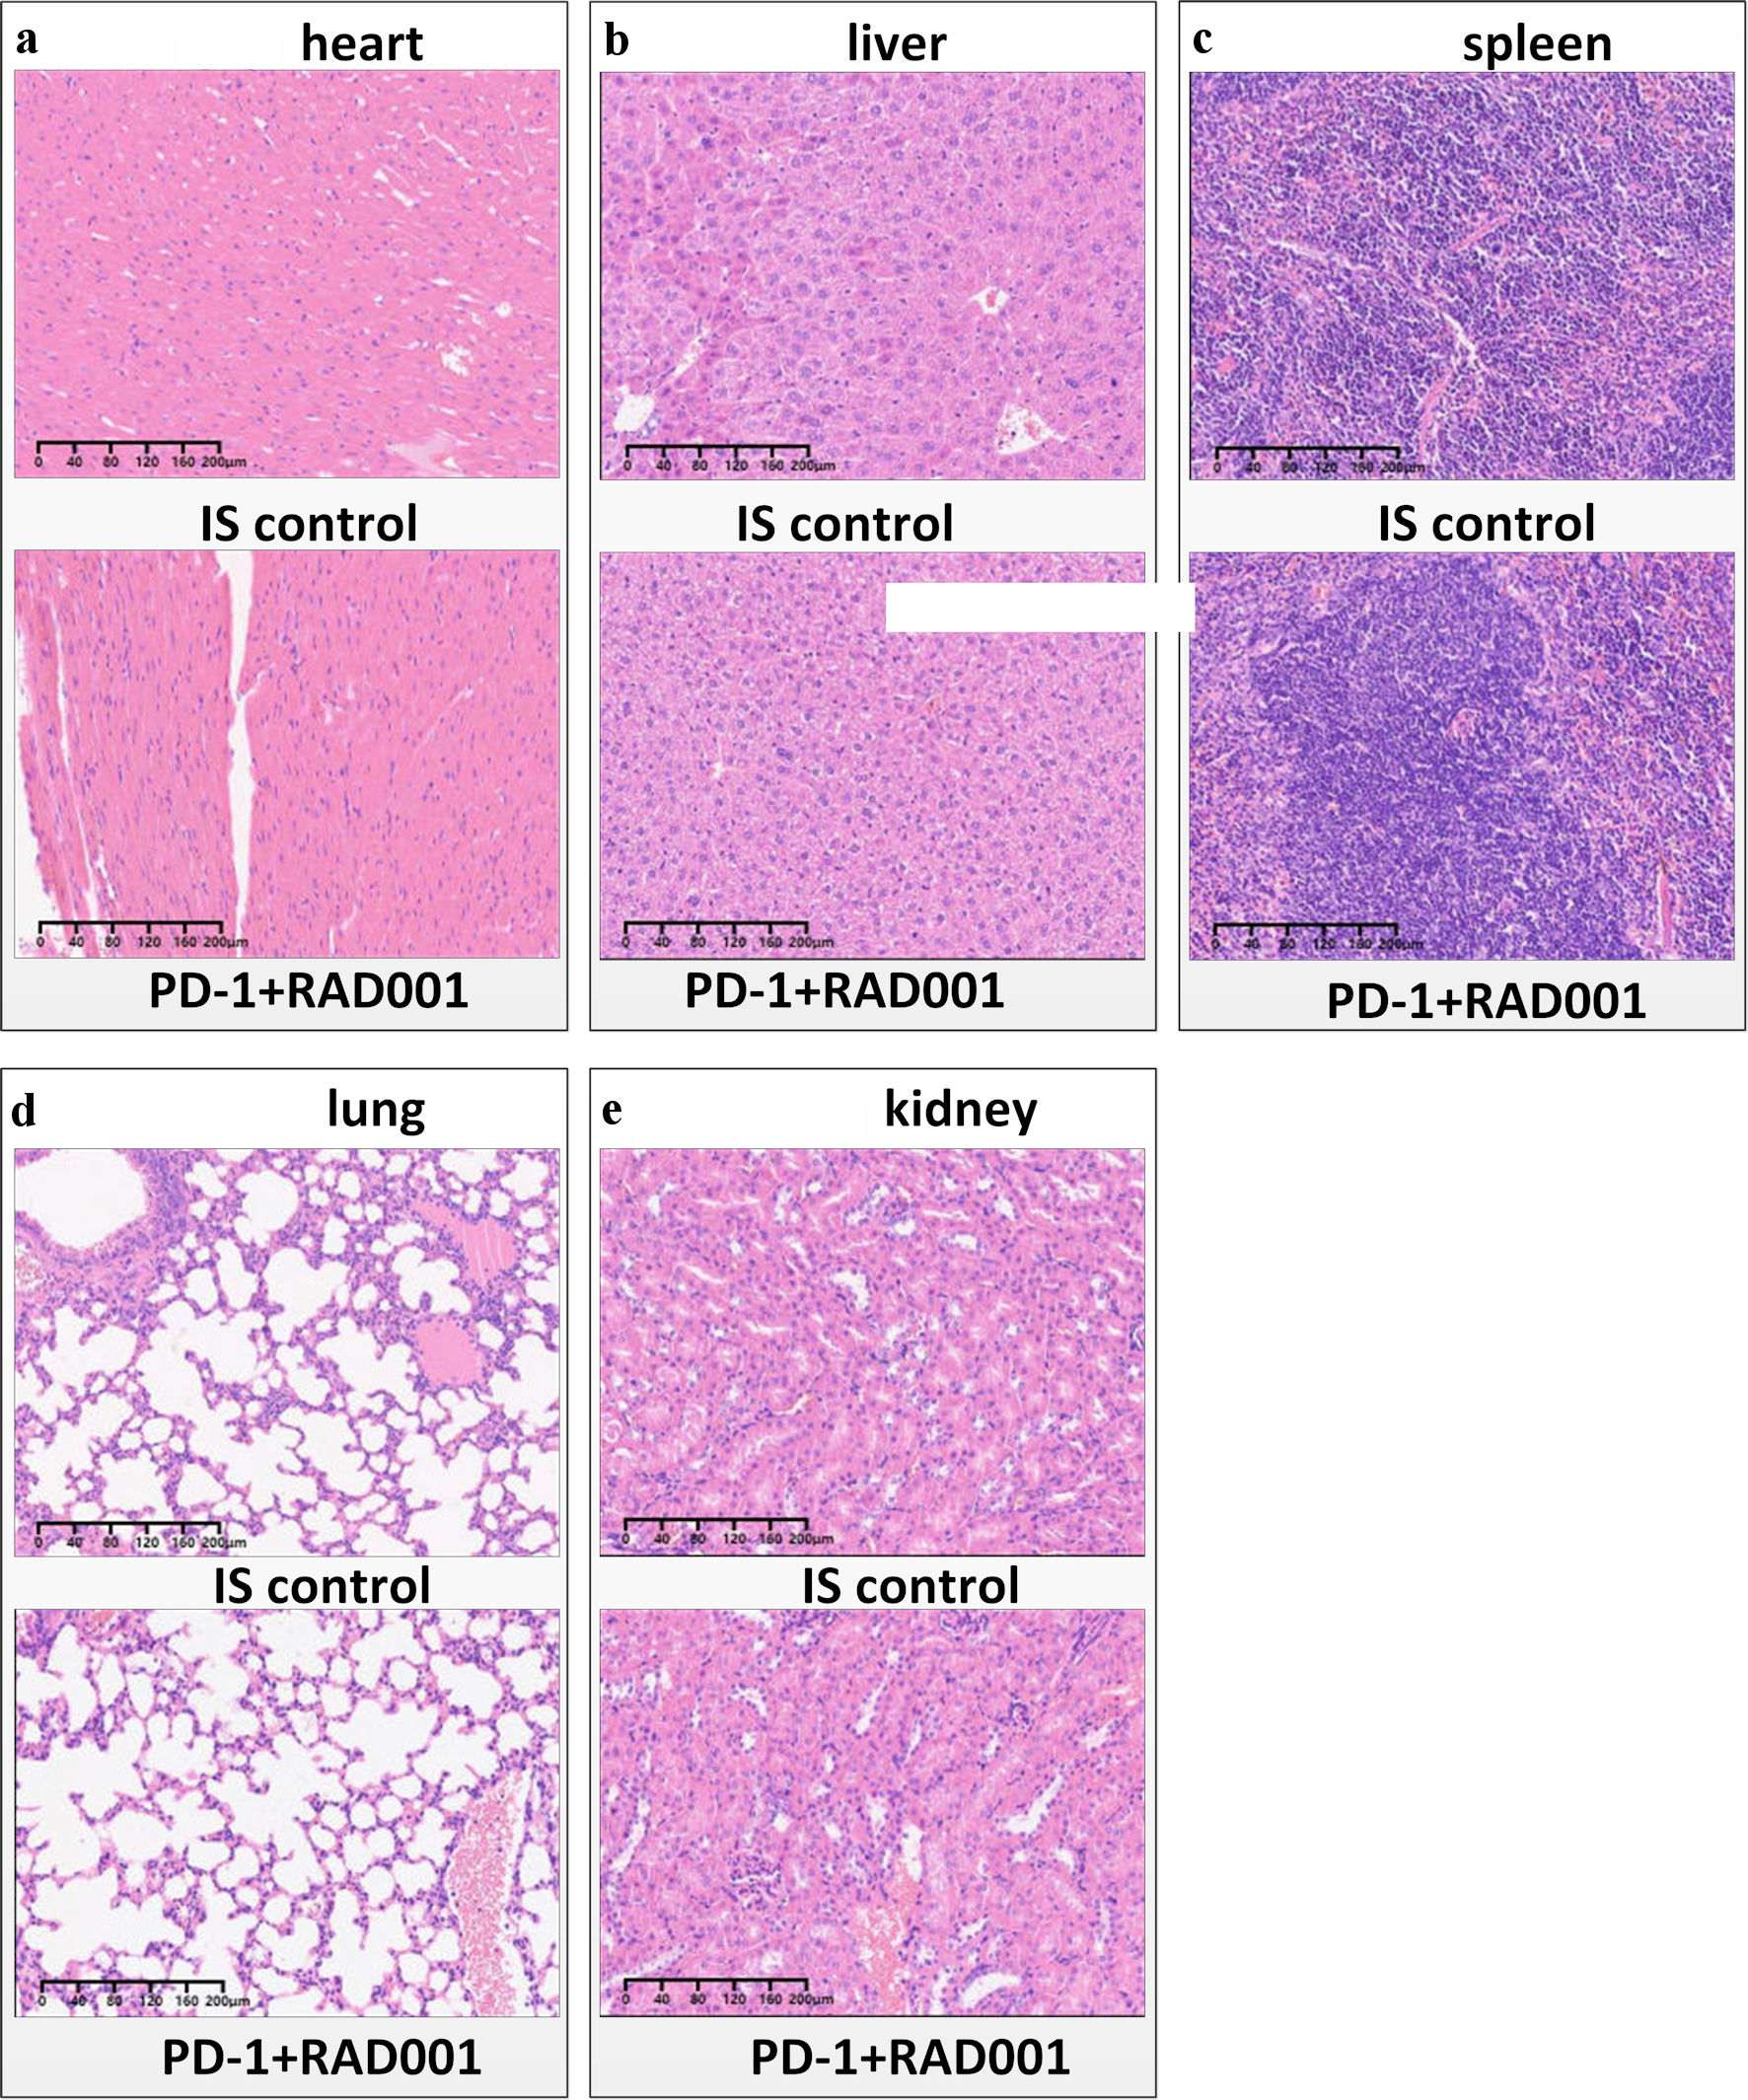
↓ Figure 1. Safety profile of combination therapy. Representative H&E stained sections of heart (a) liver (b), spleen (c) lung (d), and kidney (e) tissues from mice in the RAD001-Vax combination treatment group and control groups at the end of the study are shown. IS control stands for the isotype control. No significant histopathological abnormalities or evidence of immune-mediated tissue damage were observed. H&E: hematoxylin and eosin.
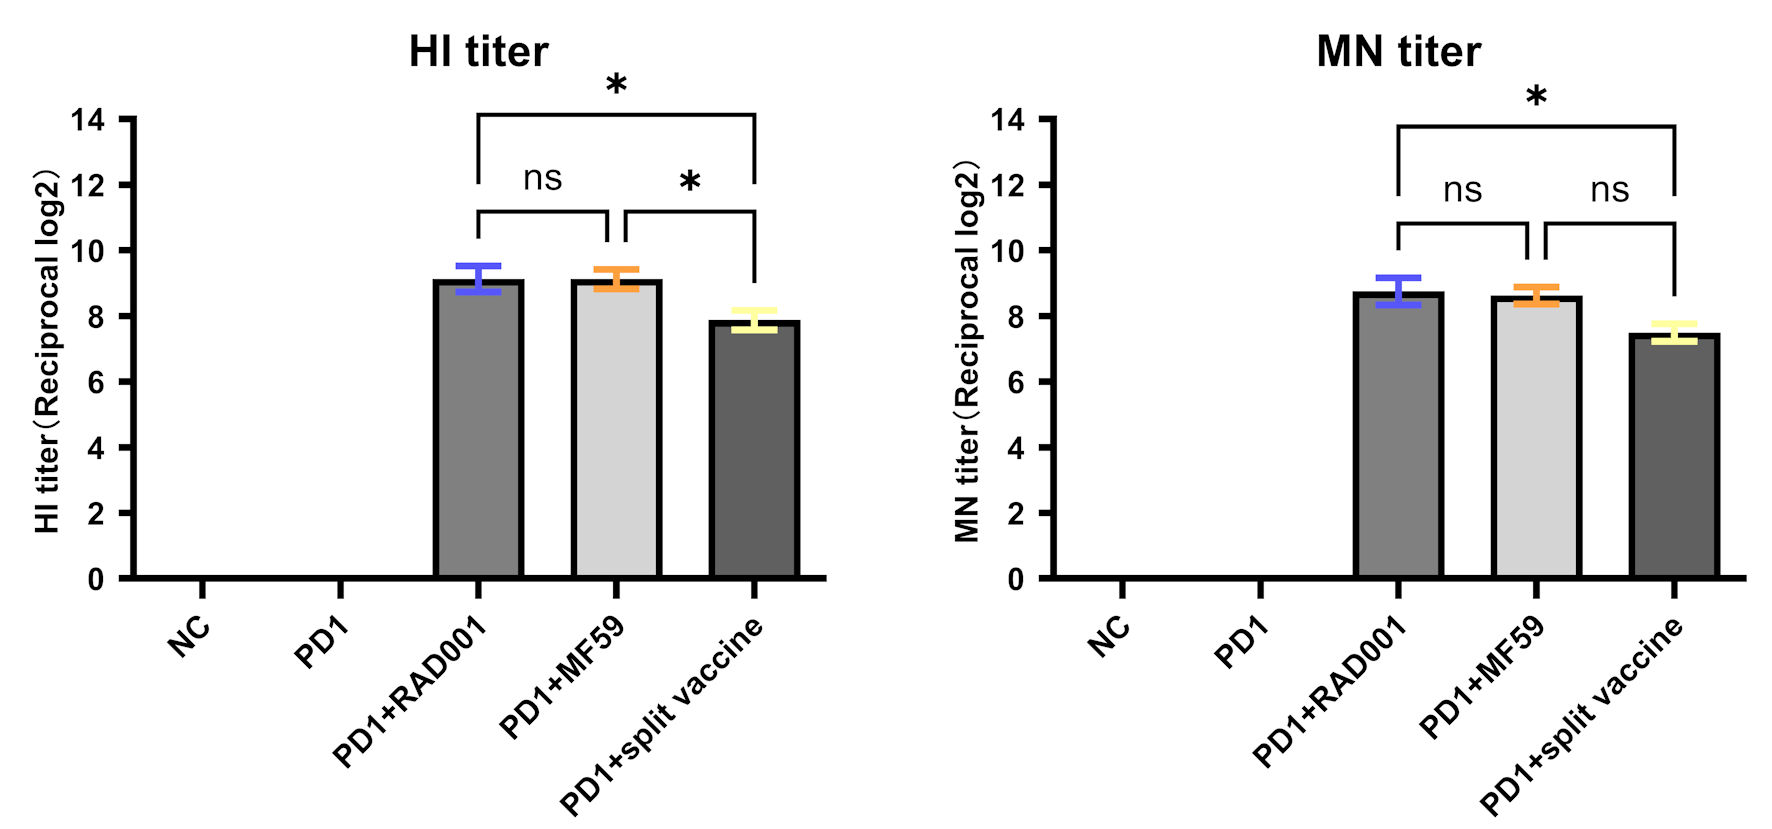
↓ Figure 2. Antibody responses induced by different vaccine formulations. Hemagglutination inhibition (HI) (a) and microneutralization (MN) (b) antibody titers were determined for all five experimental groups. Data are presented as geometric mean titers (GMT) for each group (n = 8 mice per group). Mice received intramuscular injections of the following formulations: group 1, rat IgG2a isotype control antibody; group 2, anti-PD-1 antibody; group 3, anti-PD-1 antibody plus split influenza vaccine; group 4, anti-PD-1 antibody plus MF59-adjuvanted split influenza vaccine; and group 5, anti-PD-1 antibody plus RAD001-adjuvanted split influenza vaccine. *Indicates a statistically significant difference (P < 0.05), and ns indicates no significant difference (P ≥ 0.05). PD-1: programmed cell death protein 1; NC: negative control; IgG: immunoglobulin G.
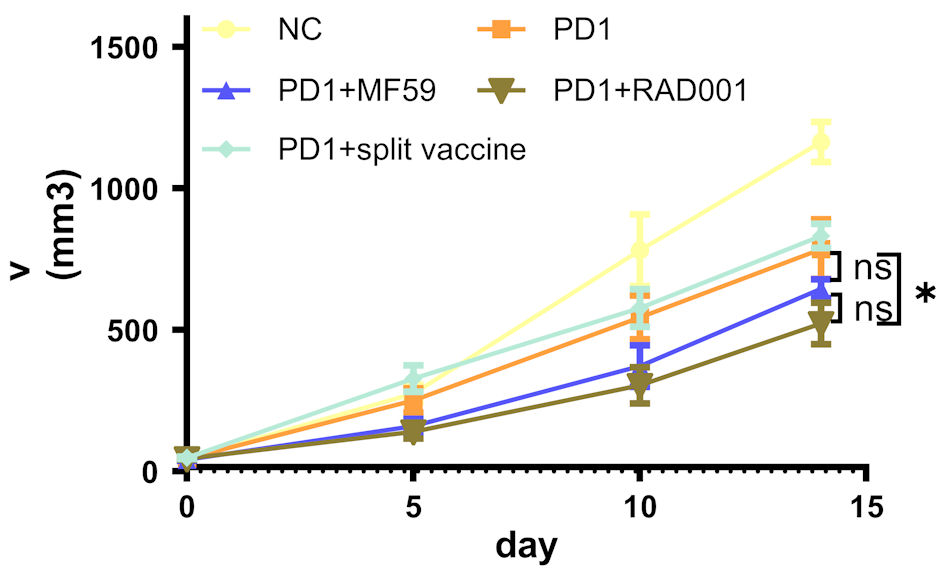
↓ Figure 3. Tumor growth kinetics in mice treated with different vaccine formulations. Tumor volumes were measured in five experimental groups: control, anti-PD-1, anti-PD-1 + split vaccine, anti-PD-1 + RAD001, and anti-PD-1 + MF59. Day 0 represents the first vaccine administration, and tumor growth is presented relative to this time point. Data are shown as mean ± SEM with individual measurements indicated. Statistical analysis was performed using two-way repeated-measures ANOVA followed by Tukey’s multiple comparisons test. Differences between groups are presented as indicated. *Indicates a statistically significant difference (P < 0.05), and ns indicates no significant difference (P ≥ 0.05). NC: negative control; PD-1: programmed cell death protein 1; SEM: standard error of the mean; ANOVA: analysis of variance.
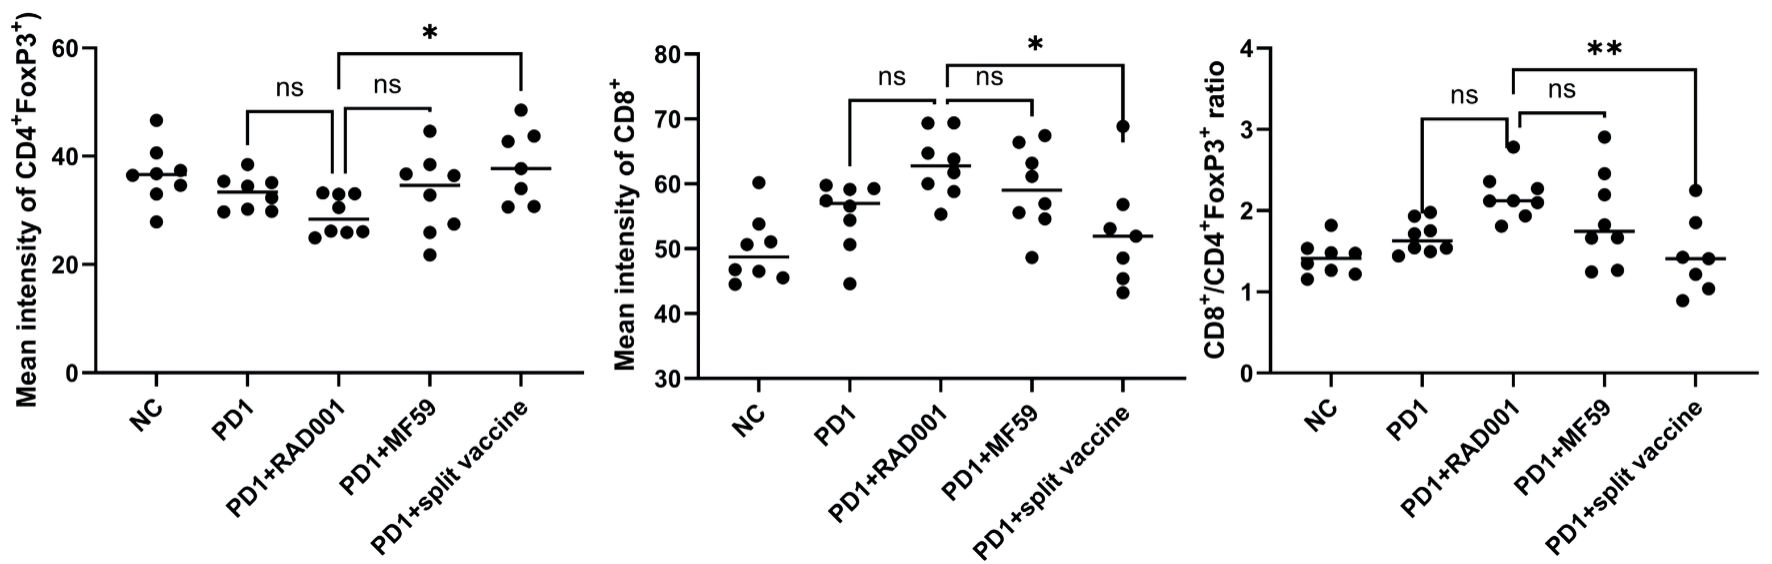
↓ Figure 4. Immunophenotyping of tumor-infiltrating lymphocytes (day 14). The percentage of regulatory T cells (Tregs; FoxP3+ within CD4+ T cells; left), CD8+ T cells (middle), and the CD8+/Treg ratio (right) are shown. Data are presented as mean ± SEM (n = 8 mice per group), with individual values indicated. *Indicates a statistically significant difference (P < 0.05), **P < 0.01, and ns indicates no significant difference (P ≥ 0.05). SEM: standard error of the mean; NC: negative control; PD-1: programmed cell death protein 1.
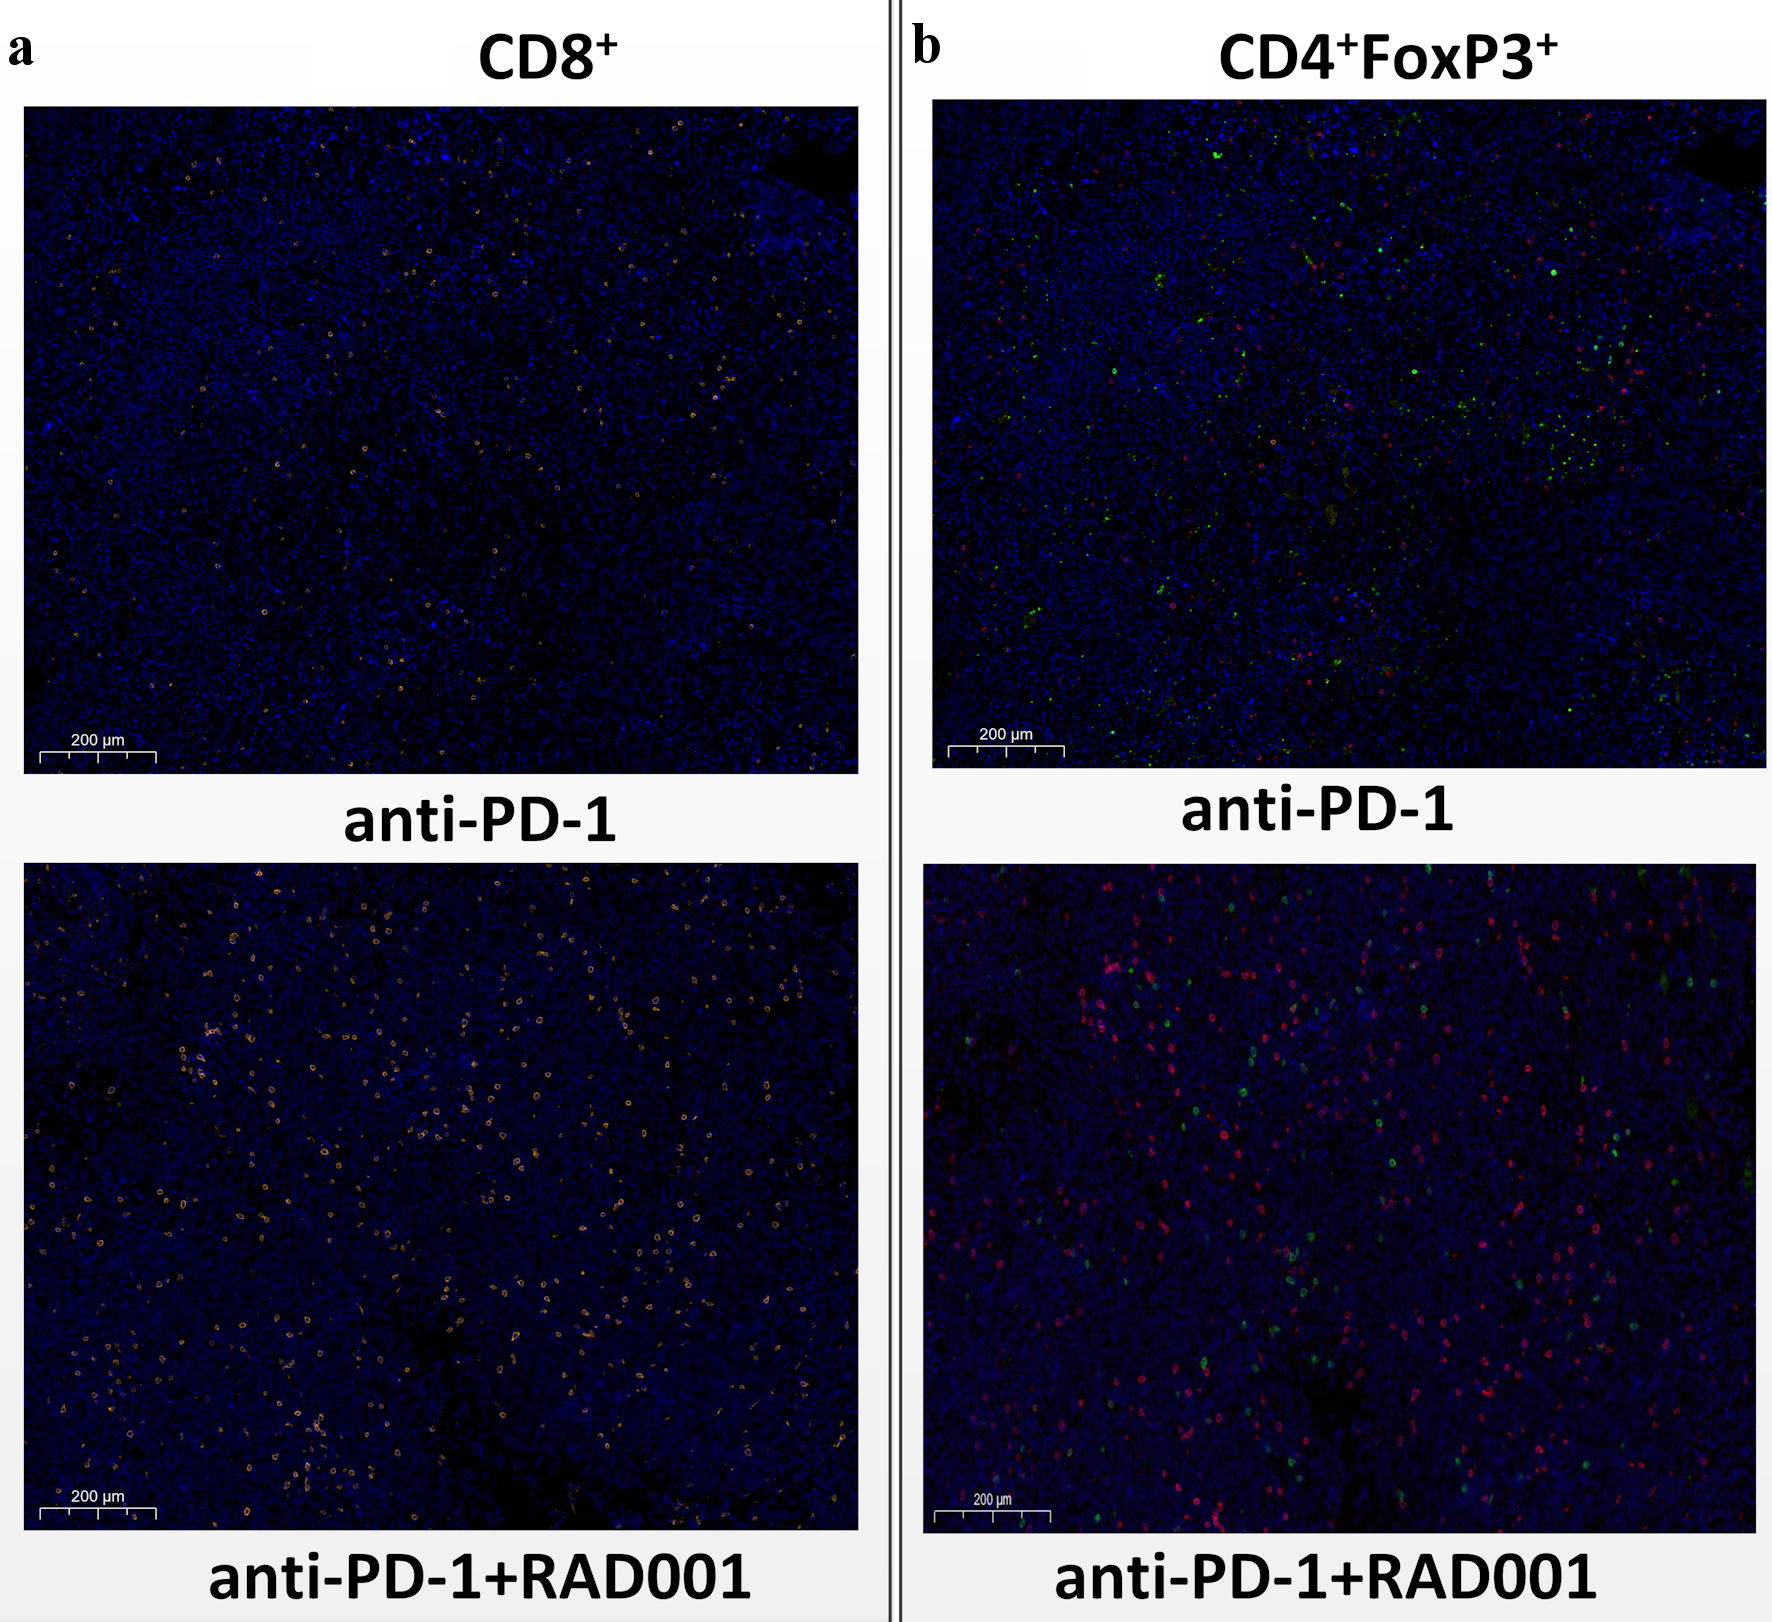
↓ Figure 5. Representative immunofluorescence analysis of tumor-infiltrating lymphocytes (day 14). Representative immunofluorescence images showing DAPI (blue), CD8 (orange), FoxP3 (red), and CD4 (green) staining in tumor tissues from mice treated with anti-PD-1 alone or in combination with RAD001-adjuvanted split influenza vaccine. Differences in immune cell distribution can be observed across treatment groups. PD-1: programmed cell death protein 1.
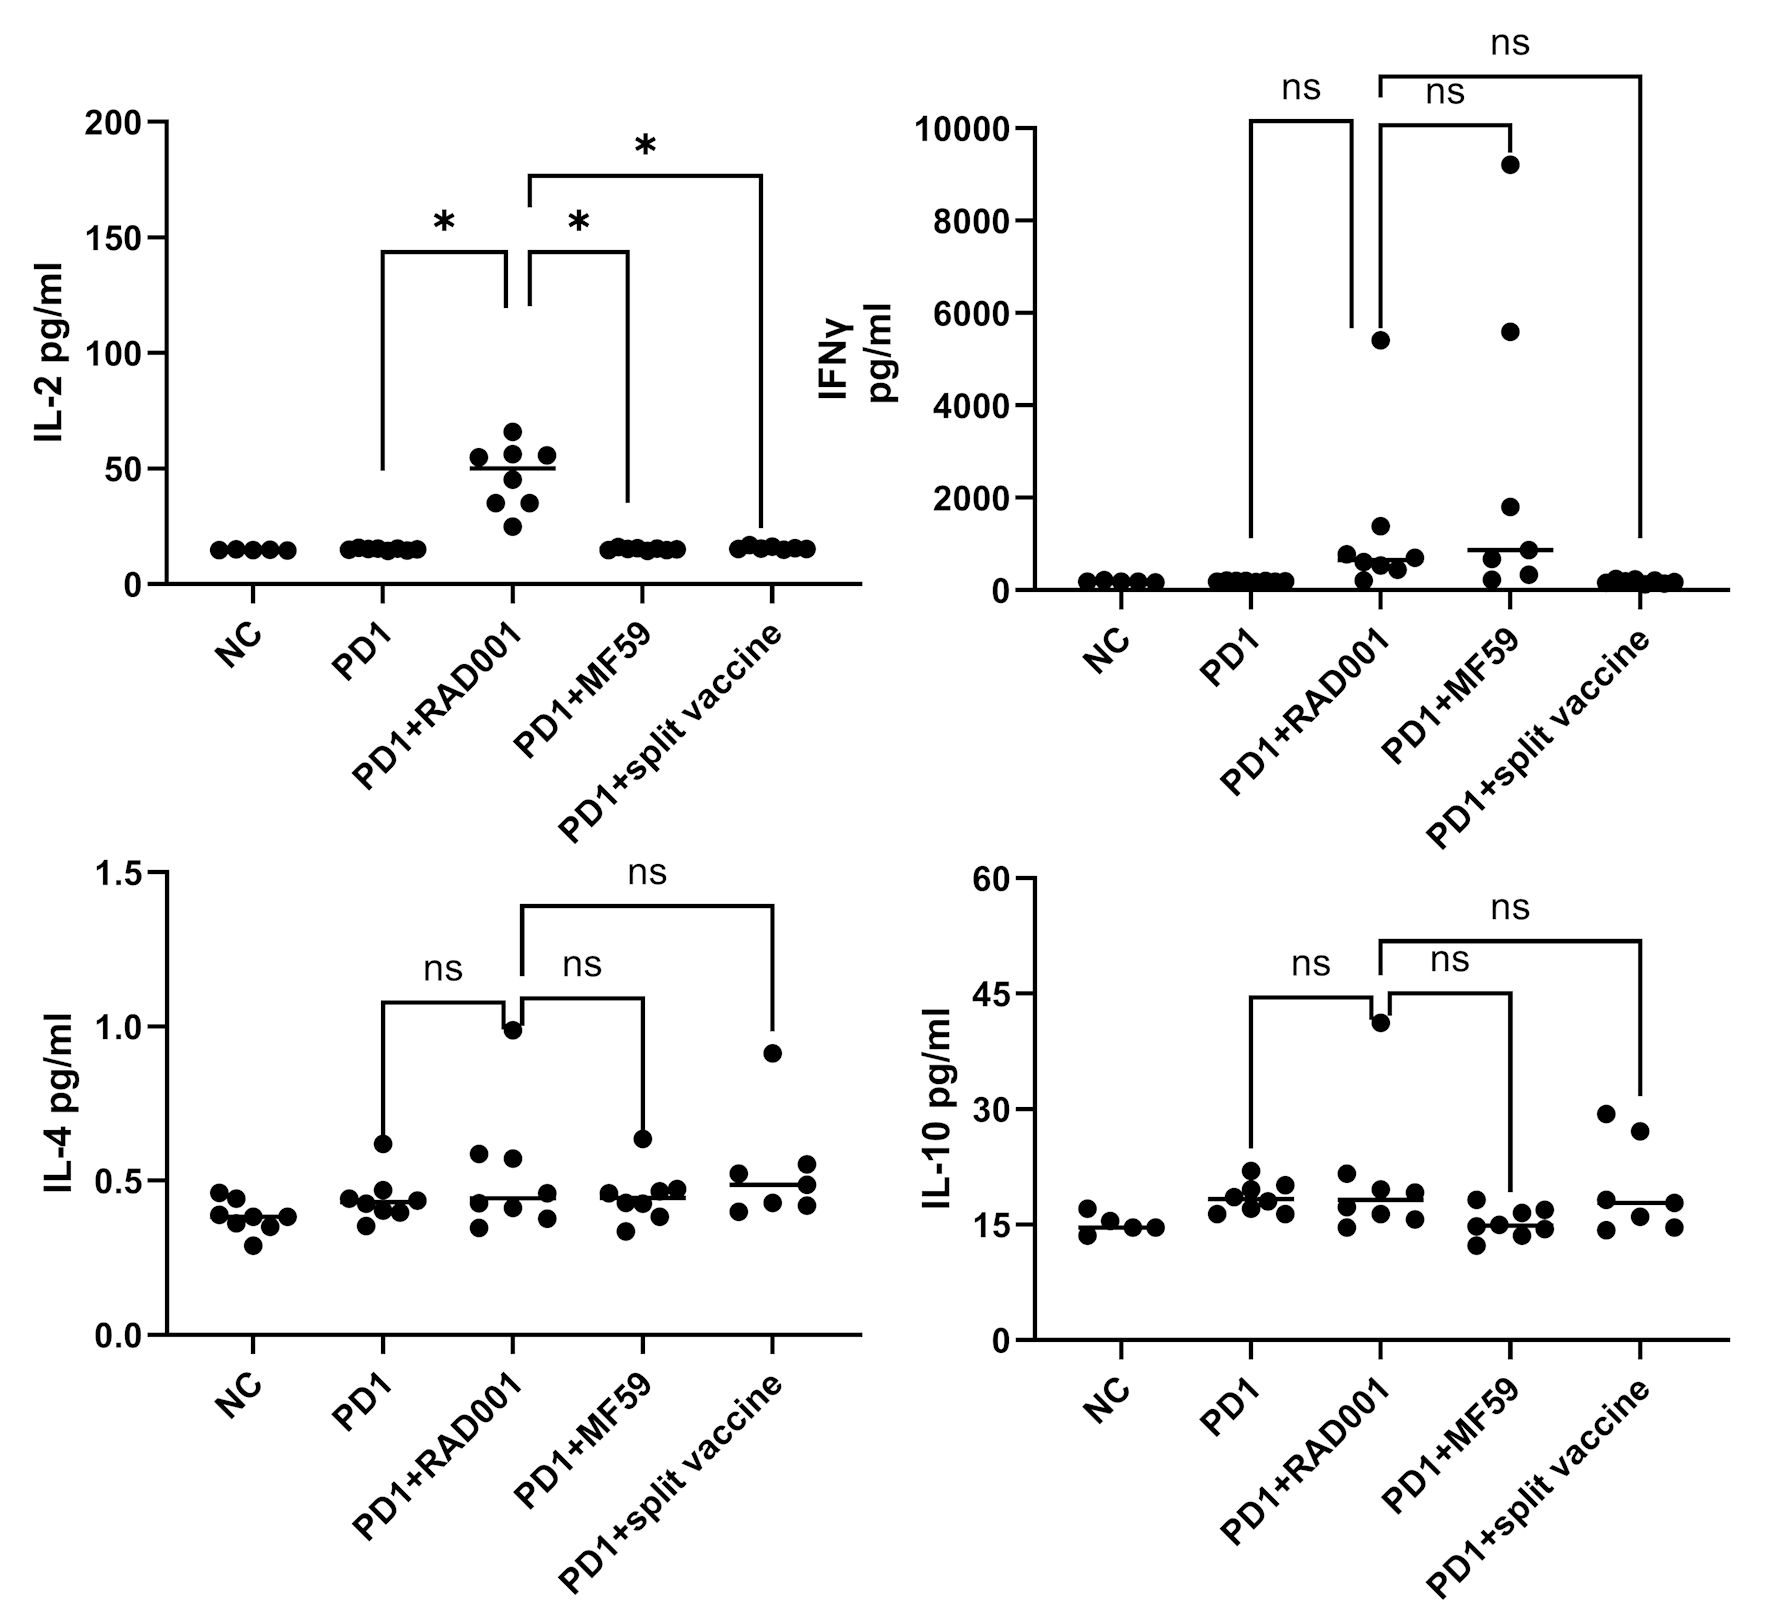
↓ Figure 6. Serum cytokine profile. Serum levels of Th1 cytokines (IFN-γ and IL-2) and Th2-associated immunosuppressive cytokines (IL-4 and IL-10) were measured by ELISA on day 14. Data are presented as mean ± SEM (n = 8 mice per group). *Indicates a statistically significant difference (P < 0.05), and ns indicates no significant difference (P ≥ 0.05). IL: interleukin; IFN: interferon; SEM: standard error of the mean; NC: negative control; ELISA: enzyme-linked immunosorbent assay.
↓ Figure 7. Enriched signaling pathways associated with combination therapy. Pathway enrichment analysis based on cytokine detection results demonstrated that several immune-related signaling pathways were enriched in the PD-1 + RAD001 adjuvanted split vaccine group compared with the PD-1 monotherapy group. PD-1: programmed cell death protein 1.
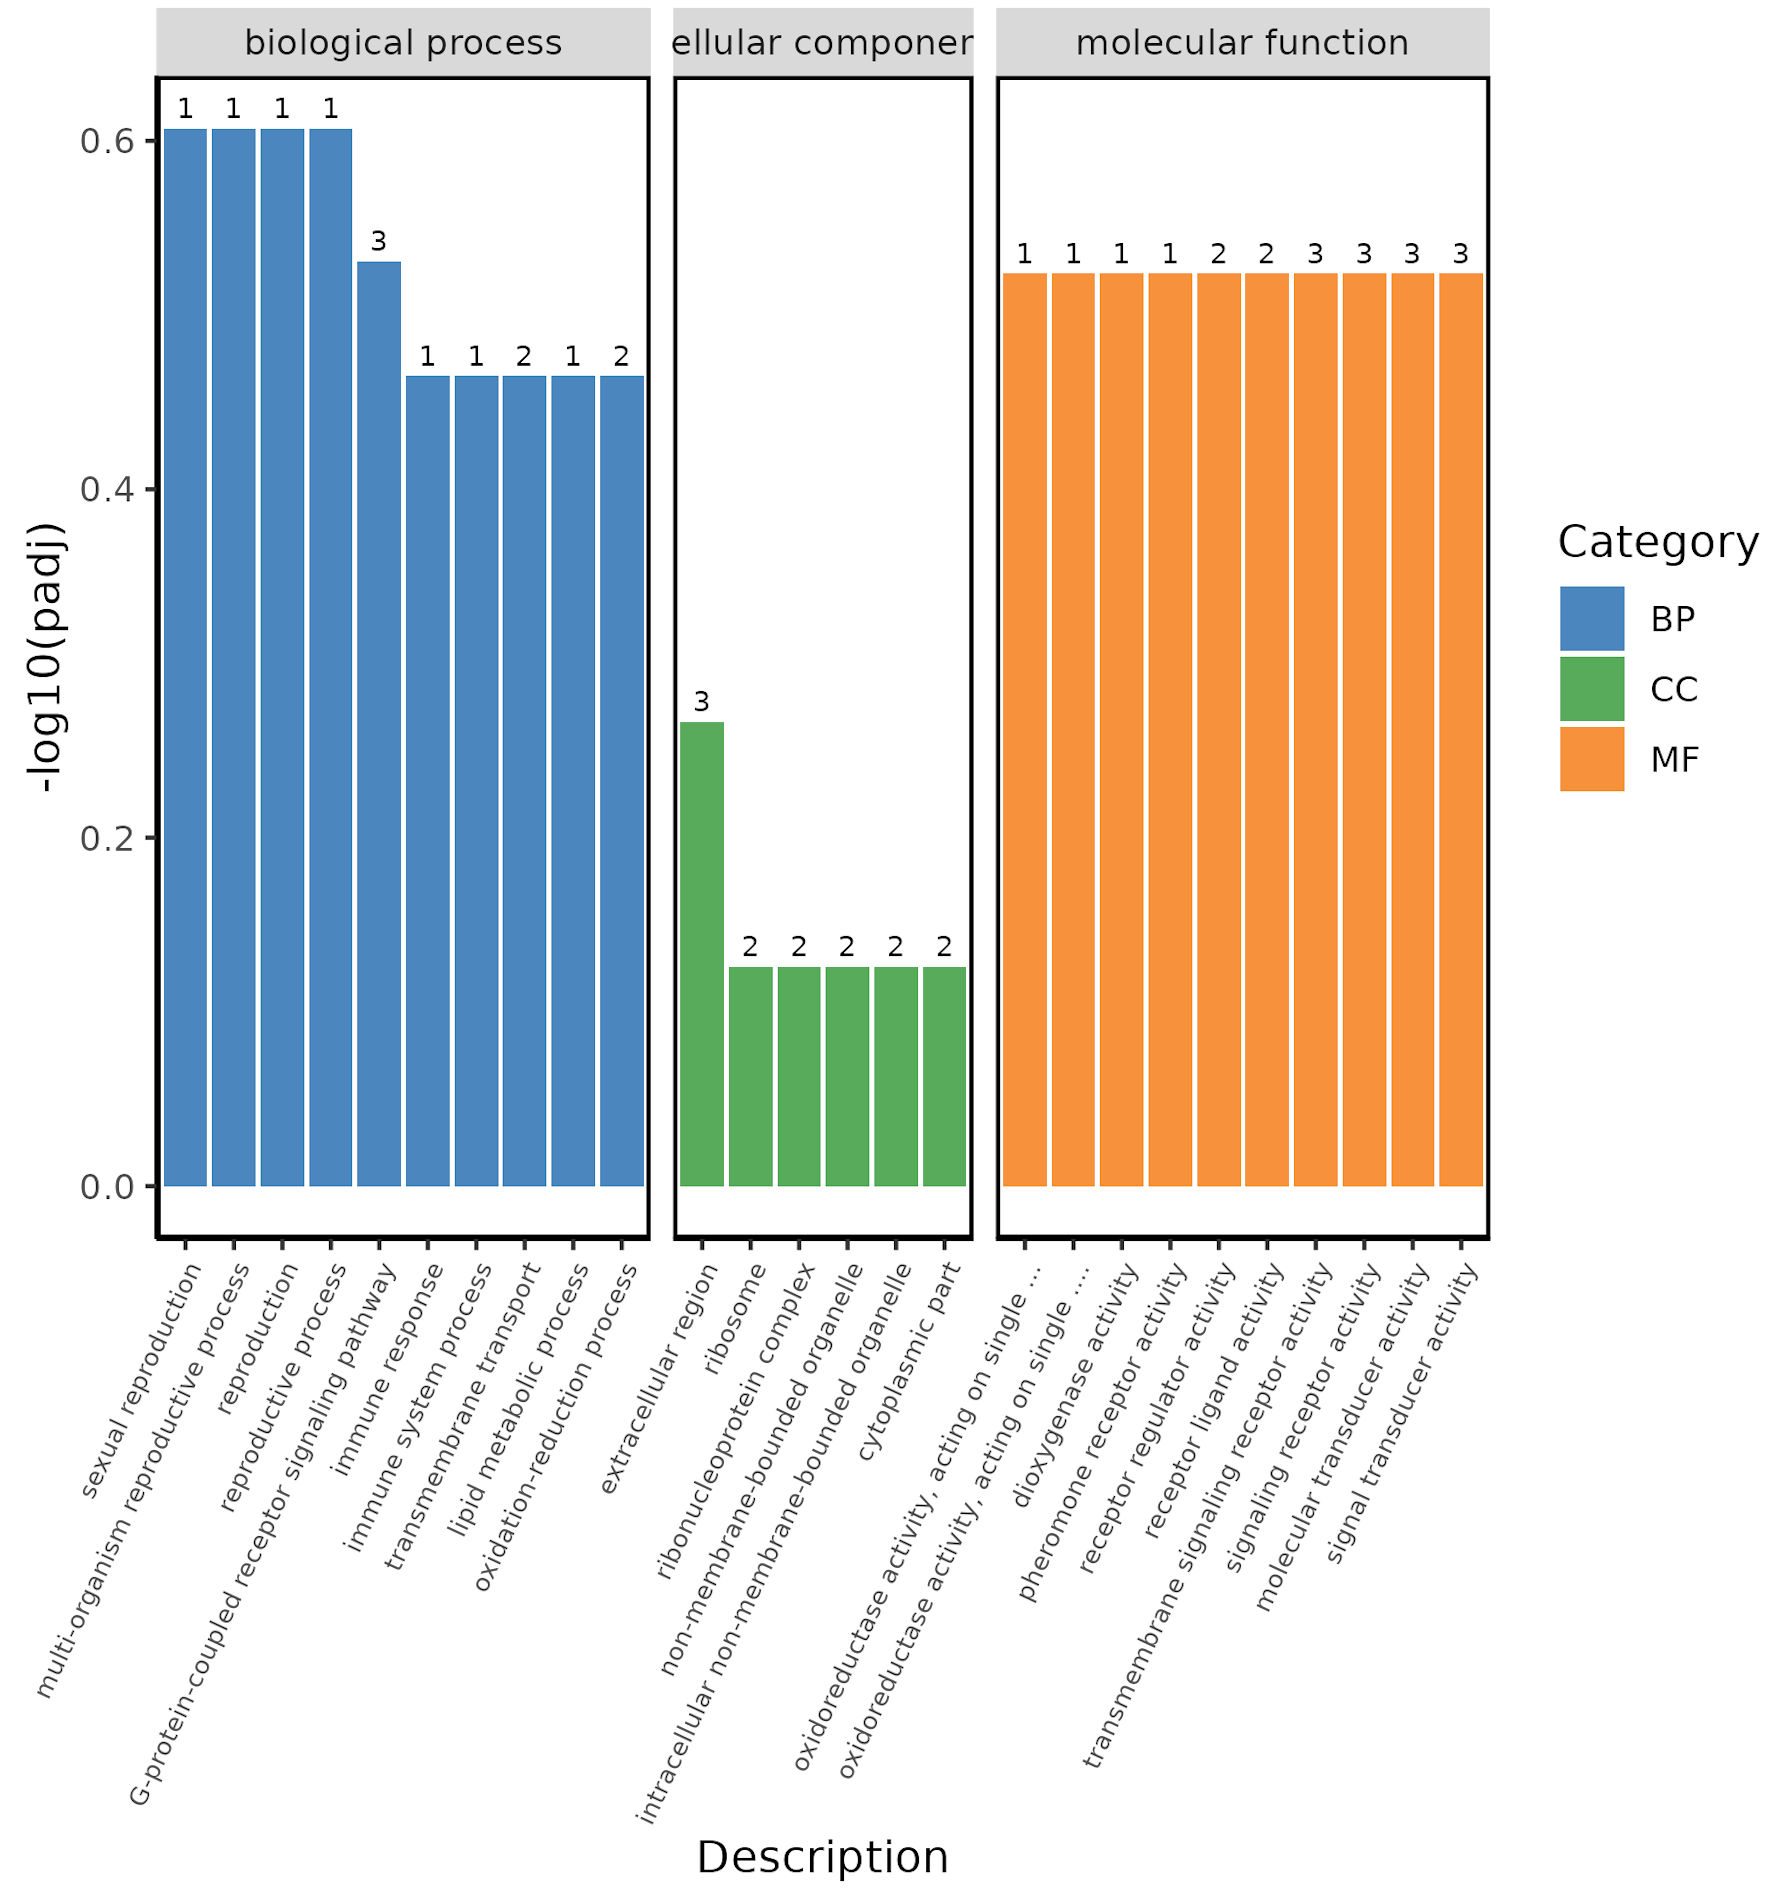
↓ Figure 8. Gene Ontology (GO) enrichment analysis. GO enrichment analysis was performed to categorize differentially expressed genes (DEGs) between the RAD001-adjuvanted vaccine group and the anti-PD-1 therapy group into biological processes (BP), cellular components (CC), and molecular functions (MF).
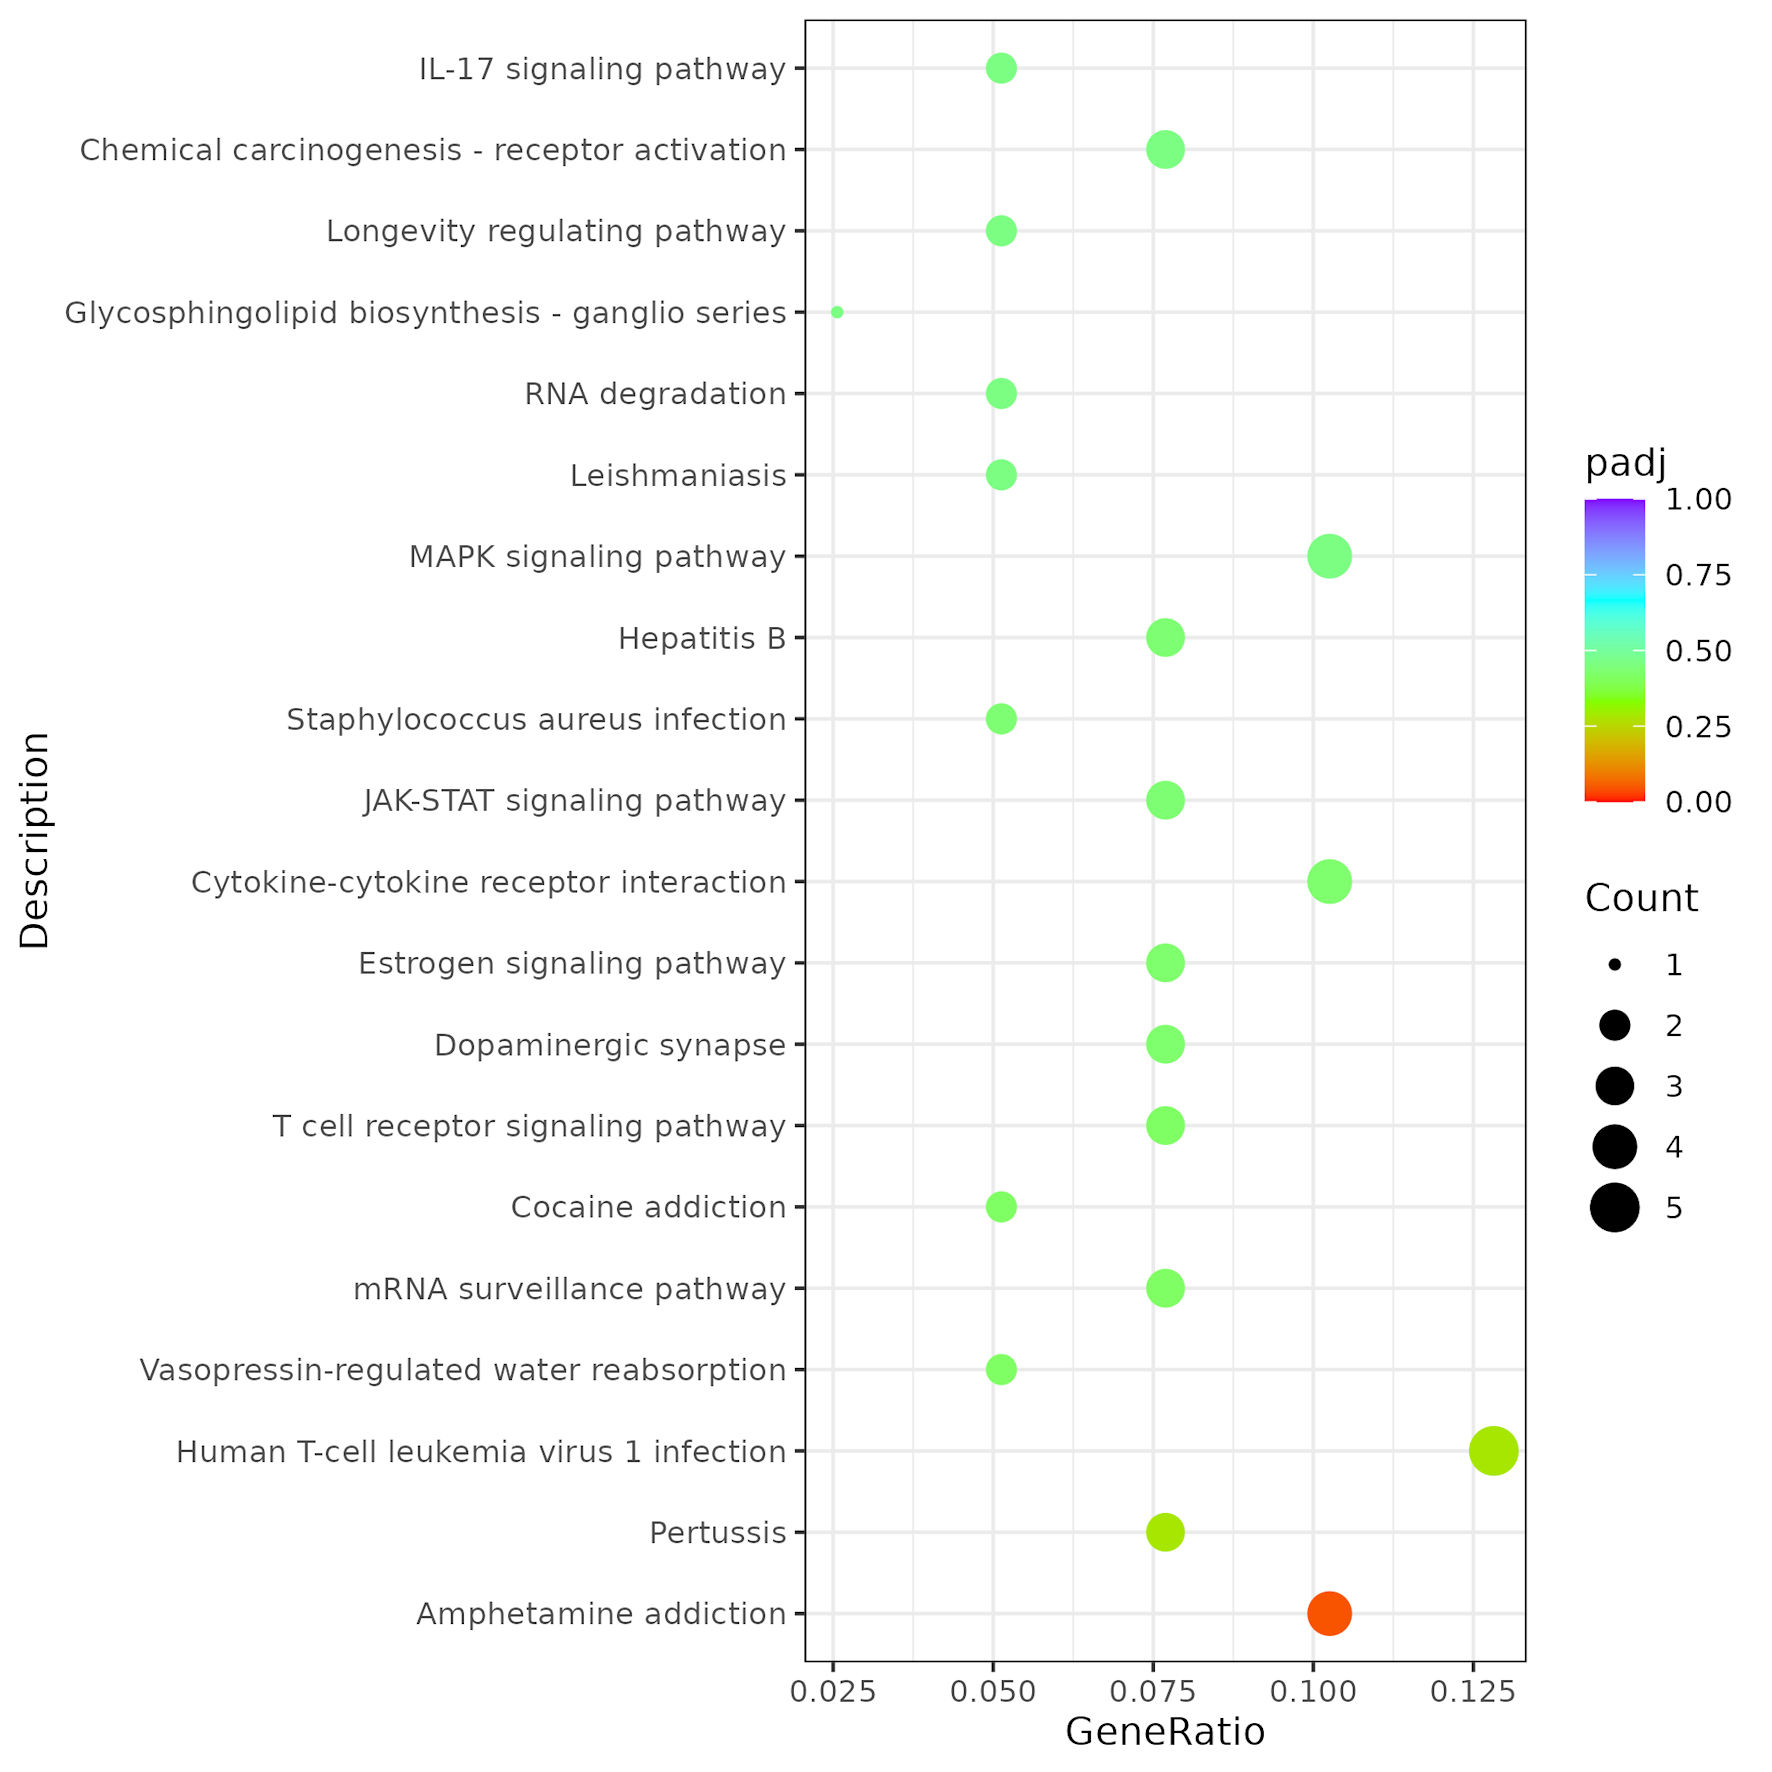
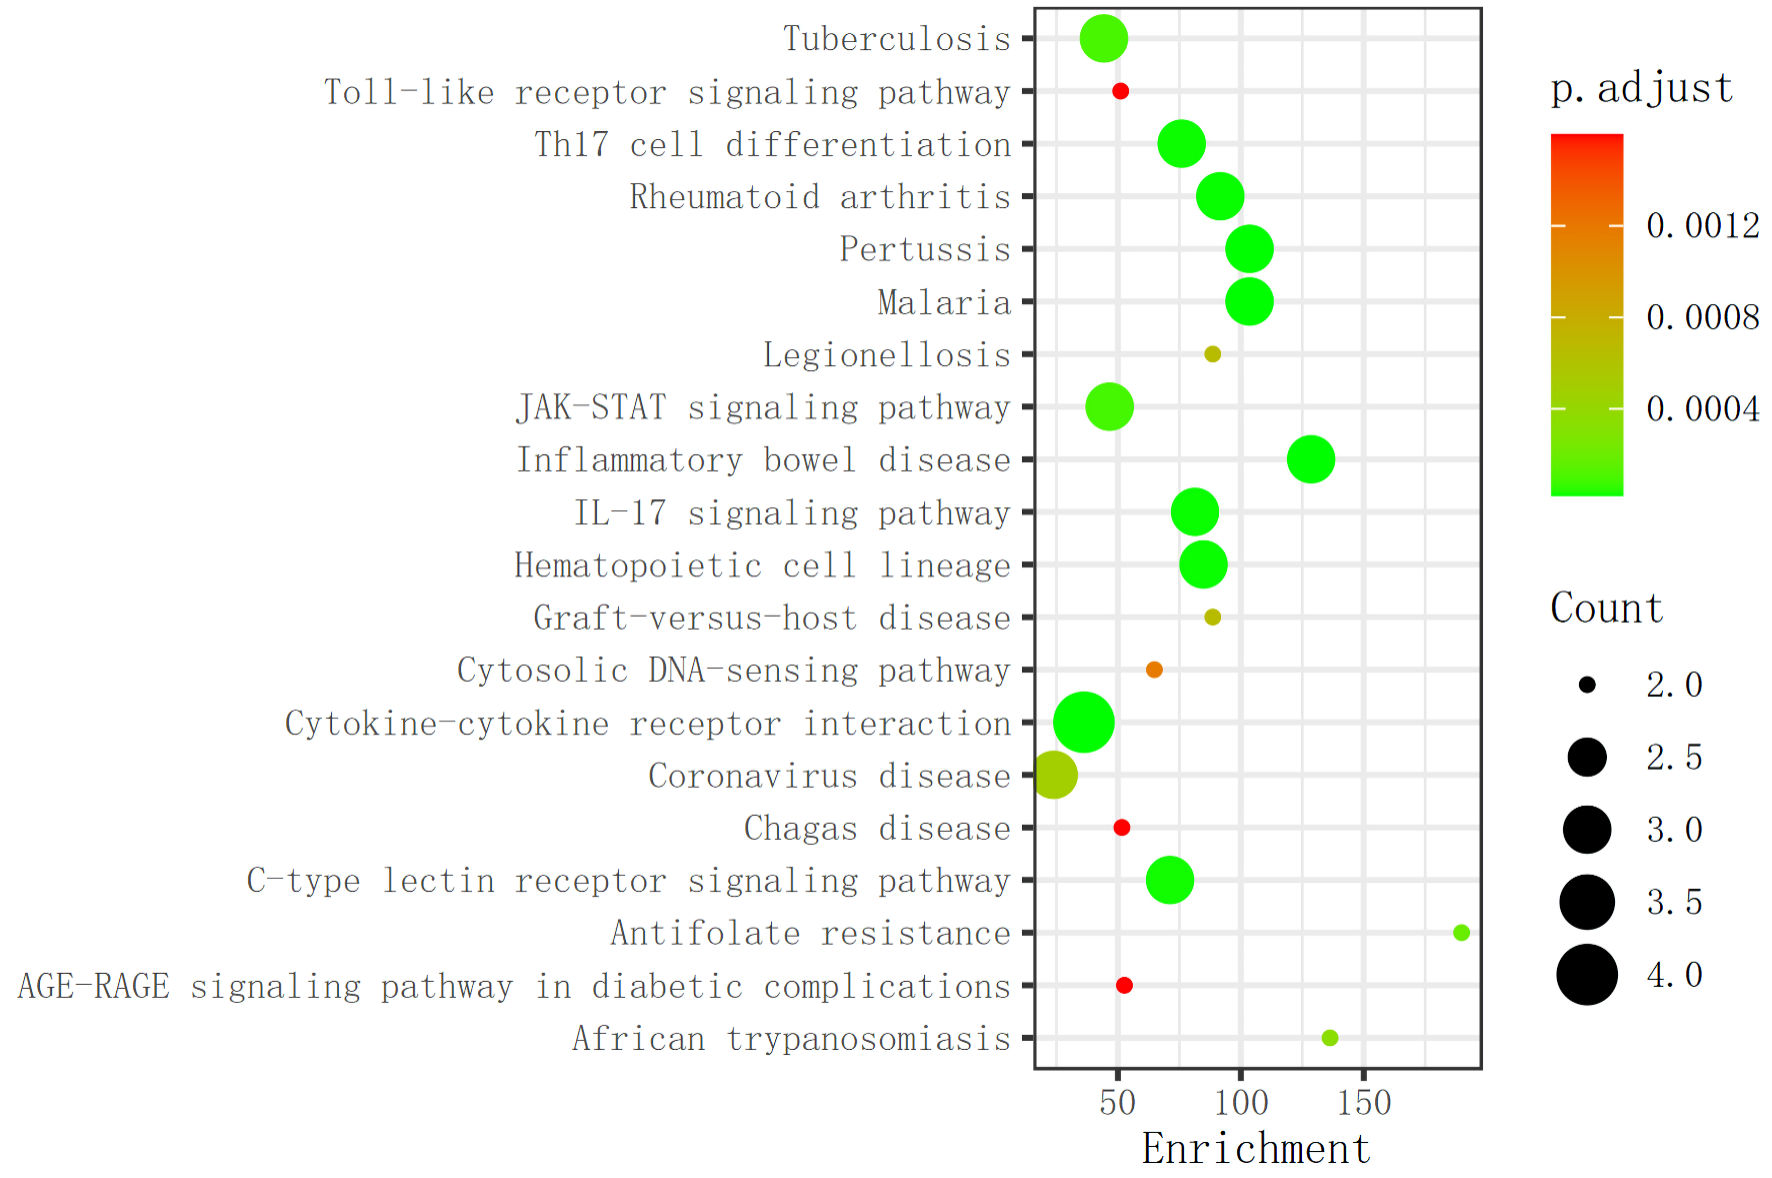
↓ Figure 9. Kyoto Encyclopedia of Genes and Genomes (KEGG) pathway analysis. KEGG enrichment analysis was conducted to identify the top 20 signaling pathways enriched among differentially expressed mRNAs between the RAD001-adjuvanted influenza vaccine group and the anti-PD-1 therapy group. PD-1: programmed cell death protein 1.