Figures
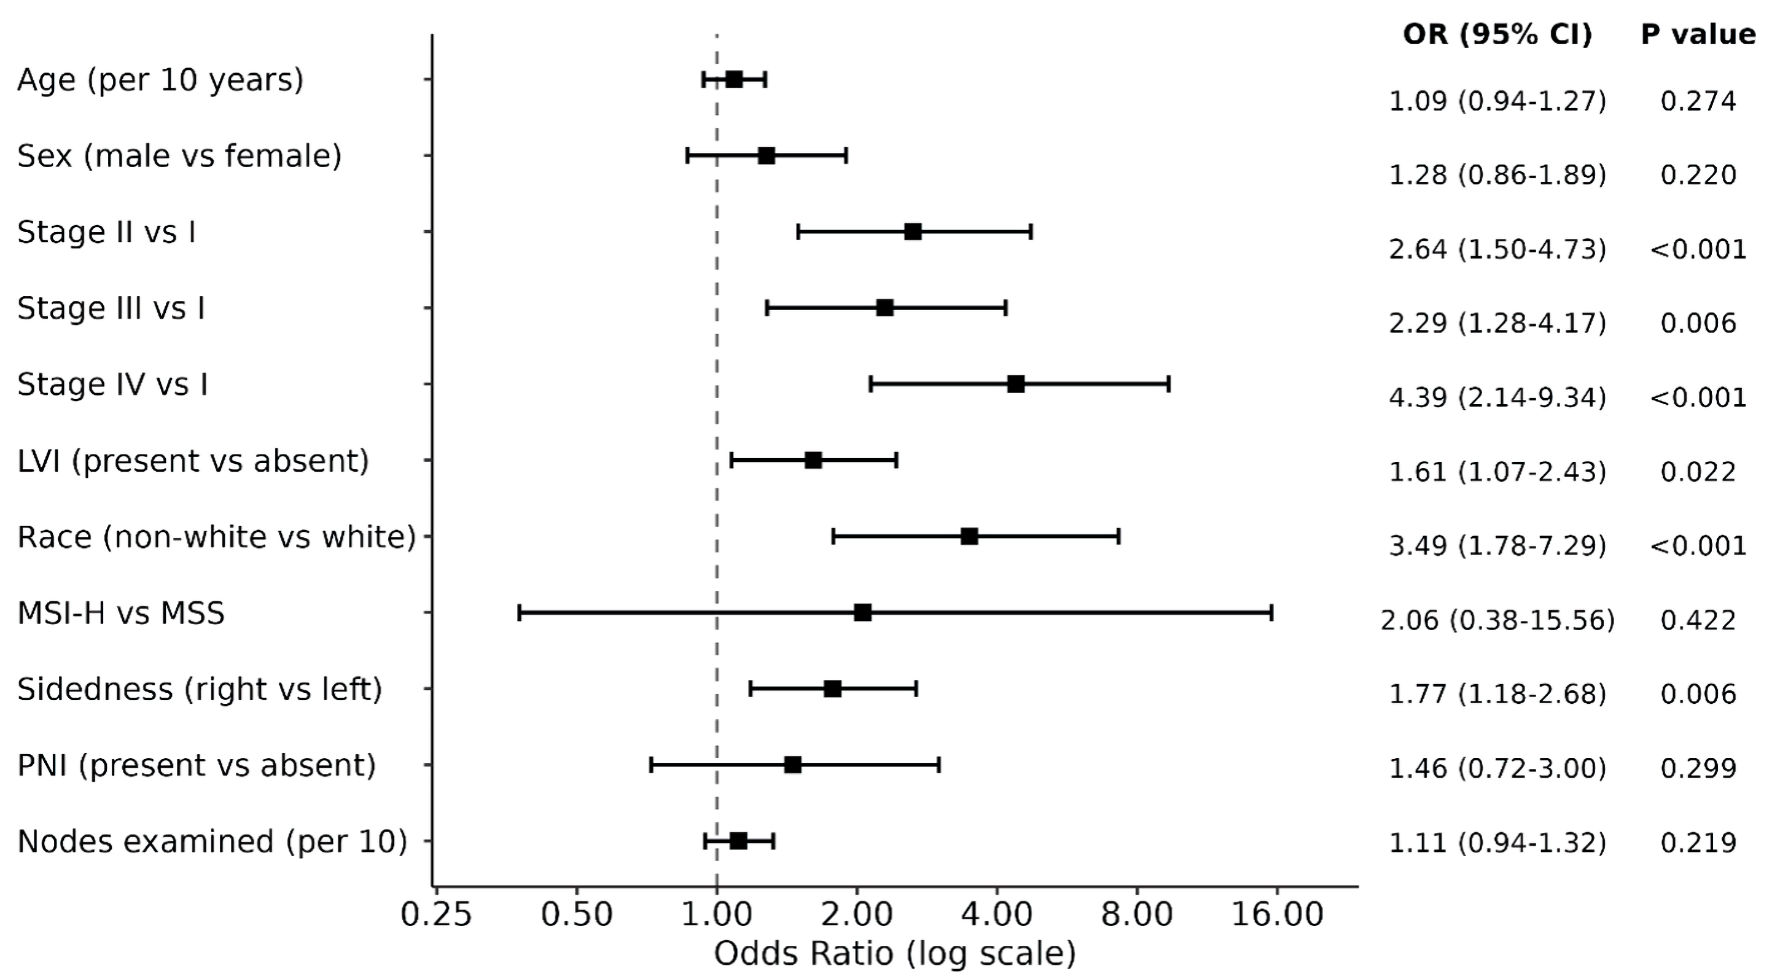
↓ Figure 1. Associations between clinical variables and CHAI biomarker status. ORs (squares) and 95% confidence intervals (horizontal bars) were estimated from individual logistic regression models in the validation cohort (n = 409), with CHAI biomarker (+) status. ORs to the right of the vertical dashed line (OR = 1) indicate increased odds of biomarker positivity. Reference categories: female (sex), AJCC stage I (stage), absent (LVI, PNI), White (race), MSS (MSI status), left (sidedness). AJCC: American Joint Committee on Cancer; CHAI: computational histology artificial intelligence; CI: confidence interval; LVI: lymphovascular invasion; MSI-H: microsatellite instability-high; MSS: microsatellite stable; OR: odds ratio; PNI: perineural invasion.
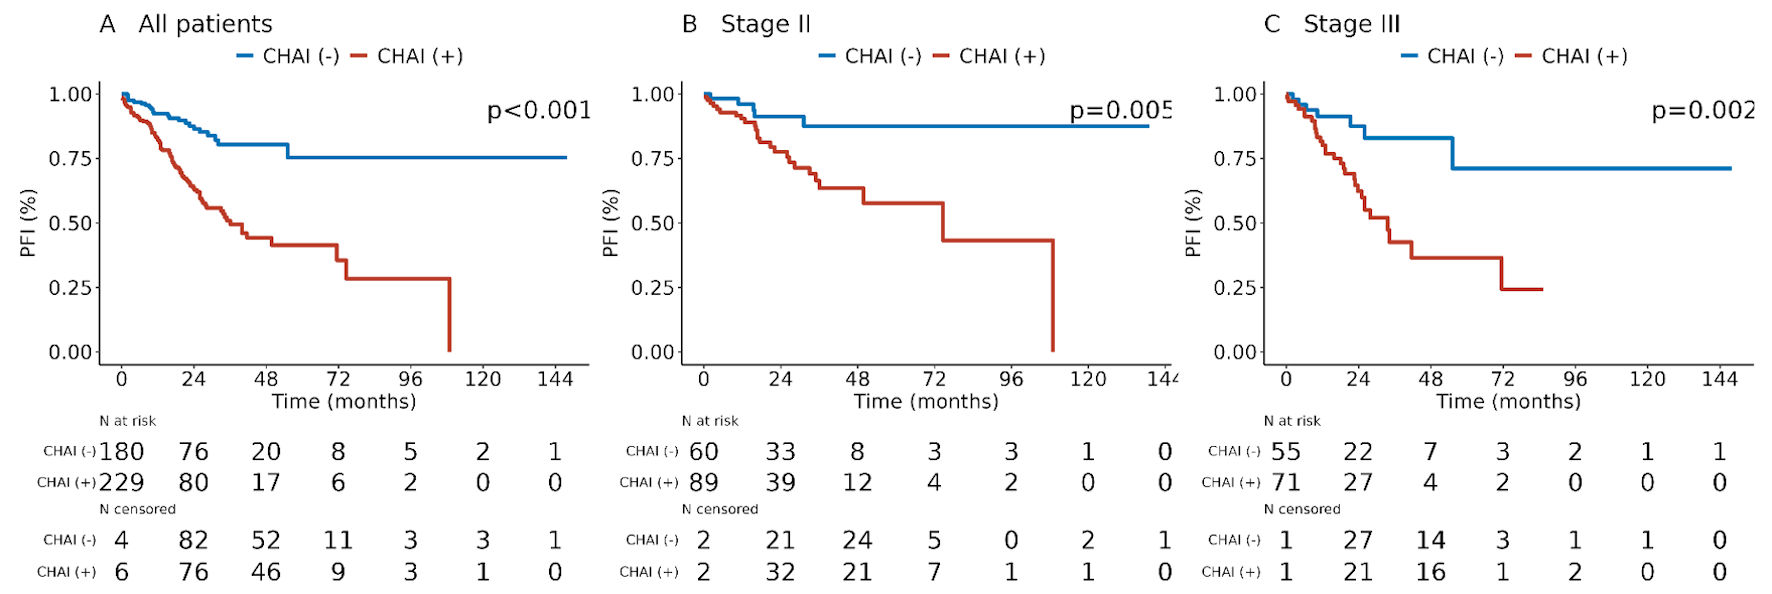
↓ Figure 2. PFI by CHAI biomarker status. Kaplan–Meier estimates of PFI are stratified by CHAI status in (a) all validation cohort patients (n = 409; one patient in the validation cohort did not have available PFI data), (b) stage II patients (n = 150), and (c) stage III patients (n = 126). P values correspond to log-rank tests. AJCC: American Joint Committee on Cancer; CHAI: computational histology artificial intelligence; CI: confidence interval; PFI: progression-free interval.
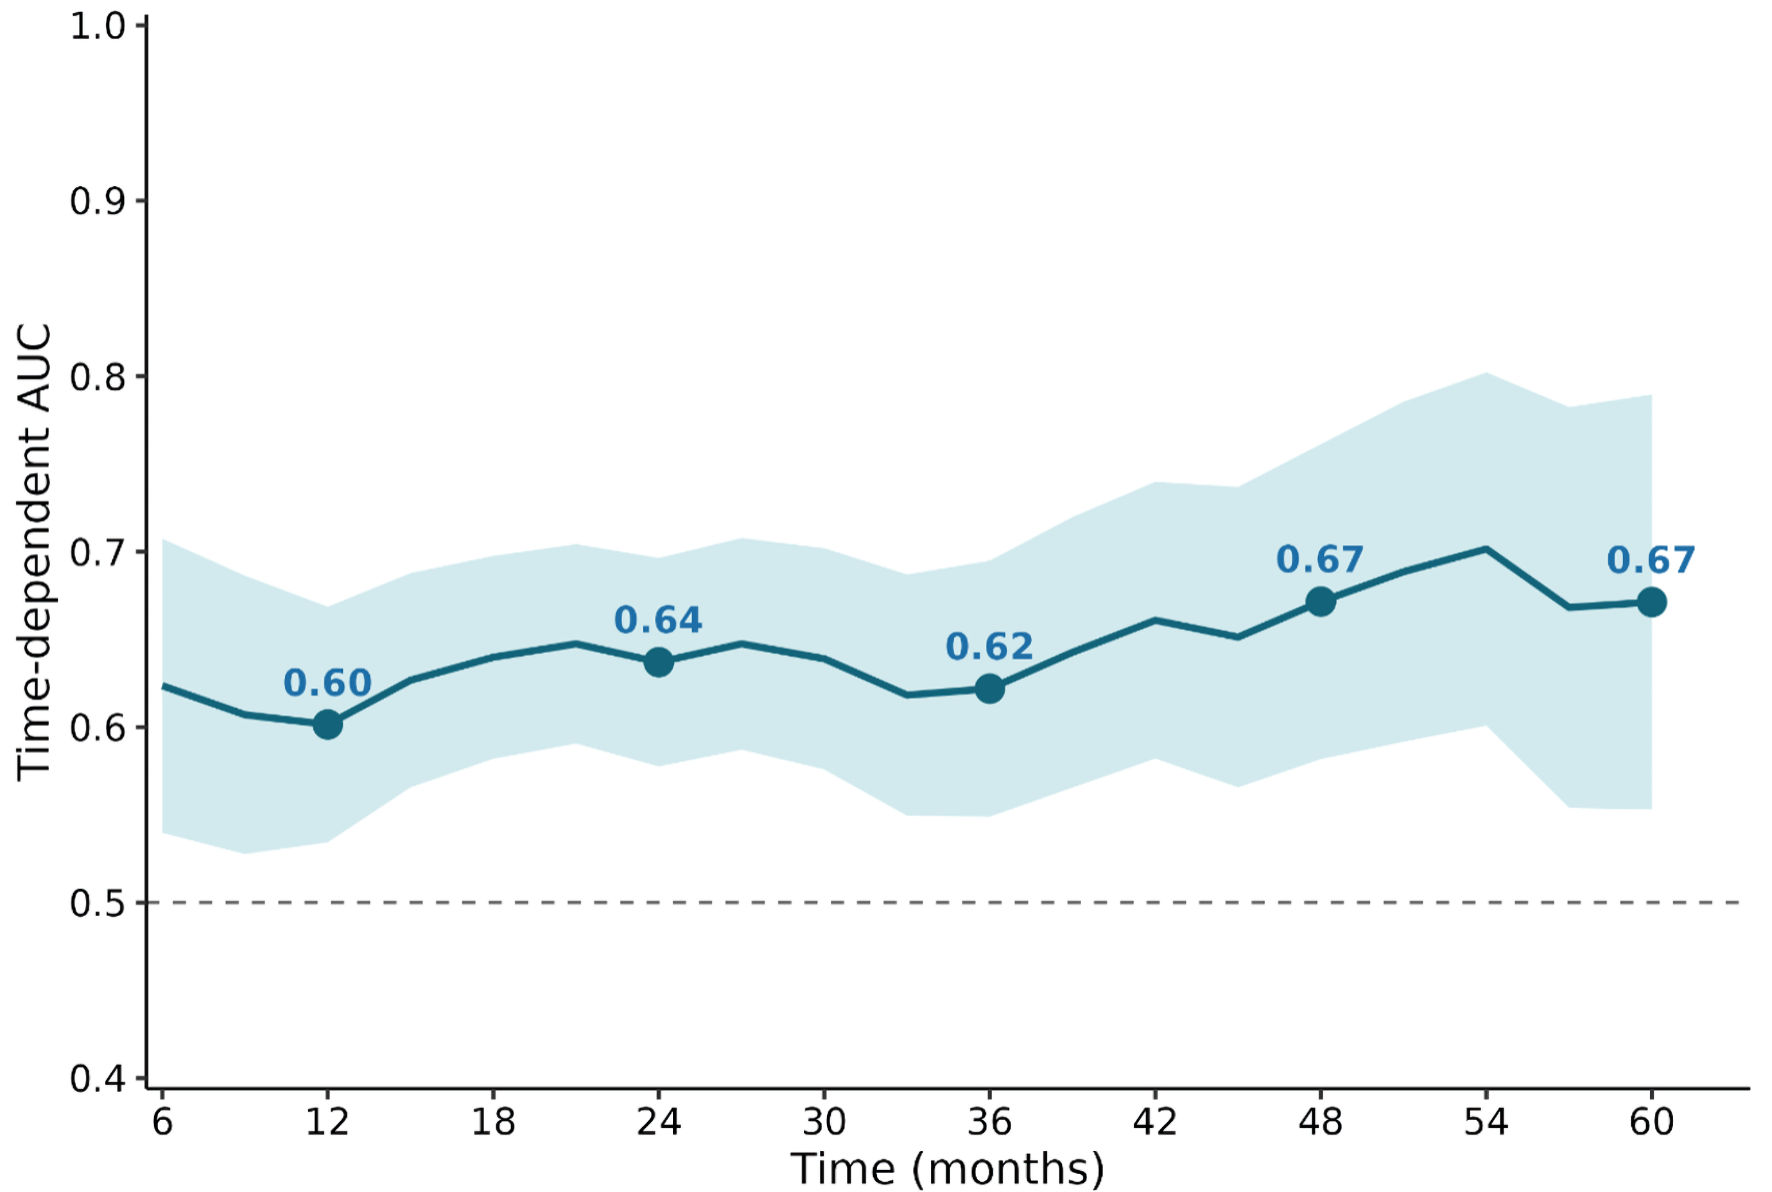
↓ Figure 3. Time-dependent AUC for progression free interval of the CHAI biomarker. Time-dependent AUC for CHAI status in predicting PFI, evaluated at 3-month intervals from 6 to 60 months in the validation cohort (n = 409). The solid line shows the point estimate with the shaded band representing the 95% confidence interval. Filled circles mark the AUC at the 1-, 2-, 3-, 4-, and 5-year time points. AUC: area under the curve; CHAI: computational histology artificial intelligence; CI: confidence interval; PFI: progression-free interval.
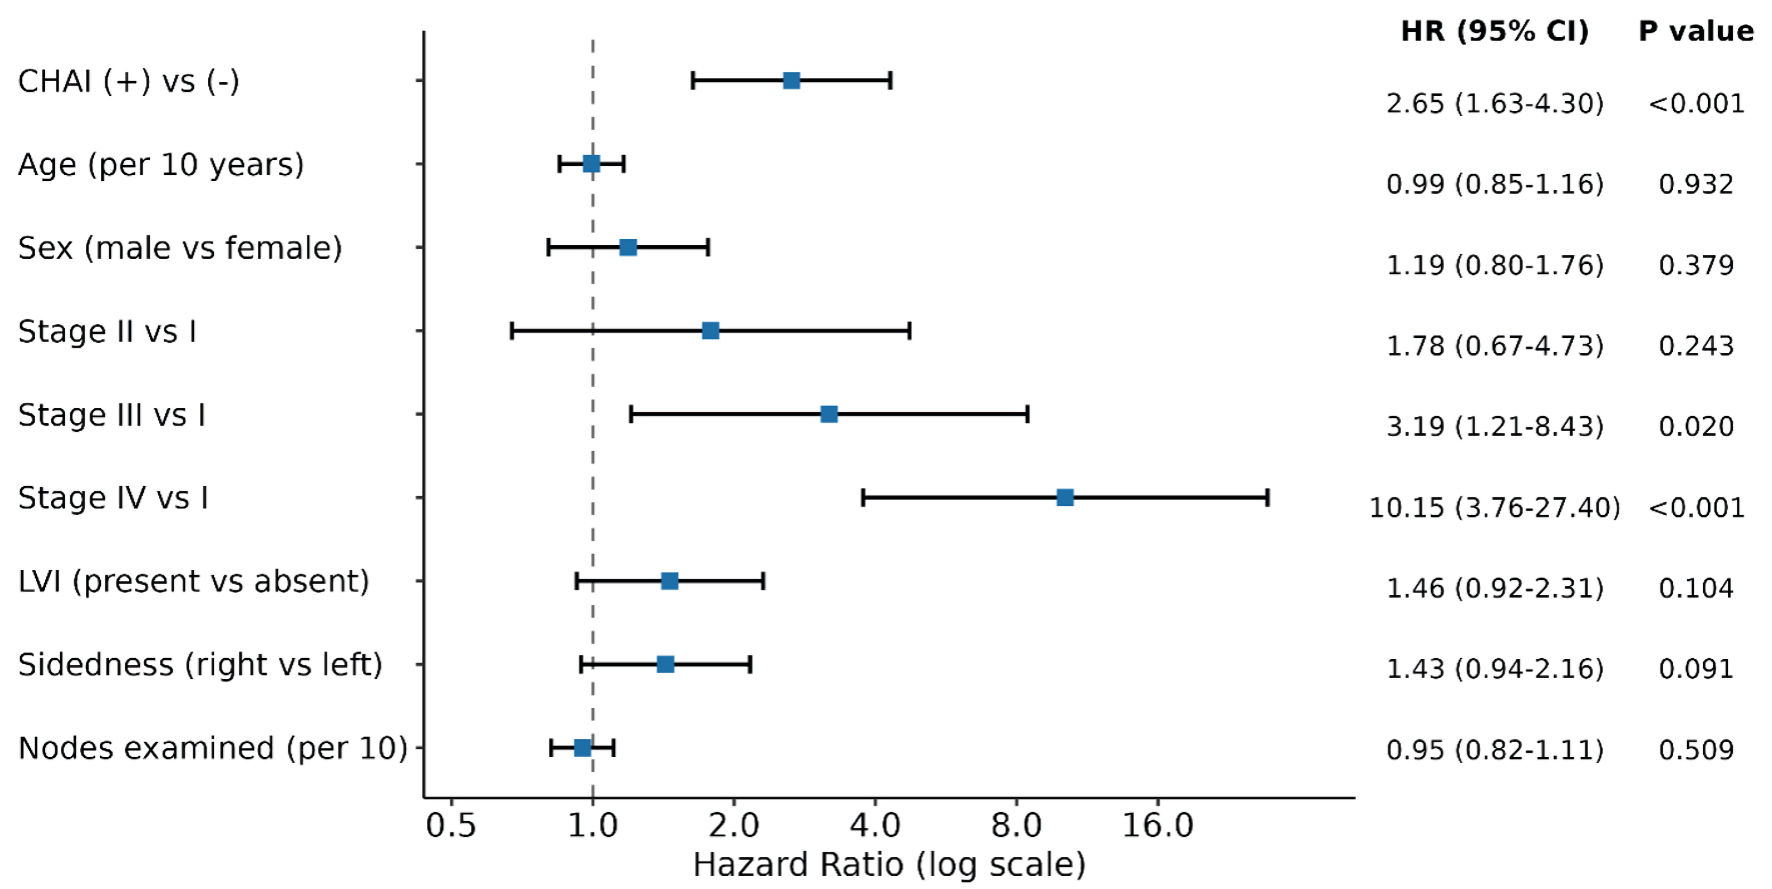
↓ Figure 4. Multivariable cox proportional hazards model of PFI. Hazard ratios (squares) and 95% confidence intervals (horizontal bars) for the association of each covariate with PFI in a multivariable cox proportional hazards model in the validation cohort (n = 409 with PFI data). Missing values for covariates were handled by multiple imputation (20 imputations). Reference categories were: CHAI (–) (CHAI status), female (sex), stage I (stage), absent (lymphovascular invasion), left-sided (sidedness). aHR: adjusted hazard ratio; AJCC American Joint Committee on Cancer; CHAI: computational histology artificial intelligence; CI: confidence interval; LVI: lymphovascular invasion; PFI: progression-free interval.
Table
↓ Table 1. Clinical Characteristics of Patients in the Development and Validation Cohorts
| Characteristic | Overall (n = 583)a | Development (n = 174)a | Validation (n = 409)a | P valueb |
|---|
| aMedian (Q1–Q3); n (%). bWilcoxon rank sum test; Fisher’s exact test. Patients were randomly partitioned into a development cohort (n = 174) and validation cohort (n = 409). Clinical characteristics of patients in both cohorts are summarized. Continuous variables are summarized as median (interquartile range) and categorical variables as n (%). Between cohort differences were tested using the Wilcoxon rank-sum test for continuous variables and Fisher’s exact test for categorical variables. AJCC: American Joint Committee on Cancer; MSI: microsatellite instability; MSS: microsatellite stable: MSI-H: microsatellite instability-high. |
| Age (years) | 68.0 (58.0–76.0) | 66.5 (59.0–75.0) | 68.0 (57.0–76.0) | 0.78 |
| Sex | | | | 0.10 |
| Female | 278 (48%) | 92 (53%) | 186 (45%) | |
| Male | 305 (52%) | 82 (47%) | 223 (55%) | |
| Race | | | | 0.60 |
| White | 275 (78%) | 75 (77%) | 200 (79%) | |
| Black | 63 (18%) | 21 (21%) | 42 (17%) | |
| Asian | 12 (3%) | 2 (2%) | 10 (4%) | |
| American Indian | 1 (0%) | 0 (0%) | 1 (0%) | |
| Missing | 232 | 76 | 156 | |
| AJCC stage | | | | 1.00 |
| I | 107 (18%) | 32 (18%) | 75 (18%) | |
| II | 213 (37%) | 64 (37%) | 149 (36%) | |
| III | 180 (31%) | 54 (31%) | 126 (31%) | |
| IV | 83 (14%) | 24 (14%) | 59 (14%) | |
| Microsatellite instability (MSI) status | | | | 0.73 |
| MSS | 103 (91%) | 34 (89%) | 69 (92%) | |
| MSI-H | 10 (9%) | 4 (11%) | 6 (8%) | |
| Missing | 470 | 136 | 334 | |
| Sidedness | | | | 0.85 |
| Left | 318 (56%) | 96 (56%) | 222 (57%) | |
| Right | 246 (44%) | 76 (44%) | 170 (43%) | |
| Missing | 19 | 2 | 17 | |
| Lymphovascular invasion | | | | 0.22 |
| Absent | 300 (55%) | 96 (59%) | 204 (53%) | |
| Present | 244 (45%) | 66 (41%) | 178 (47%) | |
| Missing | 39 | 12 | 27 | |
| Perineural invasion | | | | 0.40 |
| Absent | 165 (74%) | 50 (78%) | 115 (72%) | |
| Present | 58 (26%) | 14 (22%) | 44 (28%) | |
| Missing | 360 | 110 | 250 | |
| Lymph nodes examined | 19.0 (14.0–27.0) | 20.0 (15.0–28.0) | 19.0 (14.0–27.0) | 0.12 |
| Missing | 27 | 9 | 18 | |