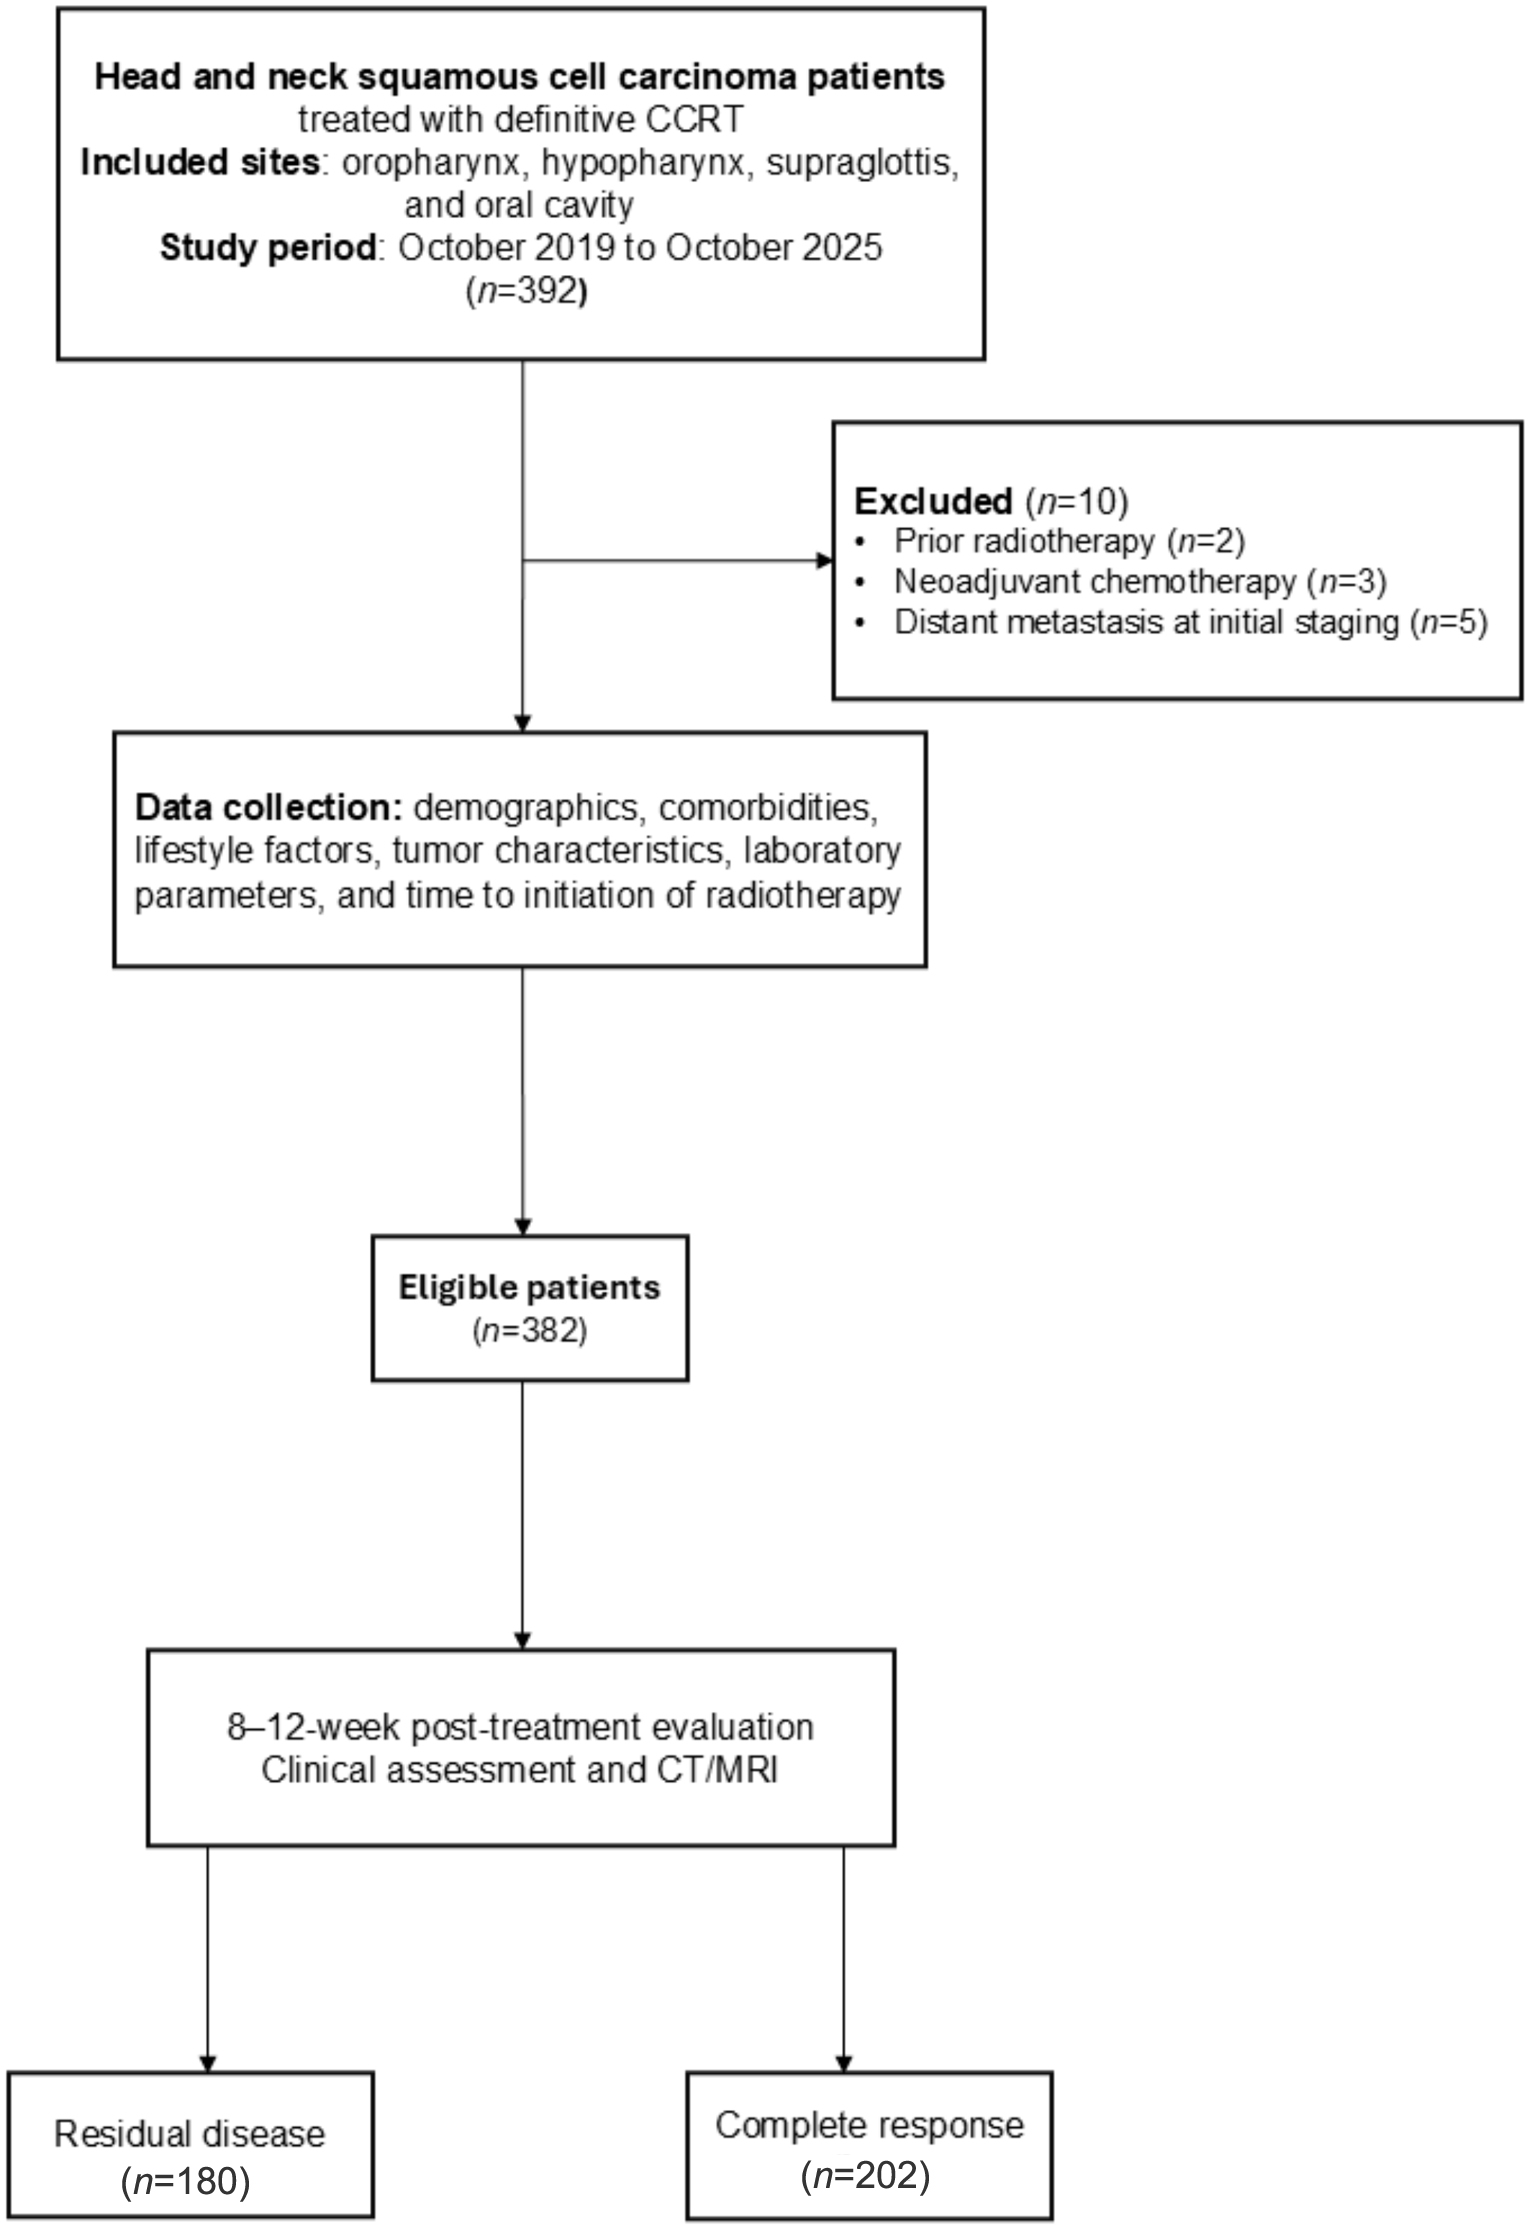
↓ Figure 1. Study flow diagram. CCRT: concurrent chemoradiotherapy; CT: computed tomography; MRI: magnetic resonance imaging.
| World Journal of Oncology, ISSN 1920-4531 print, 1920-454X online, Open Access |
| Article copyright, the authors; Journal compilation copyright, World J Oncol and Elmer Press Inc |
| Journal website https://wjon.elmerpub.com |
Original Article
Volume 17, Number 5, October 2026, pages 705-716
Prediction of Residual Disease in Unresectable Head and Neck Squamous Cell Carcinoma After Concurrent Chemoradiotherapy
Figures
Tables
| Prognostic factors | Residual disease (n = 180), n (%) | Complete response (n = 202), n (%) | P value | AuROC |
|---|---|---|---|---|
| HPV testing was performed mainly in patients with oropharyngeal tumors. Histological grade was missing in one patient with residual disease. AuROC: area under the receiver operating characteristic curve; BMI: body mass index; HPV: human papillomavirus; IQR: interquartile range; NLR: neutrophil-to-lymphocyte ratio; SD: standard deviation. | ||||
| Male sex | 75 (41.7) | 91 (45.0) | 0.536 | 0.516 |
| Age (years), mean ± SD | 55.9 ± 9.9 | 58.4 ± 11.0 | 0.018 | 0.585 |
| Comorbidities | ||||
| Diabetes mellitus | 8 (4.4) | 11 (5.4) | 0.814 | 0.505 |
| Hypertension | 23 (12.8) | 36 (17.8) | 0.202 | 0.525 |
| Dyslipidemia | 9 (5.0) | 19 (9.4) | 0.117 | 0.522 |
| Smoking history | 119 (66.1) | 121 (59.9) | 0.243 | 0.531 |
| Alcohol consumption | 111 (61.7) | 122 (60.4) | 0.834 | 0.506 |
| Tumor site | < 0.001 | 0.683 | ||
| Supraglottis | 12 (6.7) | 50 (24.8) | ||
| Oropharynx | 72 (40.0) | 105 (52.0) | ||
| Hypopharynx | 70 (38.9) | 35 (17.3) | ||
| Oral cavity | 26 (14.4) | 12 (5.9) | ||
| Histologic grade | 0.698 | 0.522 | ||
| Well differentiated | 55 (30.8) | 70 (34.7) | ||
| Moderately differentiated | 91 (50.8) | 95 (47.0) | ||
| Poorly differentiated | 33 (18.4) | 37 (18.3) | ||
| Tumor stage (T-stage) | < 0.001 | 0.723 | ||
| T1 | 8 (4.4) | 17 (8.4) | ||
| T2 | 18 (10.0) | 53 (26.2) | ||
| T3 | 35 (19.4) | 86 (42.6) | ||
| T4 | 119 (66.1) | 46 (22.8) | ||
| Nodal stage (N-stage) | < 0.001 | 0.689 | ||
| N1 | 30 (16.7) | 91 (45.0) | ||
| N2 | 112 (62.2) | 106 (52.5) | ||
| N3 | 38 (21.1) | 5 (2.5) | ||
| Hemoglobin (g/dL), mean ± SD | 11.2 ± 1.9 | 12.2 ± 1.9 | < 0.001 | 0.641 |
| Albumin (g/dL), mean ± SD | 3.7 ± 0.5 | 3.9 ± 0.4 | 0.001 | 0.617 |
| HPV-positive | 6 (7.6) | 53 (41.4) | 0.001 | 0.669 |
| NLR, median (IQR) | 4.3 (2.7, 7.1) | 3.0 (1.9, 4.4) | < 0.001 | 0.670 |
| Maximum tumor diameter (cm), median (IQR) | 6.5 (5.7, 7.3) | 3.5 (2.5, 4.7) | < 0.001 | 0.914 |
| Tumor size anteroposterior (cm), mean ± SD | 4.4 ± 1.8 | 2.8 ± 1.3 | < 0.001 | 0.761 |
| Tumor size transverse (cm), mean ± SD | 4.5 ± 1.7 | 2.7 ± 1.2 | < 0.001 | 0.793 |
| Tumor size vertical (cm), mean ± SD | 5.7 ± 2.0 | 3.1 ± 1.5 | < 0.001 | 0.850 |
| Maximum lymph node diameter (cm), median (IQR) | 2.0 (1.2, 5.0) | 1.8 (1.0, 3.0) | 0.169 | 0.563 |
| BMI (kg/m2), mean ± SD | 18.9 ± 3.1 | 20.4 ± 3.9 | < 0.001 | 0.615 |
| Time to initiation of radiotherapy (days), median (IQR) | 62.0 (49.5, 84.5) | 61.0 (52.0, 75.0) | 0.217 | 0.538 |
| Overall treatment time (days), mean ± SD | 54.5 ± 10.8 | 52.5 ± 18.9 | 0.470 | 0.566 |
| Predictors | Univariable OR (95% CI) | P value | Multivariable OR (95% CI) | P value |
|---|---|---|---|---|
| Overall multivariable model AuROC was 0.929. BMI: body mass index; CI: confidence interval; NLR: neutrophil-to-lymphocyte ratio; OR: odds ratio. | ||||
| Tumor site | ||||
| Supraglottis | 1.00 (Reference) | - | 1.00 (Reference) | - |
| Oropharynx | 2.85 (1.42, 5.74) | 0.003 | 1.39 (0.46, 4.20) | 0.551 |
| Hypopharynx | 8.33 (3.93, 17.63) | < 0.001 | 3.56 (1.10, 11.40) | 0.033 |
| Oral cavity | 9.02 (3.56, 22.88) | < 0.001 | 3.77 (0.95, 14.90) | 0.058 |
| Maximum tumor diameter (cm) | 3.47 (2.72, 4.43) | < 0.001 | 3.37 (2.59, 4.39) | < 0.001 |
| Hemoglobin (g/dL) | 0.76 (0.68, 0.85) | < 0.001 | 0.94 (0.79, 1.11) | 0.475 |
| NLR | 1.15 (1.07, 1.22) | < 0.001 | 1.02 (0.94, 1.10) | 0.610 |
| BMI (kg/m2) | 0.88 (0.83, 0.94) | < 0.001 | 0.97 (0.88, 1.06) | 0.519 |
| Time to initiation of radiotherapy (days) | 1.01 (1.00, 1.02) | 0.005 | 1.01 (1.00, 1.02) | 0.016 |
| Parameters | Apparent performance (95% CI) | Bootstrap-corrected performance (95% CI) |
|---|---|---|
| AuROC: area under the receiver operating characteristic curve; CI: confidence interval; CITL: calibration-in-the-large; O:E ratio: observed-to-expected outcomes ratio. | ||
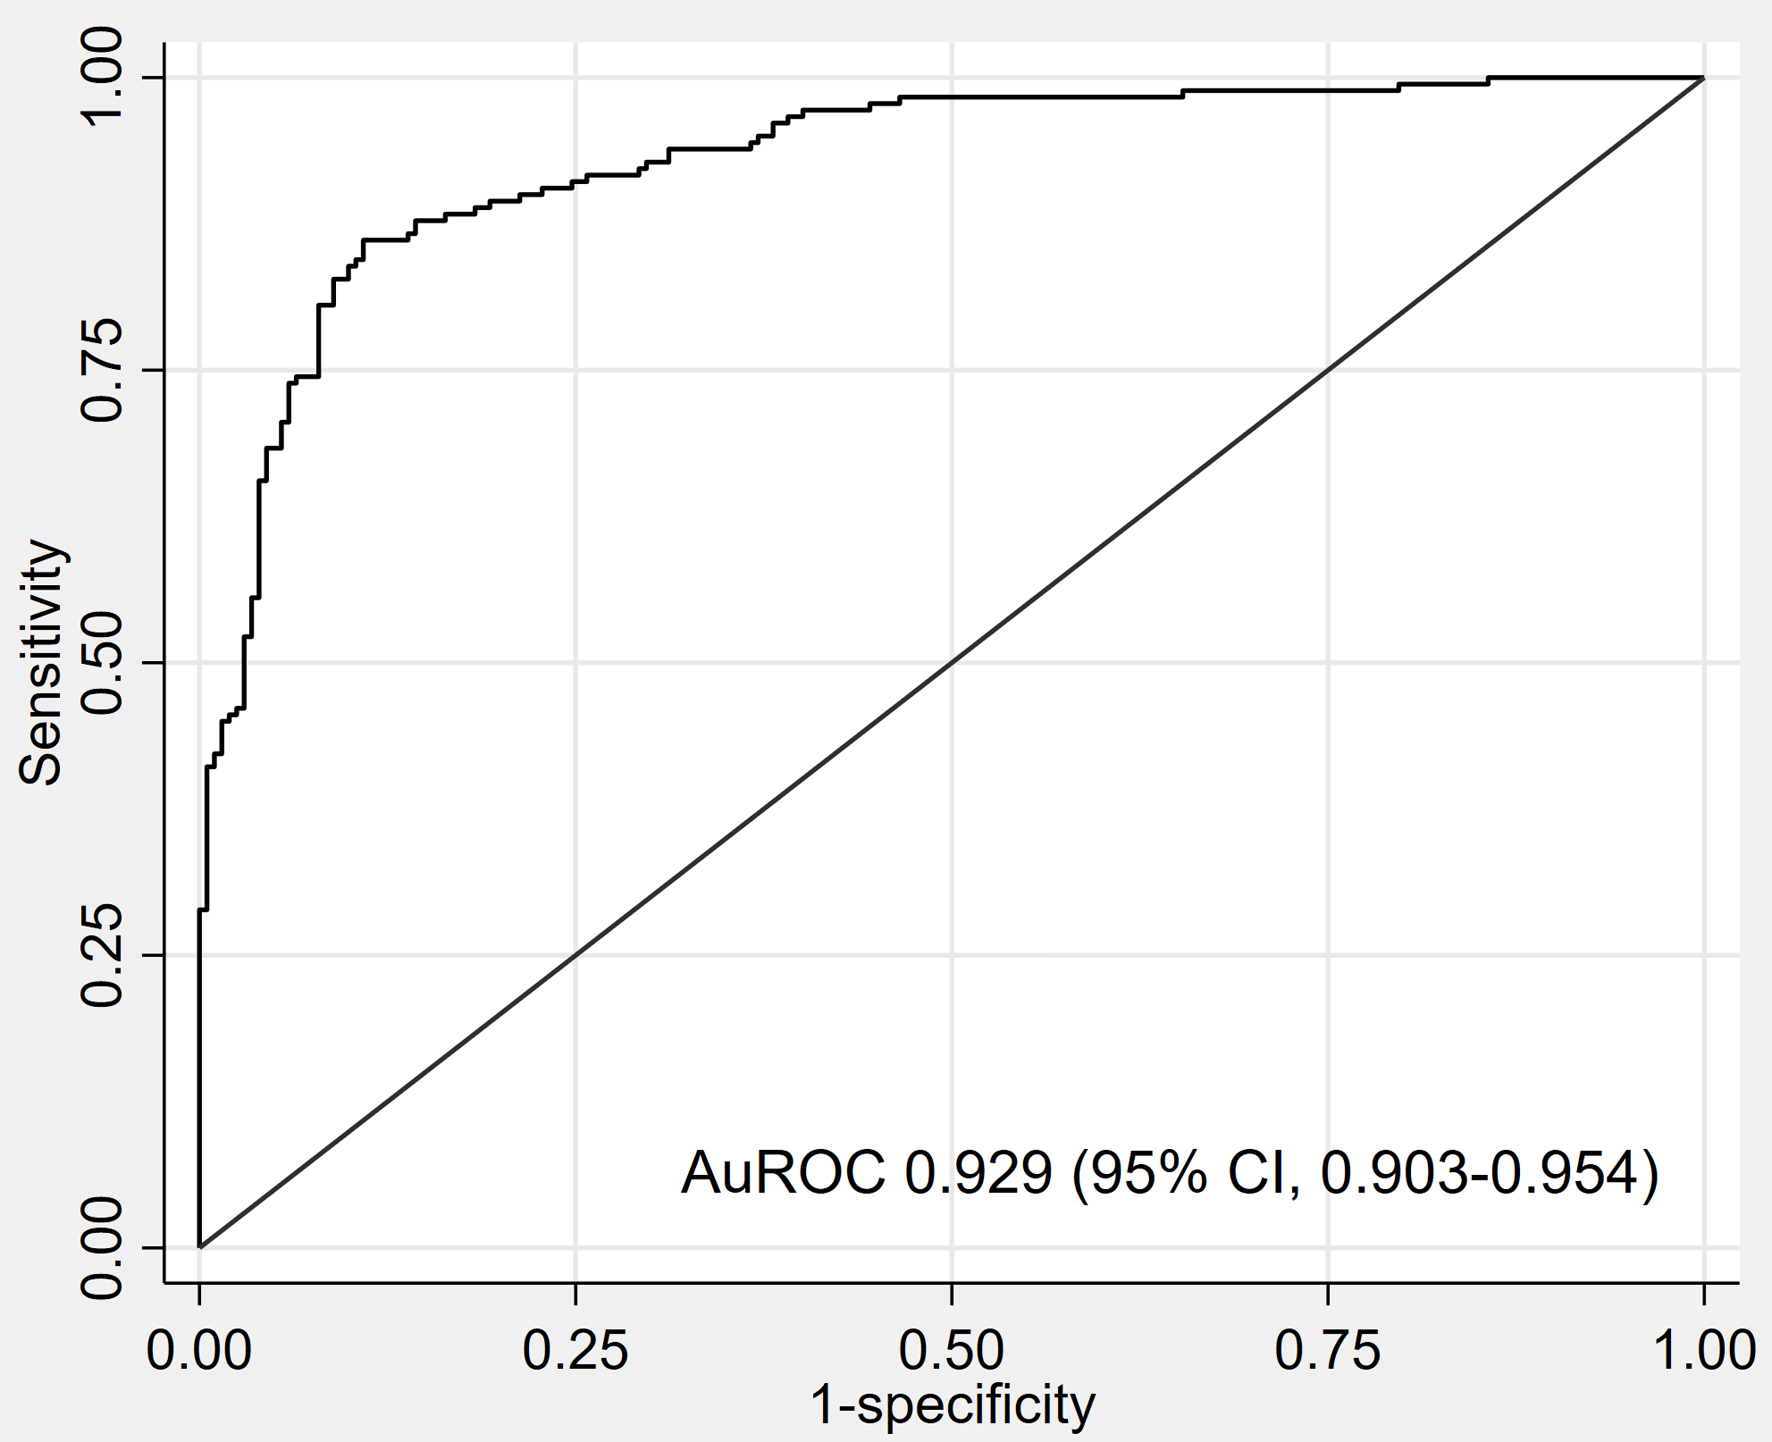
| C-statistic (AuROC) | 0.929 (0.903, 0.954) | 0.929 (0.905, 0.956) |
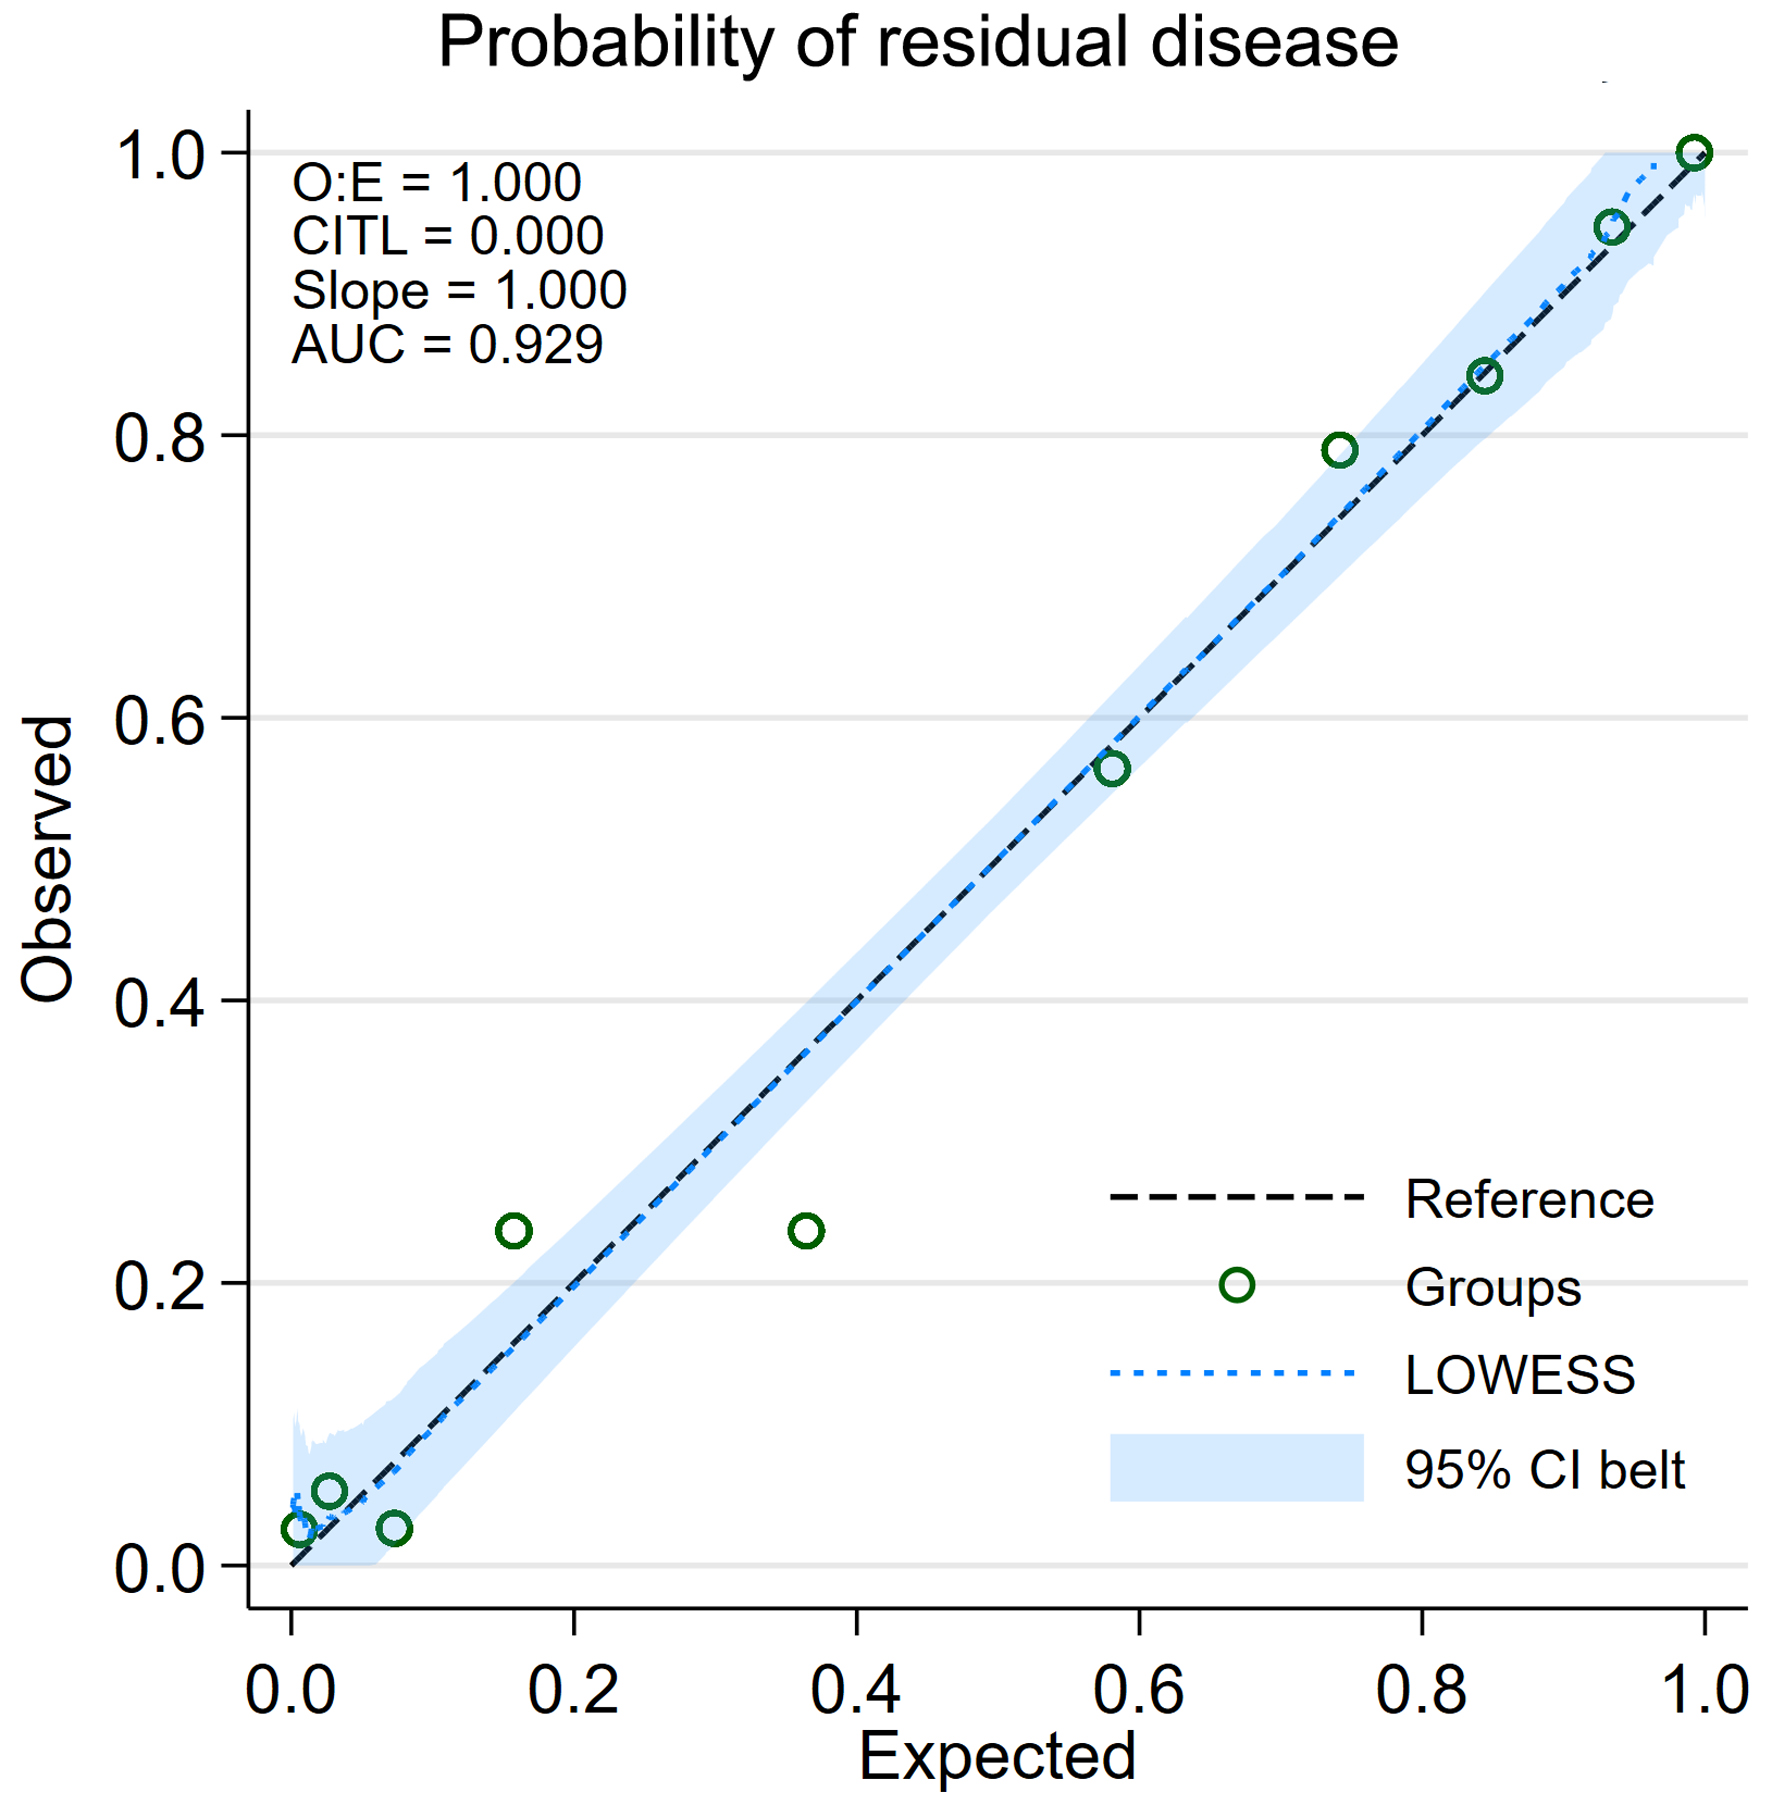
| O:E ratio | 1.000 | 1.002 (0.930, 1.070) |
| CITL | 0.000 (−0.304, 0.304) | −0.004 (−0.324, 0.323) |
| Calibration slope | 1.000 (0.801, 1.199) | 0.997 (0.776, 1.232) |
| Bootstrap shrinkage | - | 0.997 |
| Model probability of residual disease | Residual disease (n = 180), n (% of total cohort) | Complete response (n = 202), n (% of total cohort) | PPV (%) (95% CI) | NPV (%) (95% CI) |
|---|---|---|---|---|
| Percentages are cell percentages calculated using the total study population (N = 382) as the denominator. CI: confidence interval; NPV: negative predictive value; PPV: positive predictive value. | ||||
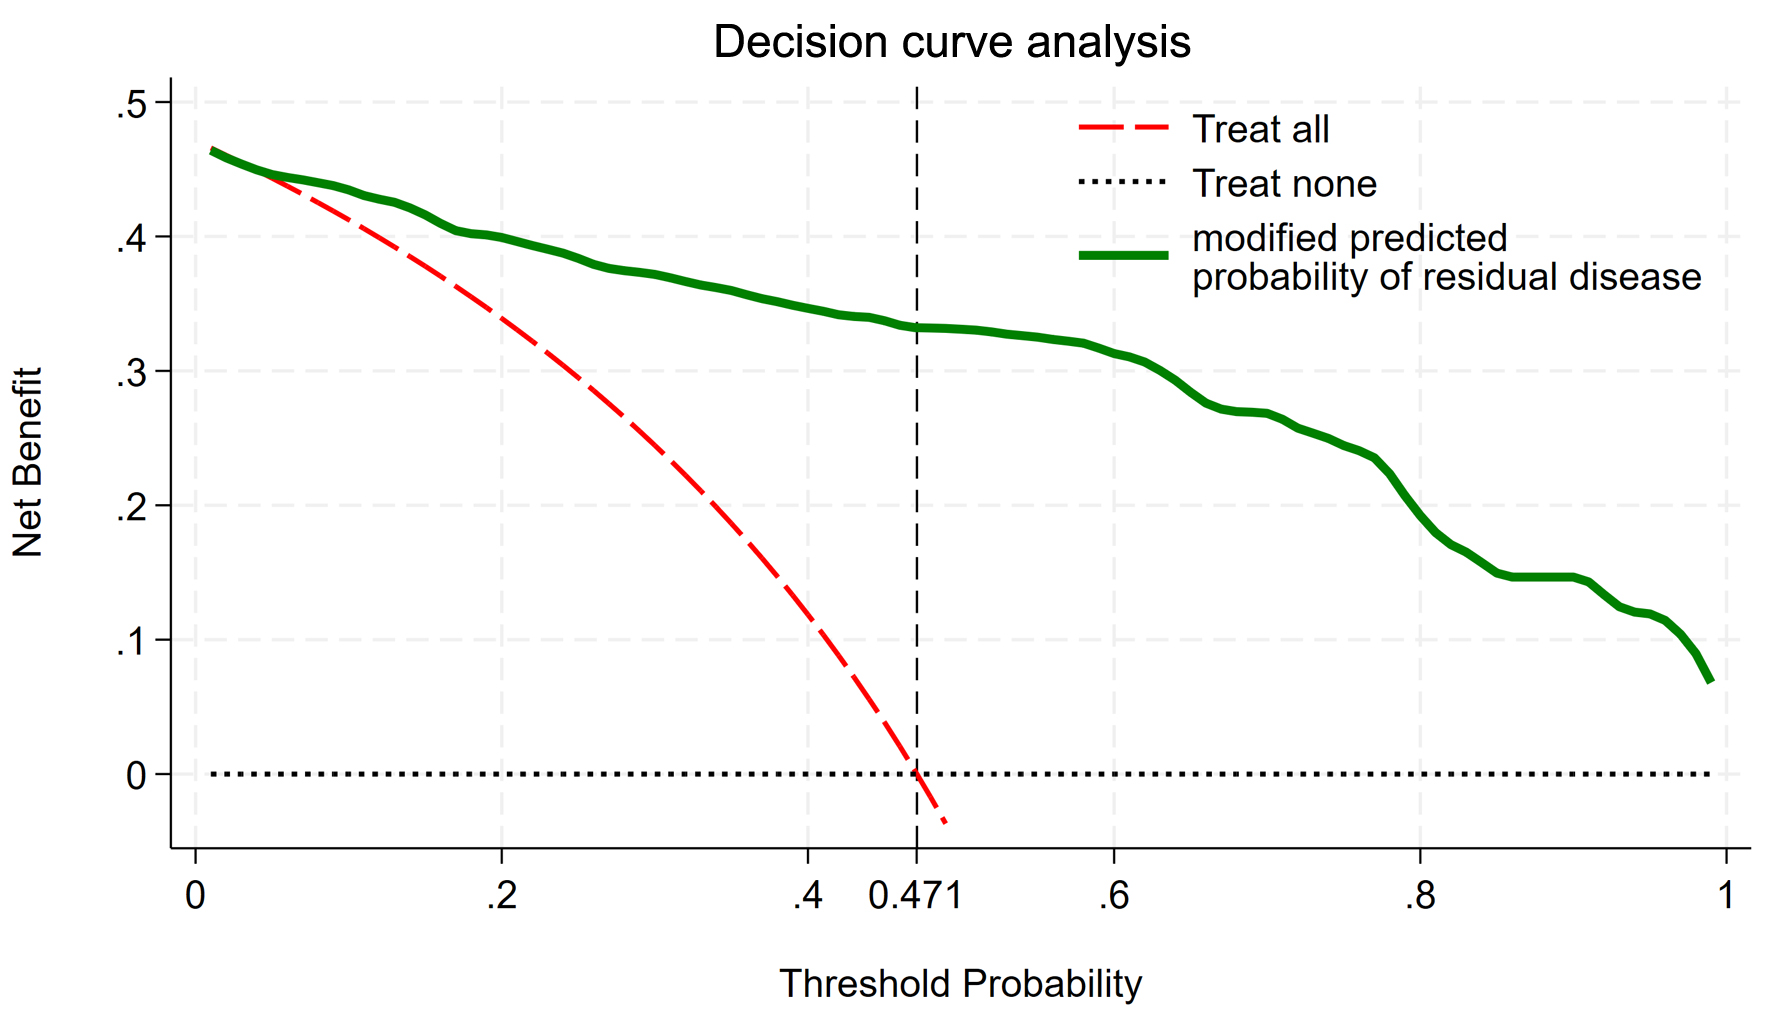
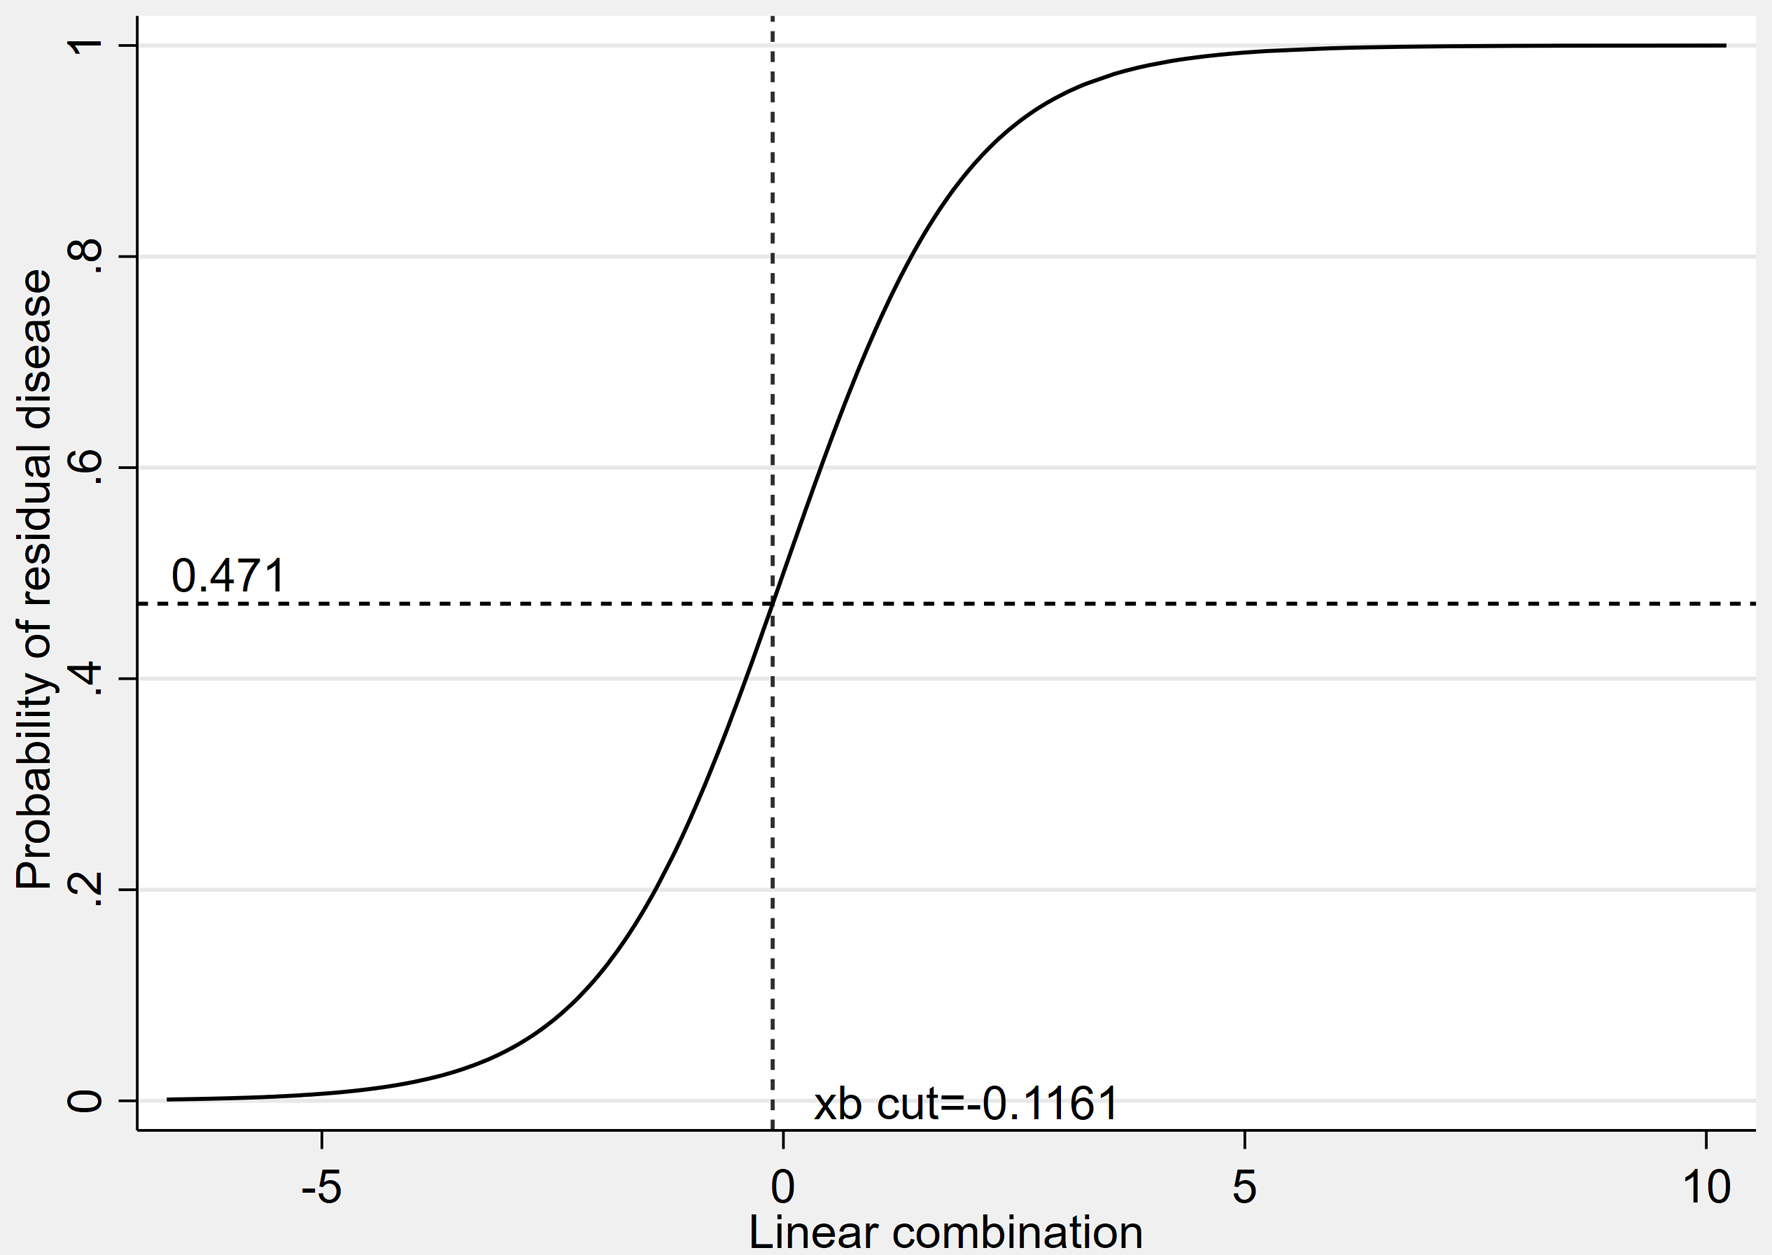
| ≥ 0.471 | 160 (41.9) | 37 (9.7) | 81.2 (75.1, 86.4) | 89.2 (83.8, 93.3) |
| < 0.471 | 20 (5.2) | 165 (43.2) | ||