Figures
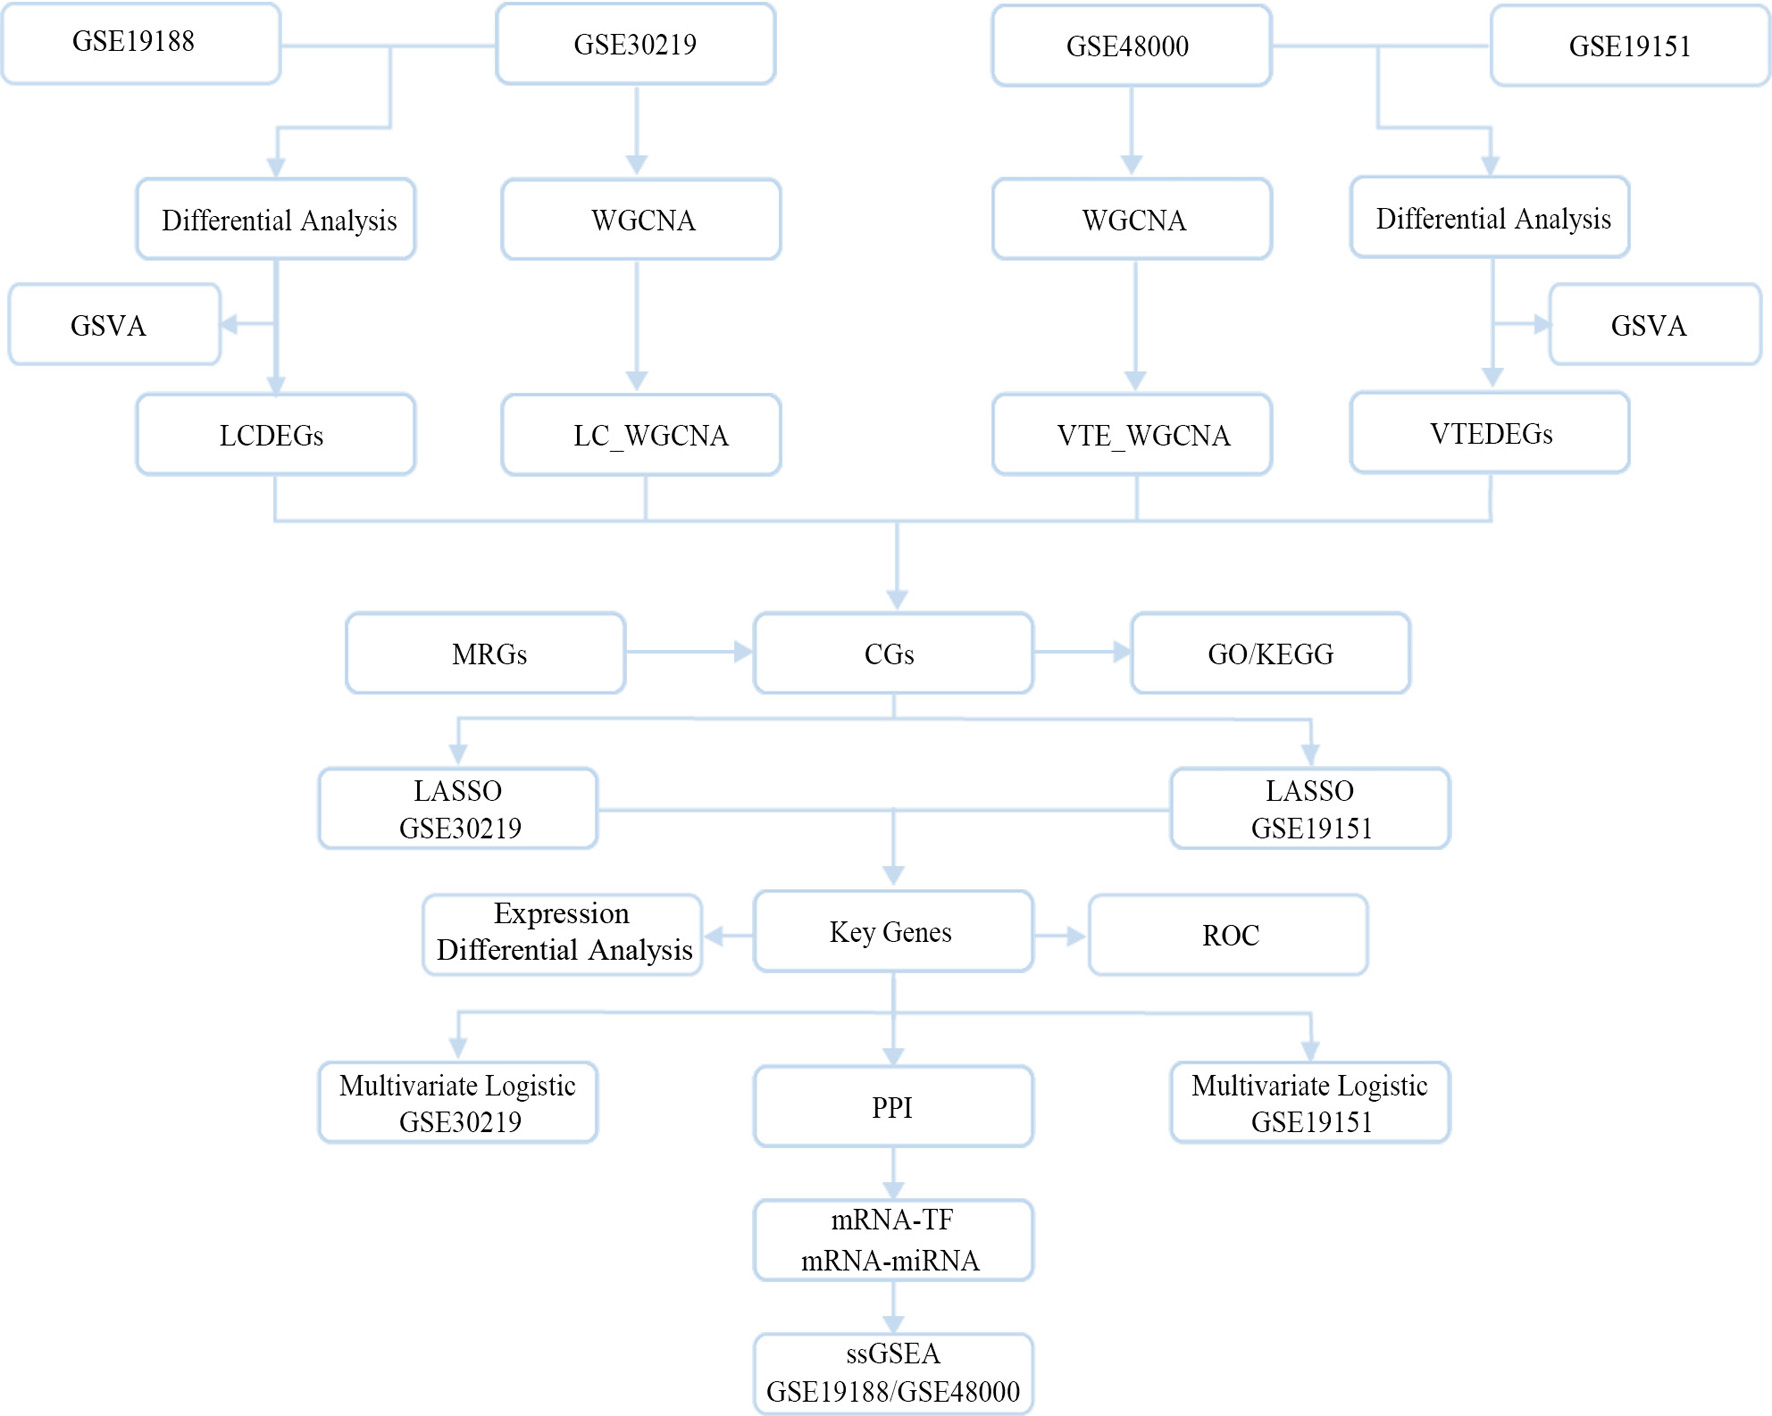
↓ Figure 1. Technology roadmap. LCDEGs: lung cancer-associated differentially expressed genes; VTEDEGs: venous thromboembolism–associated differentially expressed genes; CGs: crosstalk genes; WGCNA: weighted gene co-expression network analysis; GSVA: gene set variation analysis; GO: Gene Ontology; KEGG: Kyoto Encyclopedia of Genes and Genomes; LASSO: least absolute shrinkage and selection operator; TF: transcription factors; ssGSEA: single-sample gene set enrichment analysis.
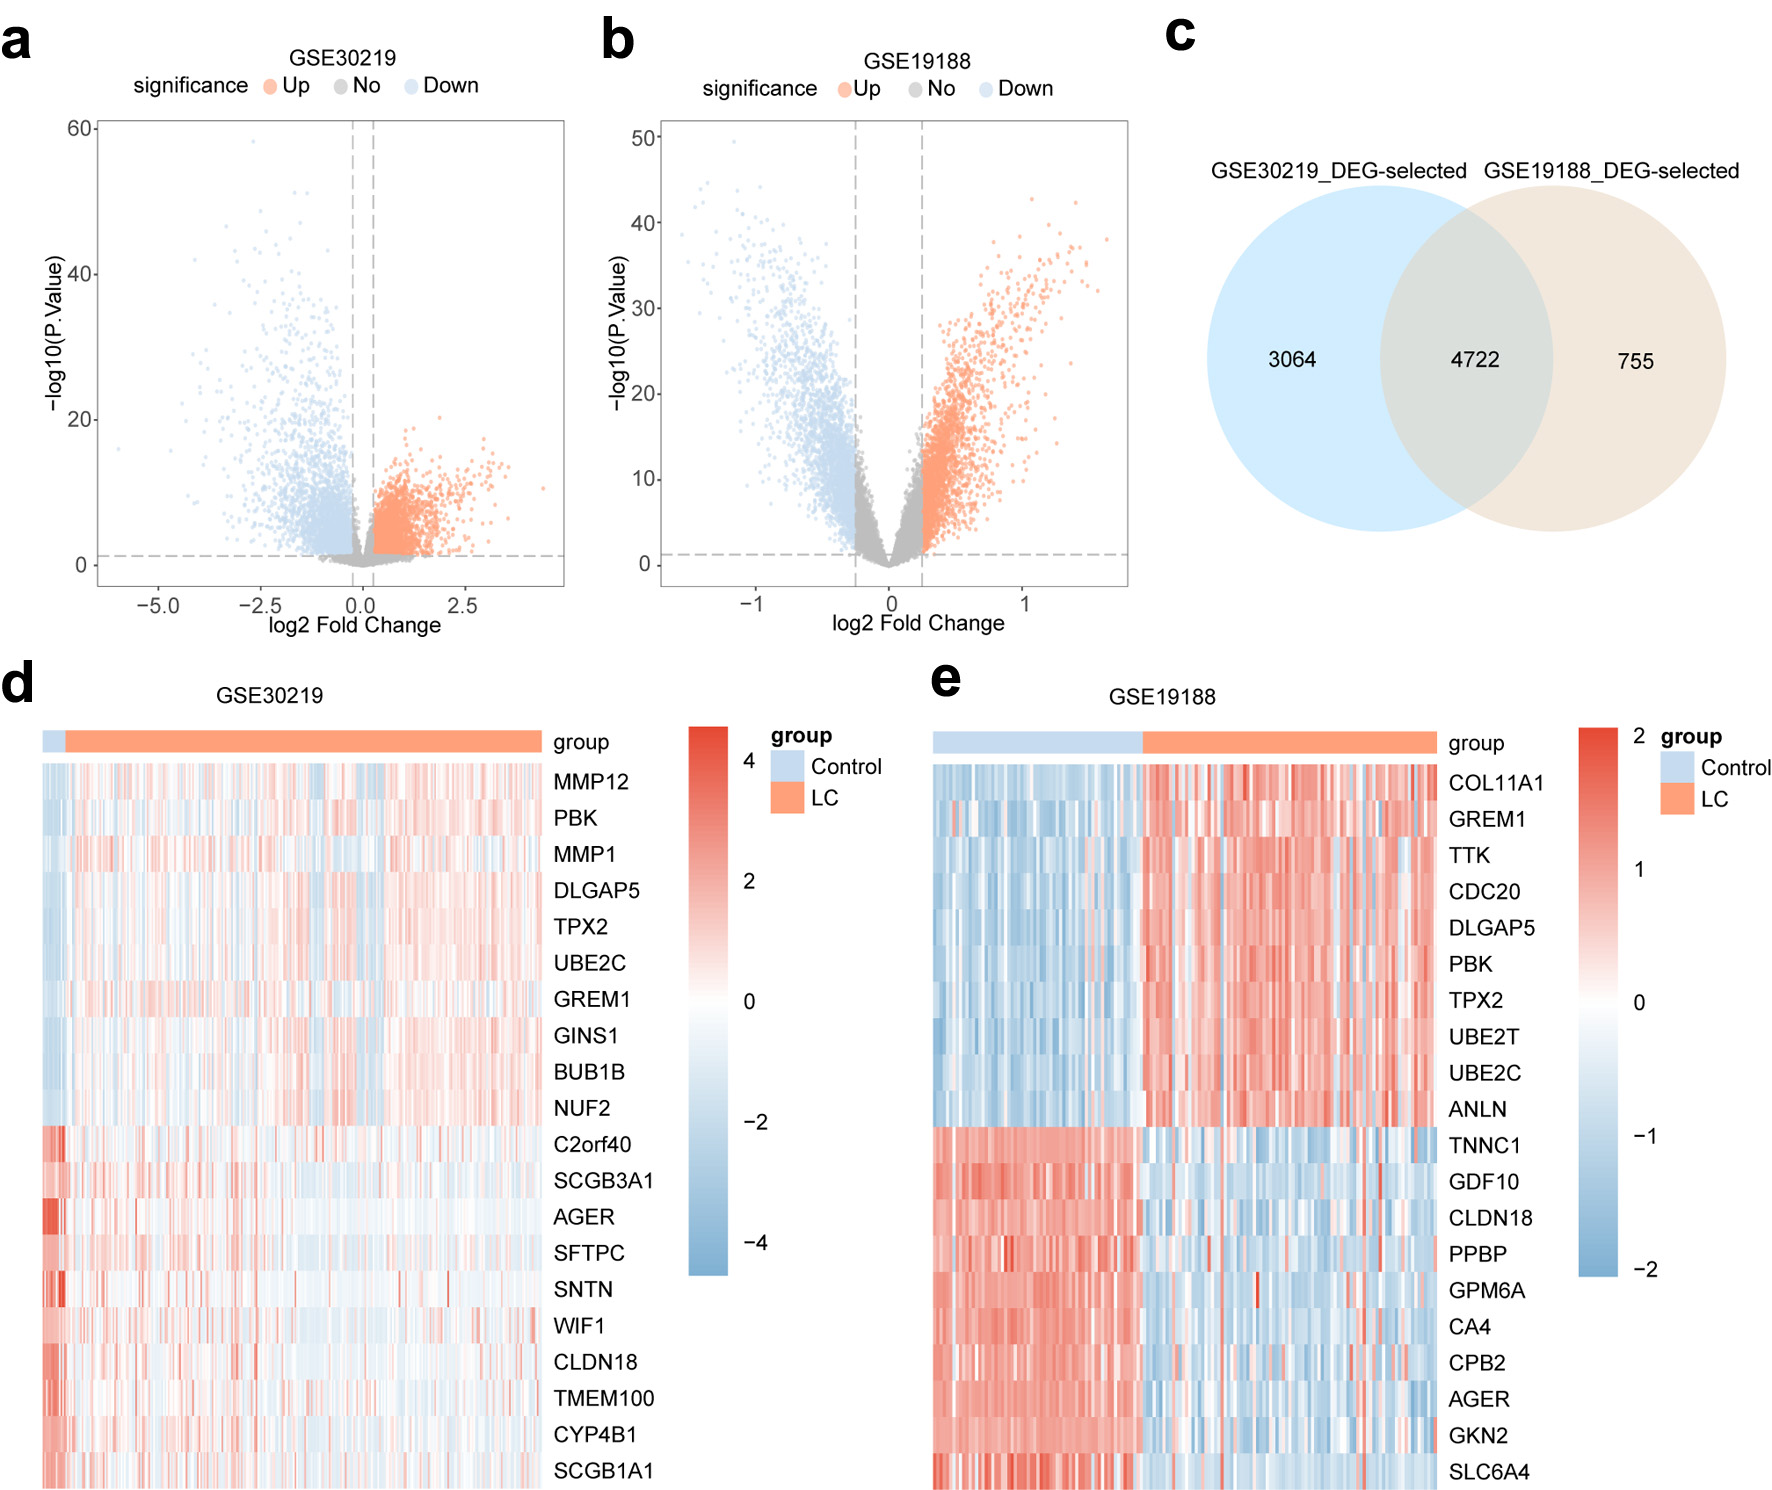
↓ Figure 2. Differential gene expression analysis in LC. (a, b) Volcano plots of DEGs in GSE30219 (a) and GSE19188 (b), comparing LC samples with controls. (c) Venn diagram showing the overlap of DEGs between GSE30219 and GSE19188. (d, e) Heatmaps of the top 10 upregulated and top 10 downregulated LCDEGs in GSE30219 (d) and GSE19188 (e). In volcano plots, orange indicates LC samples, and light blue indicates controls. In heatmaps, red indicates higher expression and blue indicates lower expression. DEGs: differentially expressed genes; LC: lung cancer.
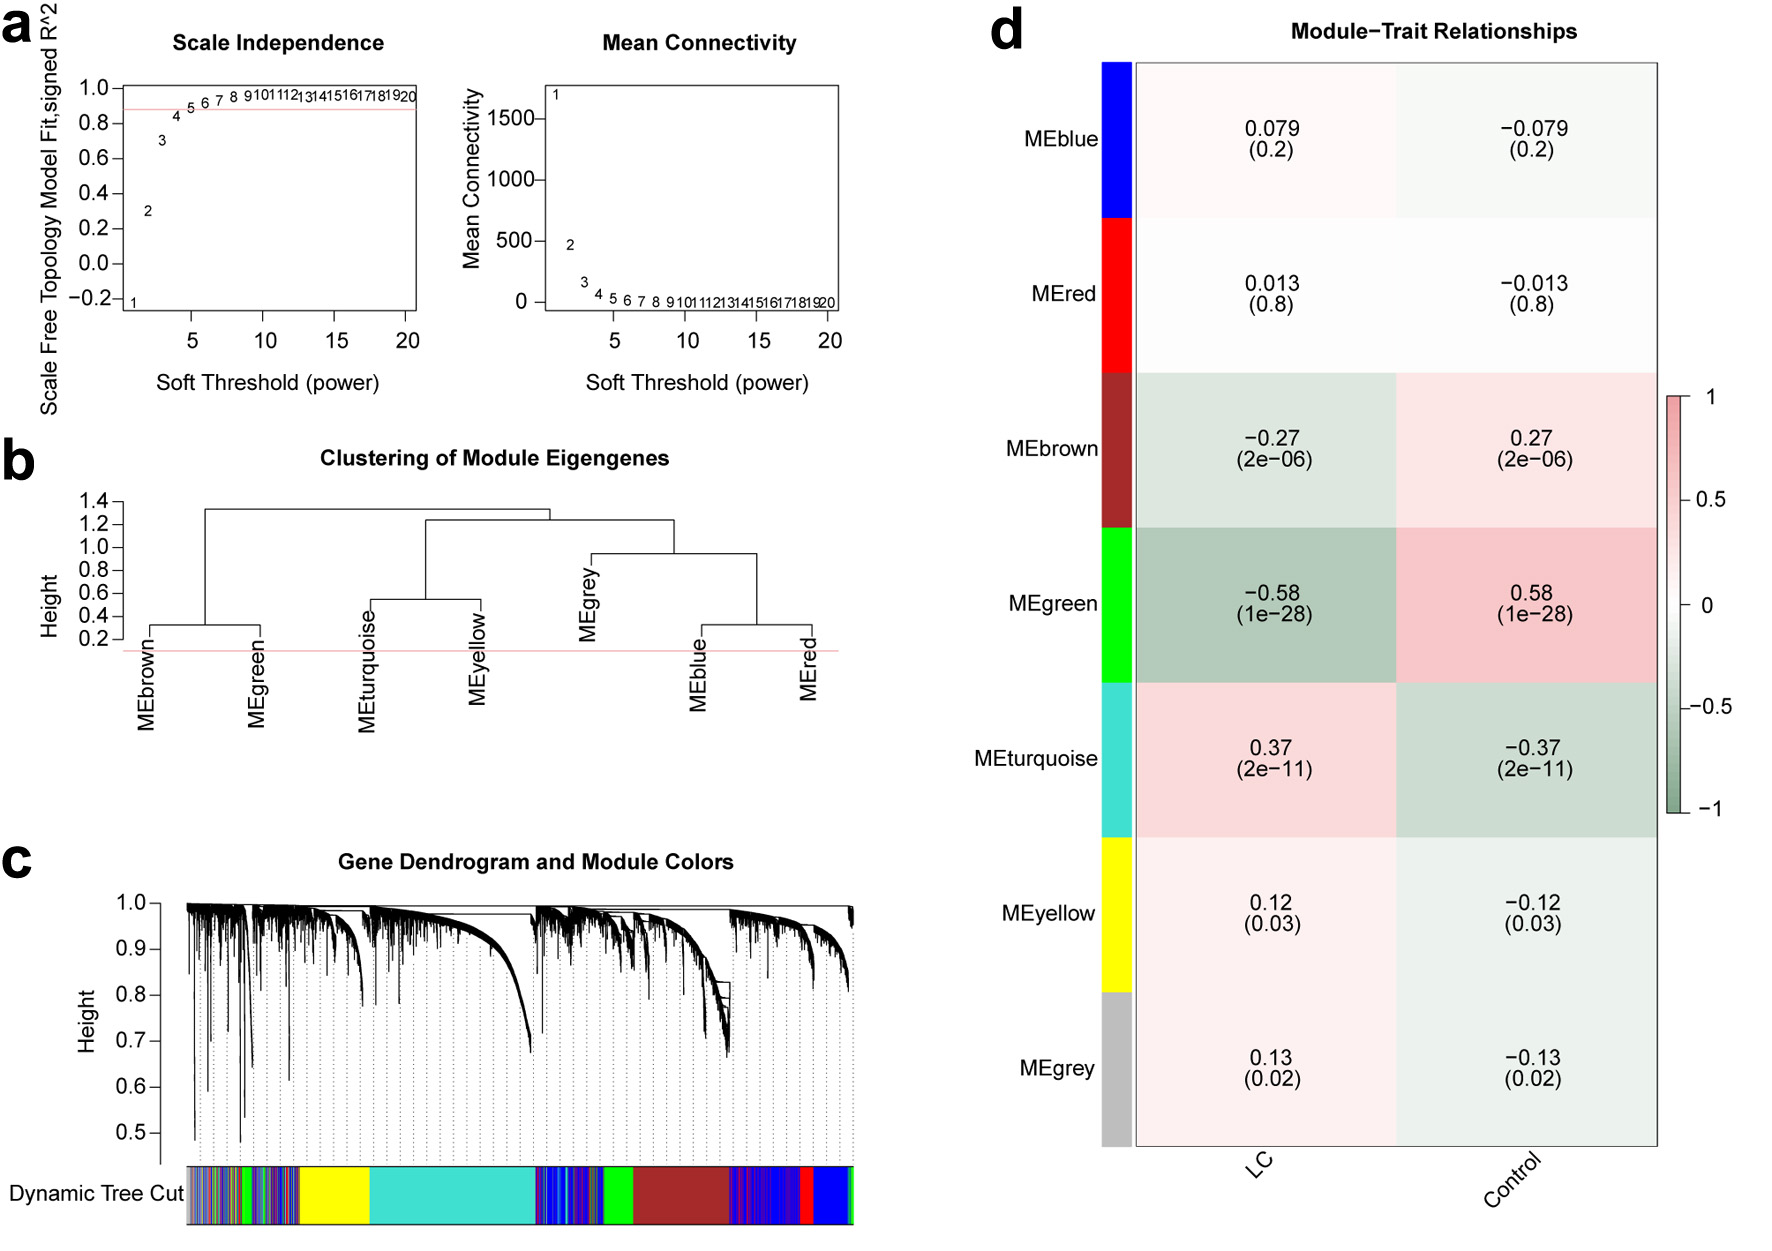
↓ Figure 3. WGCNA of the GSE30219 dataset. (a) Determination of the optimal soft-thresholding parameter to establish a scale-free network architecture. The left panel illustrates the scale-free topology fit index across varying powers, while the right panel depicts mean connectivity. (b) Hierarchical clustering dendrogram of genes derived from the top 50% most variable genes. (c) Module assignment based on hierarchical clustering. The upper section illustrates the gene dendrogram, while the lower section depicts the associated gene modules using distinct color codes. (d) Heatmap of correlations between gene modules and sample groups (LC vs. controls). Correlation strength is indicated by |r| values, where 0.3–0.5 represents weak associations and 0.5–0.8 represents moderate associations. Color indicates direction of association: pink indicates positive correlations and gray-green represents negative correlations. WGCNA: weighted gene co-expression network analysis; LC: lung cancer.
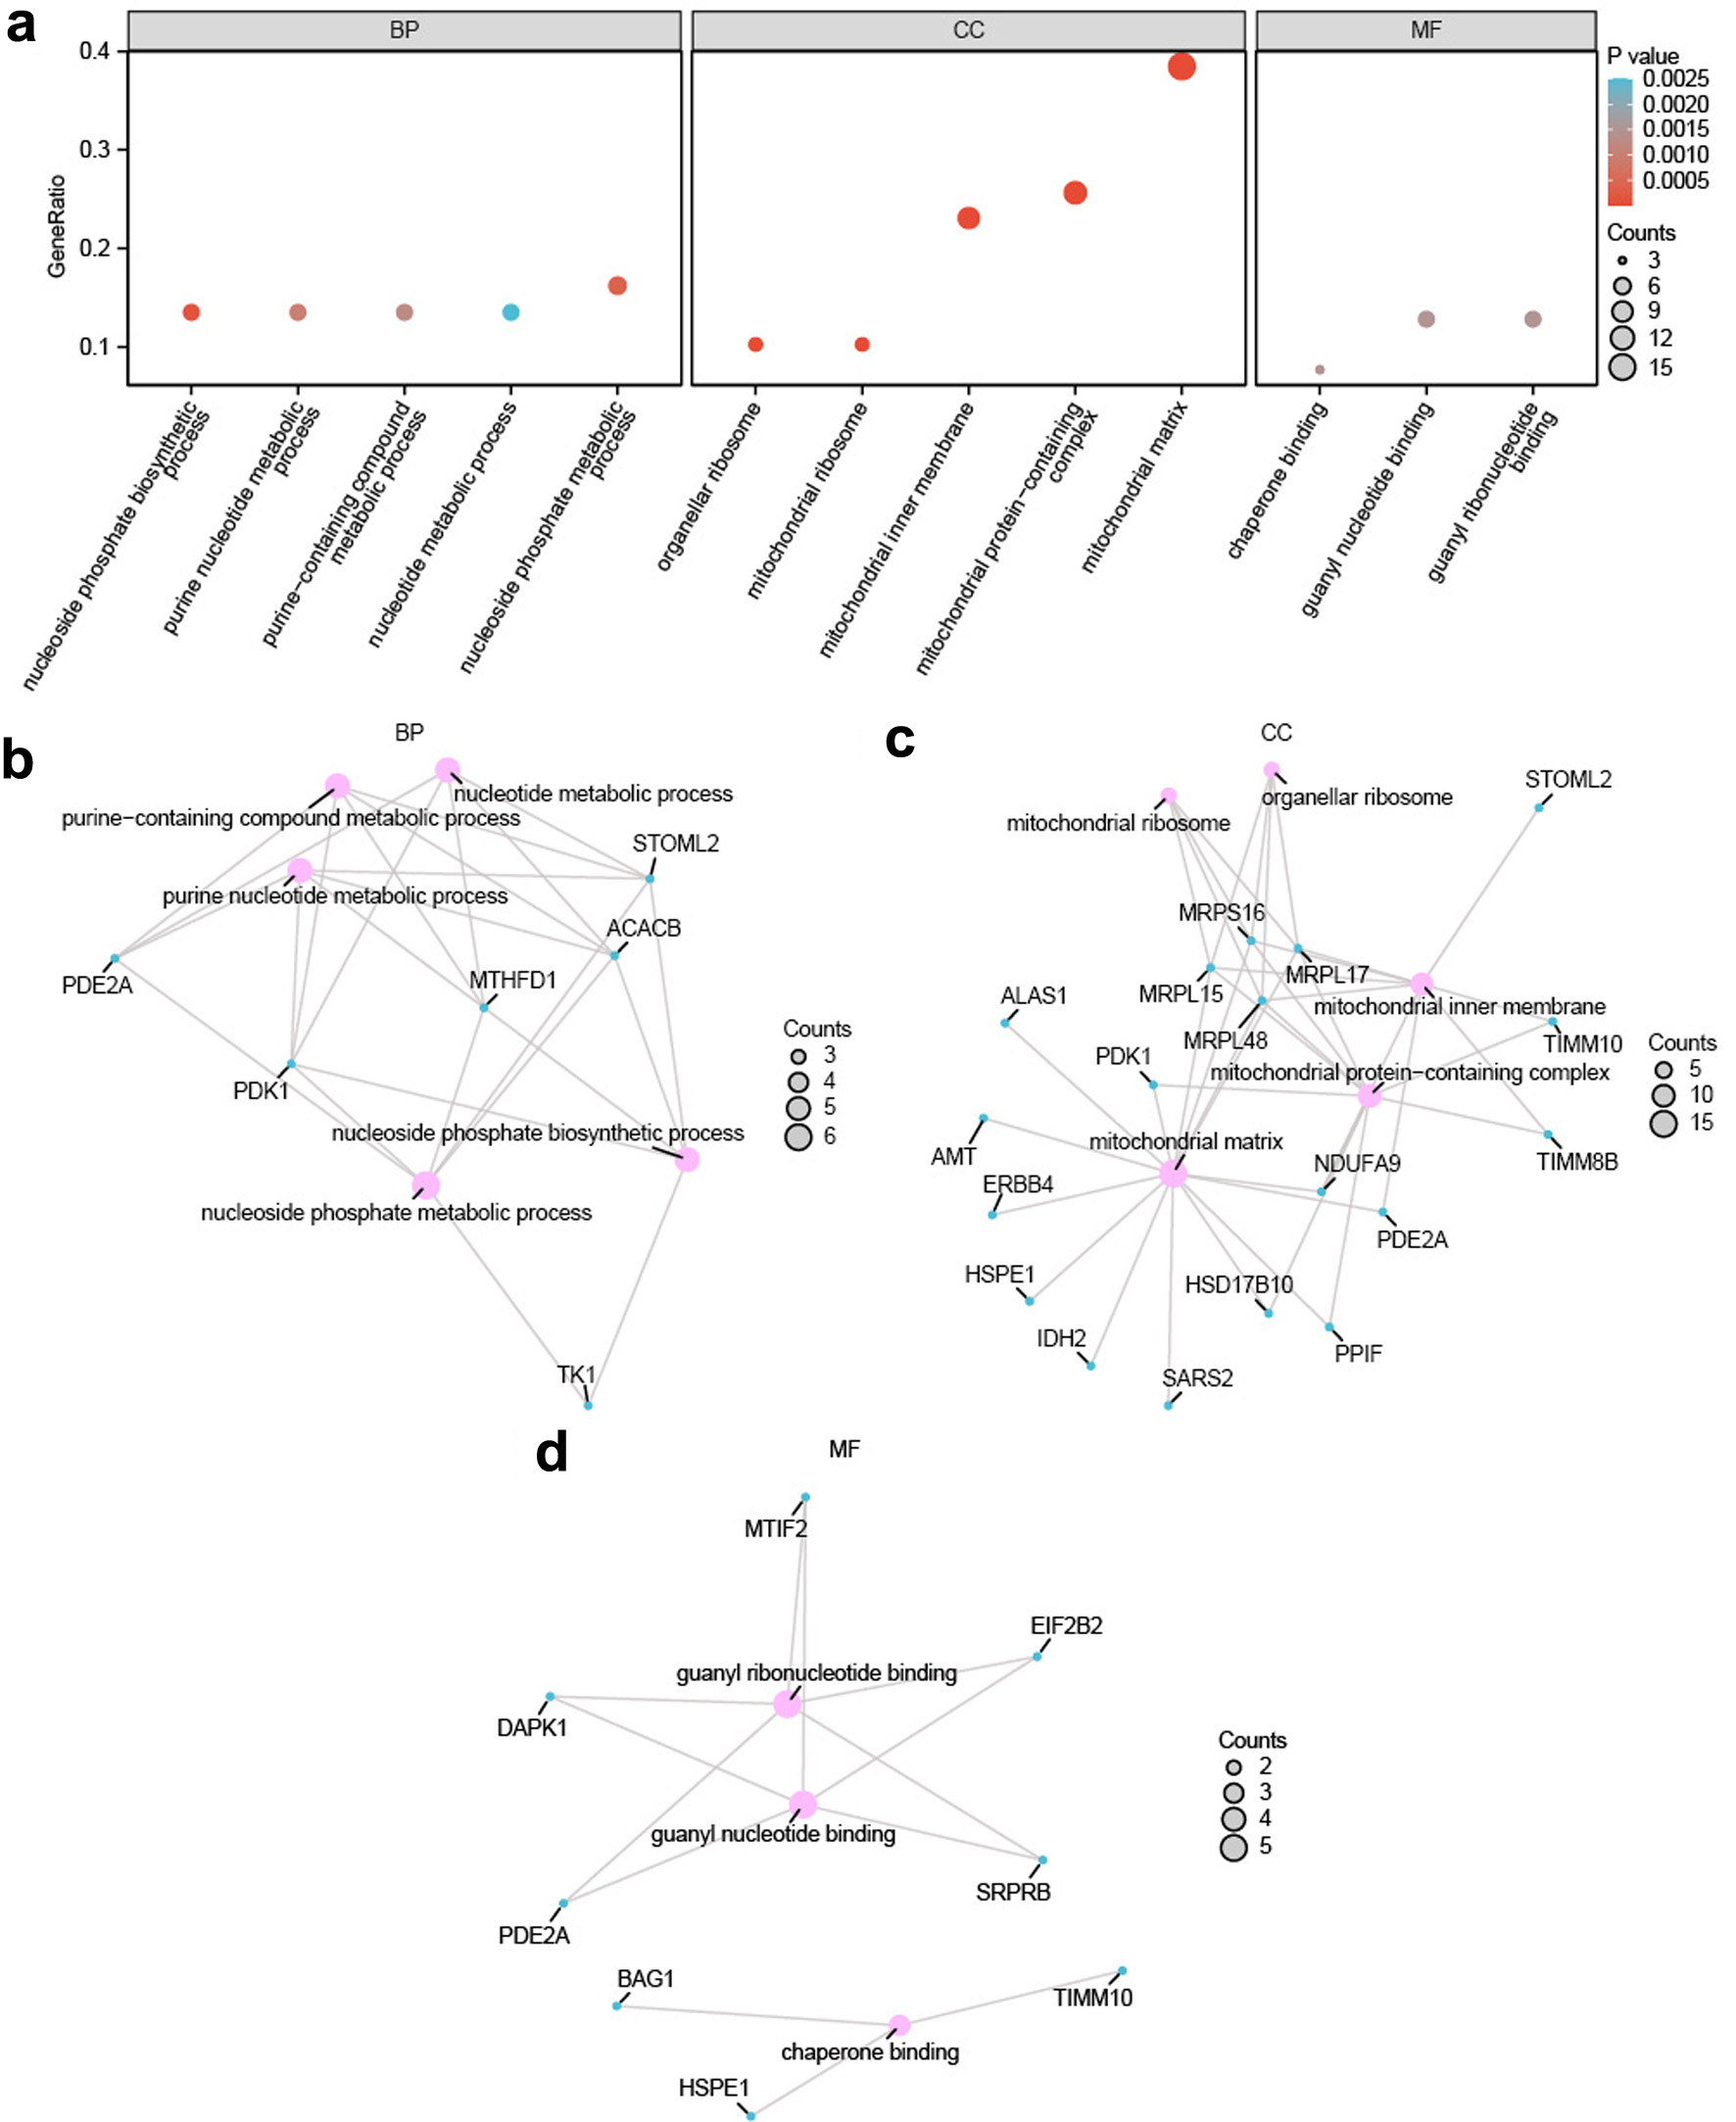
↓ Figure 4. Gene Ontology enrichment analysis of crosstalk genes. (a) Bubble plot showing GO enrichment results for CGs across BP, CC, and MF. GO terms are shown on the x-axis. Bubble size indicates the number of genes, and color indicates statistical significance, with red indicating lower P-values and blue indicating higher P-values. (b–d) Network plots of enriched GO terms for CGs in BP (b), CC (c), and MF (d). Nodes represent GO terms (light red) and genes (light blue), and edges indicate their associations. Established enrichment thresholds were P < 0.05 and false discovery rate (FDR) < 0.25. CGs: crosstalk genes; GO: Gene Ontology; BP: biological process; CC: cellular component; MF: molecular function.
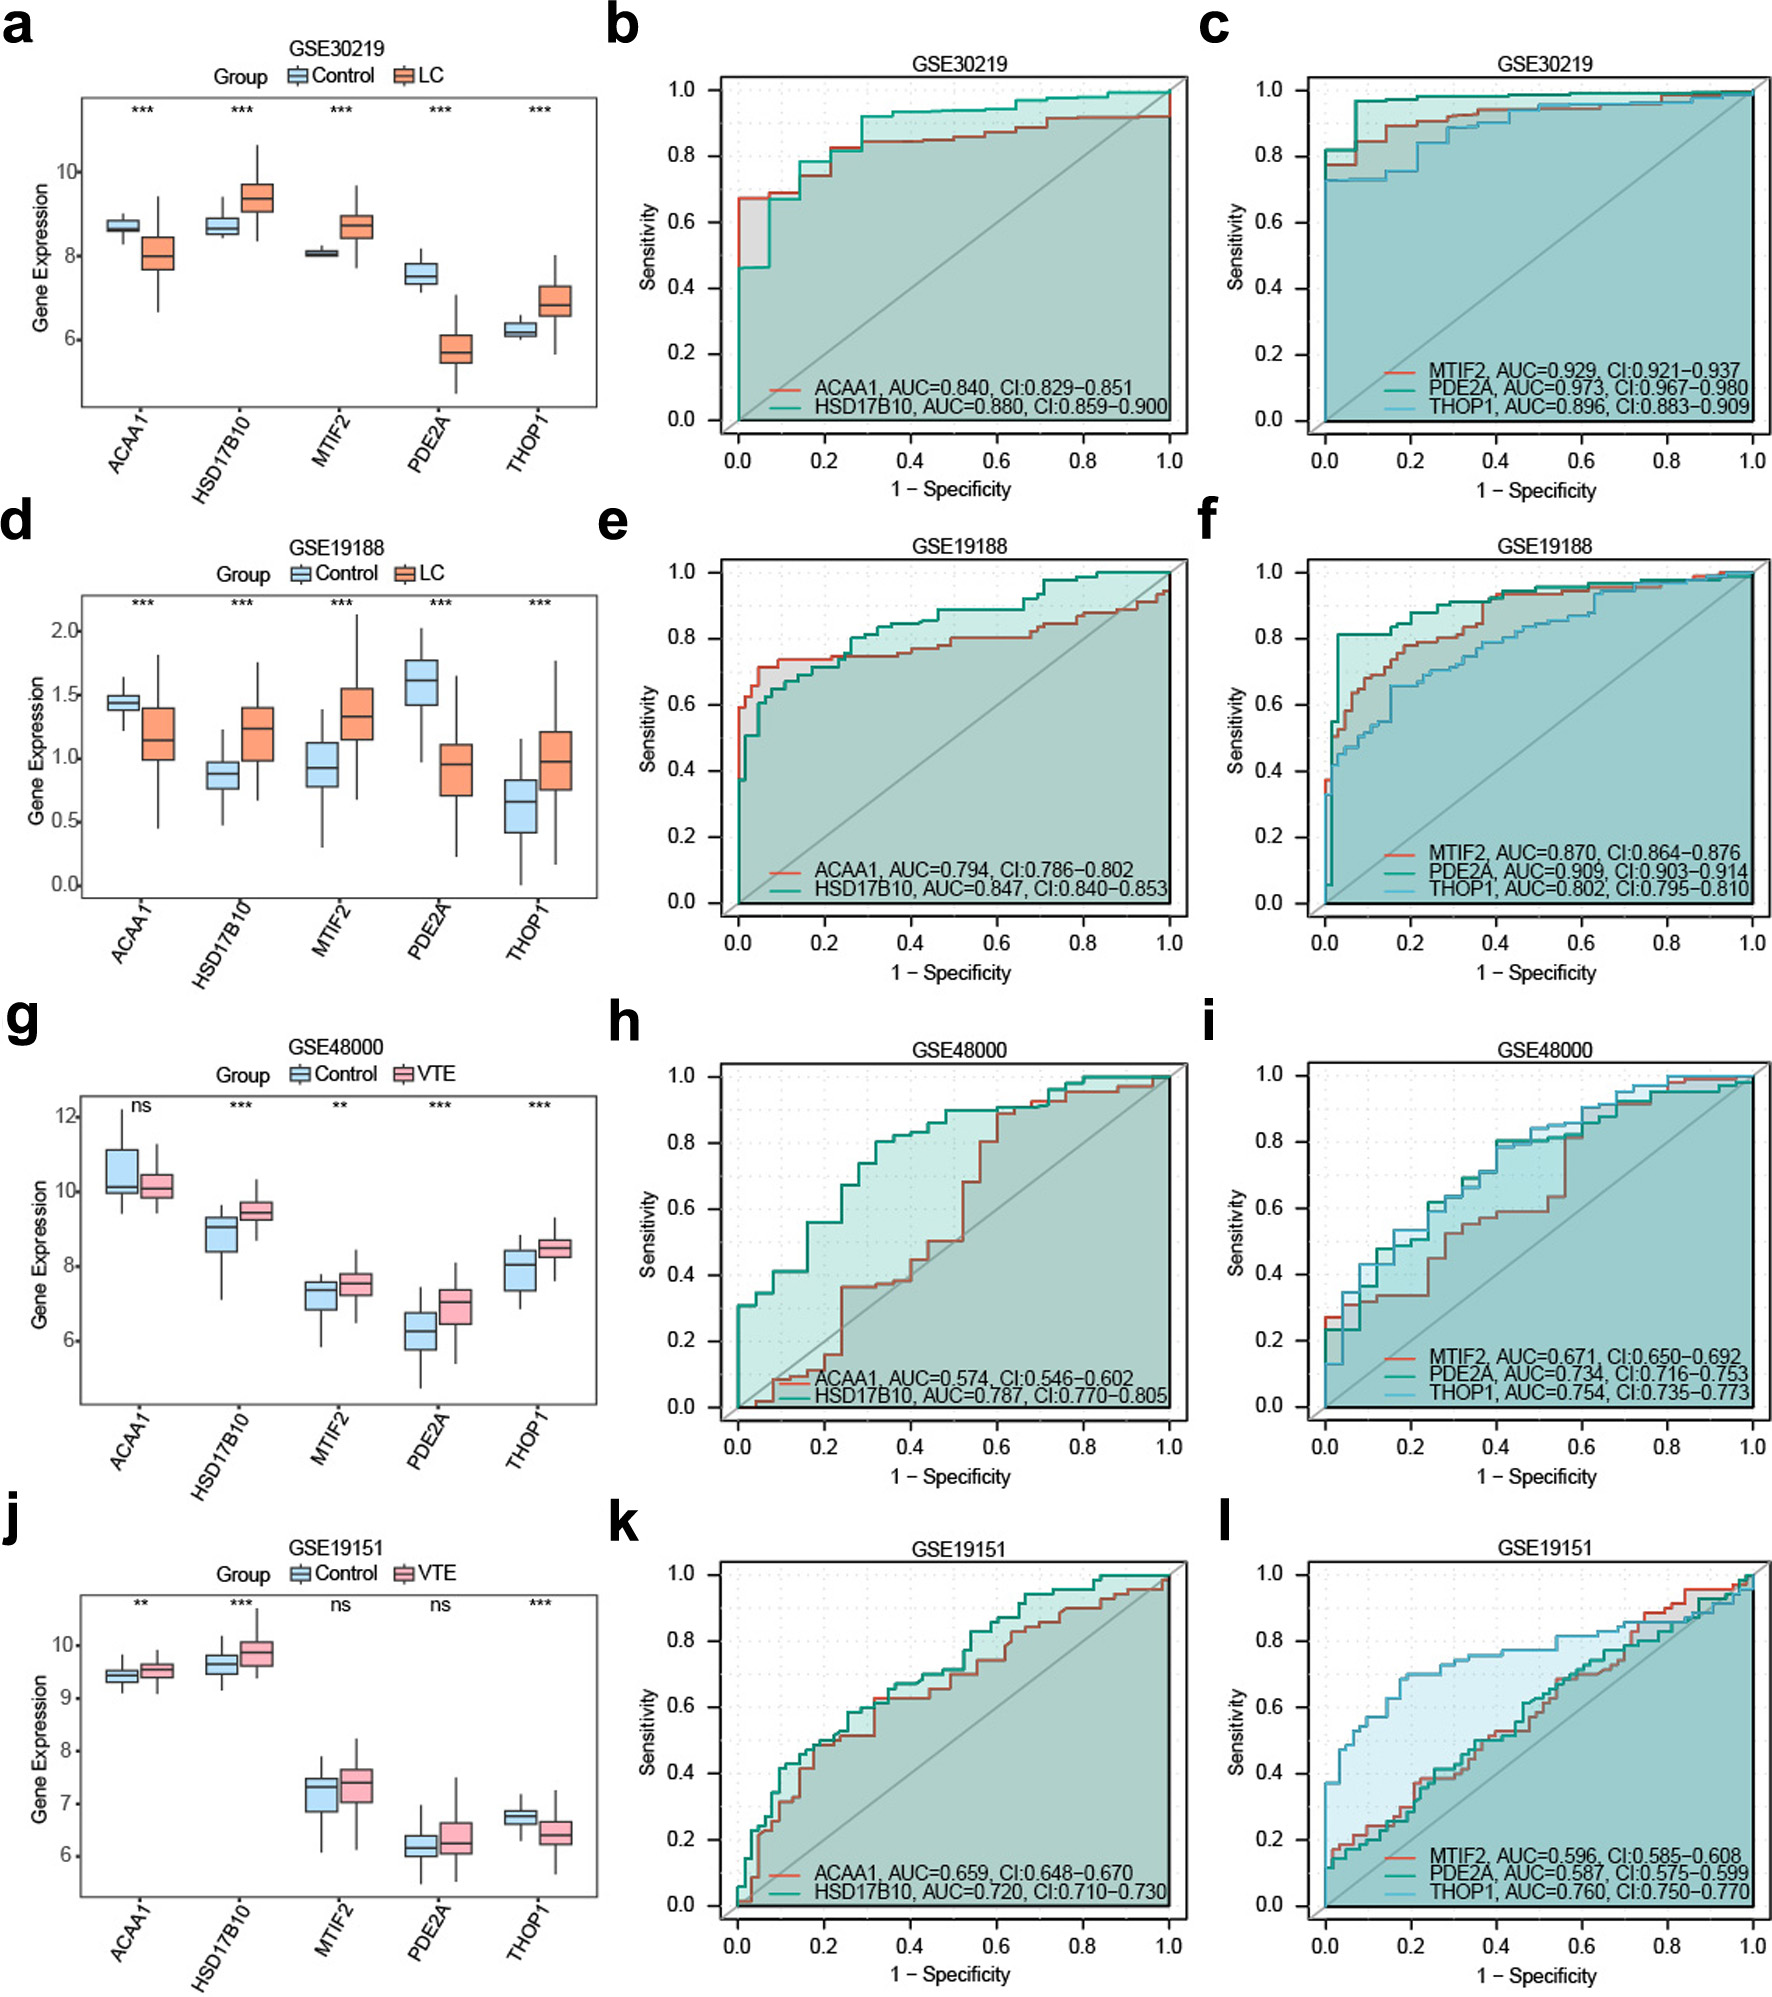
↓ Figure 5. GSVA profiling of the GSE30219 LC dataset. (a) Heatmap of GSVA enrichment scores comparing LC samples with controls. Red corresponds to higher pathway activity; blue corresponds to lower activity. (b) Boxplots showing differences in pathway enrichment scores between the LC and control groups. Orange represents LC samples, and light blue represents controls. Pathway selection was conducted according to P < 0.05. ***P < 0.001, reflecting significant differences between groups.
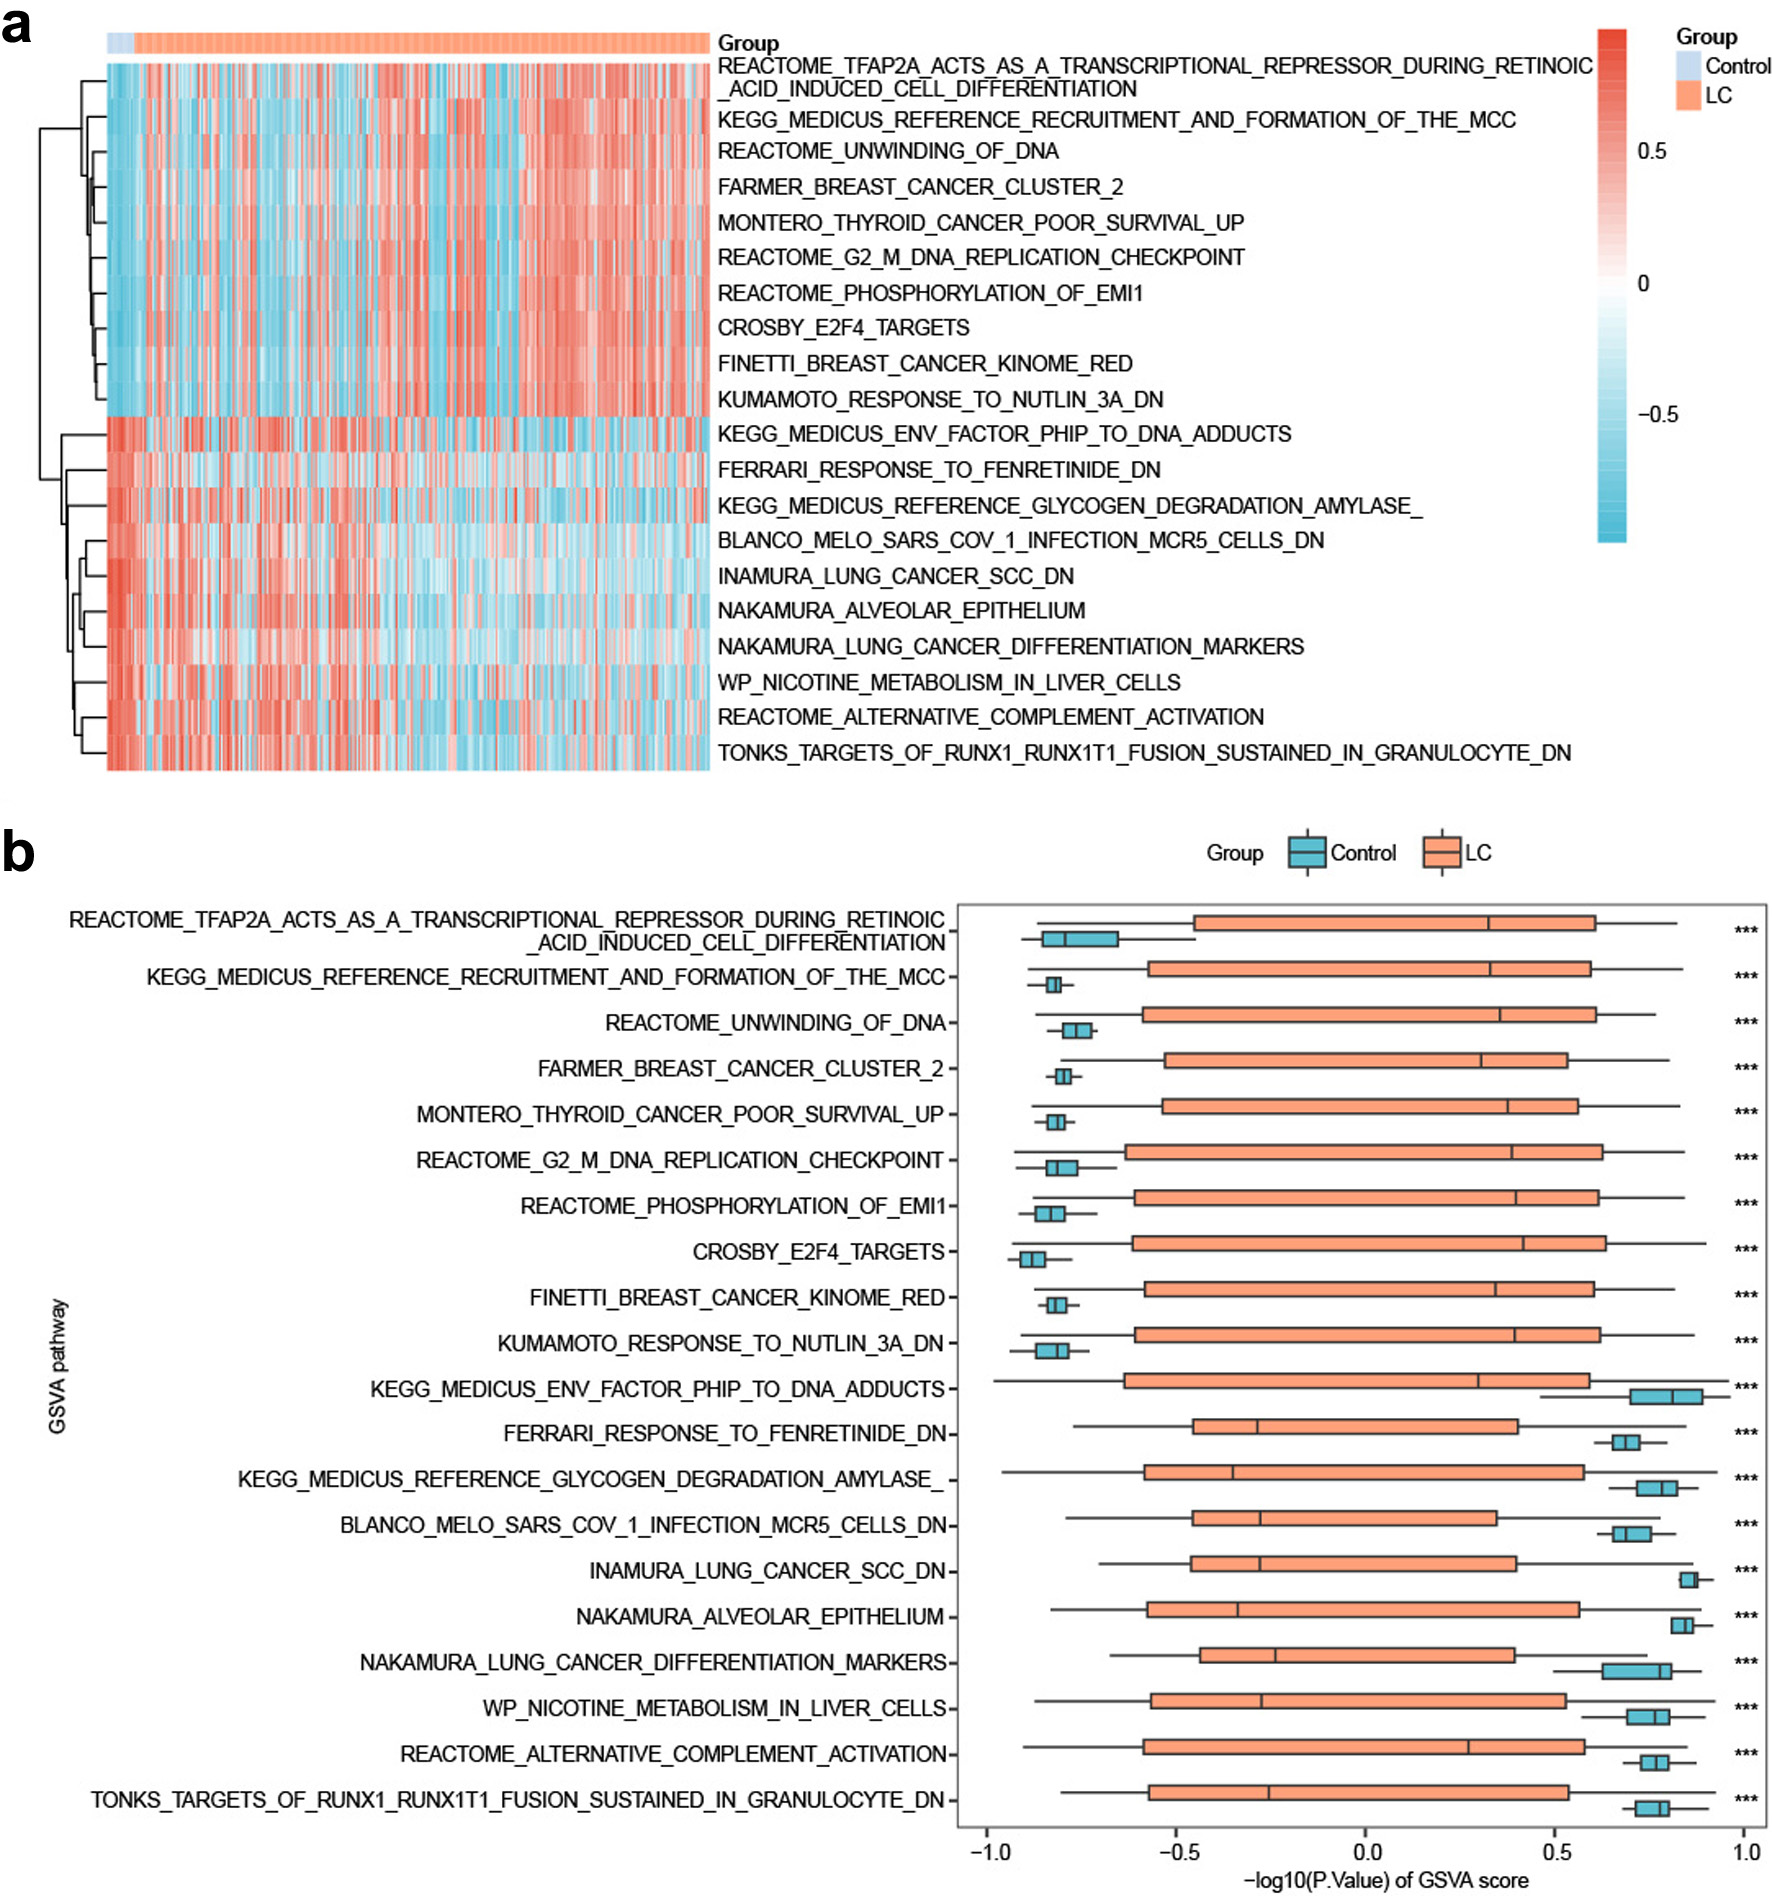
↓ Figure 6. Identification of pivotal diagnostic genes. (a) LASSO cross-validation curve showing model performance in the LC dataset (GSE30219). (b) Coefficient paths illustrating variable selection in the LC dataset (GSE30219). (c) Forest plot showing effect estimates and confidence intervals of diagnostic genes associated with LC. (d) Diagnostic accuracy assessment of the CG-derived LASSO model applied to the VTE dataset (GSE48000). (e) Trajectory plots depicting the shrinkage paths of coefficients for predictors in the VTE cohort (GSE48000) under LASSO regularization. (f) Forest plot showing effect estimates and confidence intervals of diagnostic genes associated with VTE. (g) Venn diagram showing the overlap between LC- and VTE-associated diagnostic genes identified by LASSO. LC: lung cancer; VTE: venous thromboembolism; LASSO: least absolute shrinkage and selection operator; CGs: crosstalk genes.
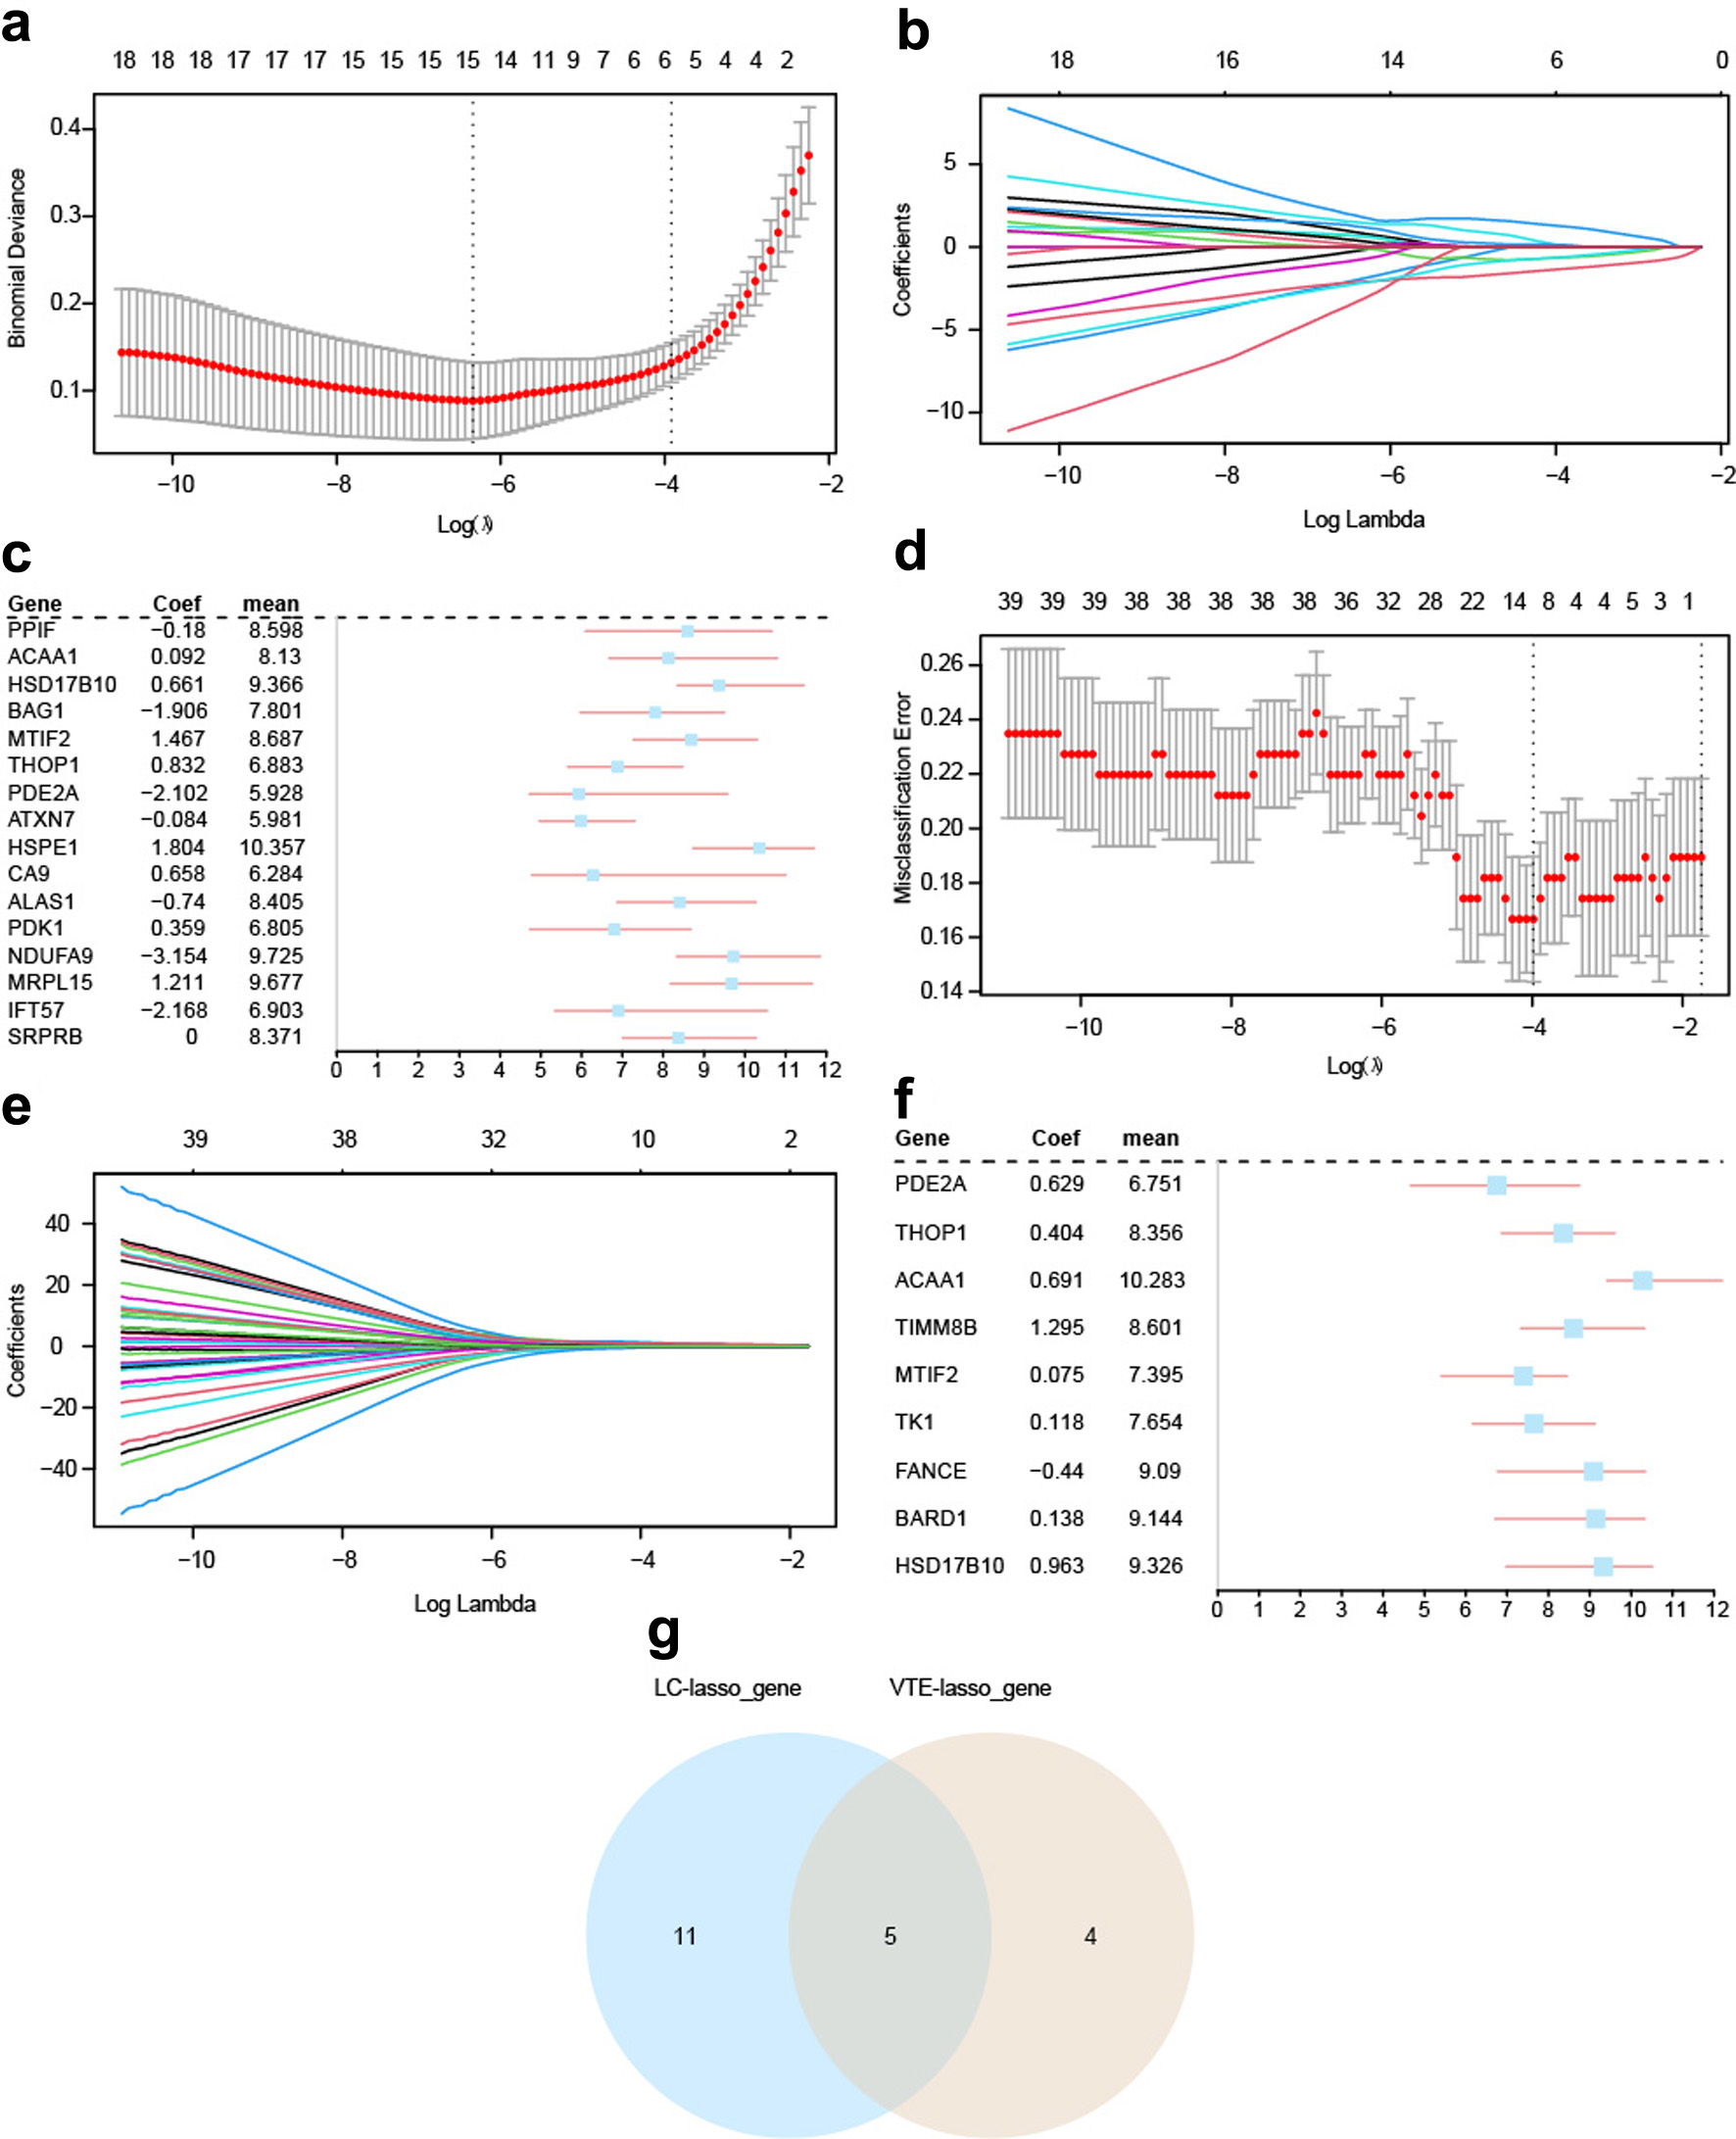
↓ Figure 7. Development and validation of diagnostic logistic regression models using signature genes. (a) Nomogram for predicting LC based on the multivariable logistic regression model in GSE30219. (b) Calibration plot showing agreement between predicted and recorded findings in GSE30219. (c) DCA plot evaluating the practical application of the model in GSE30219 in clinical settings. (d, e) ROC curves showing model performance in the primary dataset GSE30219 (d) and the validation dataset GSE19188 (e). (f) Nomogram for predicting VTE utilizing a multivariable logistic regression framework in GSE48000. (g) Calibration plot showing consistency between anticipated and actual results in GSE48000. (h) DCA plot evaluating the practical application of the model in GSE48000. (i, j) ROC curves showing model performance in GSE48000 (i) and the validation dataset GSE19151 (j). In DCA plots, the y-axis quantifies net benefit, and the x-axis indicates threshold probability. In ROC curves, AUC values closer to 1.0 indicate superior diagnostic efficacy, values of 0.5–0.7 indicate suboptimal precision, and 0.7–0.9 indicate moderate precision. DCA: decision curve analysis; ROC: receiver operating characteristic; AUC: area under the curve; TPR: true positive rate; FPR: false positive rate.
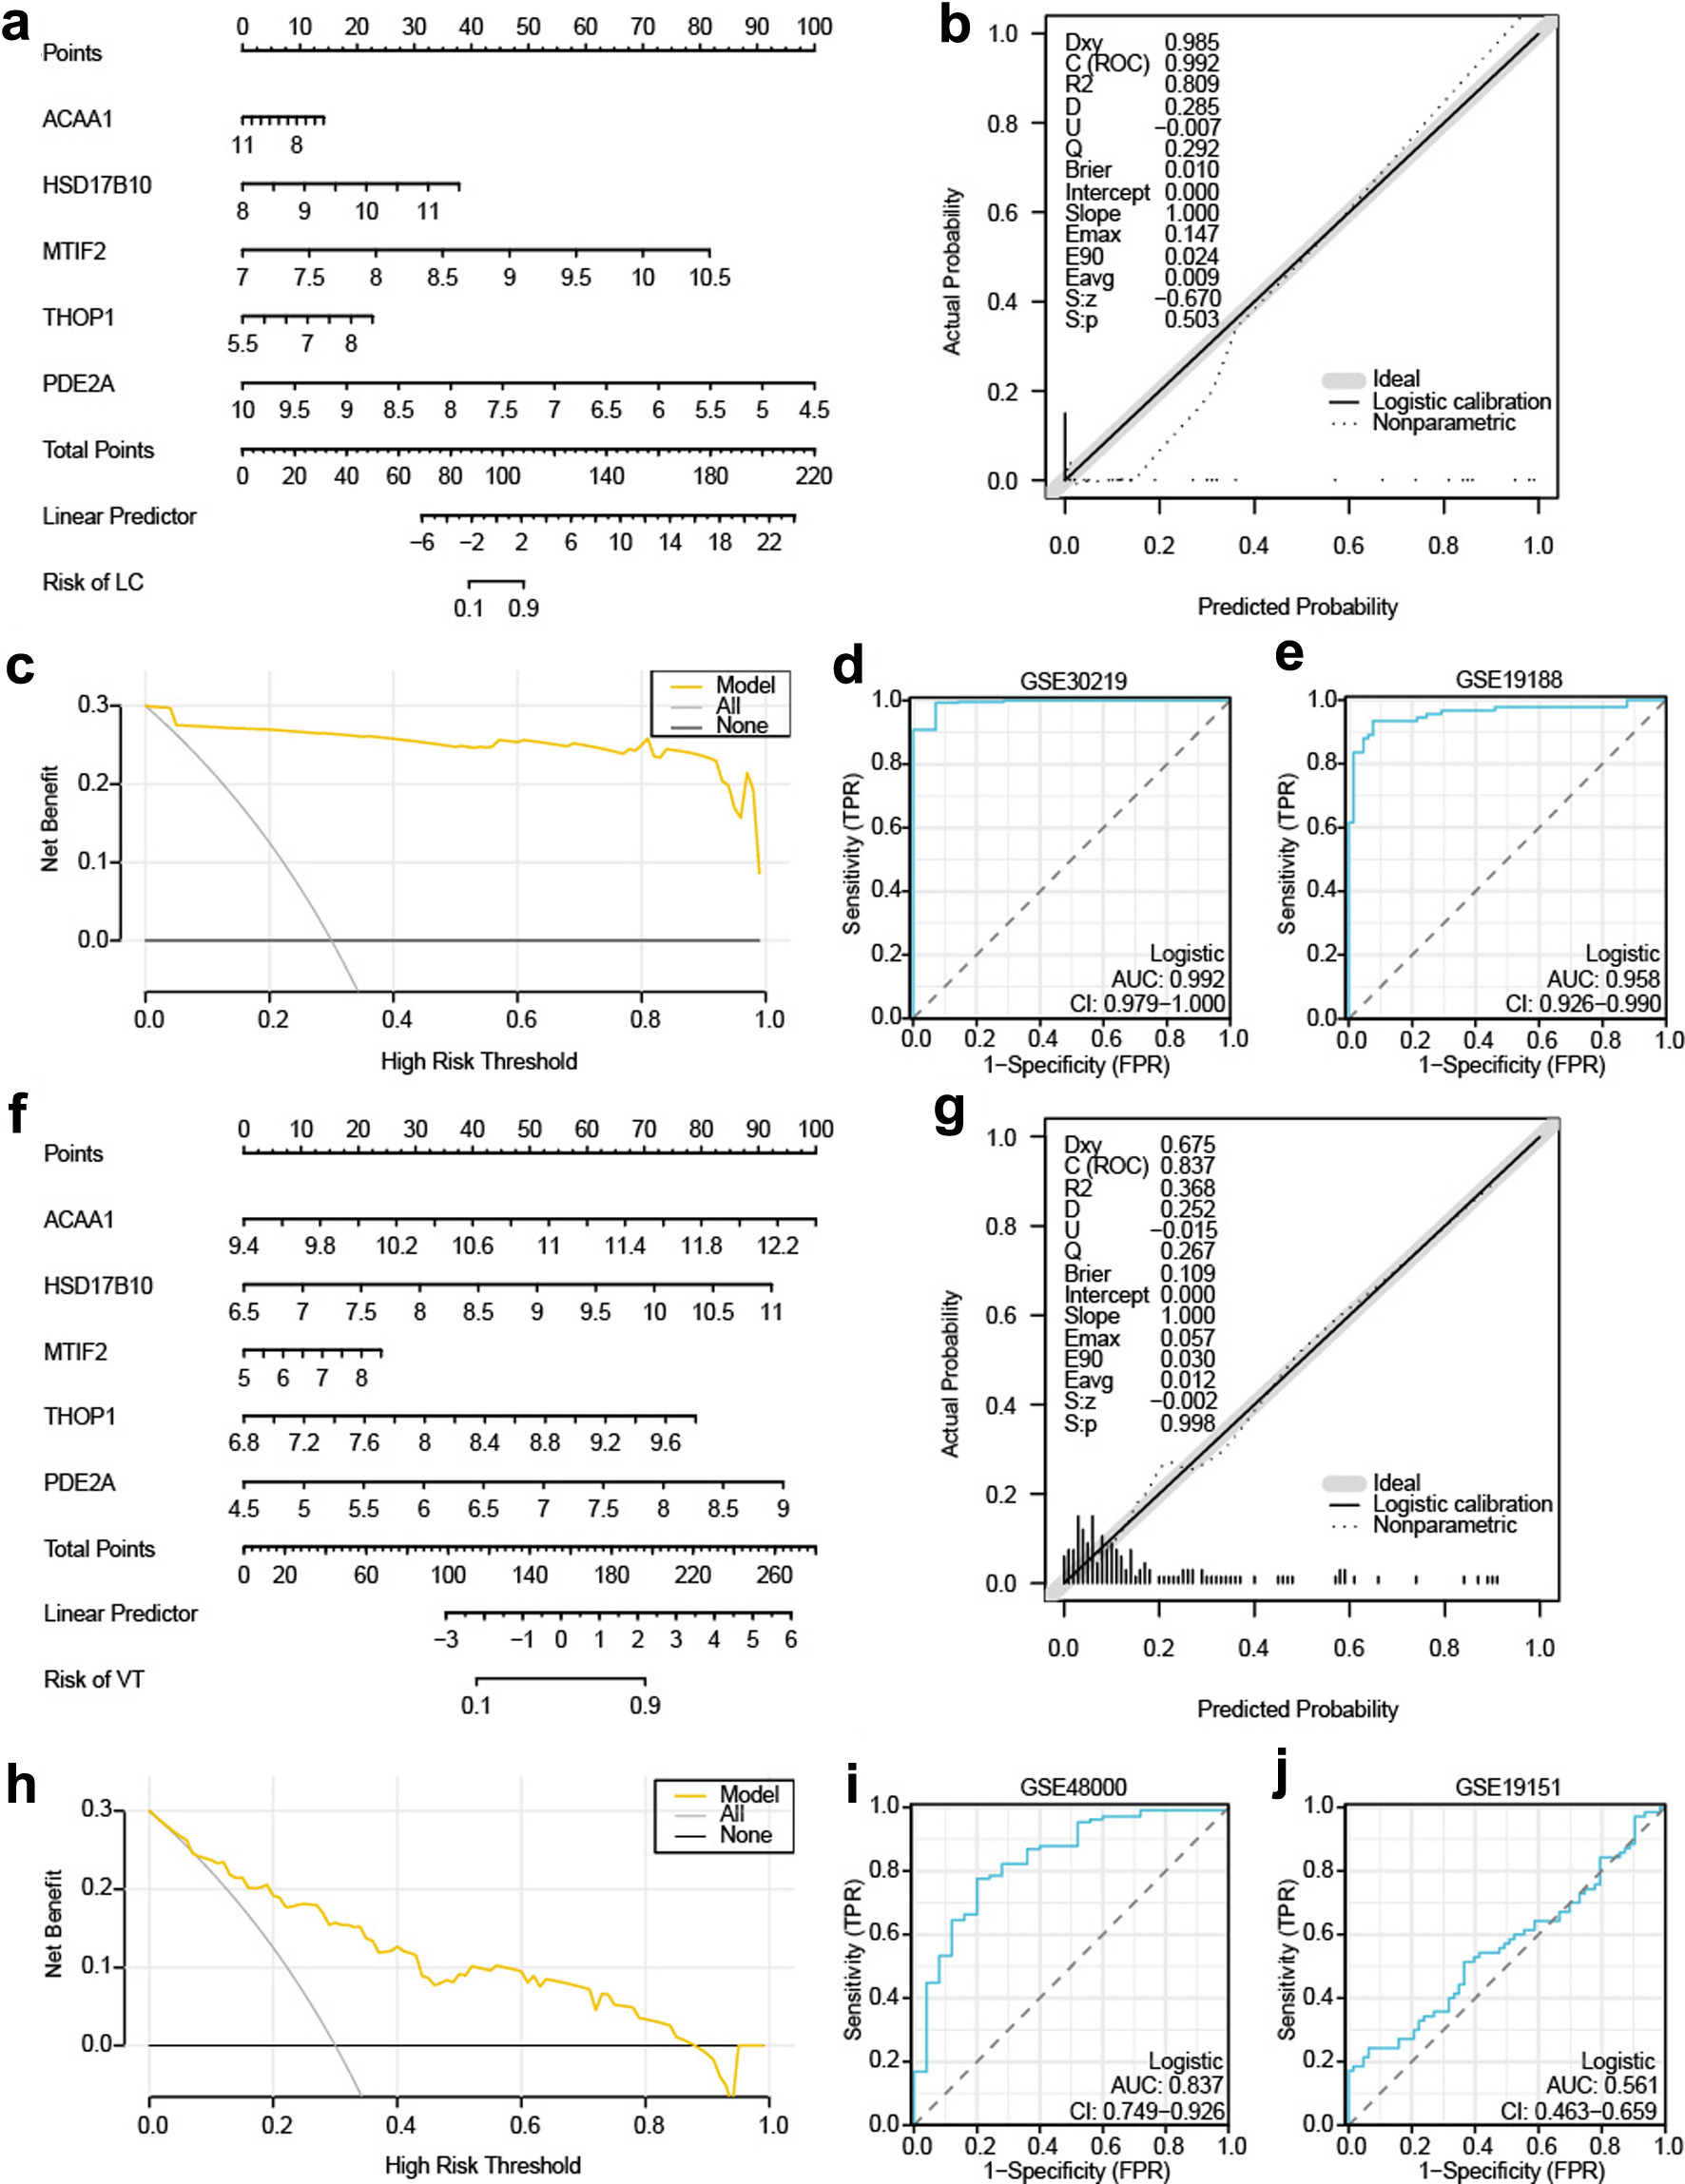
↓ Figure 8. Validation of differential expression and diagnostic performance of candidate genes. (a) Expression comparison of key genes between LC and control samples in GSE30219. (b, c) Further analyses in GSE30219: (b) expression levels of ACAA1 and HSD17B10; (c) ROC curves for MTIF2, THOP1, and PDE2A. (d) Expression comparison of key genes between LC and control samples in GSE19188. (e, f) Further analyses in GSE19188: (e) expression levels of ACAA1 and HSD17B10; (f) ROC curves for MTIF2, THOP1, and PDE2A. (g) Expression comparison of critical genes distinguishing VTE specimens from control cohorts in GSE48000. (h, i) Further analyses in GSE48000: (h) expression levels of ACAA1 and HSD17B10; (i) ROC curves for MTIF2, THOP1, and PDE2A. (j) Expression comparison of key genes between VTE and control samples in GSE19151. (k, l) Further analyses in GSE19151: (k) expression levels of ACAA1 and HSD17B10; (l) ROC curves for MTIF2, THOP1, and PDE2A. Statistical significance is denoted as follows: ns, not significant (P ≥ 0.05); **P < 0.01; ***P < 0.001. Diagnostic performance is interpreted based on AUC values: 0.5–0.7 reflects limited discriminatory power, 0.7–0.9 denote moderate performance, and > 0.9 indicates excellent accuracy. ROC: receiver operating characteristic; LC: lung cancer; AUC: area under the curve; VTE: venous thromboembolism. Color coding: blue, control; orange, LC; pink, VTE.
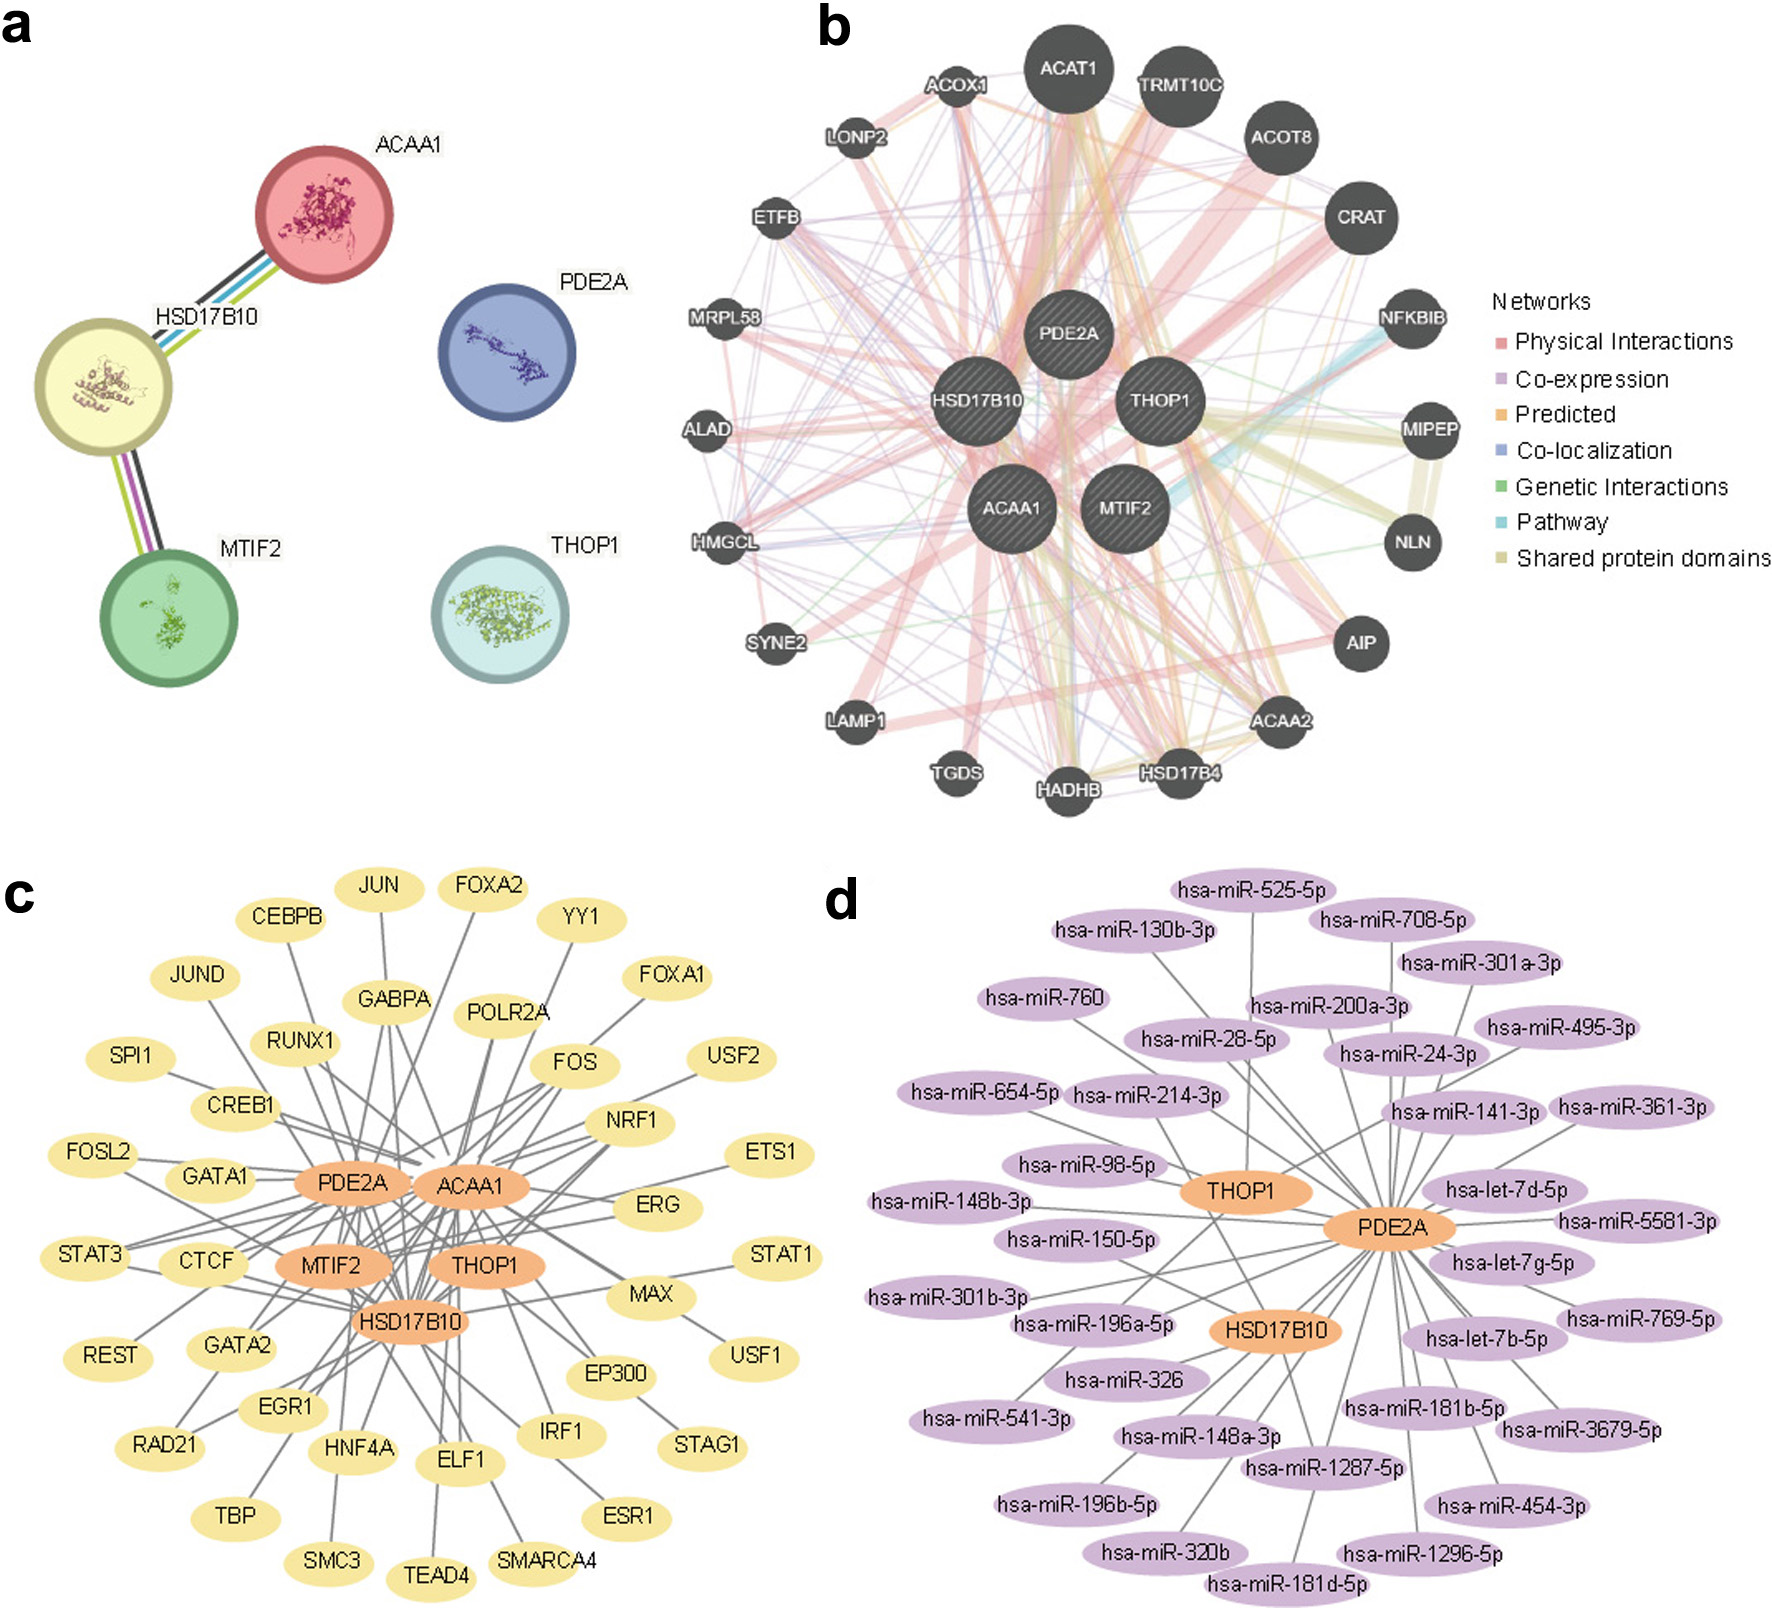
↓ Figure 9. Investigation of regulatory networks governing key genes. (a) PPI network constructed using STRING, showing interactions among the five genes. (b) GeneMANIA network showing functional associations between the five genes and related proteins. Edge colors represent distinct interaction types. (c) mRNA–TF regulatory network showing interactions between genes and TFs. (d) mRNA–miRNA regulatory network showing interactions between genes and miRNAs. In panels c and d, orange nodes represent mRNAs, yellow nodes represent TFs, and purple nodes represent miRNAs. TF: transcription factor; PPI: protein–protein interaction.
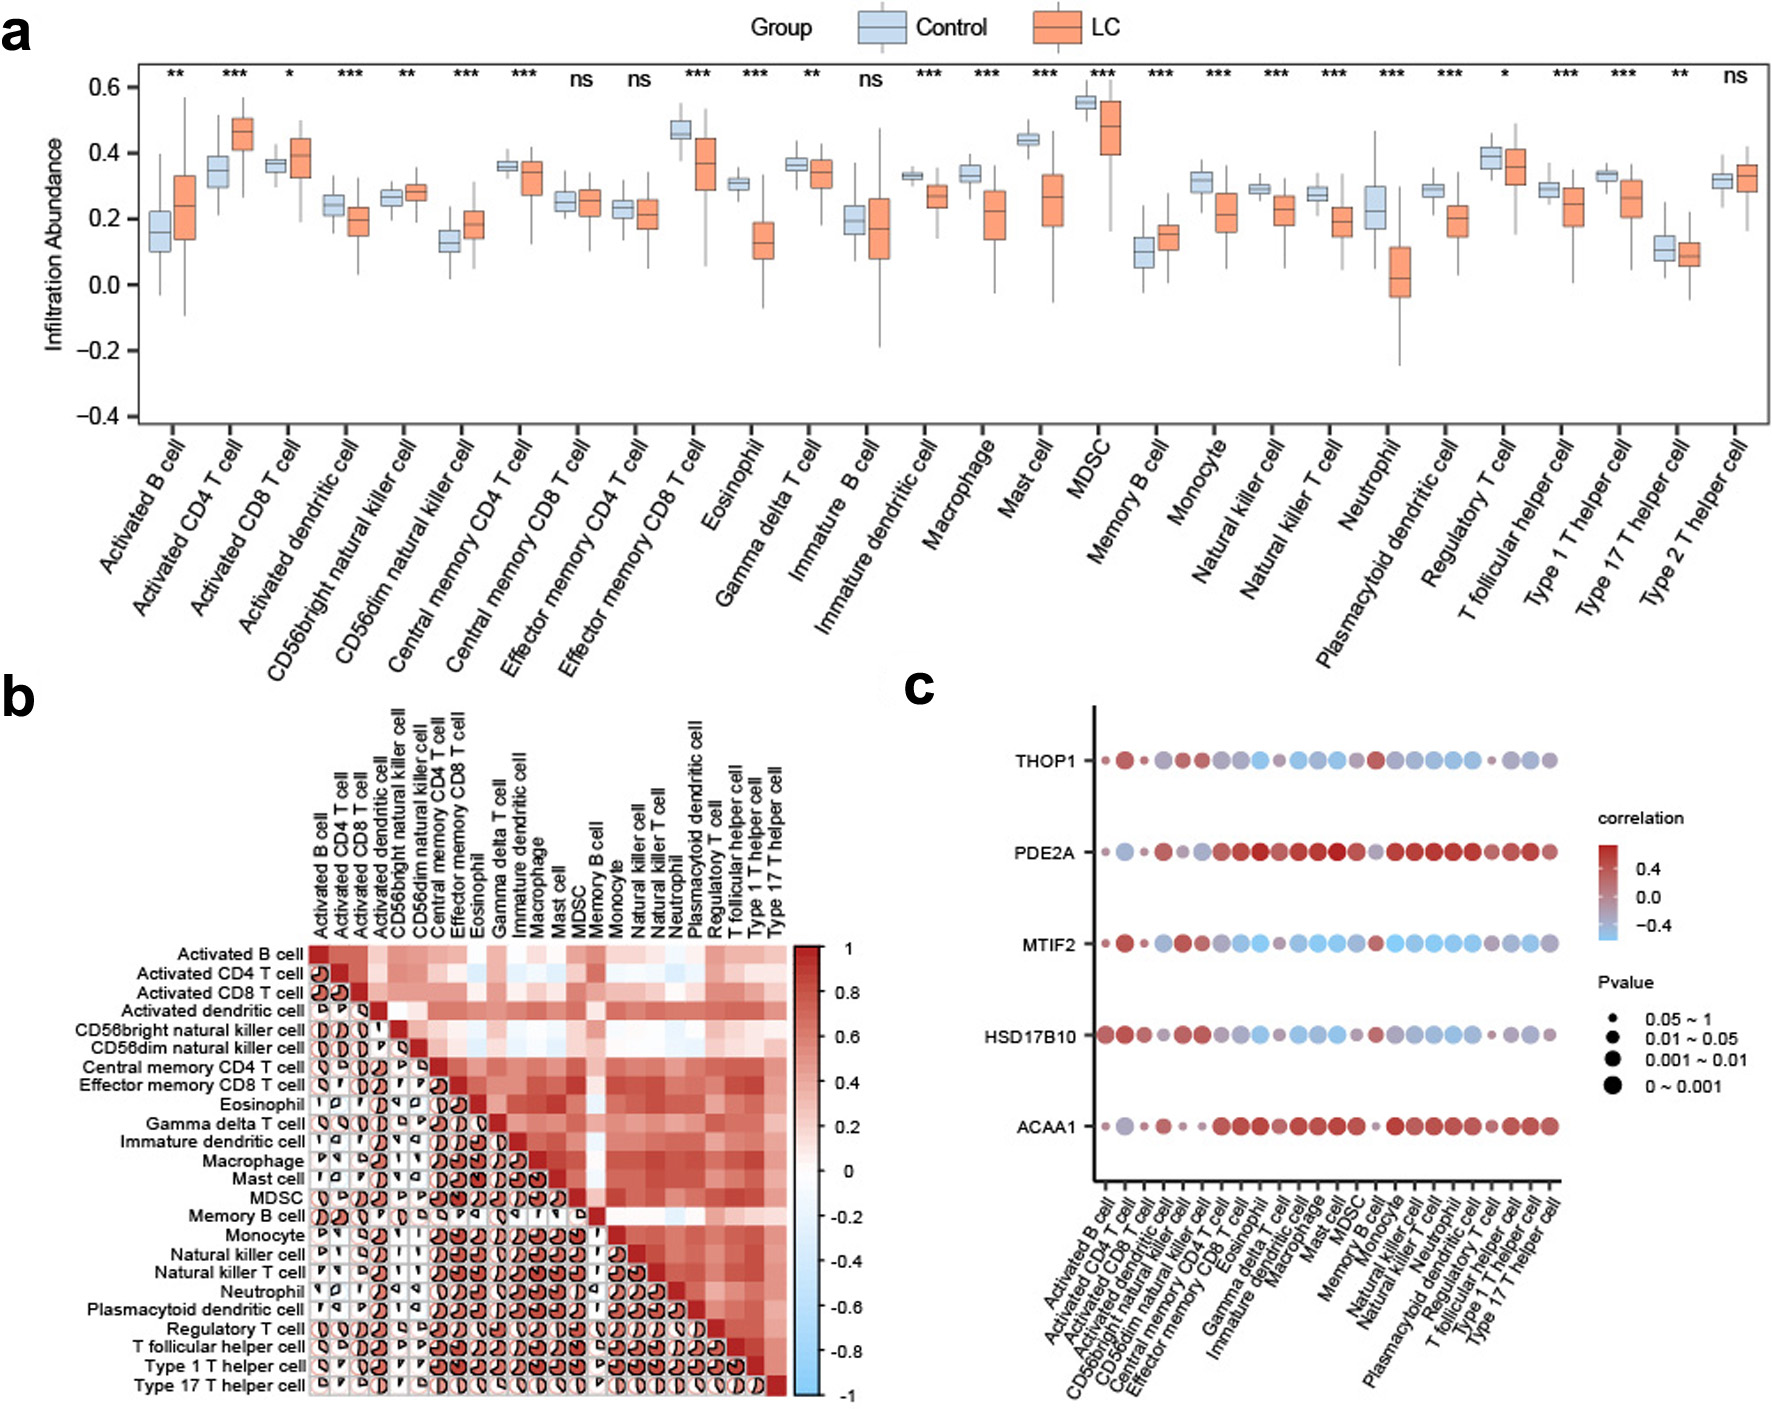
↓ Figure 10. Immune infiltration profiling using ssGSEA in the GSE19188 dataset. (a) Boxplots comparing the abundance of immune cell subsets between control and LC samples. (b) Heatmap showing correlations among immune cell populations in GSE19188. (c) Bubble plot illustrating the correlations between gene expression levels and immune cell infiltration. Statistical significance is indicated as follows: ns, not significant (P ≥ 0.05); *P < 0.05; **P < 0.01; ***P < 0.001. Correlation strength is based on |r|, where < 0.3 reflects negligible, 0.3–0.5 weak, 0.5–0.8 moderate, and > 0.8 strong correlations. Color coding: light blue, control; orange, LC. In panels b and c, red indicates a positive correlation and blue indicates a negative correlation, with color intensity reflecting correlation strength. ssGSEA: single-sample gene set enrichment analysis; LC: lung cancer.
Tables
↓ Table 1. Results of GO Enrichment Analysis for CGs
| ONTOLOGY | ID | Description | GeneRatio | BgRatio | P value | P.adjust | q value |
|---|
| GO: Gene Ontology; BP: biological process; CC: cellular component; MF: molecular function; KEGG: Kyoto Encyclopedia of Genes and Genomes; CGs: crosstalk genes. |
| BP | GO:0006753 | Nucleoside phosphate metabolic process | 6/37 | 495/18,800 | 0.00037551 | 0.04686129 | 0.03586955 |
| BP | GO:1901293 | Nucleoside phosphate biosynthetic process | 5/37 | 257/18,800 | 0.00013997 | 0.04087129 | 0.03128456 |
| BP | GO:0006163 | Purine nucleotide metabolic process | 5/37 | 394/18,800 | 0.00098912 | 0.05137613 | 0.0393254 |
| BP | GO:0072521 | Purine-containing compound metabolic process | 5/37 | 416/18,800 | 0.00125965 | 0.05137613 | 0.0393254 |
| BP | GO:0009117 | Nucleotide metabolic process | 5/37 | 487/18,800 | 0.00251283 | 0.06399664 | 0.04898565 |
| CC | GO:0005759 | Mitochondrial matrix | 15/39 | 473/19,594 | 6.5367 × 10⁻¹⁵ | 8.1055 × 10⁻¹³ | 6.5367 × 10⁻¹³ |
| CC | GO:0098798 | Mitochondrial protein-containing complex | 10/39 | 281/19,594 | 1.3819 × 10⁻¹⁰ | 8.5675 × 10⁻⁹ | 6.9093 × 10⁻⁹ |
| CC | GO:0005743 | Mitochondrial inner membrane | 9/39 | 491/19,594 | 3.9314 × 10⁻⁷ | 1.625 × 10⁻⁵ | 1.3105 × 10⁻⁵ |
| CC | GO:0000313 | Organellar ribosome | 4/39 | 81/19,594 | 1.9965 × 10⁻⁵ | 0.00045444 | 0.00036649 |
| CC | GO:0005761 | Mitochondrial ribosome | 4/39 | 81/19,594 | 1.9965 × 10⁻⁵ | 0.00045444 | 0.00036649 |
| MF | GO:0051087 | Chaperone binding | 3/39 | 106/18,410 | 0.00145835 | 0.06834594 | 0.04778702 |
| MF | GO:0019001 | Guanyl nucleotide binding | 5/39 | 401/18,410 | 0.00149663 | 0.06834594 | 0.04778702 |
| MF | GO:0032561 | Guanyl ribonucleotide binding | 5/39 | 401/18,410 | 0.00149663 | 0.06834594 | 0.04778702 |
↓ Table 2. Results of GSVA for GSE30219
| logFC | AveExpr | t | P value | Adjusted P value | B |
|---|
| GSVA: gene set variation analysis. |
| CROSBY_E2F4_TARGETS | 0.956108 | 0.049159 | 5.724314 | 2.421722828 × 10⁻⁸ | 6.513767243 × 10⁻⁷ | 8.781659 |
| MONTERO_THYROID_CANCER_POOR_SURVIVAL_UP | 0.89573 | 0.059486 | 5.865418 | 1.133022404 × 10⁻⁸ | 4.452922465 × 10⁻⁷ | 9.503221 |
| REACTOME_PHOSPHORYLATION_OF_EMI1 | 0.884334 | 0.023819 | 5.451044 | 1.012865704 × 10⁻⁷ | 1.473852067 × 10⁻⁶ | 7.424824 |
| FINETTI_BREAST_CANCER_KINOME_RED | 0.883546 | 0.042484 | 5.746419 | 2.152025314 × 10⁻⁸ | 6.226890456 × 10⁻⁷ | 8.893763 |
| KUMAMOTO_RESPONSE_TO_NUTLIN_3A_DN | 0.878895 | 0.02374 | 5.305902 | 2.118769427 × 10⁻⁷ | 2.438604173 × 10⁻⁶ | 6.726374 |
| REACTOME_G2_M_DNA_REPLICATION_CHECKPOINT | 0.862235 | 0.022591 | 5.266889 | 2.576893984 × 10⁻⁷ | 2.800822227 × 10⁻⁶ | 6.541305 |
| FARMER_BREAST_CANCER_CLUSTER_2 | 0.854006 | 0.029159 | 6.068145 | 3.713336651 × 10⁻⁹ | 2.403463232 × 10⁻⁷ | 10.56432 |
| KEGG_MEDICUS_REFERENCE_RECRUITMENT_AND_FORMATION_OF_THE_MCC | 0.850781 | 0.010201 | 5.496856 | 7.998335168 × 10⁻⁸ | 1.248156058 × 10⁻⁶ | 7.648502 |
| REACTOME_UNWINDING_OF_DNA | 0.844682 | 0.049118 | 5.458324 | 9.756630028 × 10⁻⁸ | 1.431236275 × 10⁻⁶ | 7.460265 |
| REACTOME_TFAP2A_ACTS_AS_A_TRANSCRIPTIONAL_REPRESSOR_DURING_RETINOIC_ACID_INDUCED_CELL_DIFFERENTIATION | 0.830487 | 0.050275 | 5.584729 | 5.063493258 × 10⁻⁸ | 9.553008036 × 10⁻⁷ | 8.081834 |
| FERRARI_RESPONSE_TO_FENRETINIDE_DN | −0.74442 | -0.02057 | −5.93937 | 7.567324611 × 10⁻⁹ | 3.576921019 × 10⁻⁷ | 9.886972 |
| WP_NICOTINE_METABOLISM_IN_LIVER_CELLS | −0.74873 | 0.015808 | −5.02921 | 8.287434703 × 10⁻⁷ | 6.414700134 × 10⁻⁶ | 5.438605 |
| TONKS_TARGETS_OF_RUNX1_RUNX1T1_FUSION_SUSTAINED_IN_GRANULOCYTE_DN | −0.76245 | 0.018083 | −5.08997 | 6.172673057 × 10⁻⁷ | 5.239527177 × 10⁻⁶ | 5.716414 |
| REACTOME_ALTERNATIVE_COMPLEMENT_ACTIVATION | −0.76295 | 0.038473 | −4.83703 | 2.066088753 × 10⁻⁶ | 1.273823858 × 10⁻⁵ | 4.57858 |
| NAKAMURA_LUNG_CANCER_DIFFERENTIATION_MARKERS | −0.76513 | −0.00215 | −6.52892 | 2.653051026 × 10⁻¹⁰ | 5.185639194 × 10⁻⁸ | 13.07993 |
| KEGG_MEDICUS_REFERENCE_GLYCOGEN_DEGRADATION_AMYLASE | −0.77418 | −0.00419 | −4.94843 | 1.220863401 × 10⁻⁶ | 8.489696264 × 10⁻⁶ | 5.073616 |
| NAKAMURA_ALVEOLAR_EPITHELIUM | −0.77422 | −0.01295 | −5.13427 | 4.970954288 × 10⁻⁷ | 4.522005209 × 10⁻⁶ | 5.920717 |
| BLANCO_MELO_SARS_COV_1_INFECTION_MCR5_CELLS_DN | −0.77506 | −0.03346 | −6.34796 | 7.605661673 × 10⁻¹⁰ | 9.335810772 × 10⁻⁸ | 12.07507 |
| KEGG_MEDICUS_ENV_FACTOR_PHIP_TO_DNA_ADDUCTS | −0.79025 | 0.027857 | −4.70915 | 3.735469016 × 10⁻⁶ | 2.058810541 × 10⁻⁵ | 4.022264 |
| INAMURA_LUNG_CANCER_SCC_DN | −0.89554 | −0.01957 | −7.03098 | 1.279898881 × 10⁻¹¹ | 9.256228705 × 10⁻⁹ | 15.97746 |
↓ Table 3. Results of GSVA for GSE48000
| logFC | AveExpr | t | P value | Adjusted P value | B |
|---|
| GSVA: gene set variation analysis. |
| JONES_TCOF1_TARGETS | 0.68535 | −0.00891 | 8.419092 | 4.002037931 × 10⁻¹⁴ | 1.275010499 × 10⁻¹² | 21.61831 |
| PALOMERO_GSI_SENSITIVITY_DN | 0.679906 | −0.01643 | 8.4676 | 3.039355649 × 10⁻¹⁴ | 1.017621299 × 10⁻¹² | 21.88801 |
| WP_CELLULAR_PROTEOSTASIS | 0.672864 | −0.0243 | 7.490106 | 7.009193031 × 10⁻¹² | 1.224407826 × 10⁻¹⁰ | 16.56116 |
| KEGG_MEDICUS_REFERENCE_ELECTRON_TRANSFER_IN_COMPLEX_III | 0.672106 | 0.012797 | 8.495715 | 2.590760166 × 10⁻¹⁴ | 8.845641371 × 10⁻¹³ | 22.04454 |
| KEGG_MEDICUS_ENV_FACTOR_ARSENIC_TO_ELECTRON_TRANSFER_IN_COMPLEX_IV | 0.650742 | −0.00338 | 8.939515 | 2.042651044 × 10⁻¹⁵ | 9.783081028 × 10⁻¹⁴ | 24.53563 |
| KEGG_MEDICUS_REFERENCE_ELECTRON_TRANSFER_IN_COMPLEX_IV | 0.639247 | −0.00433 | 8.814891 | 4.183298253 × 10⁻¹⁵ | 1.758930986 × 10⁻¹³ | 23.83248 |
| REACTOME_TRANSPORT_AND_SYNTHESIS_OF_PAPS | 0.611806 | 0.003844 | 7.886766 | 7.926471046 × 10⁻¹³ | 1.780255857 × 10⁻¹¹ | 18.69348 |
| KEGG_MEDICUS_VARIANT_MUTATION_CAUSED_ABERRANT_HTT_TO_ELECTRON_TRANSFER_IN_COMPLEX_III | 0.578126 | −0.0059 | 7.870238 | 8.687263705 × 10⁻¹³ | 1.93311665 × 10⁻¹¹ | 18.60377 |
| WP_DUAL_HIJACK_MODEL_OF_VIF_IN_HIV_INFECTION | 0.577045 | −0.04179 | 7.677574 | 2.515284738 × 10⁻¹² | 4.916361952 × 10⁻¹¹ | 17.56344 |
| BIOCARTA_PARKIN_PATHWAY | 0.573573 | −0.01302 | 8.156217 | 1.762596724 × 10⁻¹³ | 4.756380413 × 10⁻¹² | 20.16565 |
| BIOCARTA_TERT_PATHWAY | −0.655 | −0.00327 | −12.3702 | 3.189052496 × 10⁻²⁴ | 3.843871276 × 10⁻²¹ | 44.44821 |
| REACTOME_NEF_AND_SIGNAL_TRANSDUCTION | −0.65533 | 0.012557 | −9.53555 | 6.415944202 × 10⁻¹⁷ | 5.39536145 × 10⁻¹⁵ | 27.93171 |
| REACTOME_NEGATIVE_FEEDBACK_REGULATION_OF_MAPK_PATHWAY | −0.65594 | 0.037132 | −9.14853 | 6.104456894 × 10⁻¹⁶ | 3.476175768 × 10⁻¹⁴ | 25.72064 |
| BIOCARTA_STAT3_PATHWAY | −0.66819 | 0.001079 | −10.7443 | 5.123695773 × 10⁻²⁰ | 1.323377423 × 10⁻¹⁷ | 34.93634 |
| WP_TCA_CYCLE_NUTRIENT_USE_AND_INVASIVENESS_OF_OVARIAN_CANCER | −0.67075 | 0.033244 | −9.16782 | 5.458713298 × 10⁻¹⁶ | 3.235853653 × 10⁻¹⁴ | 25.83035 |
| KEGG_MEDICUS_PATHOGEN_KSHV_MIR1_2_TO_ANTIGEN_PROCESSING_AND_PRESENTATION_BY_MHC_CLASS_I_MOLECULES | −0.67317 | 0.008885 | −7.70174 | 2.202486247 × 10⁻¹² | 4.400105122 × 10⁻¹¹ | 17.69336 |
| KEGG_MEDICUS_PATHOGEN_SHIGELLA_IPAB_C_D_TO_ITGA_B_TALIN_VINCULIN_SIGNALING_PATHWAY | −0.68842 | −0.0191 | −11.7101 | 1.627713840 × 10⁻²² | 9.809688743 × 10⁻²⁰ | 40.58619 |
| KEGG_MEDICUS_PATHOGEN_HTLV_1_P12_TO_JAK_STAT_SIGNALING_PATHWAY | −0.70677 | 0.002033 | −10.8561 | 2.635139635 × 10⁻²⁰ | 7.255917307 × 10⁻¹⁸ | 35.5895 |
| REACTOME_MATURATION_OF_SARS_COV_1_SPIKE_PROTEIN | −0.71873 | −0.01869 | −9.42971 | 1.19034545 × 10⁻¹⁶ | 9.158062016 × 10⁻¹⁵ | 27.32503 |
| BIOCARTA_ION_PATHWAY | −0.79573 | −0.00069 | −11.9636 | 3.592743199 × 10⁻²³ | 2.886968758 × 10⁻²⁰ | 42.07005 |