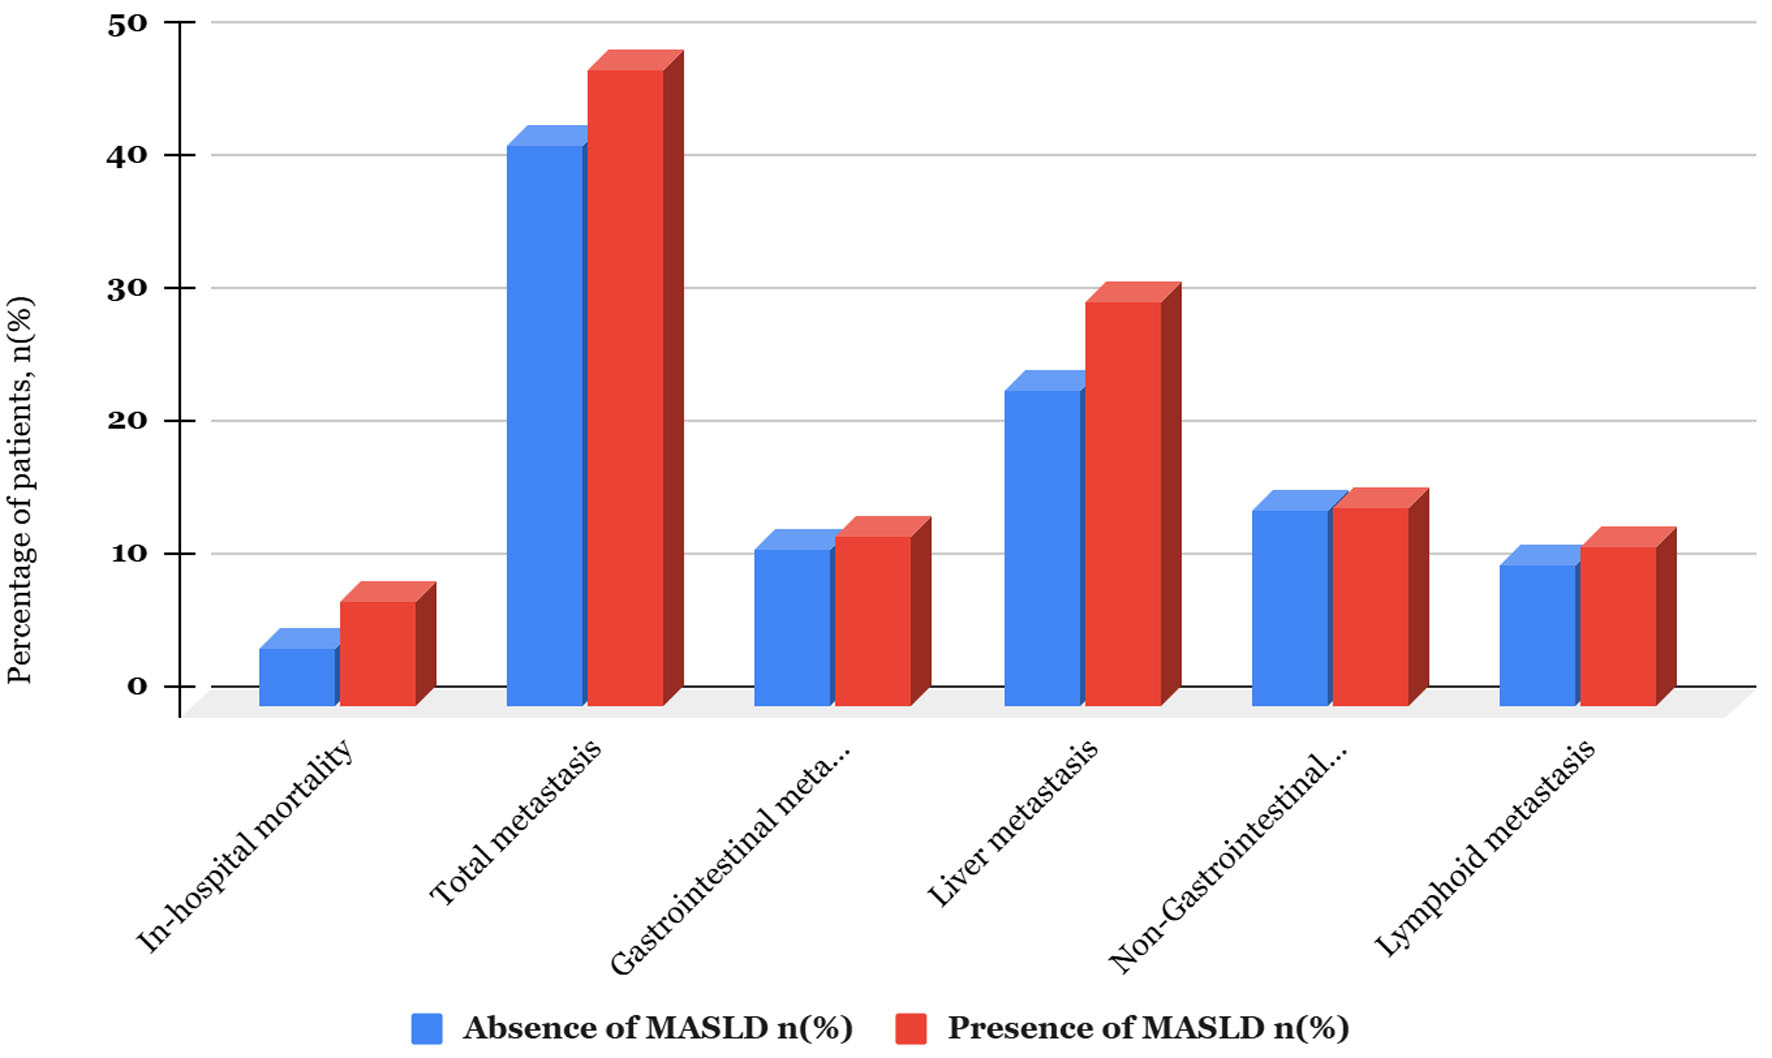
↓ Figure 1. Bar chart comparing outcomes, stratified by the presence of MASLD among colorectal cancer-related hospitalizations. MASLD: metabolic dysfunction-associated steatotic liver disease.
| World Journal of Oncology, ISSN 1920-4531 print, 1920-454X online, Open Access |
| Article copyright, the authors; Journal compilation copyright, World J Oncol and Elmer Press Inc |
| Journal website https://wjon.elmerpub.com |
Original Article
Volume 17, Number 5, October 2026, pages 717-724
Exploring the Association Between Colorectal Cancer Metastasis and Metabolic Dysfunction-Associated Steatotic Liver Disease: A Nationwide Analysis
Figure
Tables
| Demographics | Absence of MASLD, n (%) | Presence of MASLD, n (%) | P-value |
|---|---|---|---|
| n (%): number of hospitalizations in each group (percentage of hospitalizations). MASLD: metabolic dysfunction-associated steatotic liver disease. | |||
| Age | < 0.001 | ||
| < 45 years | 45,180 (5.8) | 1,850 (5.2) | |
| 45–64 years | 265,930 (34.2) | 13,775 (38.7) | |
| > 65 years | 467,565 (60.1) | 19,970 (56.1) | |
| Sex | 0.371 | ||
| Males | 394,740 (50.7) | 18,240 (51.2) | |
| Females | 383,935 (49.3) | 17,355 (48.8) | |
| Race | < 0.001 | ||
| White | 548,785 (70.5) | 24,970 (70.2) | |
| African Americans | 109,525 (14.1) | 4,185 (11.8) | |
| Hispanic | 70,200 (9.0) | 3,995 (11.2) | |
| Asian/Pacific Islander | 25,160 (3.2) | 1,225 (3.4) | |
| Native American | 3,470 (0.4) | 200 (0.6) | |
| Other | 21,535 (2.8) | 1,020 (2.9) | |
| Primary expected payer | < 0.001 | ||
| Medicare | 457,335 (58.7) | 19,640 (55.2) | |
| Medicaid | 76,480 (9.8) | 3,735 (10.5) | |
| Private | 208,835 (26.8) | 10,470 (29.4) | |
| Uninsured | 17,545 (2.3) | 865 (2.4) | |
| Median household income | 0.706 | ||
| Lowest quartile | 221,725 (28.5) | 10,140 (28.5) | |
| Second quartile | 205,890 (26.4) | 9,200 (25.9) | |
| Third quartile | 186,320 (23.9) | 8,600 (24.2) | |
| Highest quartile | 164,740 (21.2) | 7,655 (21.5) | |
| Comorbidities | Absence of MASLD, n (%) | Presence of MASLD, n (%) | P-value |
|---|---|---|---|
| n (%): number of hospitalizations in each group (percentage of hospitalizations). MASLD: metabolic dysfunction-associated steatotic liver disease. | |||
| Diabetes | 203,515 (26.1) | 11,340 (31.9) | < 0.001 |
| Hypertension | 471,660 (60.6) | 21,430 (60.2) | 0.539 |
| Chronic pulmonary disease | 133,765 (17.2) | 6,005 (16.9) | 0.504 |
| Coronary artery disease | 134,245 (17.2) | 5,840 (16.4) | 0.077 |
| Chronic kidney disease | 112,920 (14.5) | 5,440 (15.3) | 0.071 |
| Congestive heart failure | 105,705 (13.6) | 4,640 (13.0) | 0.19 |
| Coagulopathy | 8,260 (1.1) | 1,245 (3.5) | < 0.001 |
| Smoking | 274,200 (35.2) | 12,445 (34.9) | 0.673 |
| Obesity | 101,390 (13.0) | 6,300 (17.7) | < 0.001 |
| Gastroesophageal reflux disease | 161,355 (20.7) | 7,985 (22.4) | < 0.001 |
| Obstructive sleep apnea | 40,450 (5.2) | 2,365 (6.6) | < 0.001 |
| Hyperlipidemia | 236,290 (30.4) | 10,475 (29.4) | 0.112 |
| Outcomes | Absence of MASLD, n (%) | Presence of MASLD, n (%) | P-value |
|---|---|---|---|
| n (%): number of hospitalizations in each group (percentage of hospitalizations). MASLD: metabolic dysfunction-associated steatotic liver disease. | |||
| In-hospital mortality | 33,483 (4.3) | 2,812 (7.9) | < 0.001 |
| Total metastasis | 328,600 (42.2) | 17,050 (47.9) | < 0.001 |
| Gastrointestinal metastasis | 91,535 (11.8) | 4,570 (12.8) | 0.006 |
| Liver metastasis | 185,160 (23.8) | 10,845 (30.5) | < 0.001 |
| Non-gastrointestinal metastasis | 114,210 (14.7) | 5,330 (14.9) | 0.487 |
| Lymphoid metastasis | 82,790 (10.6) | 4,235 (11.9) | < 0.001 |
| Outcomes | aOR | 95% CI | P-value |
|---|---|---|---|
| aOR: adjusted odds ratio; CI: confidence interval; MASLD: metabolic dysfunction-associated steatotic liver disease. | |||
| In-hospital mortality | 1.85 | 1.68-2.03 | < 0.001 |
| Total metastasis | 1.24 | 1.18-1.30 | < 0.001 |
| Gastrointestinal metastasis | 1.08 | 1.00-1.16 | 0.03 |
| Liver metastasis | 1.38 | 1.31-1.46 | < 0.001 |
| Non-gastrointestinal metastasis | 1.01 | 0.93-1.08 | 0.86 |
| Lymphoid metastasis | 1.12 | 1.04-1.21 | 0.003 |
| Variable | No MASLD | MASLD | Absolute risk difference (%) | Interaction aOR | P-value |
|---|---|---|---|---|---|
| Predicted probabilities derived from survey-weighted logistic regression margins. aOR: adjusted odds ratio; CRC: colorectal cancer; MASLD: metabolic dysfunction-associated steatotic liver disease. | |||||
| Sex | |||||
| Male | 25.2 (24.9–25.5) | 33.5 (32.0–35.0) | 8.3 | Ref | |
| Female | 22.3 (22.0–22.7) | 26.5 (25.0–27.9) | 4.2 | 0.83 (0.75–0.93) | 0.001 |
| Age-groups | |||||
| 18–44 | 34.0 (33.2–34.9) | 44.1 (40.8–47.3) | 10.1 | Ref | - |
| 45–64 | 26.8 (26.5–27.2) | 34.3 (32.9–35.7) | 7.5 | 1.01 (0.80–1.28) | 0.920 |
| 65+ | 20.7 (20.4–21.0) | 25.7 (24.4–27.1) | 5 | 0.93 (0.74–1.18) | 0.565 |
| Race | |||||
| White | 22.3 (22.1–22.6) | 28.8 (27.5–30.1) | 6.5 | Ref | - |
| African American | 30.3 (29.6–30.9) | 38.2 (34.9–41.4) | 7.9 | 1.01 (0.87–1.19) | 0.878 |
| Hispanic | 24.6 (23.8–25.4) | 30.9 (27.8–33.9) | 6.3 | 0.97 (0.83–1.15) | 0.752 |
| Asian | 22.5 (21.3–23.6) | 29.4 (23.7–35.1) | 6.9 | 1.02 (0.76–1.38) | 0.875 |
| Native American | 22.1 (18.8–25.3) | 11.5 (2.3–20.7) | −10.6 | 0.32 (0.12–0.82) | 0.018 |
| Other | 25.6 (24.0–27.2) | 30.3 (24.3–36.2) | 4.7 | 0.9 (0.66–1.21) | 0.475 |