Figures
↓ Figure 1. Relationship of miR-21 and miR-17 with PTENP1 and the binding site.

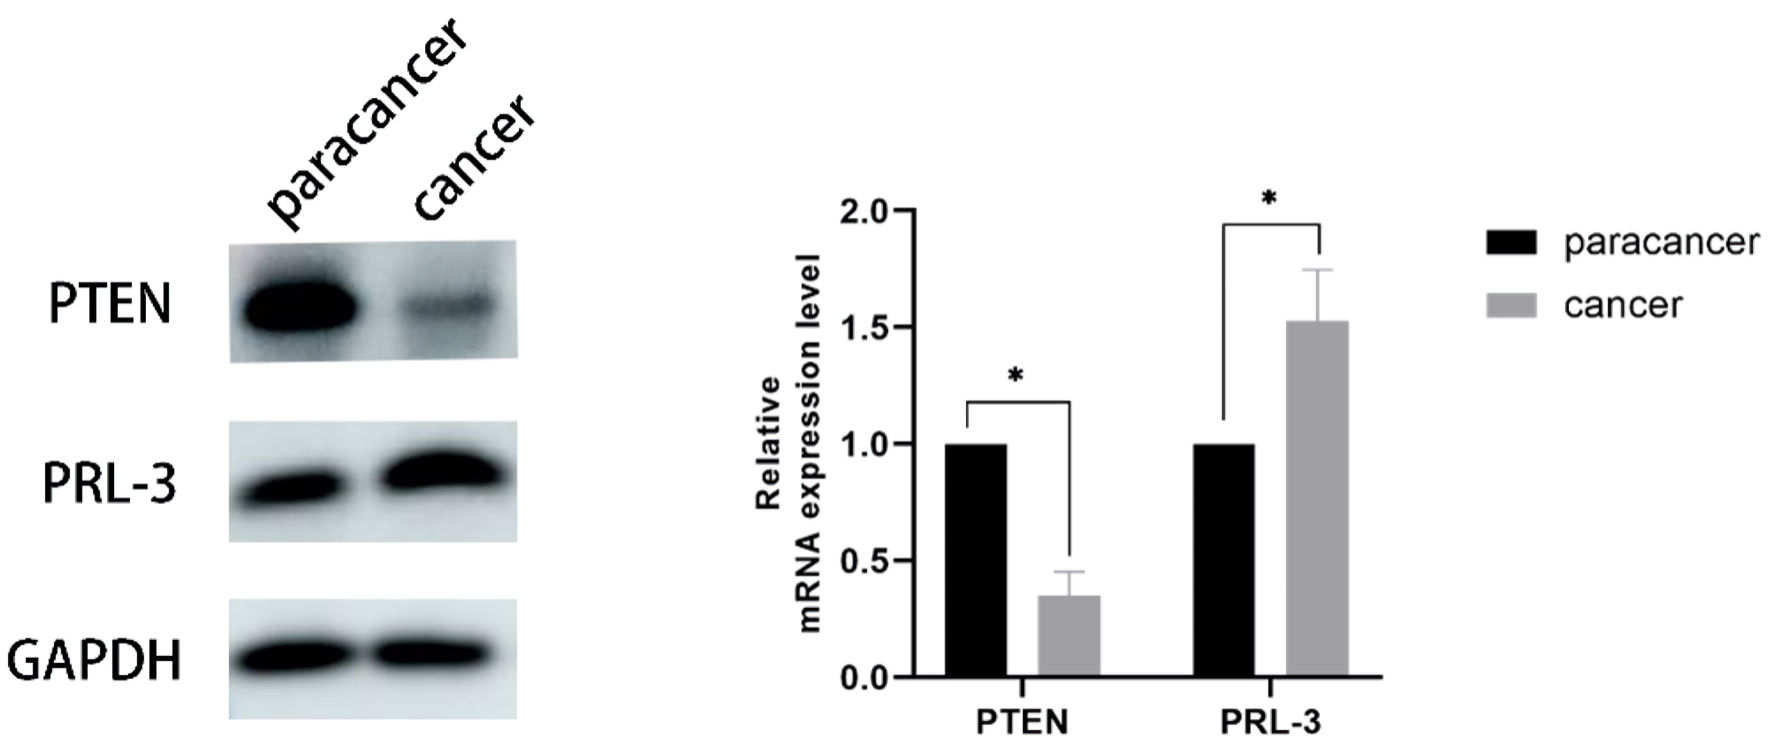
↓ Figure 2. The protein expression of PTEN was decreased (P = 0.010) and the expression of PRL-3 was elevated (P = 0.030) in endometrial adenocarcinoma tissues. PTEN: phosphatase and tensin homolog deleted on chromosome 10; PRL-3: phosphatase of regenerating liver-3; GAPDH: glyceraldehyde-3-phosphate dehydrogenase.
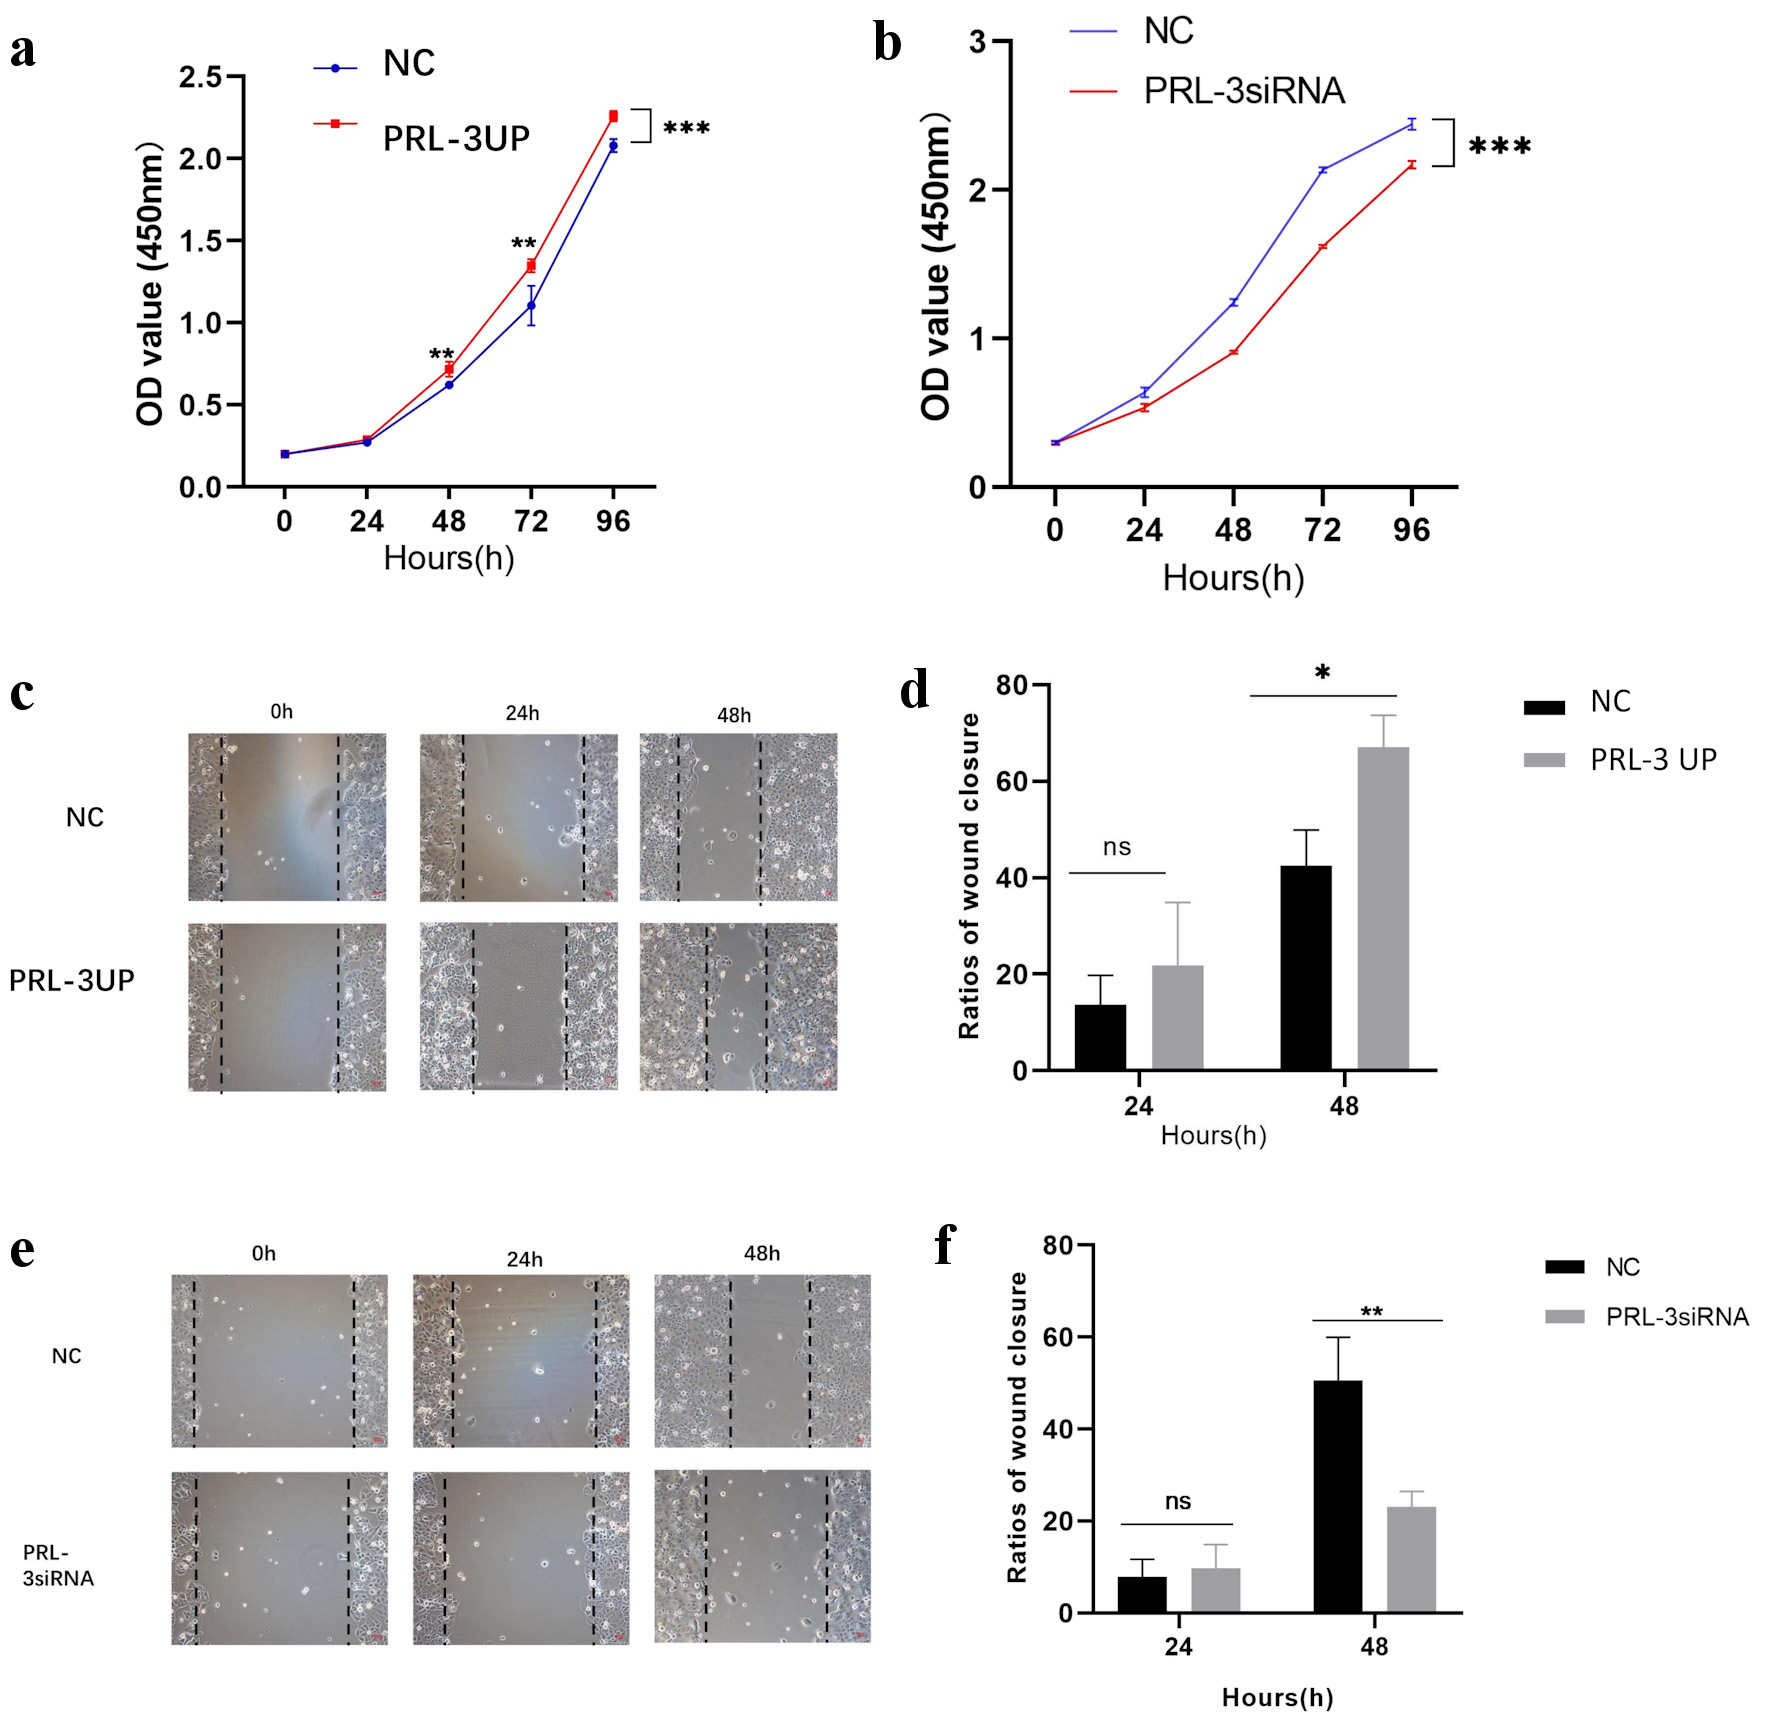
↓ Figure 3. Effect of PRL-3 on the proliferation and migration of HEC-1A cells. (a) The OD value of HEC-1A cells in the PRL-3 overexpression group after 96 h of culture (P < 0.001). (b) The OD value of cells in the PRL-3 low-expression group after 96 h of culture (P < 0.001). (c, d) The migration rate of the scratched cells at 24 h in the PRL-3 overexpression group (P = 0.012). (e, f) The migration rate of scratched cells at 24 h in the PRL-3 low-expression group (P = 0.008). PRL-3: phosphatase of regenerating liver-3; NC: negative controls; OD: optical density; PRL-3 UP: PRL-3 upregulation.
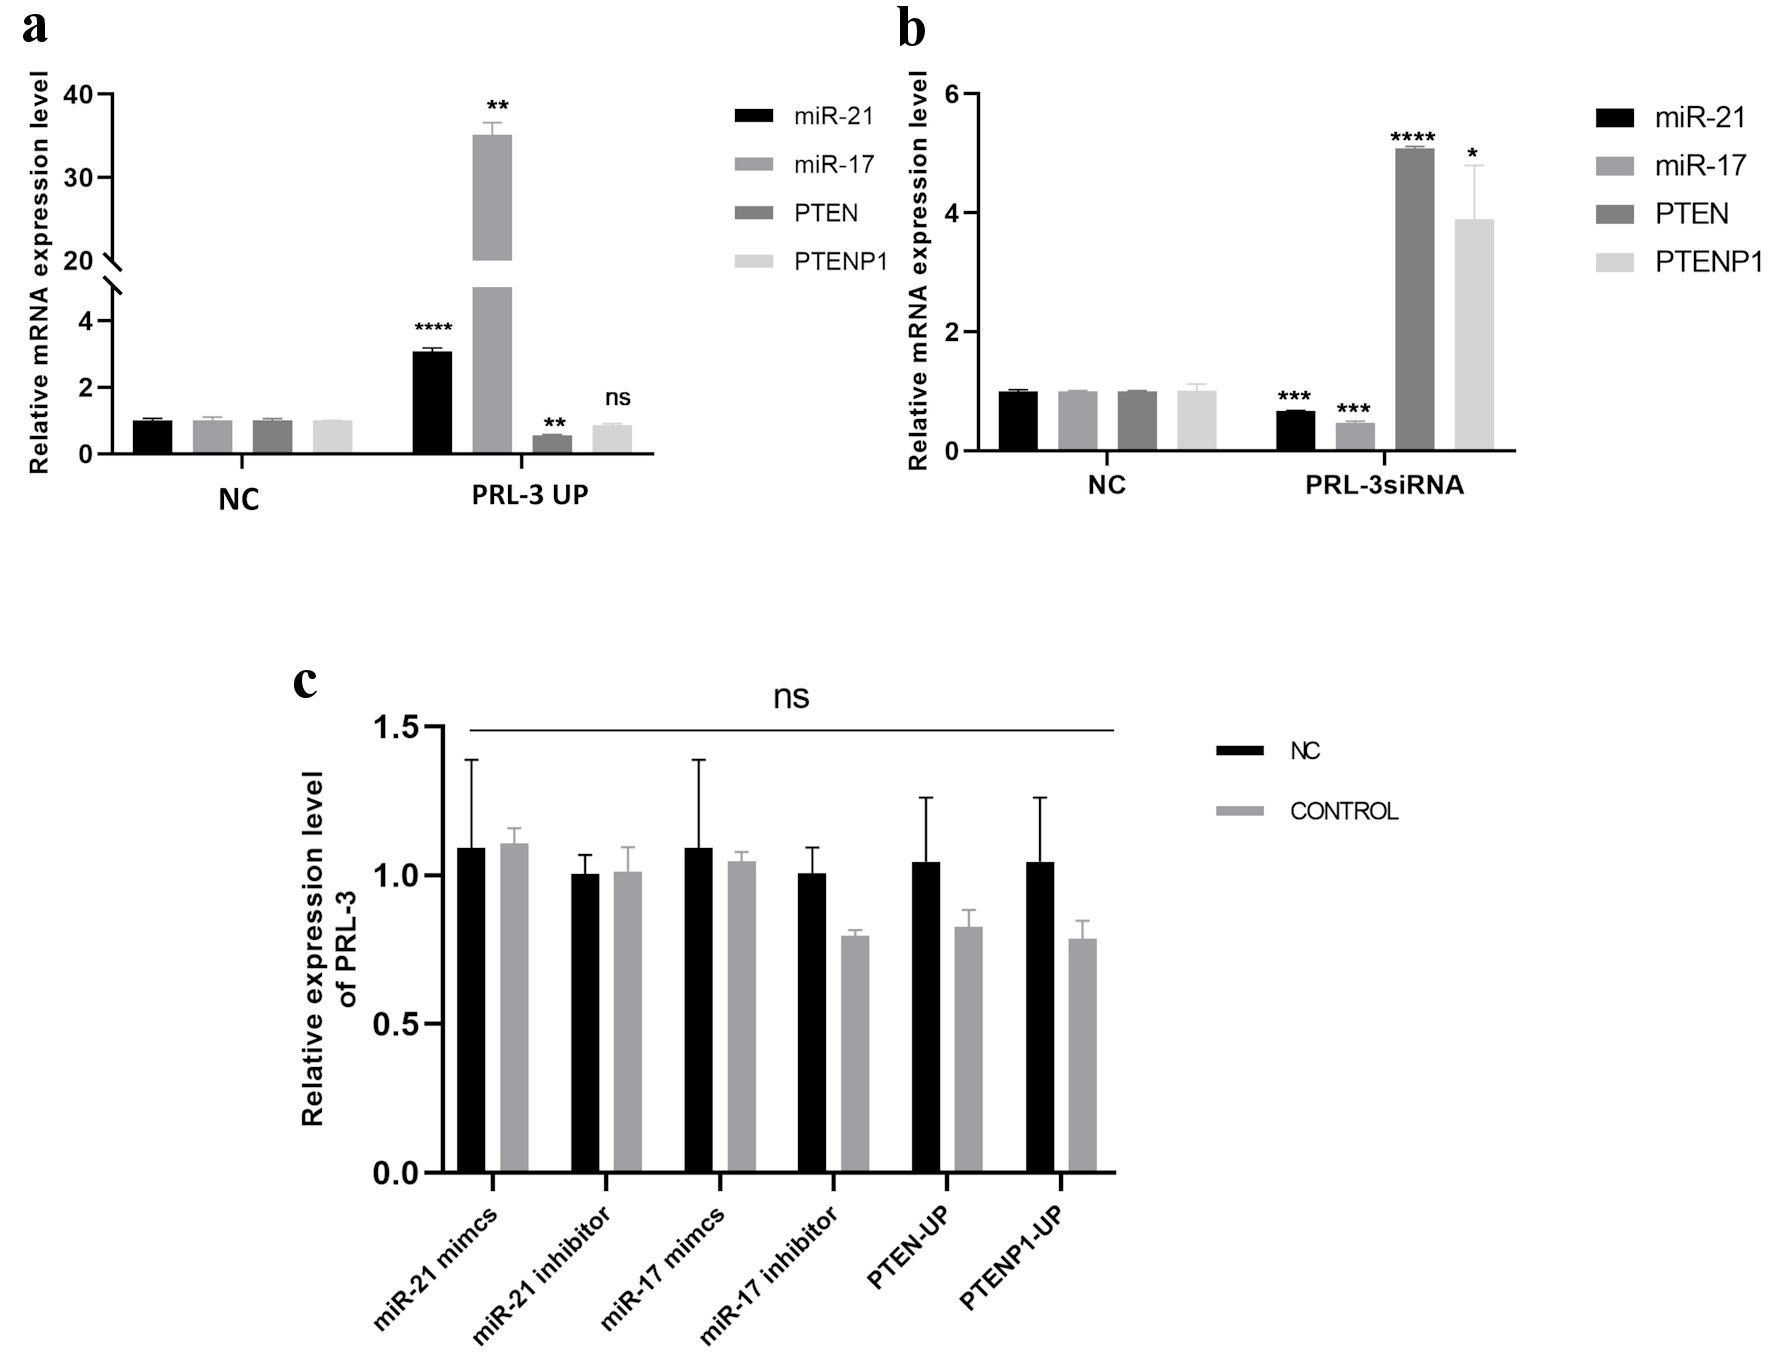
↓ Figure 4. Effect of PRL-3 on the expression of miR-21 and miR-17. (a) miR-21/17 mRNA (P < 0.001, P = 0.001) and PTEN (P = 0.002)/PTENP1 mRNA expression in HEC-1A cells of the PRL-3 overexpression group. (b) miR-21/17 mRNA (P < 0.001, P < 0.001) and PTEN/PTENP1 mRNA (P < 0.001, P = 0.034) expression in HEC-1A cells of the PRL-3 low-expression group. (c) The changes of PRL-3 mRNA expression in response to both upregulation and downregulation of miR-21/17 and PTEN/PTENP1 (P > 0.05). PRL-3: phosphatase of regenerating liver-3; NC: negative controls; OD: optical density; PRL-3 UP: PRL-3 upregulation; PTENP1: phosphatase and tensin homolog pseudogene 1; PTEN: phosphatase and tensin homolog deleted on chromosome 10; PTENP1-UP: PTENP1 upregulation.
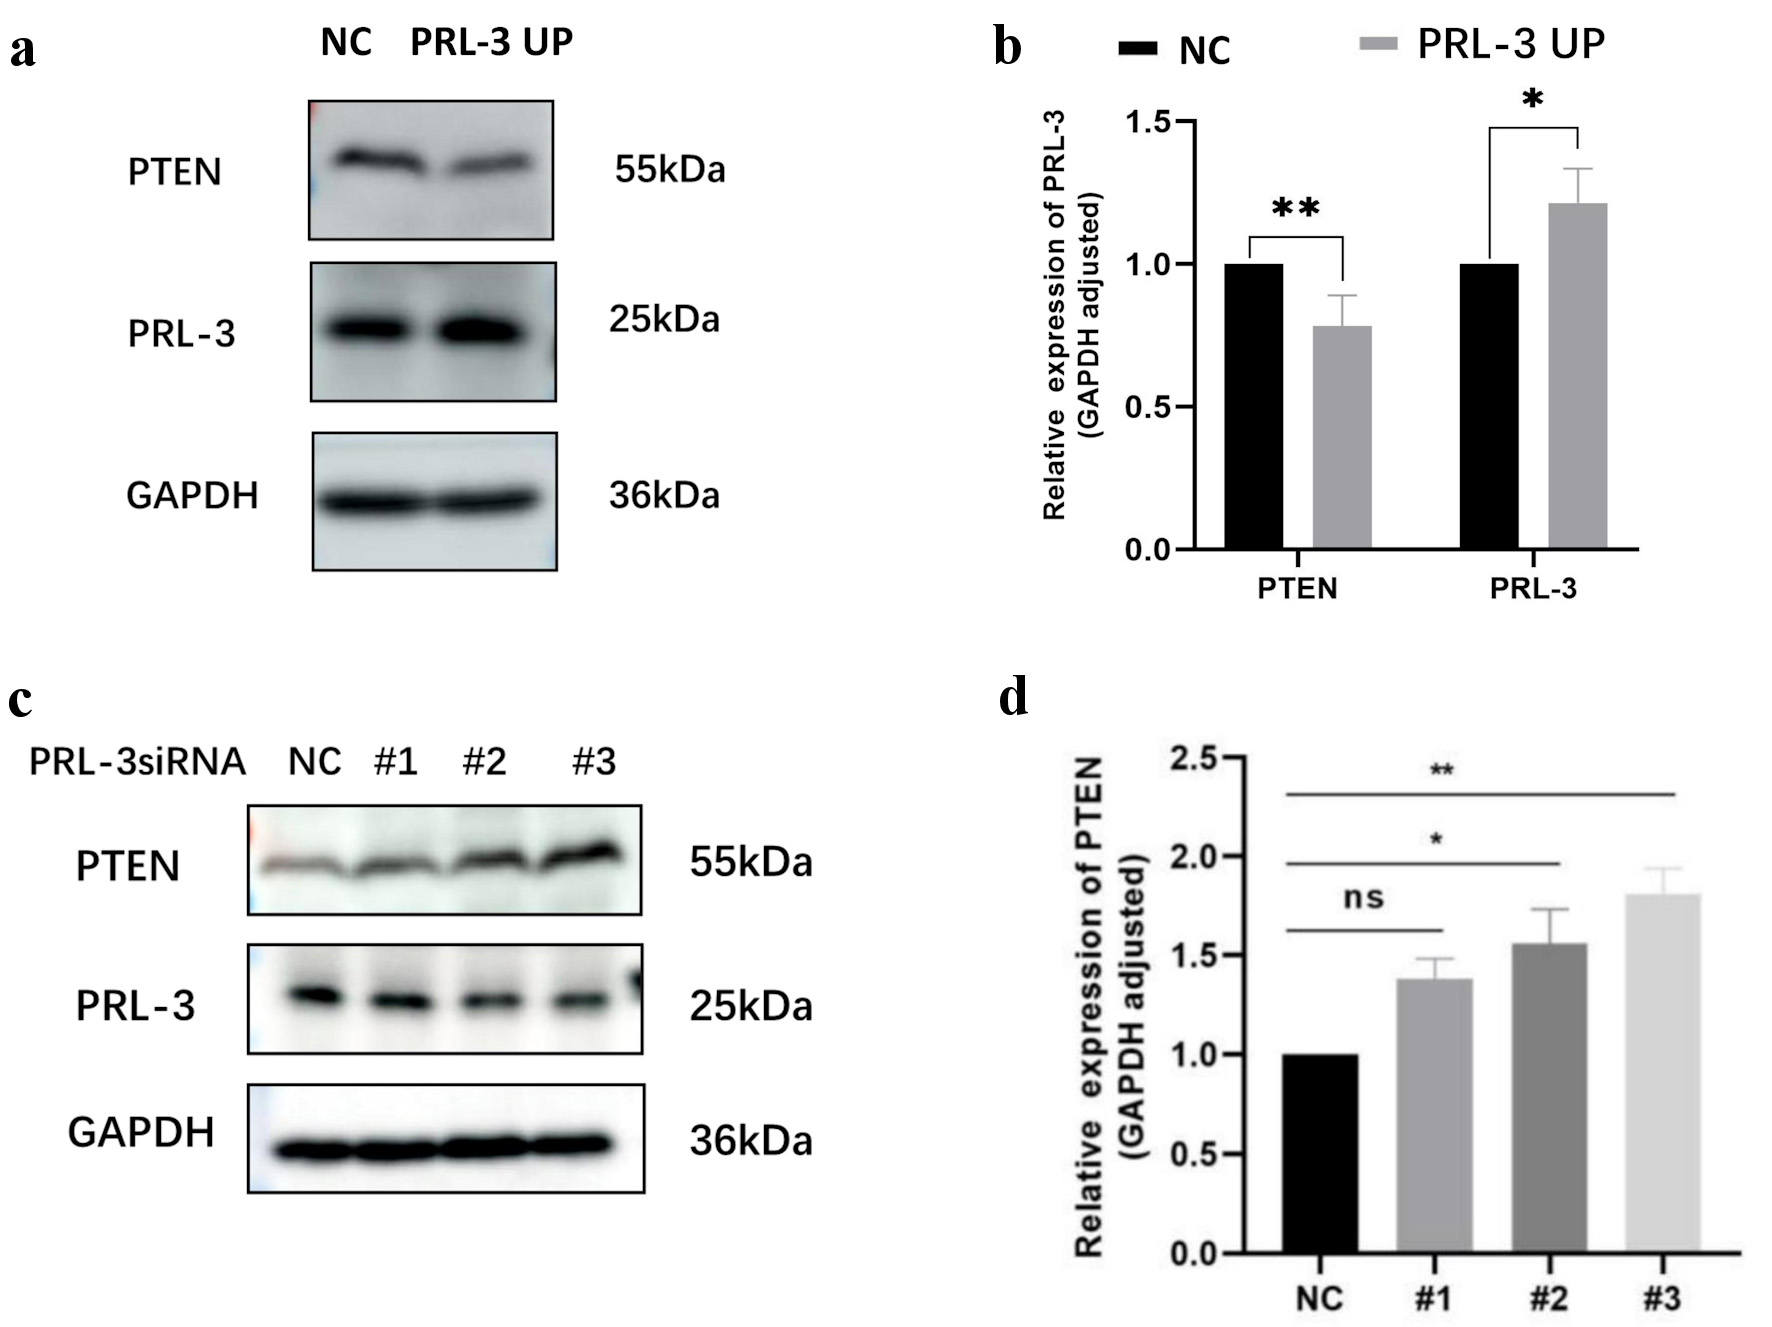
↓ Figure 5. Effect of PRL-3 on the expression of PTEN and PTENP1. (a, b) The PTEN protein expression in HEC-1A cells of PRL-3 overexpression group (P = 0.009). (c, d) The PTEN protein in PRL-3siRNA-2 (P = 0.024) and PRL-3siRNA-3 (P = 0.003) HEC-1A cells of the PRL-3 low-expression group. PTEN: phosphatase and tensin homolog deleted on chromosome 10; PRL-3: phosphatase of regenerating liver-3; GAPDH: glyceraldehyde-3-phosphate dehydrogenase; ns: not significant; PRL-3 UP: PRL-3 upregulation; PTENP1: phosphatase and tensin homolog pseudogene 1; PTEN: phosphatase and tensin homolog deleted on chromosome 10.
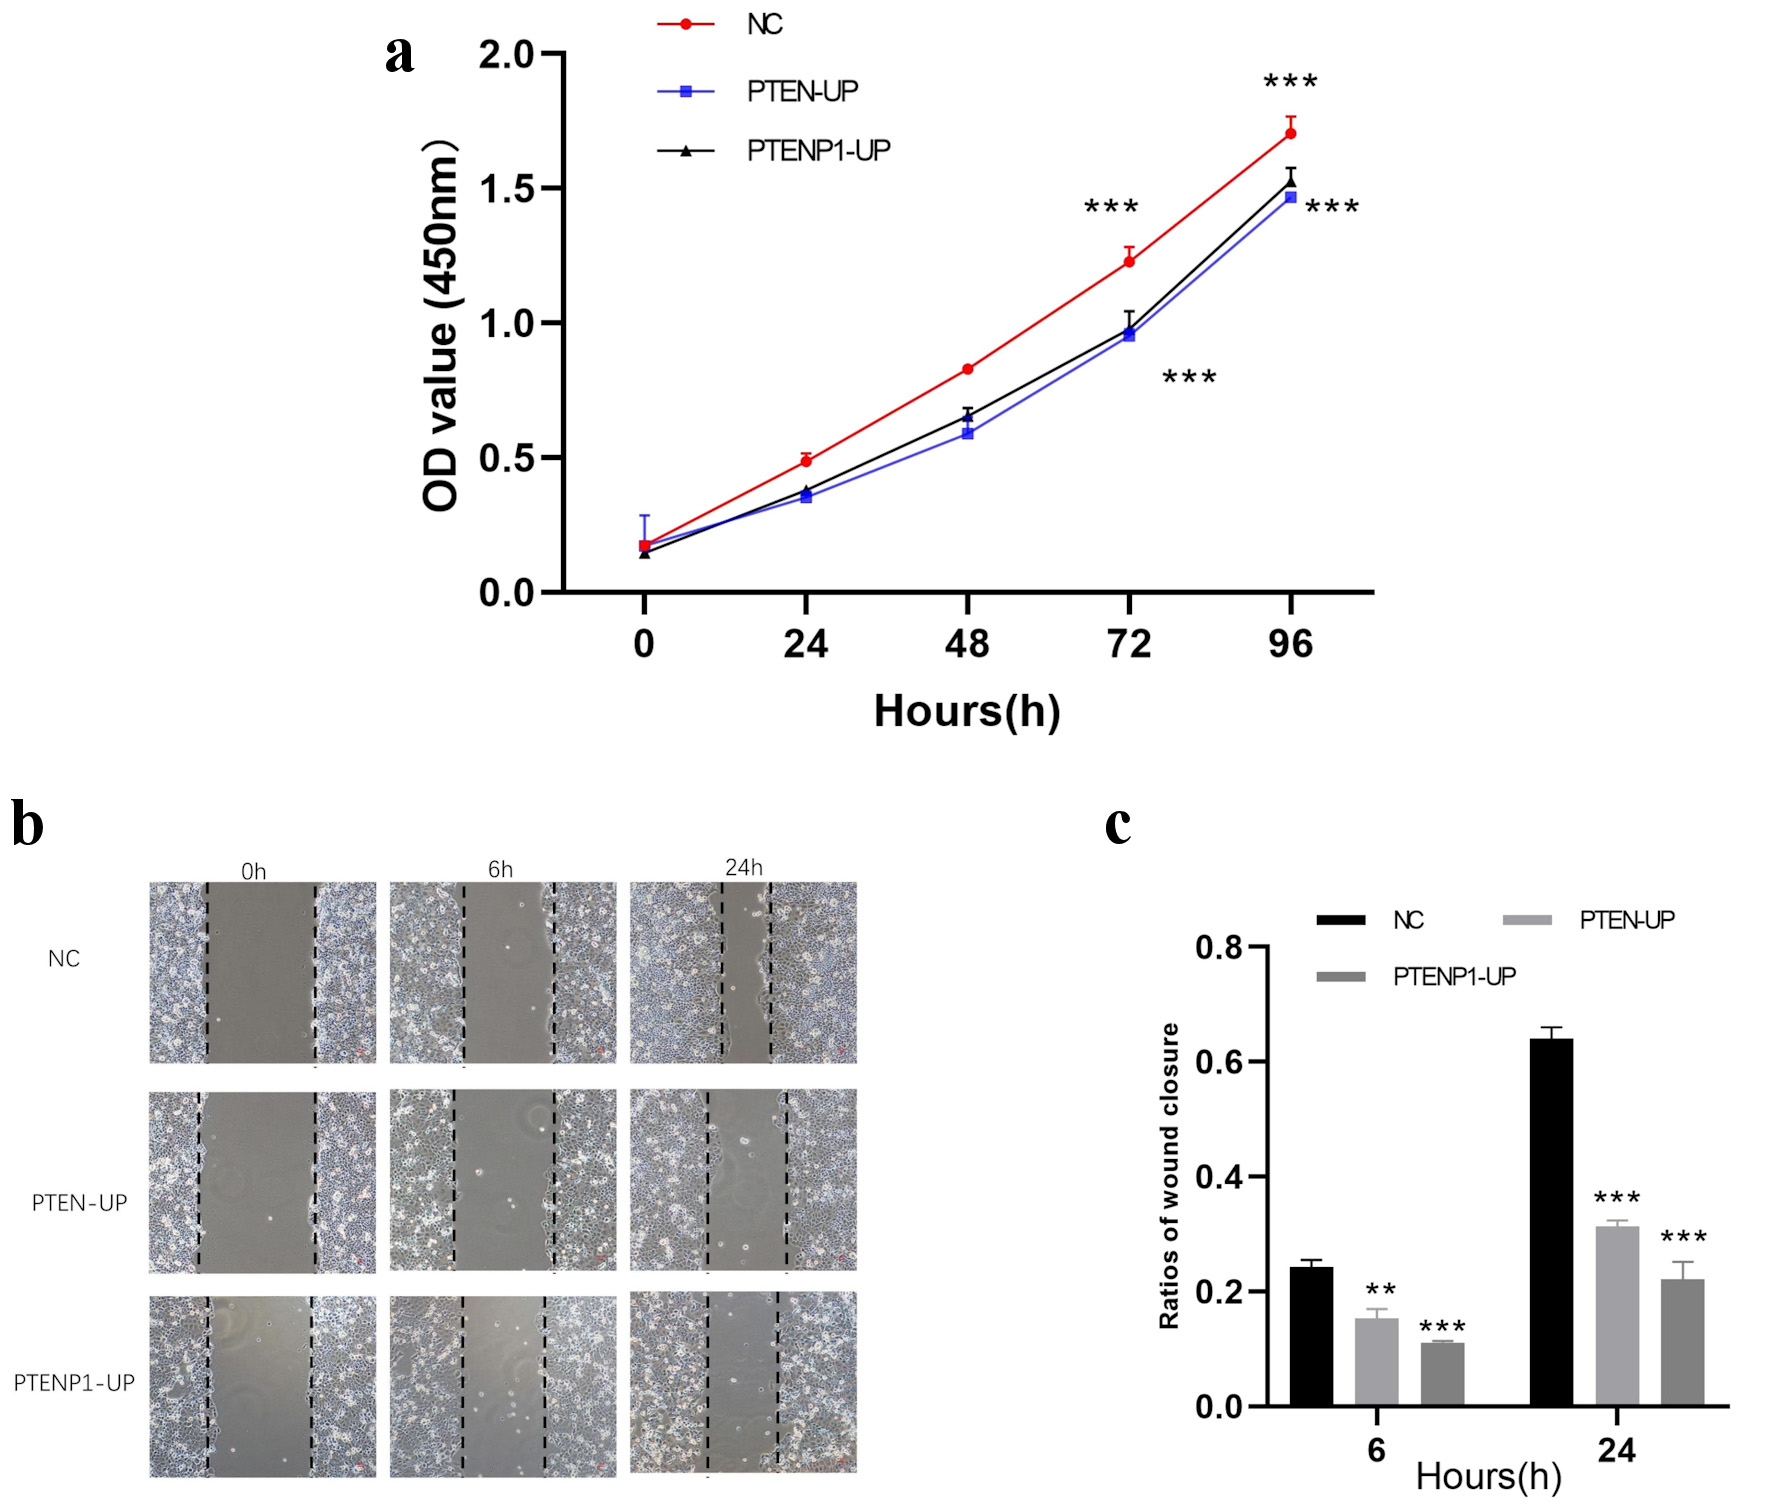
↓ Figure 6. Effect of PTEN and PTENP1 on the proliferation and migration of HEC-1A cells. (a) The OD value of HEC-1A cells in PTEN and PTENP1 overexpression group after 96 h of culture (P < 0.001). (b, c) The migration rate of HEC-1A cells in PTEN and PTENP1 overexpression group at 24 h in the scratch assay (P < 0.001). PTENP1: phosphatase and tensin homolog pseudogene 1; PTEN: phosphatase and tensin homolog deleted on chromosome 10; OD: optical density; PTENP1-UP: PTENP1 upregulation.
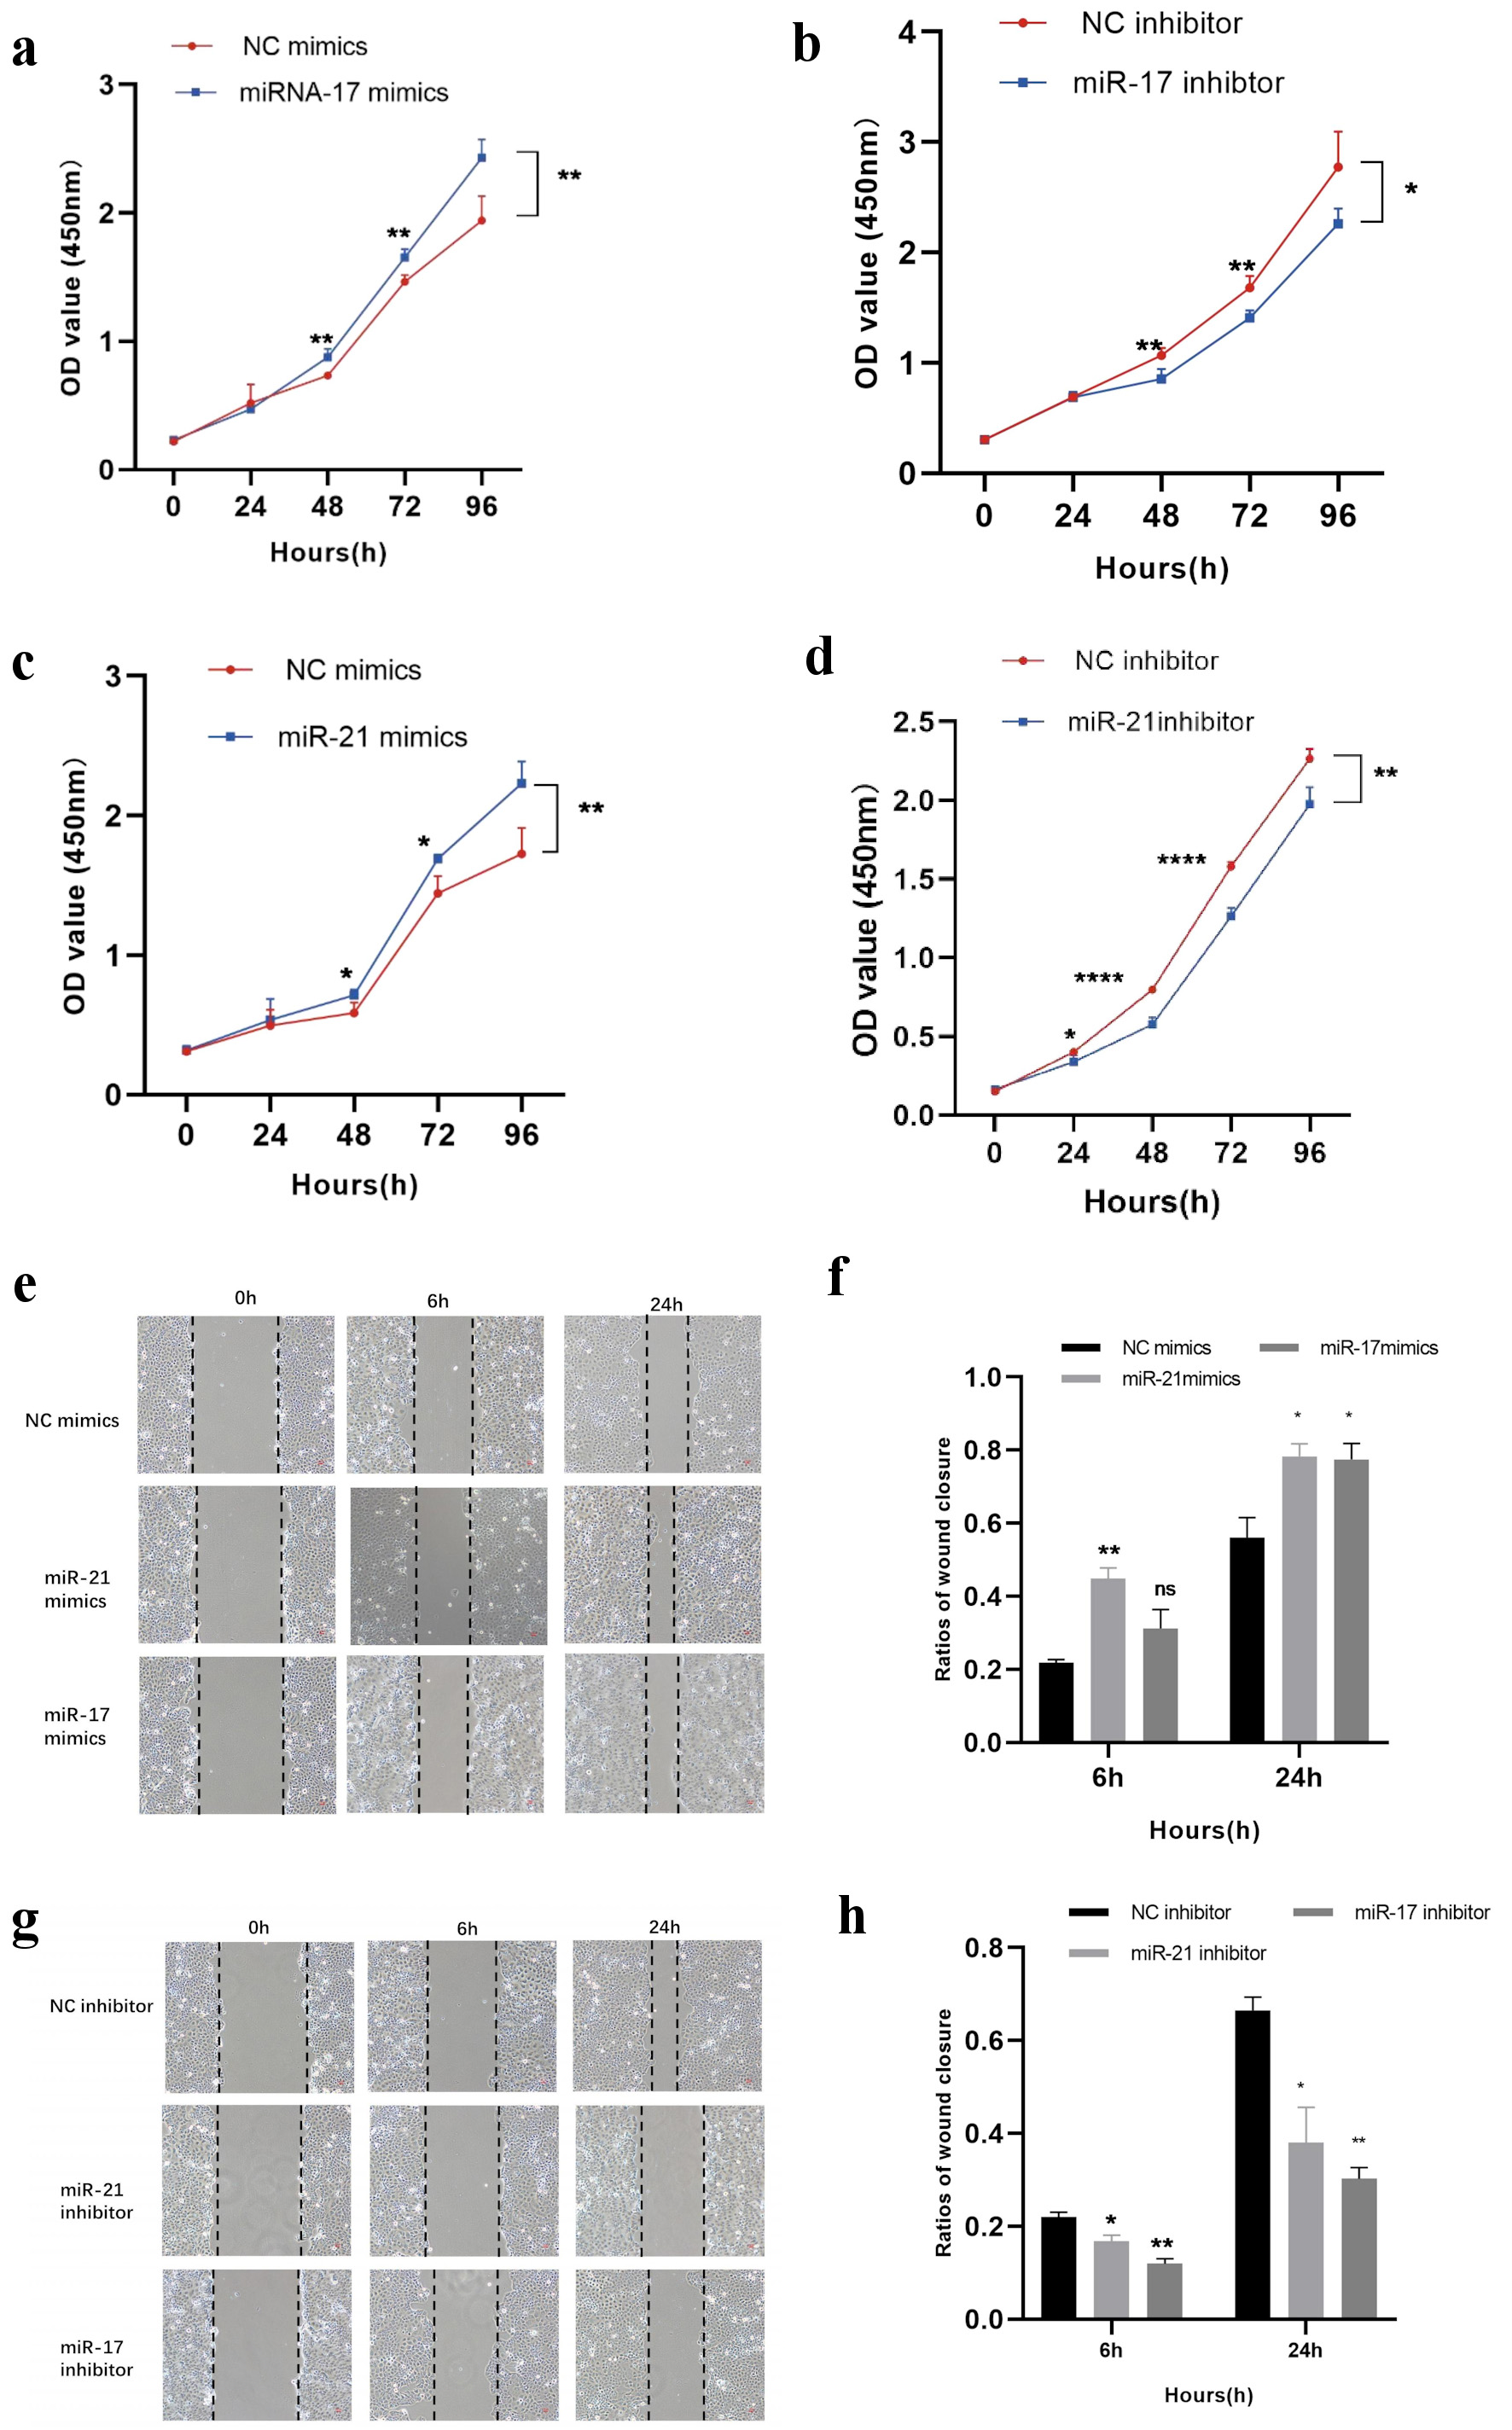
↓ Figure 7. Effect of miR-21 and miR-17 on the proliferation and migration of HEC-1A cells. (a) The OD value of HEC-1A cells in miR-17 mimics group after 96 h of culture (P = 0.006). (b) The OD value of HEC-1A cells in the miR-17 inhibitor group after 96 h of culture (P = 0.025). (c) The OD value of HEC-1A cells in miR-21 mimics group after 96 h of culture (P = 0.006). (d) The OD value of HEC-1A cells in the miR-21 inhibitor group after 96 h of culture (P = 0.003). (e, f) The HEC-1A cells migration rate in miR-17 mimics group and miR-21 mimics group at 24 h (P = 0.026, P = 0.022). (g, h) The HEC-1A cells migration rate in the miR-17 inhibitor group and miR-21 inhibitor group at 24 h in the wound healing assay (P = 0.003, P = 0.011). OD: optical density; NC: negative controls.
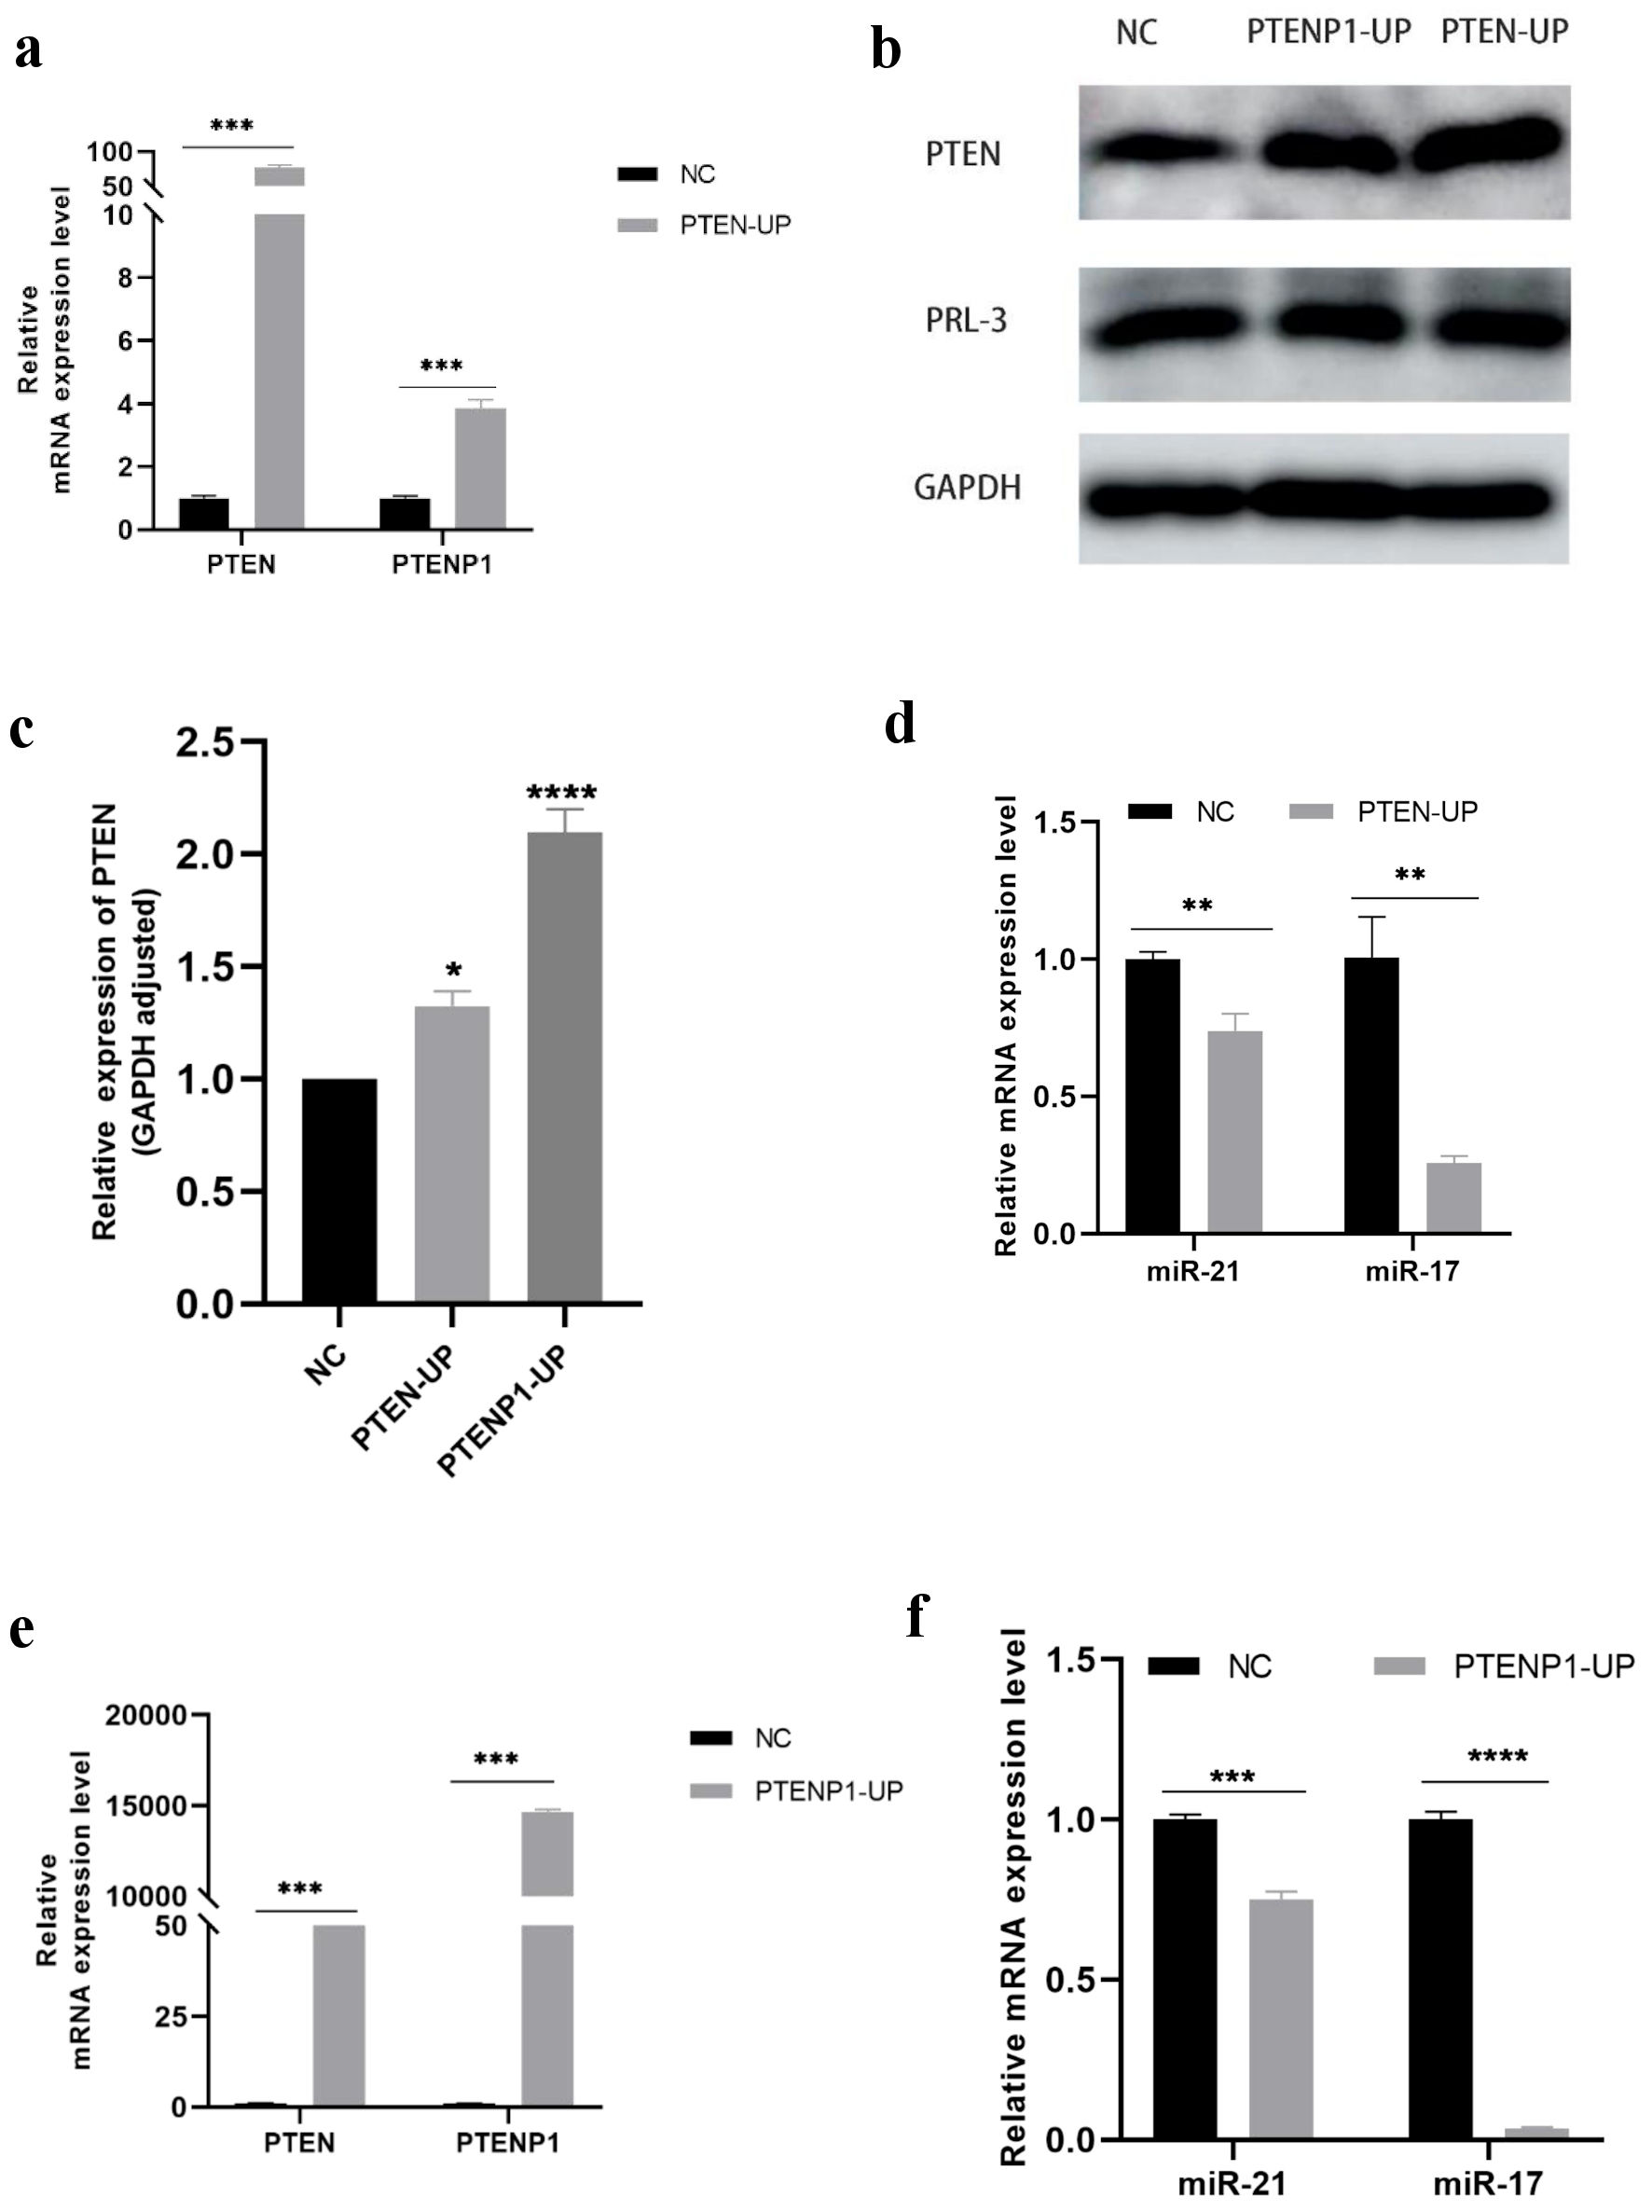
↓ Figure 8. The regulatory interactions among PTEN, PTENP1, miR-21 and miR-17. (a) PTEN-overexpressing HEC-1A cells exhibited a significant increase in PTENP1 mRNA expression (P < 0.001). (b, c) PTEN protein expression was significantly higher in PTENP1-overexpressing HEC-1A cells (P < 0.001). (d) PTEN-overexpressing HEC-1A cells exhibited a significant decrease in miR-17 (P = 0.001) and miR-21 (P = 0.002) mRNA expression. (e) PTEN mRNA expression was significantly higher in PTENP1-overexpressing HEC-1A cells (P < 0.001). (f) The expression of miR-17 (P < 0.001) and miR-21 (P < 0.001) was markedly reduced in PTENP1-overexpressing HEC-1A cells. PTENP1: phosphatase and tensin homolog pseudogene 1; PTEN: phosphatase and tensin homolog deleted on chromosome 10; NC: negative controls; PTENP1-UP: PTENP1 upregulation.
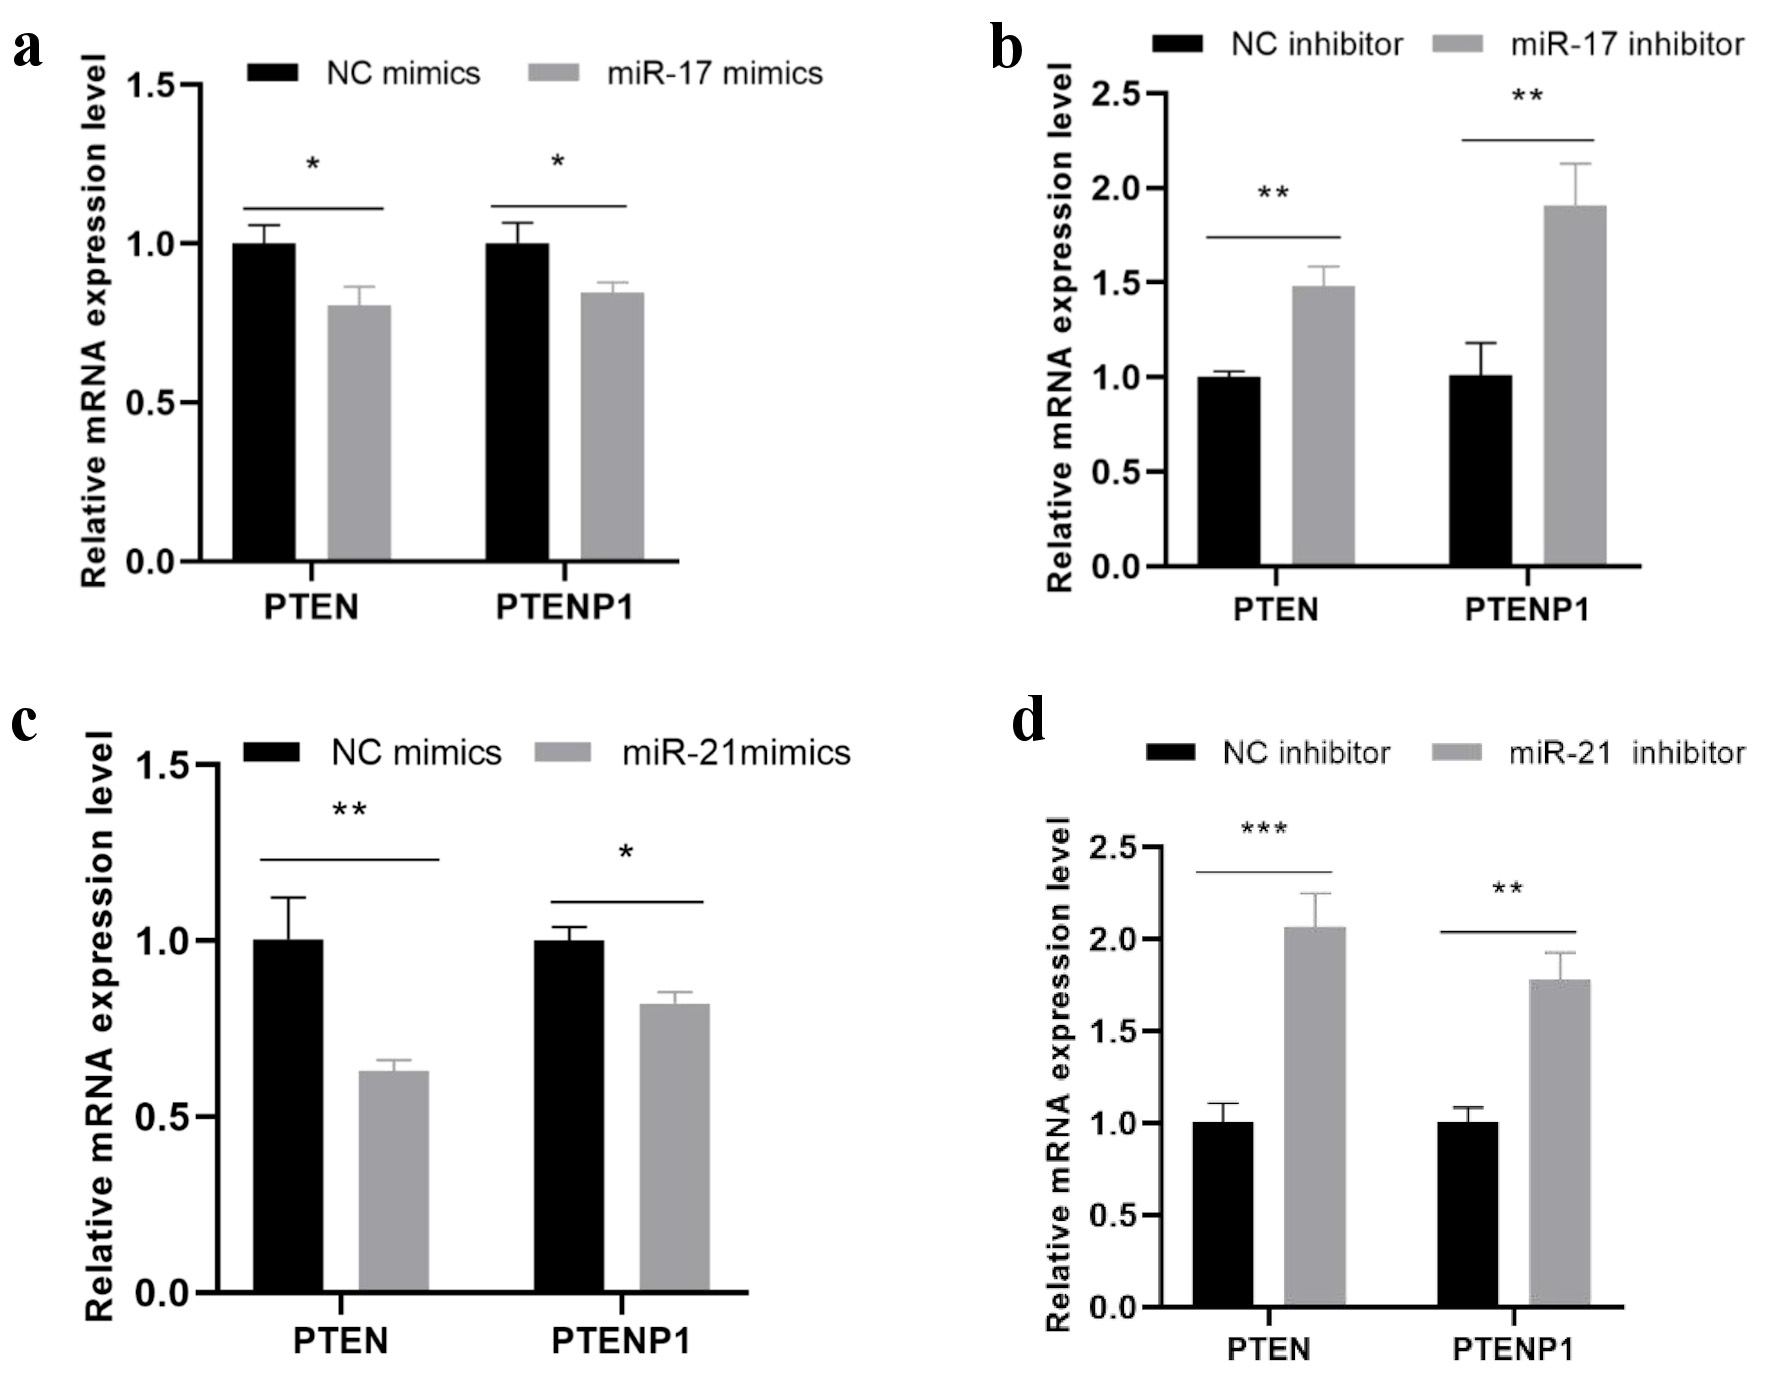
↓ Figure 9. Effect of miR-17 and miR-21 on the expression of PTEN and PTENP1. (a) The miR-17 mimics group showed decreased expression of both PTEN mRNA (P = 0.014) and PTENP1 mRNA (P = 0.02) in HEC-1A cells. (b) The miR-17 inhibitor group exhibited increased expression of PTEN mRNA (P = 0.001) and PTENP1 mRNA (P = 0.005). (c) Transfection with miR-21 mimics led to reduced expression of PTEN mRNA (P = 0.005) and PTENP1 mRNA (P = 0.019). (d) The miR-21 inhibitor group demonstrated elevated expression of PTEN mRNA (P < 0.001) and PTENP1 mRNA (P = 0.001). PTENP1: phosphatase and tensin homolog pseudogene 1; PTEN: phosphatase and tensin homolog deleted on chromosome 10; NC: negative controls.
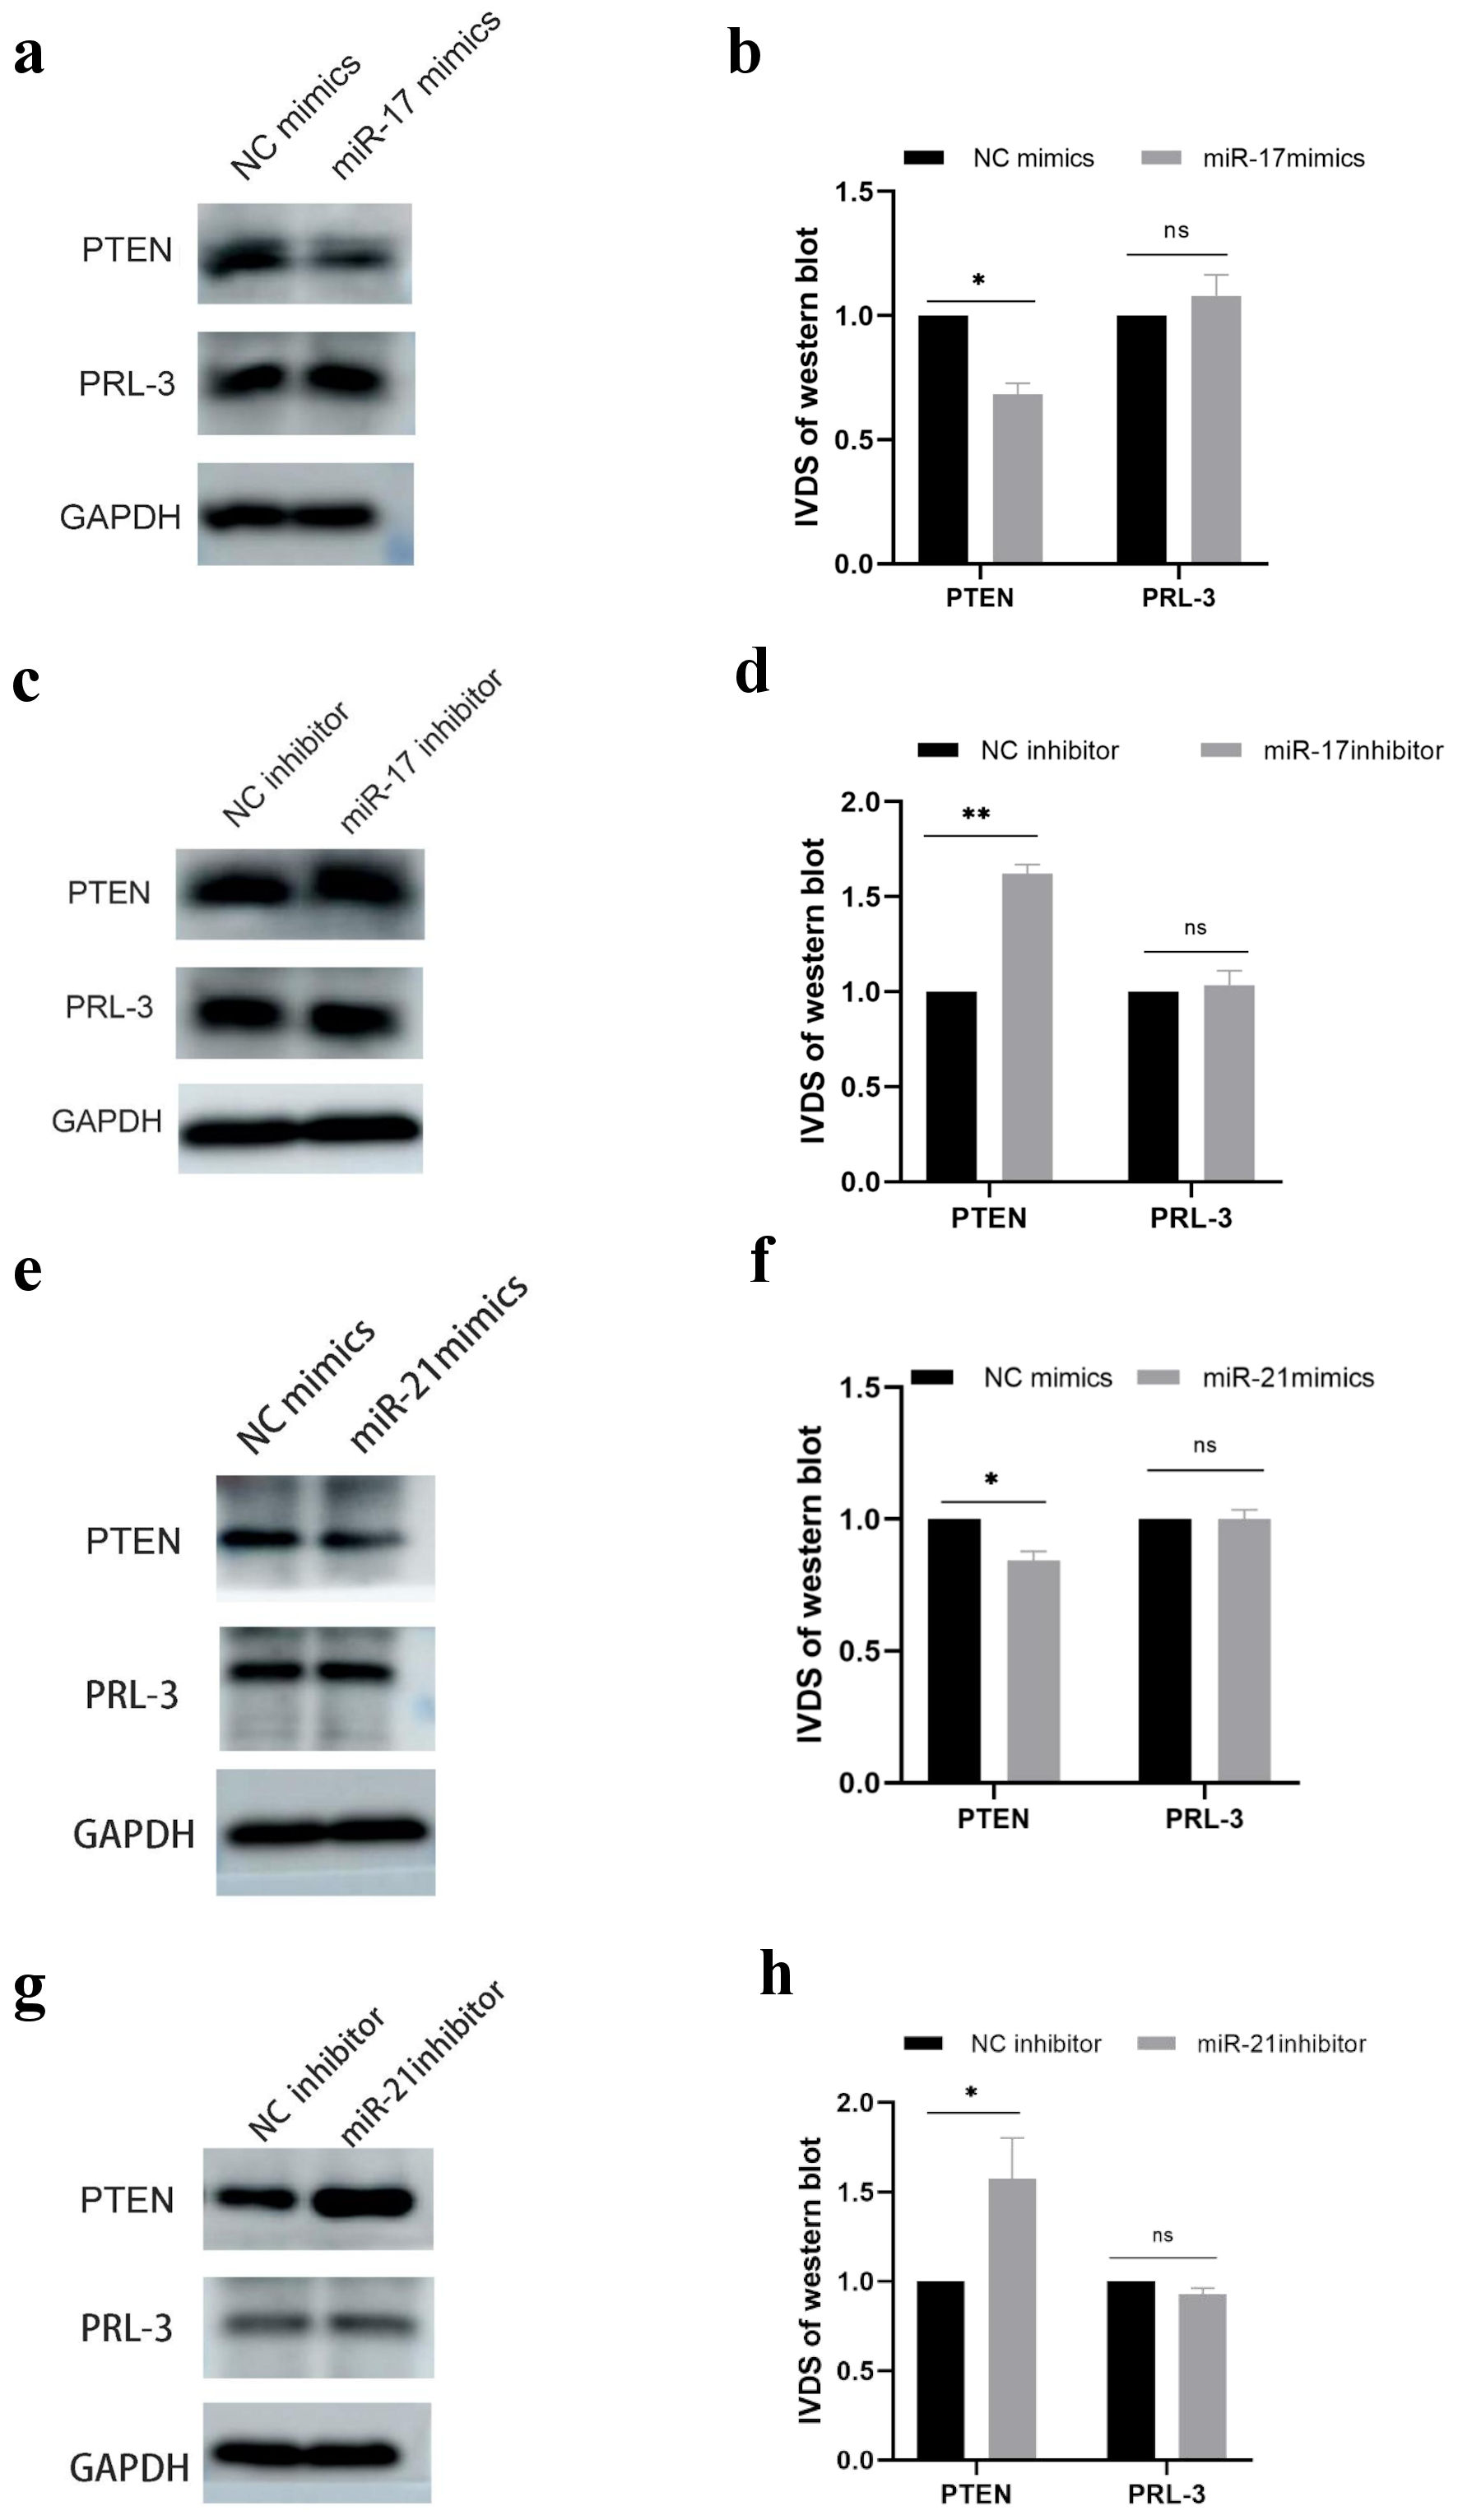
↓ Figure 10. (a, b, e, f) The miR-17 mimics (P = 0.018) and miR-21 mimics (P = 0.045) groups exhibited decreased PTEN protein expression in HEC-1A cells. (c, d, g, h) The miR-17 inhibitor (P = 0.029) and miR-21 inhibitor (P = 0.006) groups showed increased PTEN protein expression. PTEN: phosphatase and tensin homolog deleted on chromosome 10; PRL-3: phosphatase of regenerating liver-3; GAPDH: glyceraldehyde-3-phosphate dehydrogenase; NC: negative controls.
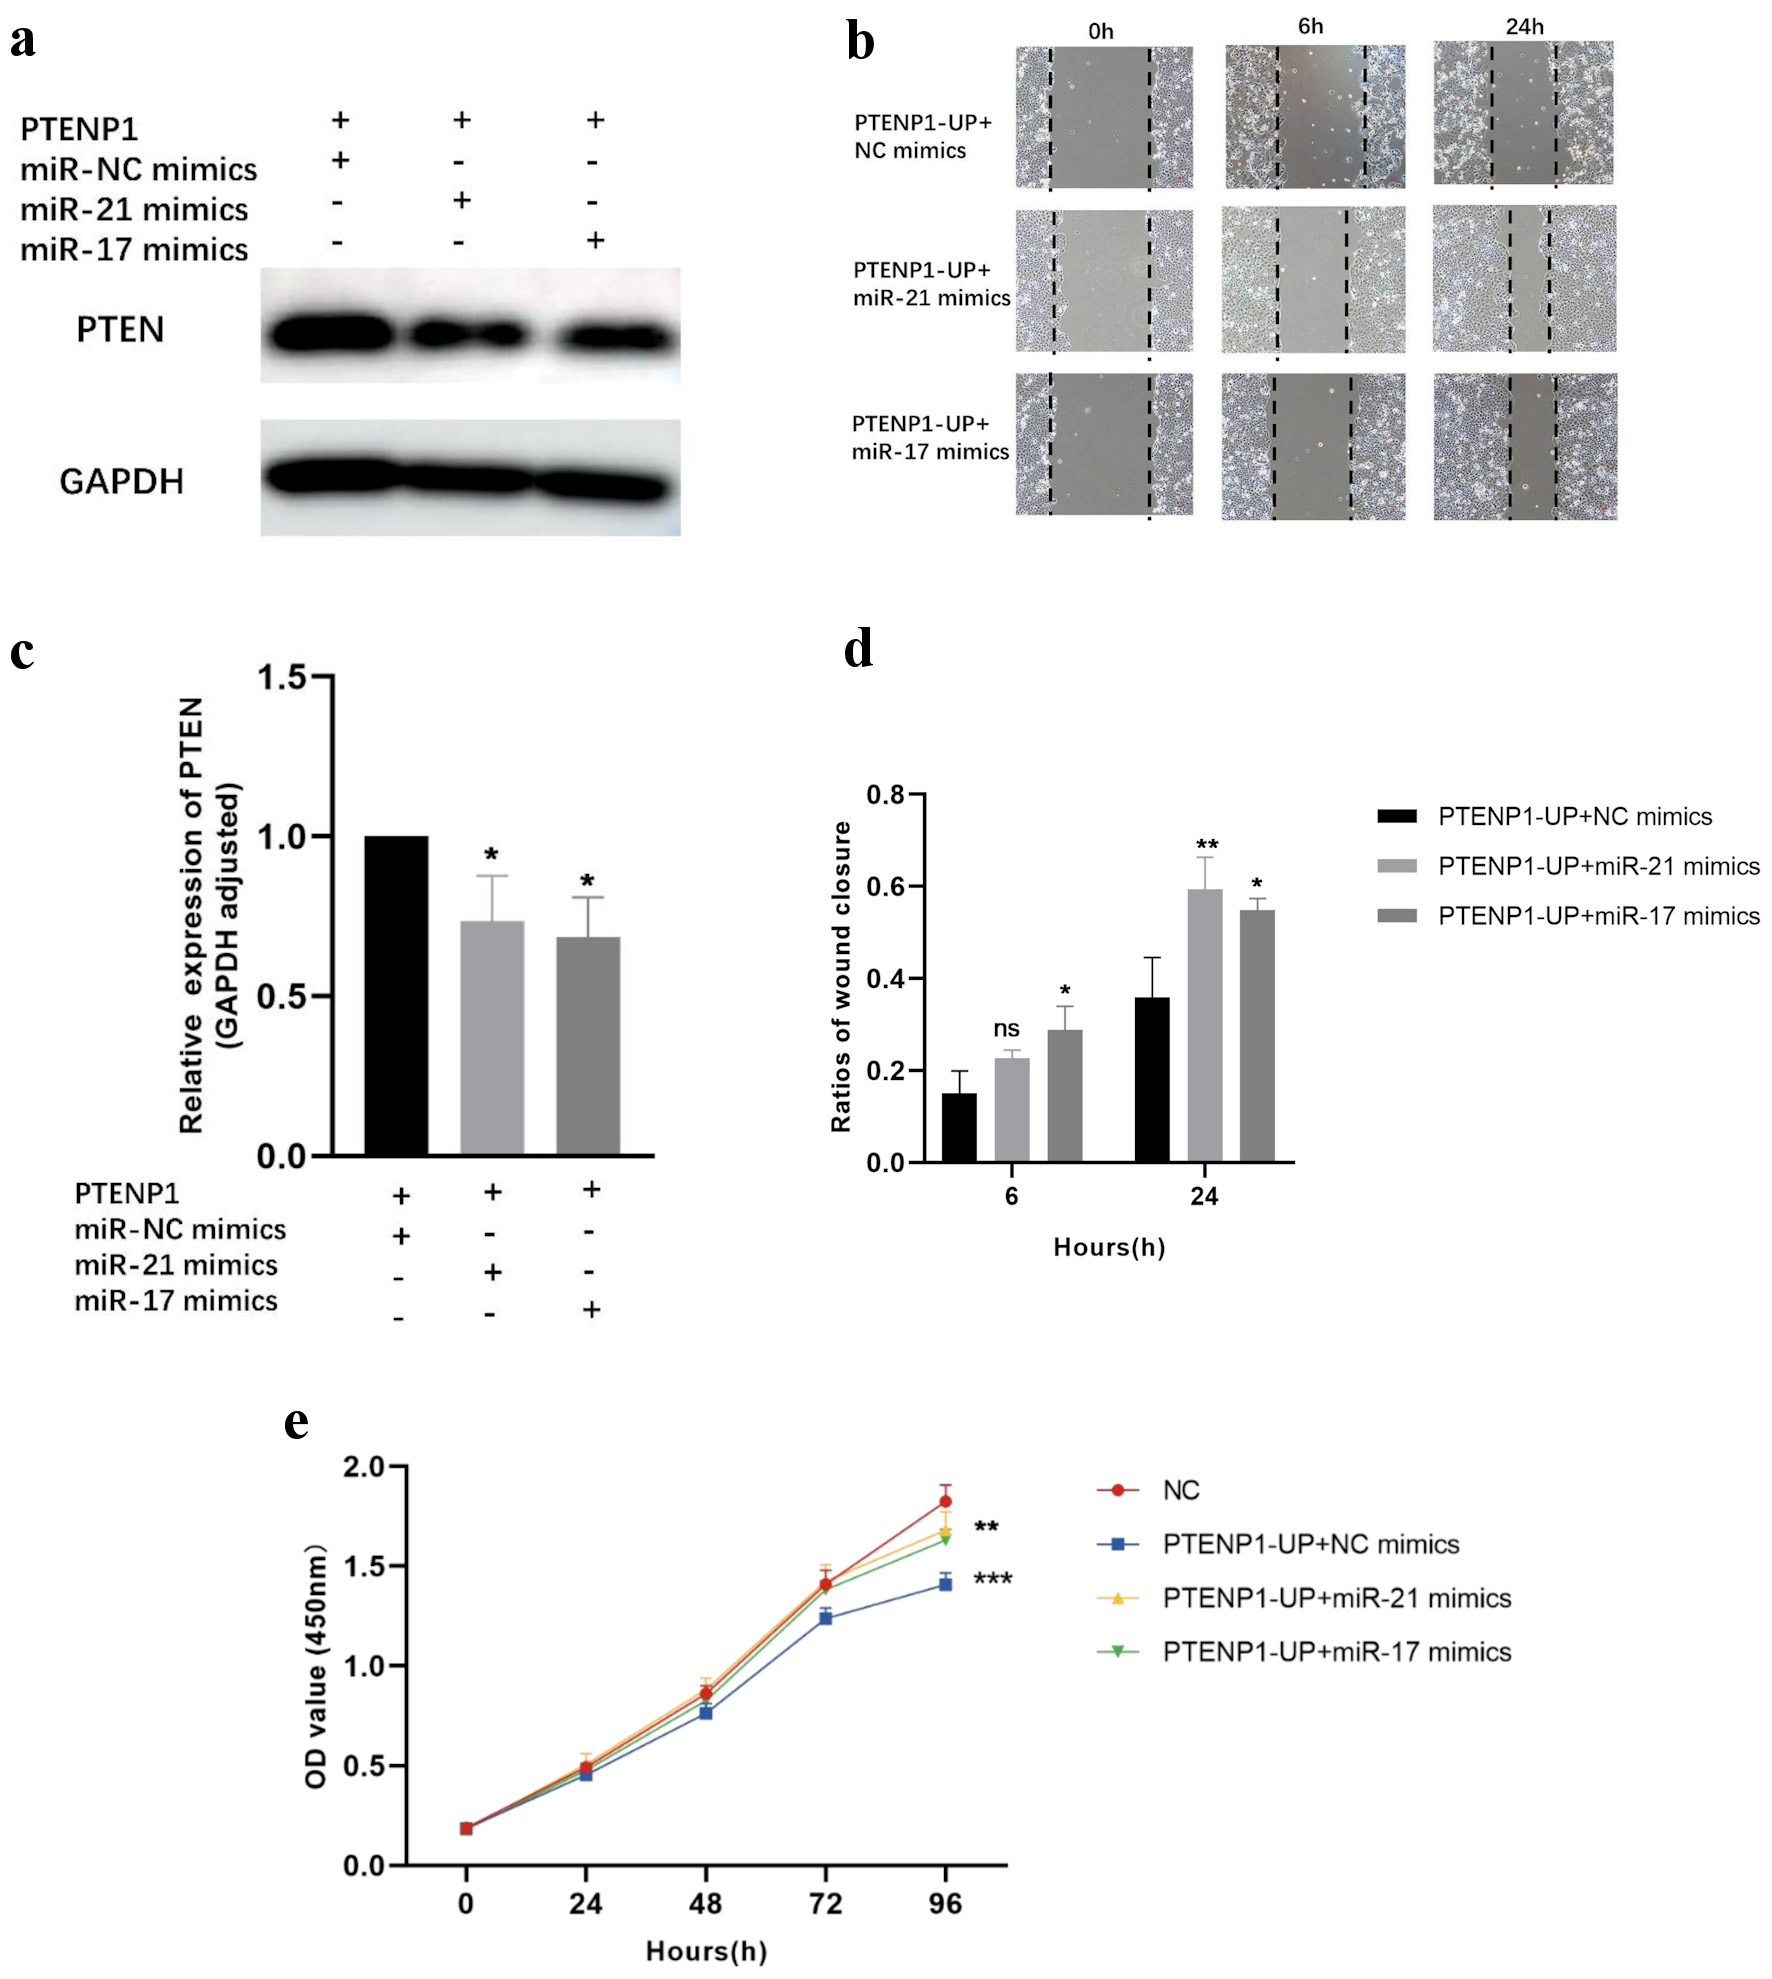
↓ Figure 11. miR-17 and miR-21 reverse the inhibitory effect of PTENP1 on HEC-1A cells. (a, c) PTEN protein expression was decreased in HEC-1A cells of both the PTENP1-UP with miR-17 mimics group (P = 0.021) and the PTENP1-UP with miR-21 mimics group (P = 0.042). (b, d) The PTENP1-UP with miR-17 mimics (P = 0.021) and PTENP1-UP with miR-21 mimics (P = 0.008) groups exhibited a significantly increased cell migration rate at 24 h. (e) The PTENP1-UP with miR-17 mimics (P = 0.005) and PTENP1-UP with miR-21 mimics (P = 0.001) groups exhibited a significantly higher OD value after 96 h of culture. PTENP1-UP: PTENP1 upregulation; OD: optical density; PTEN: phosphatase and tensin homolog deleted on chromosome 10; GAPDH: glyceraldehyde-3-phosphate dehydrogenase; NC: negative controls.
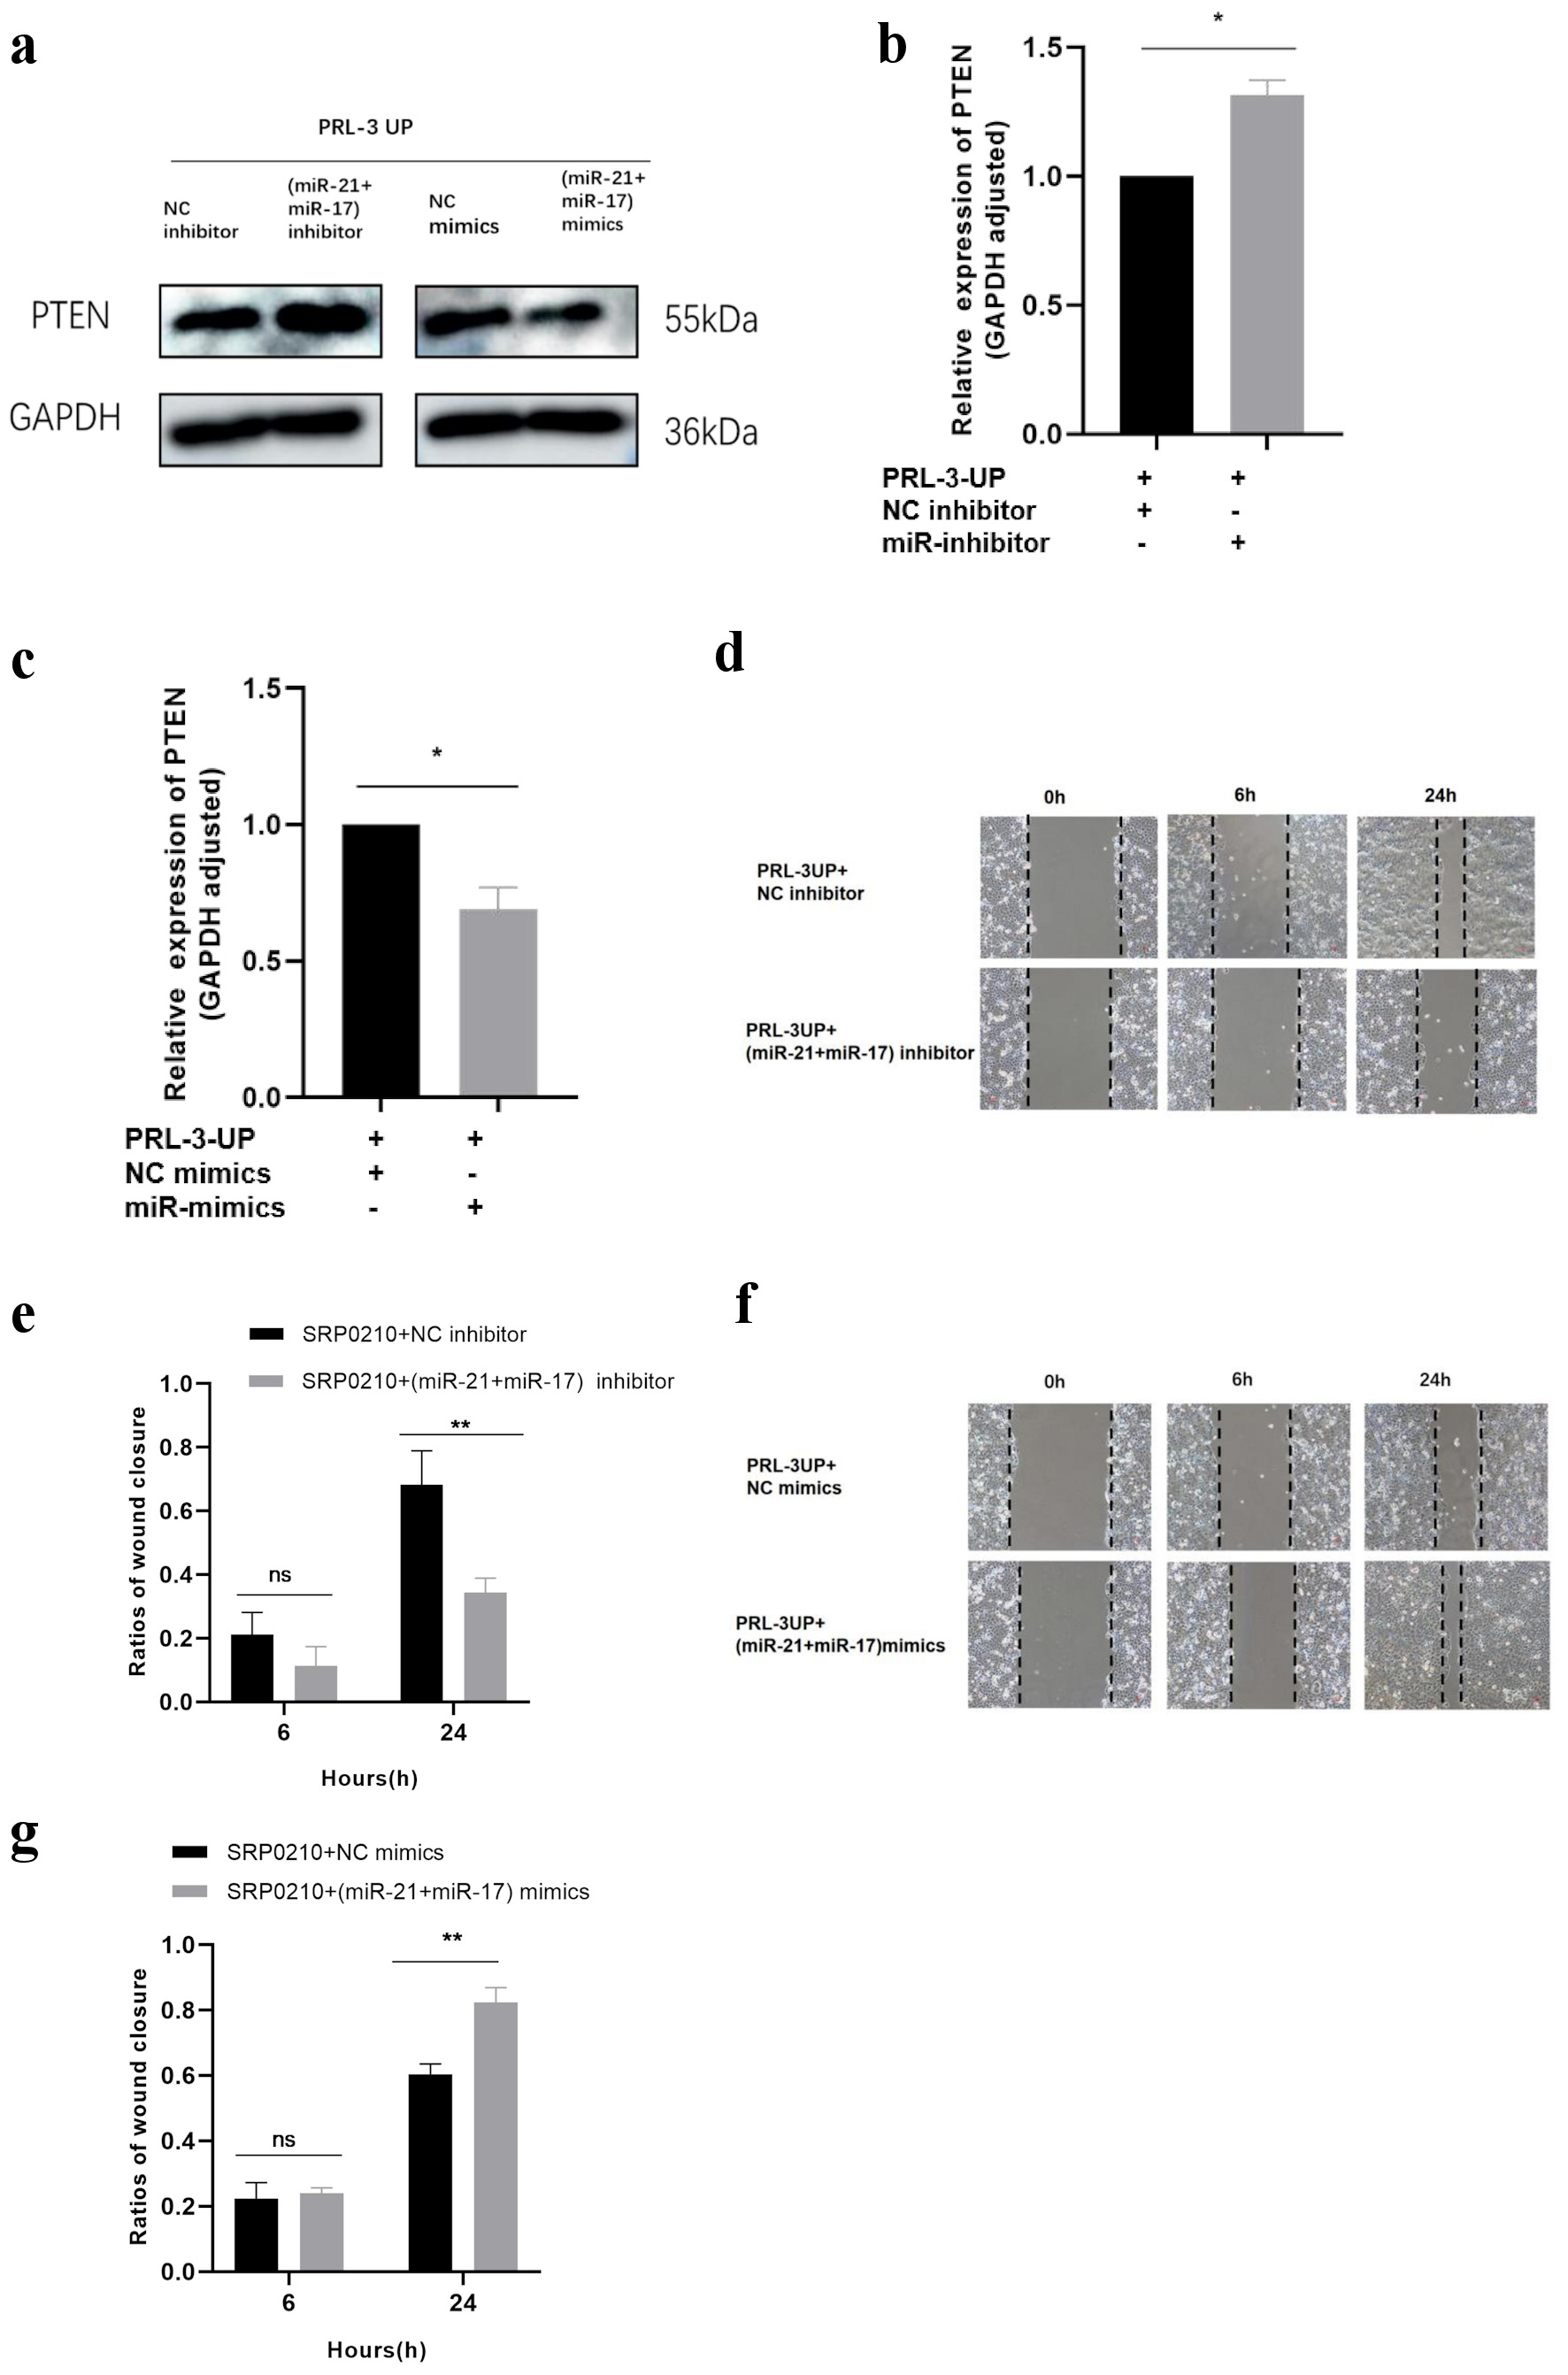
↓ Figure 12. PRL-3 enhances HEC-1A cell proliferation and migration through miR-17/miR-21-mediated suppression of PTEN. (a–c) The PTEN protein expression of HEC-1A cells in PRL-3 overexpression with miR-17 and 21 inhibitors (P = 0.030)/mimics (P = 0.021) group and NC group. (d, e) The PRL-3 overexpression with miR-17/21 inhibitor group exhibited a significantly slower migration rate of HEC-1A cells at 24 h (P = 0.007). (f, g) The PRL-3 overexpression with miR-17/21 mimics group showed a significantly faster migration rate of HEC-1A cells at 24 h (P = 0.002). PTEN: phosphatase and tensin homolog deleted on chromosome 10; GAPDH: glyceraldehyde-3-phosphate dehydrogenase; NC: negative controls; PRL-3 UP: PRL-3 upregulation.
Tables
↓ Table 1. The Sequence of PRL-3
| Genes | Sequences |
|---|
| hPRL3si-1 sense | GGUGGAGGUGAGCUACAAATT |
| hPRL3si-1 antisense | UUUGUAGCUCACCUCCACCTT |
| hPRL3si-2 sense | CCUGUUCUCGGCACCUUAATT |
| hPRL3si-2 antisense | UUAAGGUGCCGAGAACAGGTT |
| hPRL3si-3 sense | CUACAAACACAUGCGCUUCCUTT |
| hPRL3si-3 antisense | AGGAAGCGCAUGUGUUUGUAGTT |
↓ Table 2. The Sequence of miRNA Mimics and miRNA Inhibitor
| Genes | Sequences |
|---|
| hsa-miR-21 mimics sense | UAGCUUAUCAGACUGAUGUUGA |
| hsa-miR-21 mimics antisense | UCAACAUCAGUCUGAUAAGCUA |
| hsa-miR-21 inhibitor | UCAACAUCAGUCUGAUAAGCUA |
| hsa-miR-17 mimics sense | CAAAGUGCUUACAGUGCAGGUAG |
| hsa-miR-17 mimics antisense | CUACCUGCACUGUAAGCACUUUG |
| hsa-miR-17 inhibitor | CUACCUGCACUGUAAGCACUUUG |
| NC mimics sense | UUUGUACUACACAAAAGUACUG |
| NC mimics antisense | CAGUACUUUUGUGUAGUACAAA |
| NC inhibitor | CAGUACUUUUGUGUAGUACAAA |
↓ Table 3. Plasmid Details
| Genes | Species | Gene ID | GenBank | CDS size | Vector |
|---|
| CDS: coding sequence. |
| PTEN | Human | 5728 | NM_000314 | 1,212 | GV658 |
| PTENP1 | Human | 11191 | NR_023917 | 3,917 | GV658 |
↓ Table 4. Primer Sequences for qRT-PCR
| Genes | Primer sequences |
|---|
| qRT-PCR: quantitative real-time PCR. |
| PRL-3 | F: 5'-CTCATCACCCACAACC-3' |
| R: 5'-CAGCCAGTCTTCCACTACCTT-3' |
| PTEN | F: 5'-TGGATTCGACTTAGACTTGACC-3' |
| R: 5'-GGTGGGTTATGGTCTTCAAAAGG-3' |
| PTENP1 | F: 5'-GAGTCGCCTGTCACCATTTC-3' |
| R: 5'-TGTTGGAGGCAGTAGAAGGG-3' |
| miR-21 | CTCAACTGGTGTCGTGGAGTCGGCAATTCAGTTGAGTCAACATC |
| F: 5'-ACACTCCAGCTGGGTAGCTTATCAGACTGA-3' |
| R: 5'-TGGTGTCGTGGAGTCG-3' |
| miR-17 | GTCGTATCCAGTGCAGGGTCCGAGGTATTCGCACTGGATACGACCTACCT |
| F: 5'-CCGCGCCAAAGTGCTTACAGTGC-3' |
| R: 5'-ATCCAGTGCAGGGTCCGAGG-3' |
| β-actin | F: 5'-CTCGCCTTTGCCGATCC-3' |
| R: 5'-GAATCCTTCTGACCCATGCC-3' |
| U6 | F: 5'-CTCGCTTCGGCAGCACA-3' |
| R: 5'-AACGCTTCACGAATTTGCGT-3' |