World Journal of Oncology, ISSN 1920-4531 print, 1920-454X online, Open Access
Article copyright, the authors; Journal compilation copyright, World J Oncol and Elmer Press Inc
Journal website https://wjon.elmerpub.com

Original Article

Volume 000, Number 000, July 2026, pages 000-000


Targeting the Fatty Acid Binding Protein 5–Specificity Protein 1 Axis Restores Enzalutamide Sensitivity by Suppressing Androgen Receptor/Androgen Receptor Splice Variant 7 Signaling: Implications for Prostate Cancer Therapy

Figures

↓  Figure 1. Differential expression of FABP5, AR, and Sp1 between normal prostate tissue and primary PRAD. (a) FABP5 expression is significantly elevated in primary tumor samples compared with normal prostate tissue. (b) AR expression shows a modest but significant reduction in tumor samples relative to normal tissue. (c) Sp1 expression is moderately decreased in tumor samples compared with normal prostate tissue. Gene expression levels are presented as log2(TPM + 1). Data were obtained from TCGA-PRAD datasets and visualized using GEPIA2. Statistical significance was determined using Student’s t-test. *P < 0.05, **P < 0.01, ***P < 0.001. AR: androgen receptor; FABP5: fatty acid binding protein 5; Sp1: specificity protein 1; PRAD: prostate adenocarcinoma.
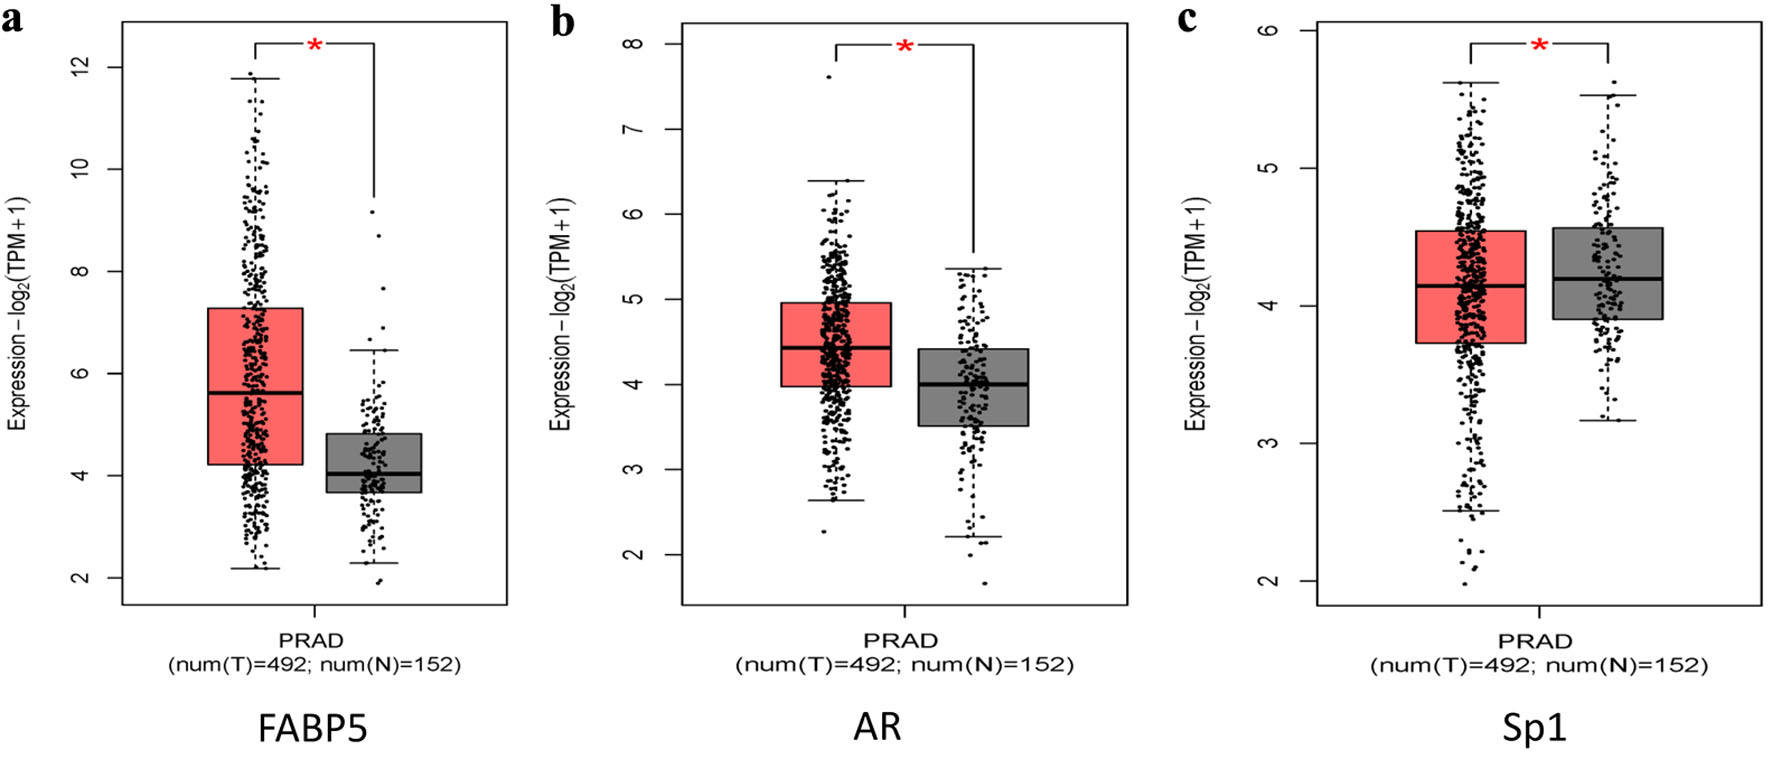
Figure 1.
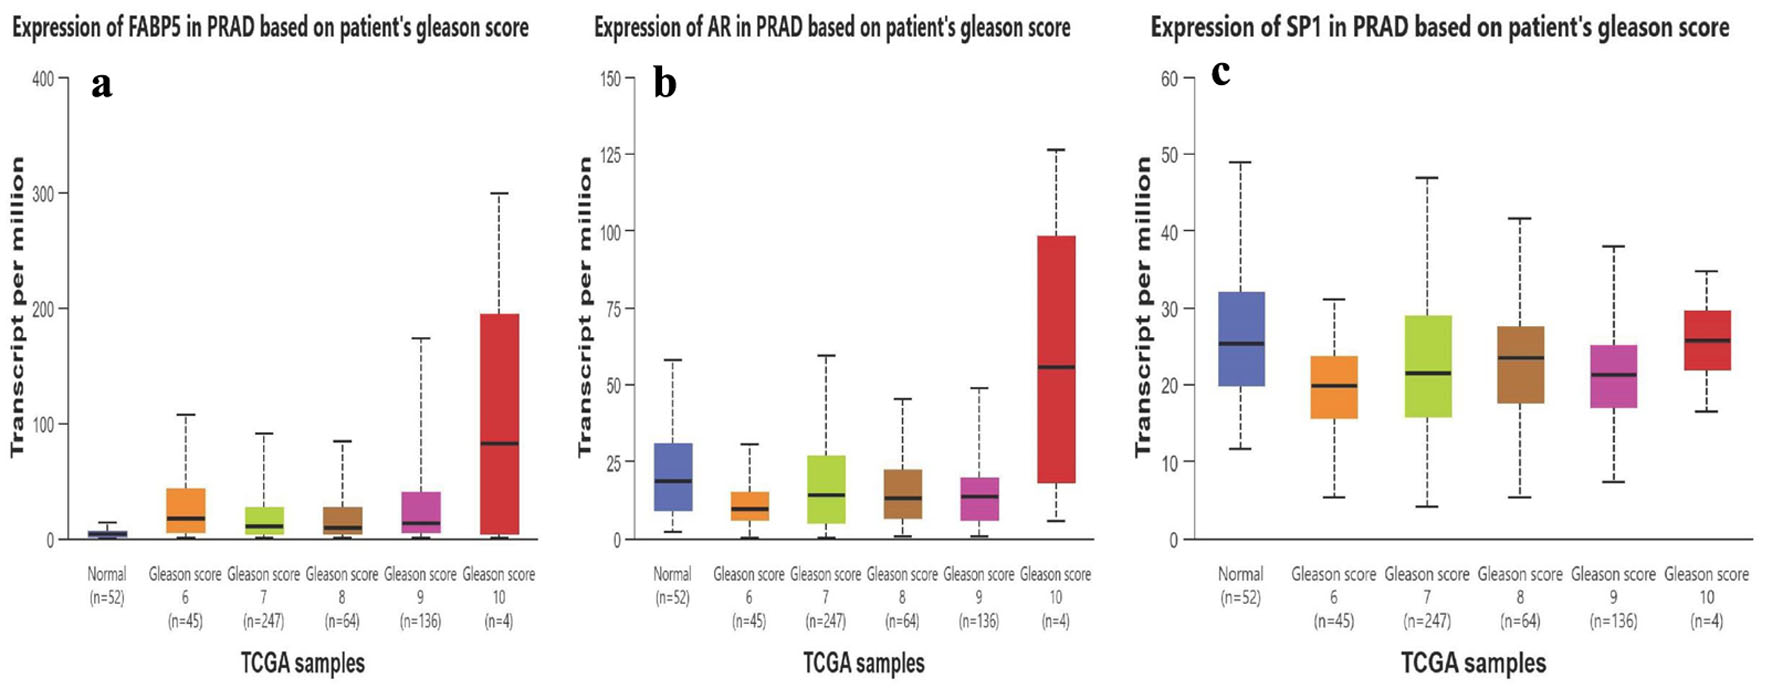
↓  Figure 2. Expression patterns of FABP5, AR, and Sp1 across prostate cancer Gleason score groups in the TCGA-PRAD. (a) FABP5 expression progressively increases with higher Gleason score categories, with the highest levels observed in high-grade tumors. (b) AR expression demonstrates an overall increase in higher Gleason score groups, consistent with its association with advanced disease. (c) Sp1 expression shows moderate variability across Gleason score categories without a consistent monotonic trend. Gene expression levels are presented as transcripts per million (TPM). Data and associated statistical analyses were obtained from the TCGA-PRAD dataset through the UALCAN platform. AR: androgen receptor; FABP5: fatty acid binding protein 5; Sp1: specificity protein 1.
Figure 2.
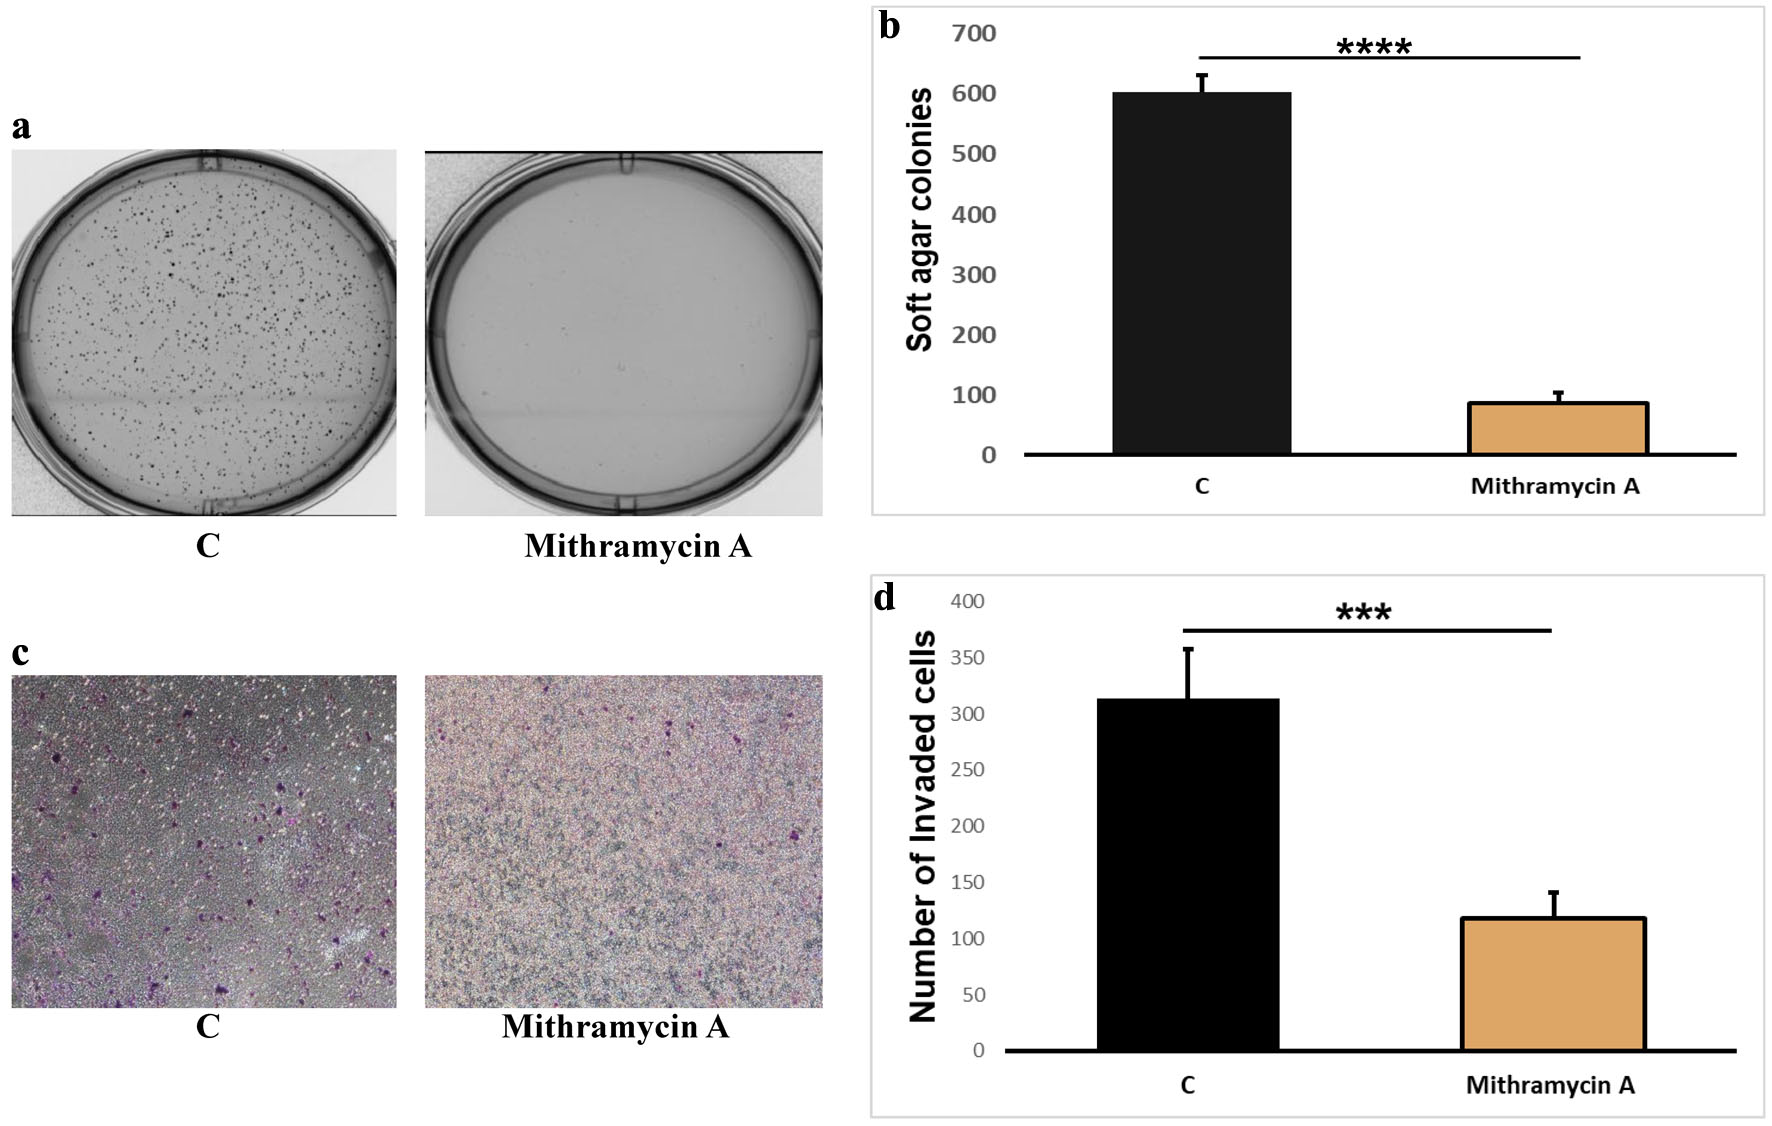
↓  Figure 3. Sp1 inhibition by mithramycin A reduces anchorage-independent growth and invasion in 22RV1 cells. (a) Representative soft agar colony formation images of 22RV1 cells treated with DMSO control (C) or 1 µM mithramycin A. (b) Quantification of soft agar colonies showing a significant reduction after mithramycin A treatment. (c) Representative invasion assay images of 22RV1 cells treated with DMSO control (C) or 1 µM mithramycin A. (d) Quantification of invaded cells showing a significant reduction after mithramycin A treatment. Quantitative data in panels (b) and (d) are presented as mean ± SD from three independent experiments. ****P < 0.0001; ***P < 0.001. DMSO: dimethyl sulfoxide; Sp1: specificity protein 1; SD: standard deviation.
Figure 3.
↓  Figure 4. Effect of enzalutamide on AR and AR-V7 expression in both 22RV1 and 22RV1-FABP5 knockout cells. (a) Western blot analysis illustrates the protein levels of full-length AR and AR-V7 in both wild-type and FABP5 knockout 22RV1 cells under both baseline conditions and following enzalutamide treatment. β-Actin was used as a loading control. (b) The quantification of AR and AR-V7 protein expression, normalized to actin levels, is presented as the mean ± SD derived from three independent experimental trials. Statistical significance was determined using unpaired two-tailed Student’s t-test. ****P < 0.0001. AR: androgen receptor; AR-V7: androgen receptor splice variant 7; FABP5: fatty acid binding protein 5.
Figure 4.
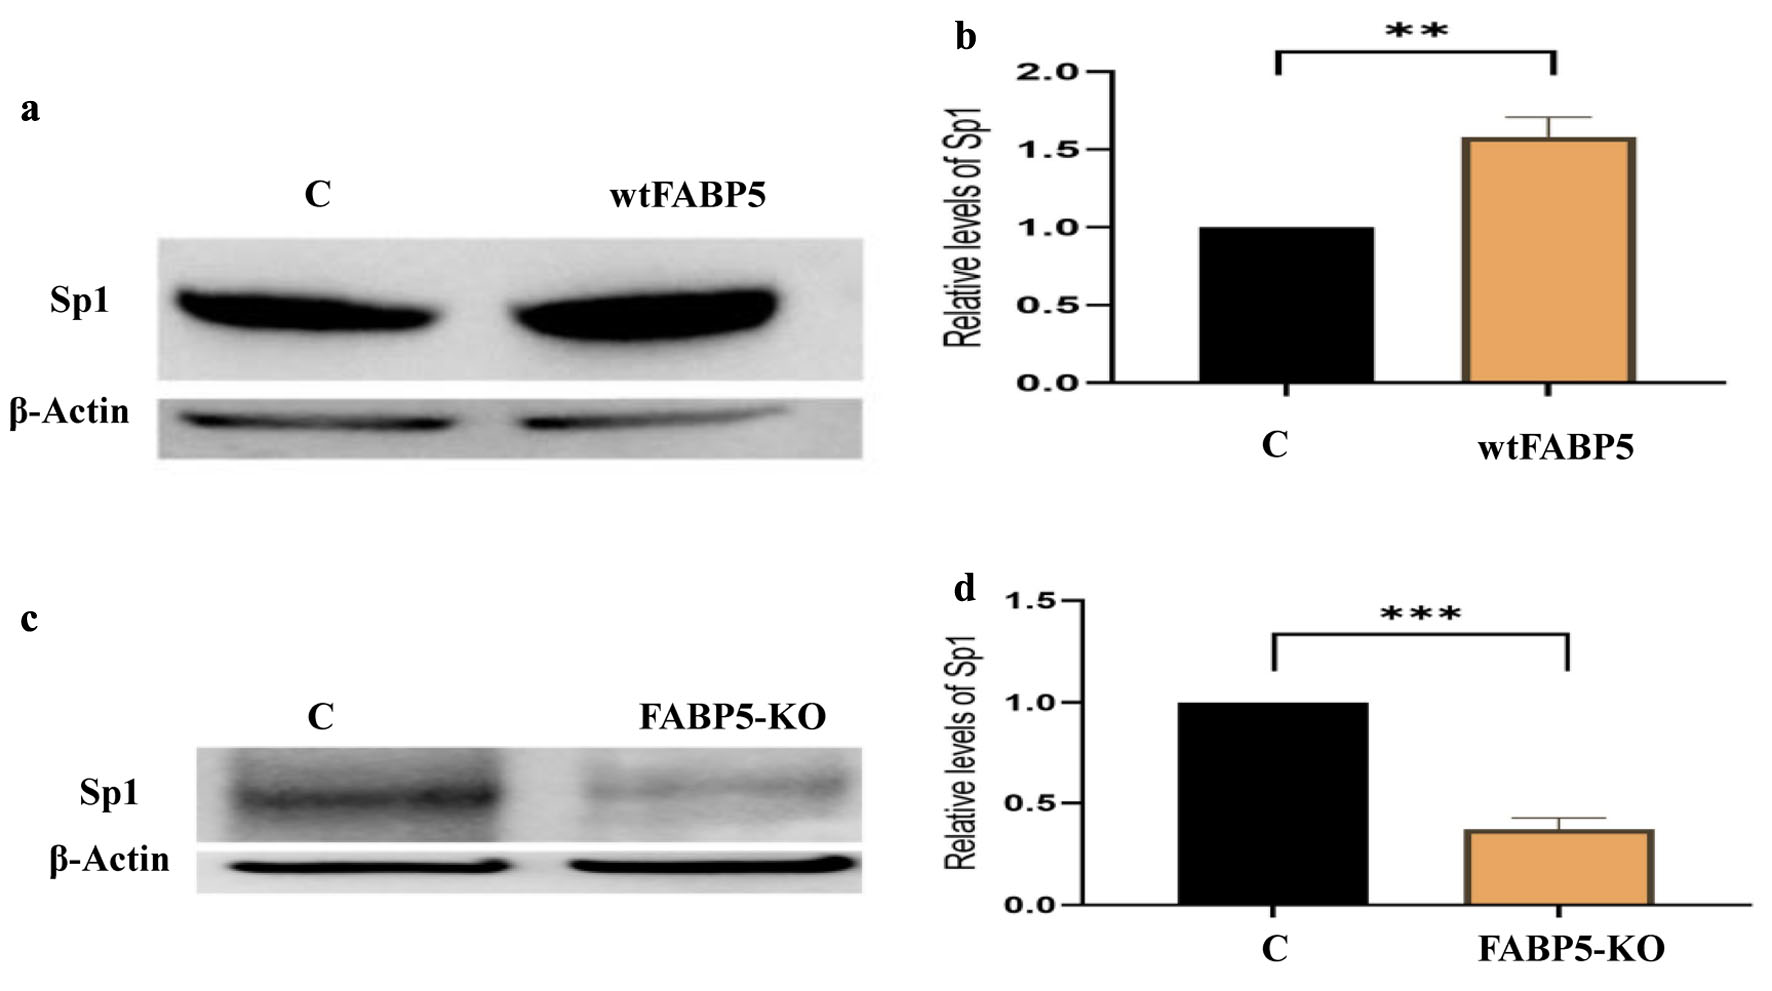
↓  Figure 5. FABP5 positively regulates Sp1 protein expression in 22RV1 cells. (a) Representative Western blot showing increased Sp1 protein levels following FABP5 overexpression in 22RV1 cells compared with control (C). (b) Densitometric quantification of Sp1 expression normalized to β-actin in FABP5-overexpressing cells. (c) Western blot analysis demonstrating reduced Sp1 protein levels in FABP5 knockout (FABP5-KO) 22RV1 cells compared with parental control cells. (d) Quantification of normalized Sp1 protein levels in FABP5-KO cells. Data are presented as mean ± SD from three independent experiments. **P < 0.01; ***P < 0.001. FABP5: fatty acid binding protein 5; Sp1: specificity protein 1; SD: standard deviation.
Figure 5.
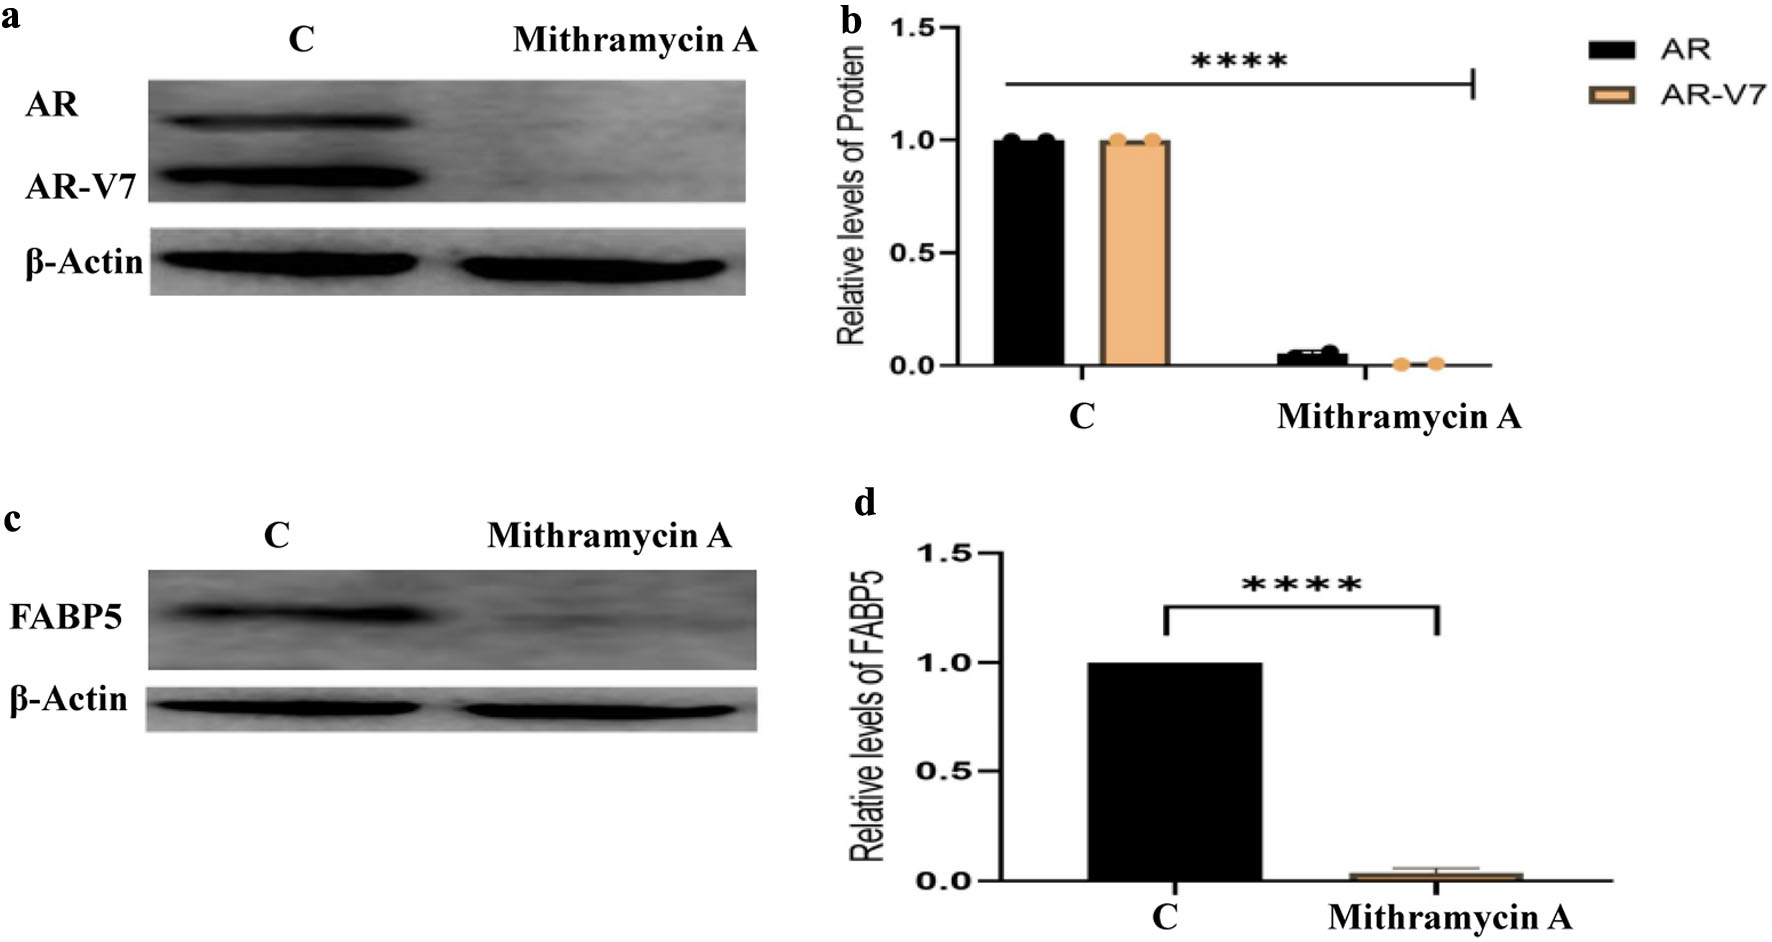
↓  Figure 6. Pharmacological inhibition of Sp1 suppresses AR, AR-V7, and FABP5 expression in 22RV1 cells. (a) Representative Western blot showing reduced AR and AR-V7 protein levels in 22RV1 cells treated with mithramycin A compared with untreated control (C). (b) Densitometric quantification of AR and AR-V7 protein expression normalized to β-actin. (c) Western blot analysis demonstrating marked suppression of FABP5 protein expression following mithramycin A treatment. (d) Quantification of FABP5 protein levels relative to β-actin. Data are presented as mean ± SD from three independent experiments. ****P < 0.0001. AR: androgen receptor; AR-V7: androgen receptor splice variant 7; FABP5: fatty acid binding protein 5; Sp1: specificity protein 1; SD: standard deviation.
Figure 6.
↓  Figure 7. Sp1 inhibition suppresses PPARγ, p-PPARγ signaling, and downstream VEGFA expression in 22RV1 cells. (a) Representative Western blot showing reduced total PPARγ protein levels in 22RV1 cells treated with mithramycin A compared with control (C). (b) Densitometric quantification of total PPARγ expression normalized to β-actin. (c) Western blot analysis demonstrating decreased levels of p-PPARγ following mithramycin A treatment. (d) Quantitative analysis of p-PPARγ protein levels relative to β-actin. Data are presented as mean ± SD from three independent experiments. **P < 0.01. (e) Representative Western blot showing reduced VEGFA protein expression following mithramycin A treatment. (f) Densitometric quantification of VEGFA protein levels normalized to β-actin. Data are presented as mean ± SD from three independent experiments. **P < 0.01. PPARγ: peroxisome proliferator-activated receptor gamma; p-PPARγ: phosphorylated PPARγ; Sp1: specificity protein 1; SD: standard deviation; VEGFA: vascular endothelial growth factor A.
Figure 7.

Table

↓  Table 1. Details of the Primary and Secondary Antibodies Used in This Study
 
Target proteinPrimary antibody (dilution, supplier)Secondary antibody (dilution, supplier)
AR: androgen receptor; AR-V7: androgen receptor splice variant 7; FABP5: fatty acid binding protein 5; HRP: horseradish peroxidase; PPARγ: peroxisome proliferator-activated receptor gamma; p-PPARγ: phosphorylated PPARγ; Sp1: specificity protein 1; VEGFA: vascular endothelial growth factor A.
FABP5Rabbit monoclonal (1:500, Hycult Biotech)Swine anti-rabbit polyclonal HRP (1:10,000, DAKO)
ARMouse monoclonal (1:400, Santa Cruz Biotechnology)Rabbit anti-mouse polyclonal HRP (1:10,000, DAKO)
AR-V7Rabbit polyclonal (1:1000, Cell Signaling Technology)Swine anti-rabbit polyclonal HRP (1:10,000, DAKO)
Sp1Rabbit polyclonal (1:1000, Cell Signaling Technology)Swine anti-rabbit polyclonal HRP (1:10,000, DAKO)
PPARγMouse monoclonal (1:500, Santa Cruz Biotechnology)Rabbit anti-mouse polyclonal HRP (1:10,000, DAKO)
p-PPARγ (Ser112)Rabbit polyclonal (1:250, ThermoFisher Scientific)Swine anti-rabbit polyclonal HRP (1:10,000, DAKO)
VEGFARabbit polyclonal (1: 1,000) (Abcam)Swine anti-rabbit polyclonal HRP (1:10,000, DAKO)
β-actinMouse monoclonal (1:20,000, Abcam)Rabbit anti-mouse polyclonal HRP (1:20,000, Abcam)