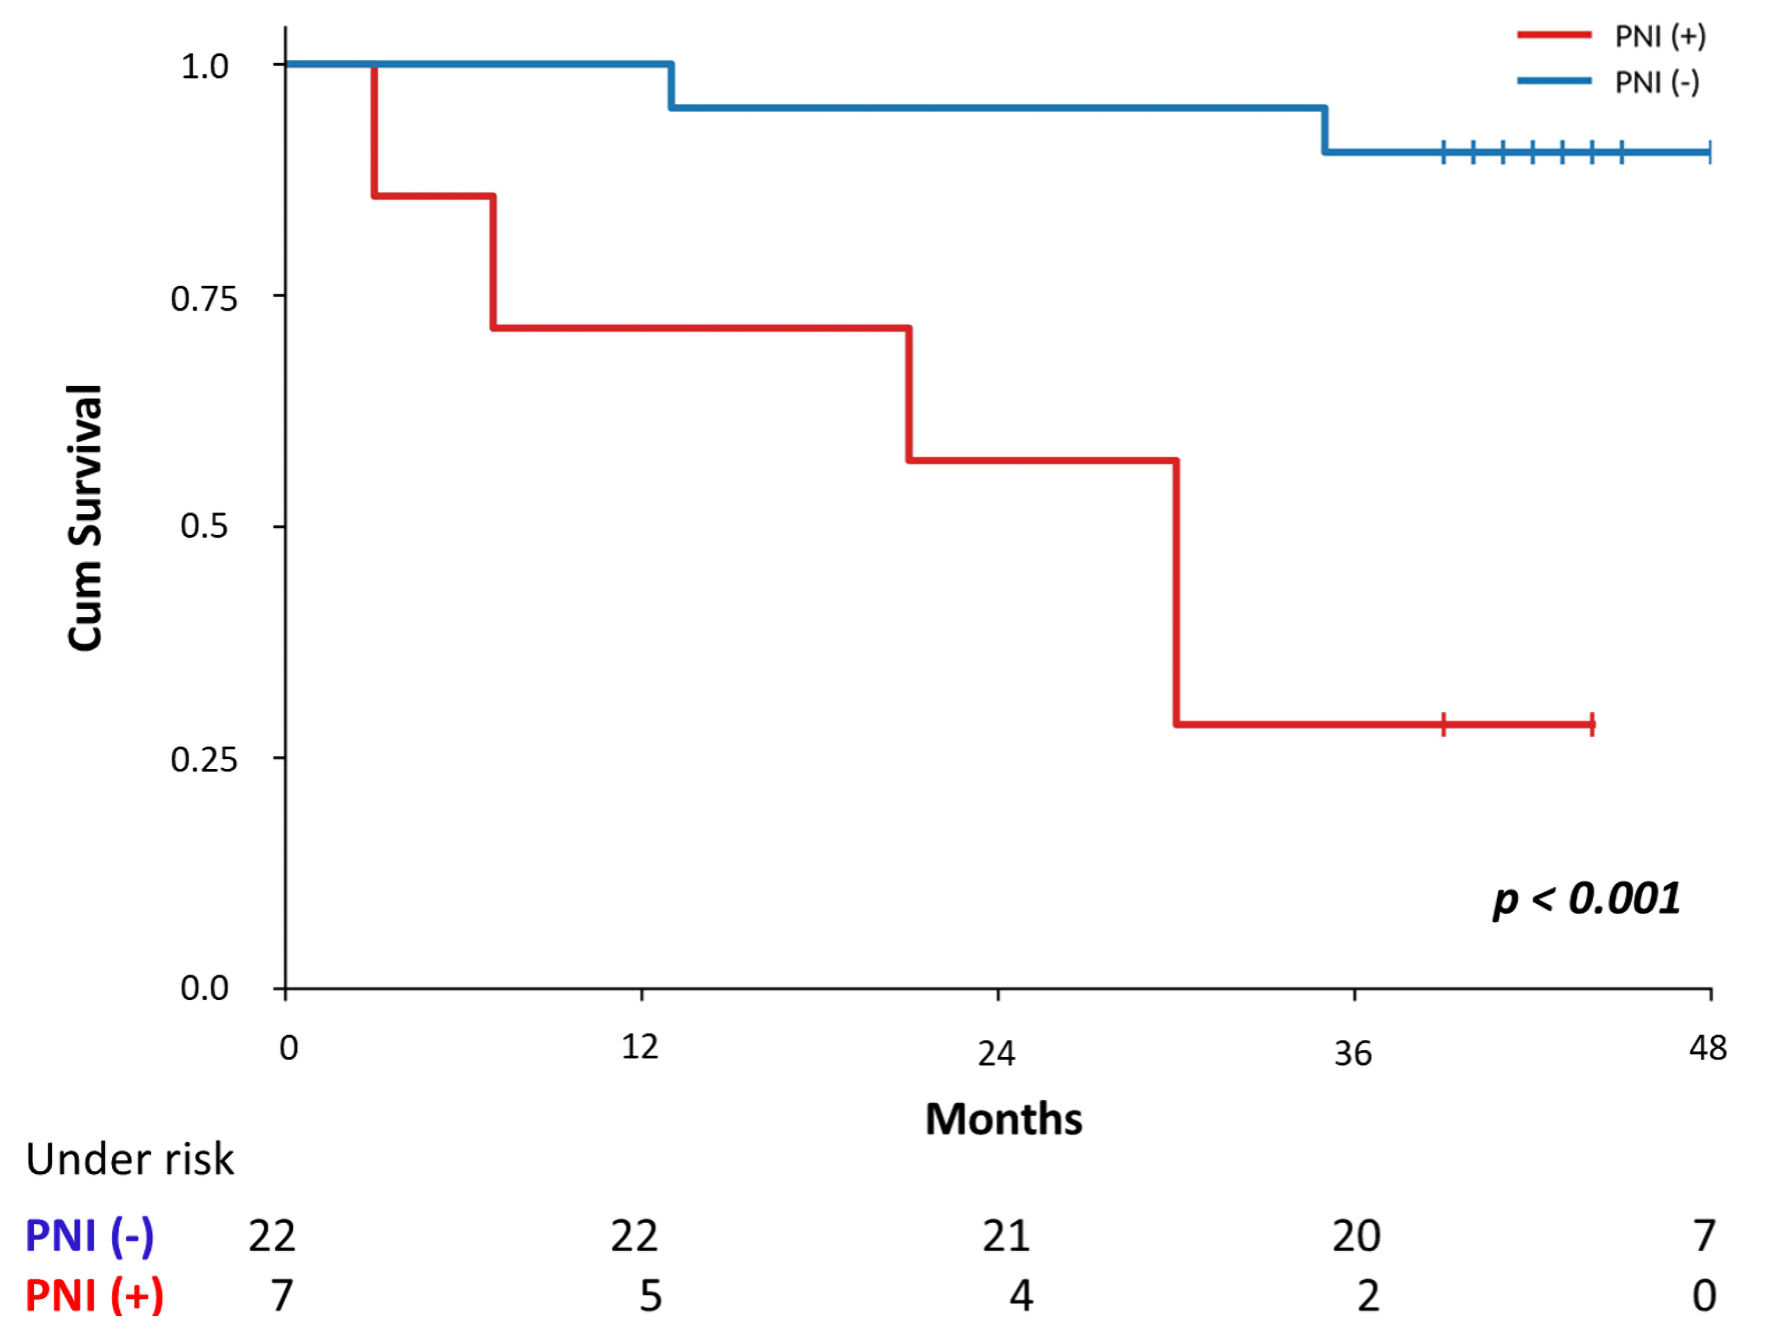
↓ Figure 1. Kaplan–Meier curves for overall survival in rectal cancer patients grouped by perineural invasion. PNI: prognostic nutritional index.
| World Journal of Oncology, ISSN 1920-4531 print, 1920-454X online, Open Access |
| Article copyright, the authors; Journal compilation copyright, World J Oncol and Elmer Press Inc |
| Journal website https://wjon.elmerpub.com |
Original Article
Volume 17, Number 4, August 2026, pages 572-587
Divergent Prognostic Impact of Histopathological Features and Combined Hematological–Biochemical Indices in Rectal Versus Colorectal Cancer: A Single-Center Study
Figure
Tables
| Characteristics of patients | Colorectal cancer, n (%) | Rectal cancer, n (%) |
|---|---|---|
| aData are shown as median (minimum–maximum). bData are shown as median (25−75 percentiles). cmGPS 0 (CRP ≤ 10, Alb ≥ 35), mGPS 1 (CRP ≤ 10, Alb < 35 or CRP > 10, Alb ≥ 35), mGPS 2 (CRP > 10, Alb < 35). dPatients were grouped as mGPS 1–2. ASA: American Society of Anesthesiology; RBC: red blood cell; RDW-CV: red cell distribution width–coefficient of variation; CRP: C-reactive protein; CEA: carcinoembryonic antigen; CA 19-9: carbohydrate antigen 19-9; NLR: neutrophil-to-lymphocyte ratio; MLR: monocyte-to-lymphocyte ratio; PLR: platelet-to-lymphocyte ratio; RLR: red cell distribution width-to-lymphocyte ratio; MPR: mean platelet volume-to-platelet ratio; PNI: prognostic nutritional index; CAR: C-reactive protein–to–albumin ratio; LANR: lymphocyte–albumin–neutrophil ratio; mGPS: modified Glasgow prognostic score; Alb: albumin. | ||
| Sex | ||
| Male | 63 (56.8) | 18 (62.1) |
| Age (years)a | 67 (32−88) | 65 (44–81) |
| ASA score | ||
| 1 | 18 (16.2) | 8 (27.6) |
| 2 | 50 (45.0) | 14 (48.3) |
| 3 | 43 (38.7) | 7 (24.1) |
| 4 | 0 (0) | 0 (0) |
| 5 | 0 (0) | 0 (0) |
| Hematological/biochemical values and indexesb | ||
| Leukocytes (× 109/L) | 7 (5.70−8.4) | 6.00 (4.93–7.35) |
| Erythrocytes (× 109/L) | 4.51 (4.17−4.88) | 4.54 (4.18–4.81) |
| Platelets (× 109/L) | 293 (243−377) | 252 (193.5–374.5) |
| Neutrophils (× 109/L) | 4.72 (3.78−5.85) | 3.95 (2.93–5.04) |
| Lymphocytes (× 109/L) | 1.47 (1.14−1.94) | 1.44 (0.91–1.78) |
| Monocytes (× 109/L) | 0.35 (0.28−0.44) | 0.32 (0.28–0.43) |
| Hemoglobin (g/dL) | 12.10 (10.40−13.60) | 12.40 (11.25–14.15) |
| Hematocrit (%) | 37.70 (33.60−41.80) | 38.50 (35.95–42.7) |
| RBC (RDW-CV) (%) | 14.6 (13.3−17.4) | 14.20 (13.20–16.35) |
| Serum albumin (g/L) | 39 (35.00−42.00) | 40 (36.00–43.00) |
| CRP (mg/mL) | 4.80 (2.00−17.10) | 3.50 (1.30–5.10) |
| CEA (ng/mL) | 3.37 (2.02−9.11) | 3.49 (2.21–6.40) |
| CA 19-9 (U/mL) | 11.44 (6.28−28.46) | 9.34 (6.15–31.40) |
| NLR | 3.09 (2.21−4.54) | 2.85 (1.77–4.62) |
| MLR | 0.23 (0.18−0.32) | 0.22 (0.17–0.36) |
| PLR | 190.63 (141.60−276.14) | 177.38 (140.94–267.73) |
| RLR | 10.23 (7.62−14.1) | 10.43 (7.83–15.07) |
| MPR | 0.03 (0.02−0.04) | 0.04 (0.03–0.05) |
| CAR | 0.12 (0.05−0.45) | 0.08 (0.03–0.13) |
| PNI | 46.56 (42.30−50.85) | 46.90 (42.33–51.30) |
| LANR | 12.43 (7.78−17.76) | 13.02 (8.86–20.88) |
| mGPSc | ||
| 0 | 66 (59.5) | 22 (75.9) |
| 1 | 31 (27.9) | 7 (24.1)d |
| 2 | 14 (12.6) | |
| Colorectal cancer death | Rectal cancer death | |||||
|---|---|---|---|---|---|---|
| No, n (%) | Yes, n (%) | P | No, n (%) | Yes, n (%) | P | |
| *P values indicate statistical significance (P < 0.05). aP values were calculated by the Chi-square test. bP values were calculated by the Mann–Whitney test. cData are shown as median (25−75 percentiles). dPatients were categorized into two groups as mGPS 0 and mGPS 1–2. ePatients were categorized into two groups as without and easy to moderate/expressed PTL response. fPatients were categorized into two groups as C–D classification I and C–D II, III, IV, V. TIL: tumor-infiltrating lymphocytes; PTL: peritumoral lymphocytic; C–D classification: Clavien–Dindo classification; CT: chemotherapy; CRT: chemoradiotherapy; ASA: American Society of Anesthesiology; RBC: red blood cell; RDW-CV: red cell distribution width–coefficient of variation; CRP: C-reactive protein; CEA: carcinoembryonic antigen; CA 19-9: carbohydrate antigen 19-9; NLR: neutrophil-to-lymphocyte ratio; MLR: monocyte-to-lymphocyte ratio; PLR: platelet-to-lymphocyte ratio; LANR: lymphocyte–albumin–neutrophil ratio; PNI: prognostic nutritional index; CAR: C-reactive protein–to–albumin ratio; mGPS: modified Glasgow prognostic score. | ||||||
| Sex | 0.300a | 0.375a | ||||
| Male | 44 (60.3) | 19 (50) | 15 (68.2) | 3 (42.9) | ||
| Female | 29 (39.7) | 19 (50) | 7 (31.8) | 4 (57.1) | ||
| ASA score | 0.248a | 0.935a | ||||
| 1 | 11 (15.1) | 7 (18.4) | 6 (27.3) | 2 (28.6) | ||
| 2 | 37 (50.7) | 13 (34.2) | 11 (50) | 3 (42.9) | ||
| 3 | 25 (34.2) | 18 (47.4) | 5 (22.7) | 2 (28.6) | ||
| 4 | — | — | — | — | ||
| 5 | — | — | — | — | ||
| Diabetes mellitus | 21 (28.8) | 8 (21.1) | 0.380a | 4 (18.2) | 1 (14.3) | 0.653a |
| Arterial hypertension | 53 (72.6) | 28 (73.7) | 0.903a | 14 (63.6) | 5 (71.4) | 0.541a |
| Leukocytesc | 6.9 (5.80−8.10) | 7.65 (5.6−8.8) | 0.218b | 5.93 (5.10–6.80) | 6.9 (4.10–8.50) | 0.610b |
| Erythrocytesc | 4.55 (4.29−4.89) | 4.3 (3.88−4.79) | 0.059b | 4.57 (4.36–4.81) | 4.20 (3.93–4.58) | 0.194b |
| Plateletsc | 282 (228−373) | 317 (258−389) | 0.090b | 233 (192–321) | 389 (314–428) | 0.011*b |
| Neutrophilsc | 4.59 (3.78−5.66) | 5.18 (3.84−7.12) | 0.196b | 3.89 (3.23–4.55) | 4.58 (2.65–7.20) | 0.610b |
| Lymphocytesc | 1.54 (1.25−1.94) | 1.33 (1.05−1.84) | 0.254b | 1.49 (1.03–1.78) | 0.99 (0.88–1.78) | 0.475b |
| Monocytesc | 0.34 (0.29−0.42) | 0.35 (0.26−0.48) | 0.751b | 0.32 (0.28–0.38) | 0.34 (0.22–0.44) | 0.878b |
| NLRc | 2.89 (2.22−4.44) | 3.73 (2.21−4.8) | 0.160b | 2.84 (1.72–4.44) | 3.01 (2.0–8.57) | 0.508b |
| MLRc | 0.22 (0.17−0.29) | 0.25 (0.19−0.35) | 0.234b | 0.21 (0.16–0.37) | 0.27 (0.21–0.35) | 0.359b |
| PLRc | 188.3 (138.14−235.62) | 211.64 (153.26−324.6) | 0.056*b | 154.9 (131.95–109.5) | 259.2 (183.84–465.2) | 0.013b |
| CRPc | 3.5 (1.7−9.8) | 10.3 (4−34.9) | 0.001*b | 3.0 (1.3–4.0) | 6.7 (1.3–34.9) | 0.132b |
| Serum albuminc | 40 (36−42) | 37 (33−41) | 0.005*b | 41 (37–43) | 36 (35–42) | 0.209b |
| Hemoglobinc | 12.4 (10.8−13.7) | 11 (9.4−12.9) | 0.037*b | 13.1 (11.8–14.2) | 11.0 (8.6–12.8) | 0.059b |
| Hematocritc | 38.6 (35.2−41.9) | 35.2 (31.9−41.7) | 0.027*b | 39.7 (37.5–43.0) | 35.8 (29.2–38.1) | 0.041*b |
| RBC (RDW-CV) c | 14.2 (13.2−16.7 | 14.9 (14−19.8) | 0.041*b | 13.5 (13.1–15.8) | 14.9 (14.6–19.4) | 0.039*b |
| CARc | 0.08 (0.04−0.24) | 0.257 (0.11−0.85) | 0.001*b | 0.077 (0.033–0.093) | 0.164 (0.037–0.851) | 0.093b |
| PNIc | 47.3 (43.8−51.25) | 54.1 (39.6−48.6) | 0.013*b | 46.63 (43.5–51.45) | 45.2 (39.4–48.6) | 0.359b |
| LANRc | 13.27 (8.86−18.9) | 9.85 (7.09−16.28) | 0.043*b | 13.58 (8.86–22.52) | 11.62 (4.78–17.92) | 0.241b |
| CEAc | 2.99 (1.88−6.48) | 5.2 (2.41−10.05) | 0.030*b | 3.5 (2.30–9.86) | 3.23 (2.10–6.11) | 0.460b |
| CA 19−9c | 10.41 (6.4−27.59) | 14.33 (6.22−37.16) | 0.230b | 9.21 (6.52–31.10) | 10.95 (4.98–37.16) | 0.541b |
| mGPS | 0.003*a | |||||
| 0 | 50 (68.5) | 16 (42.1) | 17 (77.3)d | 5 (71.4)d | 0.753a | |
| 1 | 19 (26) | 12 (31.6) | 5 (22.7)d | 2 (28.6)d | ||
| 2 | 4 (5.5) | 10 (26.3) | ||||
| Max diameter of tumorc | 40 (30−55) | 40 (30−55) | 0.741a | 40 (25–55) | 45 (35–65) | 0.271a |
| T status | 0.032* | 0.028* | ||||
| T1/T2 | 28 (38.4) | 7 (18.4) | 10 (45.5) | 0 (0) | ||
| T3/T4 | 45 (61.6) | 31 (81.6) | 12 (54.5) | 7 (100) | ||
| TNM stage | 0.009*a | 0.374a | ||||
| I/II | 46 (63) | 14 (36.8) | 13 (59.1) | 3 (42.9) | ||
| III/IV | 27 (37) | 24 (63.2) | 9 (40.9) | 4 (57.1) | ||
| Number of lymph nodesc | 17 (12−21) | 14 (12−17) | 0.120a | 13 (11–18) | 11 (10–18) | 0.329a |
| Positive lymph nodesc | 0 (0−1) | 2 (0−5) | 0.003*b | 0 (0–1) | 0 (0–6) | 0.489b |
| Lymph node ratio (LNR) | 0 (0−0.048) | 0.113 (0−0.353) | 0.001*b | 0 (0−0.148) | 0.113 (0−0.268) | 0.417b |
| Tumor configuration | 0.262a | 0.353a | ||||
| Exophytic | 29 (39.7) | 11 (28.9) | 7 (31.8) | 1 (14.3) | ||
| Endophytic | 44 (60.3) | 27 (71.1) | 15 (68.2) | 6 (85.7) | ||
| TIL | 0.380a | 0.545a | ||||
| Without/easy to moderate | 52 (71.2) | 30 (78.9) | 17 (77.3) | 6 (85.7) | ||
| Expressed | 21 (28.8) | 8 (21.1) | 5 (2.7) | 1 (14.3) | ||
| PTL response | 0.019*a | 0.647a | ||||
| Without | 14 (19.2) | 12 (31.6) | 6 (27.3)e | 2 (28.6)e | ||
| Easy to moderate | 43 (58.9) | 25 (65.8) | 16 (72.7)e | 5 (71.4)e | ||
| Expressed | 16 (21.9) | 1 (2.6) | ||||
| Mucosal component of the tumor | 0.401a | 0.459a | ||||
| Yes | 23 (31.5) | 15 (39.5) | 7 (31.8) | 3 (42.9) | ||
| No | 50 (68.5) | 23 (60.5) | 15 (68.2) | 4 (57.1) | ||
| Lymphovascular invasion | 0.205a | 0.758a | ||||
| Yes | 45 (61.6) | 28 (73.7) | 14 (63.6) | 4 (57.1) | ||
| No | 28 (38.4) | 10 (26.3) | 8 (36.4) | 3 (42.9) | ||
| Venous invasion | 0.015*a | 0.009*a | ||||
| Yes | 0 (0) | 3 (7.9) | 0 (0.0) | 2 (28.6) | ||
| No | 73 (100) | 35 (92.1) | 22 (100) | 5 (71.4) | ||
| Perineural invasion | 0.001*a | 0.003a | ||||
| Yes | 10 (13.7) | 16 (42.1) | 2 (9.1) | 5 (71.4) | ||
| No | 63 (86.3) | 22 (57.9) | 20 (90.9) | 2 (28.6) | ||
| Tumor deposits | 0.001*a | 0.184a | ||||
| Yes | 7 (9.6) | 13 (34.2) | 4 (18.2) | 3 (42.9) | ||
| No | 66 (90.4) | 25 (65.8) | 18 (81.8) | 4 (57.1) | ||
| Tumor budding | 0.037*a | 0.121a | ||||
| Yes | 55 (75.3) | 34 (91.9) | 16 (72.7) | 7 (100.0) | ||
| No | 18 (24.7) | 3 (8.1) | 6 (27.3) | 0 (0) | ||
| Tumor growth | 0.113a | 0.484a | ||||
| Expansive | 32 (44.4) | 11 (28.9) | 6 (27.3) | 1 (14.3) | ||
| Infiltrative | 40 (55.6) | 27 (71.1) | 16 (72.7) | 6 (85.7) | ||
| C–D classification | 0.003*a | 0.159a | ||||
| I | 38 (52.1) | 8 (21.1) | 13 (59.1)f | 2 (28.6)f | ||
| II | 30 (41.1) | 22 (57.9) | 9 (40.9)f | 5 (71.4)f | ||
| III, IV, V | 5 (6.8) | 8 (21.1) | ||||
| Adjuvant CT | 0.644a | 0.631a | ||||
| Yes | 20 (27.4) | 12 (31.6) | 9 (40.9) | 3 (42.9) | ||
| No | 53 (72.6) | 26 (68.4) | 13 (59.1) | 4 (57.1) | ||
| Neoadjuvant CRT | 0.619a | 0.455a | ||||
| Yes | 4 (5.5) | 3 (7.9) | 4 (18.2) | 2 (28.6) | ||
| No | 69 (94.5) | 35 (92.1) | 18 (81.8) | 5 (71.4) | ||
| Variable | Univariate analysis | Multivariate analysis | ||||
|---|---|---|---|---|---|---|
| HR | 95% CI | P | HR | 95% CI | P | |
| *P values indicate statistical significance (P < 0.05). aTNM stage adopted binary classification (I/II vs. III/IV). HR: hazard ratio; CI: confidence interval; LNR: lymph node ratio; PTL: peritumoral lymphocytic; C–D classification: Clavien–Dindo classification; CRP: C-reactive protein; CEA: carcinoembryonic antigen; PLR: platelet-to-lymphocyte ratio; LANR: lymphocyte–albumin–neutrophil ratio; PNI: prognostic nutritional index; CAR: C-reactive protein–to–albumin ratio; mGPS: modified Glasgow prognostic score. | ||||||
| Colorectal cancer | ||||||
| TNM stage (III/IV)a | 2.430 | 1.254–4.711 | 0.009* | — | — | |
| LNR | 16.706 | 4.890–57.074 | < 0.001* | 6.862 | 1.635–28.808 | 0.009* |
| PTL response | 0.531 | 0.317–0.890 | 0.016* | — | — | — |
| Perineural invasion (presence) | 2.988 | 1.563–5.709 | 0.001* | — | — | — |
| Tumor deposits (presence) | 3.254 | 1.652–6.409 | 0.001* | 3.089 | 1.447–6.593 | 0.004* |
| Tumor budding (presence) | 3.233 | 0.992–10.540 | 0.052* | — | — | — |
| C–D classification (gradus III, IV, V) | 2.528 | 1.574–4.061 | < 0.001* | 2.609 | 1.437–4.737 | 0.002* |
| Hemoglobin (g/dL) | 0.844 | 0.723–0.985 | 0.031* | — | — | — |
| Hematocrit (%) | 0.938 | 0.885–0.994 | 0.030* | — | — | — |
| CRP (mg/L) | 1.009 | 1.003–1.016 | 0.006* | — | — | — |
| Serum albumin (g/L) | 0.897 | 0.843–0.955 | 0.001* | — | — | — |
| CEA (ng/mL) | 1.010 | 1.000–1.019 | 0.041* | — | — | — |
| PLR | 1.002 | 1.00–1.005 | 0.045* | — | — | — |
| LANR | 0.946 | 0.898–0.996 | 0.035* | — | — | — |
| CAR | 1.335 | 1.102–1.617 | 0.003* | — | — | — |
| PNI | 0.924 | 0.877–0.974 | 0.003* | — | — | |
| mGPS 2 | 2.145 | 1.431–3.215 | < 0.001* | 2.188 | 1.413–3.387 | < 0.001* |
| Rectal cancer | ||||||
| Perineural invasion (presence) | 12.389 | 2.345–65.452 | 0.003* | 25.125 | 2.928–218.620 | 0.003* |
| PLR | 1.003 | 1.000–1.007 | 0.060 | 1.007 | 1.001–1.013 | 0.025* |
| Colorectal cancer relapse | Rectal cancer relapse | |||||
|---|---|---|---|---|---|---|
| No, n (%) | Yes, n (%) | P | No, n (%) | Yes, n (%) | P | |
| aP values were calculated by the Chi-square test. bP values were calculated by the Mann–Whitney test. cData are shown as median (25−75 percentiles). dPatients were categorized into two groups as mGPS 0 and mGPS 1-2. ePatients were categorized into two groups as without and easy to moderate/expressed PTL response. fPatients were categorized into two groups as C–D classification I and C–D II, III, IV, V. *P values indicate statistical significance (P < 0.05). TIL: tumor-infiltrating lymphocytes; PTL: peritumoral lymphocytic; C–D classification: Clavien–Dindo classification; CT: chemotherapy; CRT: chemoradiotherapy; ASA: American Society of Anesthesiology; RBC: red blood cell; RDW-CV: red cell distribution width–coefficient of variation; CRP: C-reactive protein; CEA: carcinoembryonic antigen; CA 19-9: carbohydrate antigen 19-9; NLR: neutrophil-to-lymphocyte ratio; MLR: monocyte-to-lymphocyte ratio; PLR: platelet-to-lymphocyte ratio; LANR: lymphocyte–albumin–neutrophil ratio; PNI: prognostic nutritional index; CAR: C-reactive protein–to–albumin ratio; mGPS: modified Glasgow prognostic score. | ||||||
| Sex | 0.892 | 0.758 | ||||
| Male | 41 (57.7) | 16 (59.3) | 14 (63.6) | 4 (57.1) | ||
| Female | 30 (42.3) | 11 (40.7) | 8 (36.4) | 3 (42.9) | ||
| ASA score | 0.032*a | 0.196 | ||||
| 1 | 9 (12.7) | 8 (29.6) | 6 (27.3) | 2 (28.6) | ||
| 2 | 31 (43.7) | 14 (51.9) | 9 (40.9) | 5 (71.4) | ||
| 3 | 31 (43.7) | 5 (18.5) | 7 (31.8) | 0 (0.0) | ||
| 4 | — | — | — | — | ||
| 5 | — | — | — | — | ||
| Diabetes mellitus | 21 (29.6) | 5 (18.5) | 0.268a | 5 (22.7) | 0 (0.0) | 0.166 |
| Arterial hypertension | 53 (74.6) | 17 (63.0) | 0.253a | 14 (63.6) | 5 (71.4) | 0.706 |
| Leukocytesc | 7 (5.88–8.1) | 7.7 (5.4–8.7) | 0.811 | 6.05 (5.10–6.90) | 5.40 (4.20–8.50) | 0.980 |
| Erythrocytesc | 4.48 (4.17–4.86) | 4.57 (4.14–5.14) | 0.375 | 4.56 (4.19–4.81) | 4.36 (3.93–4.80) | 0.400 |
| Plateletsc | 282 (228–375) | 285 (230–392) | 0.431 | 249 (198–350) | 374 (177–428) | 0.541 |
| Neutrophilsc | 4.68 (3.86–5.77) | 5.05 (3.08–6.58) | 0.880 | 4.03 (3.23–4.58) | 3.57 (2.19–7.20) | 0.878 |
| Lymphocytesc | 1.51 (1.25–1.94) | 1.56 (1–2) | 0.990 | 1.47 (0.90–1.78) | 1.25 (0.92–1.78) | 0.899 |
| Monocytesc | 0.36 (0.29–0.44) | 0.32 (0.25–0.39) | 0.183 | 0.33 (0.29–0.44) | 0.29 (0.19–0.41) | 0.146 |
| NLRc | 2.9 (2.25–4.52) | 2.9 (1.83–4.51) | 0.833a | 2.93 (1.82–4.44) | 2.34 (1.70–8.57) | 0.799a |
| MLRc | 0.22 (0.18–0.32) | 0.22 (0.17–0.27) | 0.278a | 0.22 (0.16–0.39) | 0.22 (0.19–0.27) | 0.646a |
| PLRc | 187.5 (140.3–245.03) | 193.88 (138.97–322.45) | 0.559a | 164.7 (140.3–259.3) | 183.8 (141.6–465.2) | 0.575a |
| CRPc | 0.03 (0.03–0.43) | 0.03 (0.02–0.043) | 0.933a | 3.3 (1.3–4.1) | 3.5 (1.3–34.9) | 0.371 |
| Serum albuminc | 40 (36–42) | 41 (35–42) | 1.000 | 40 (37–43) | 41 (35–42) | 0.626 |
| Hemoglobinc | 12 (10–13.6) | 12.3 (10.4–13.7) | 0.535 | 12.9 (11.7–14.2) | 12.3 (10.4–14.1) | 0.320 |
| Hematocritc | 37.7 (33.6–41.7) | 38.7 (32.6–42.9) | 0.580 | 38.6 (37.4–43.0) | 36.1 (32.4–42.3) | 0.386 |
| RBC (RDW-CV)c | 14.7 (13.3–17.4) | 14.4 (13.2–16.7) | 0.404 | 14.1 (13.1–16.3) | 14.6 (13.4–16.7) | 0.429 |
| CARc | 0.09 (0.05–0.32) | 0.16 (0.04–0.38) | 0.611a | 0.079 (0.036–0.11) | 0.097 (0.031–0.85) | 0.333a |
| PNIc | 46.7 (43.3–51.15) | 47 (43.1–50.85) | 0.849a | 45.53 (42.5–51.45) | 45.9 (41.25–50.85) | 0.919a |
| LANRc | 13.27 (8.69–16.89) | 12.43 (7.72–19) | 0.852a | 13.0 (8.86–22.43) | 17.62 (4.78–18.0) | 0.919a |
| CEAc | 2.76 (1.88–6.31) | 3.59 (1.94–12.74) | 0.361 | 3.37 (2.30–6.31) | 6.11 (2.10–20.05) | 0.491 |
| CA 19−9c | 10.92 (6.28–20.84) | 12.01 (6.22–41.8) | 0.324 | 9.21 (6.52–31.10) | 14.07 (4.98–37.16) | 0.507 |
| mGPS | 0.700b | 0.184b | ||||
| 0 | 46 (64.8) | 15 (55.6) | 18 (81.8)d | 4 (57.1)d | ||
| 1 | 19 (26.8) | 9 (33.3) | 4 (18.2)d | 3 (42.9)d | ||
| 2 | 6 (8.5) | 3 (11.1) | ||||
| TNM stage | 0.452 | |||||
| I/II | 50 (70.4) | 8 (29.6) | < 0.001* | 13 (59.1) | 3 (42.9) | |
| III/IV | 21 (29.6) | 19 (70.4) | 9 (40.9) | 4 (57.1) | ||
| Tumor grade | 0.193 | 0.631 | ||||
| G1 | 10 (14.1) | 5 (18.5) | 1 (4.5) | 2 (28.6) | ||
| G2 | 59 (83.1) | 19 (70.4) | 20 (90.9) | 5 (71.4) | ||
| G3 | 2 (2.8) | 3 (11.1) | 1 (4.5) | 0 (0.0) | ||
| Lymph nodesc | 0.009* | 0.374 | ||||
| N0 | 49 (69) | 10 (37.0) | 13 (59.1) | 3 (42.9) | ||
| N1 | 16 (22.5) | 10 (37.0) | 9 (40.9) | 4 (57.1) | ||
| N2 | 6 (8.5) | 7 (25.8) | ||||
| Tumor configuration | 0.731 | 0.366 | ||||
| Exophytic | 29 (40.8) | 10 (37.0) | 7 (31.8) | 1 (14.3) | ||
| Endophytic | 42 (59.2) | 17 (63.0) | 15 (68.2) | 6 (85.7) | ||
| TIL | 0.520 | 0.631 | ||||
| Without/easy to moderate | 52 (73.2) | 18 (66.7) | 17 (77.3) | 6 (85.7) | ||
| Expressed | 19 (26.8) | 9 (33.3) | 5 (22.7) | 1 (14.3) | ||
| PTL response | 0.029* | 0.974 | ||||
| Without | 11 (15.5) | 9 (33.3) | 6 (27.3)e | 2 (28.6)e | ||
| Easy to moderate | 44 (62.0) | 17 (63.0) | 16 (72.7)e | 5 (71.4)e | ||
| Expressed | 16 (22.5) | 1 (3.7) | ||||
| Mucosal component of the tumor | 0.292a | 0.706 | ||||
| Yes | 21 (29.6) | 11 (40.7) | 8 (36.4) | 2 (28.6) | ||
| No | 50 (70.4) | 16 (59.3) | 14 (63.6) | 5 (71.4) | ||
| Lymphovascular invasion | 0.038*a | 0.758 | ||||
| Yes | 39 (54.9) | 21 (77.8) | 14 (63.6) | 4 (57.1) | ||
| No | 32 (45.1) | 6 (22.2) | 8 (36.4) | 3 (42.9) | ||
| Venous invasion | 0.020*a | |||||
| Yes | 0 (0) | 2 (7.4) | 1 (4.5) | 1 (14.3) | 0.376 | |
| No | 71 (100.0) | 25 (92.6) | 21 (95.5) | 6 (85.7) | ||
| Perineural invasion | 0.018*a | 0.184 | ||||
| Yes | 9 (12.7) | 9 (33.3) | 4 (18.2) | 3 (42.9) | ||
| No | 62 (87.3) | 18 (66.7) | 18 (81.8) | 4 (57.1) | ||
| Tumor deposits | 0.001*a | 0.753 | ||||
| Yes | 5 (7.0) | 9 (33.3) | 5 (22.7) | 2 (28.6) | ||
| No | 66 (93) | 18 (66.7) | 17 (77.3) | 5 (71.4) | ||
| Tumor budding | 0.838a | 0.121 | ||||
| Yes | 56 (78.9) | 21 (80.8) | 16 (72.7) | 7 (100) | ||
| No | 15 (21.1) | 5 (19.2) | 6 (27.3) | 0 (0) | ||
| Tumor growth | 0.752 | 0.484 | ||||
| Expansive | 31 (44.3) | 11 (40.7) | 6 (27.3) | 1 (14.3) | ||
| Infiltrative | 39 (55.7) | 16 (59.3) | 16 (72.7) | 6 (85.7) | ||
| C–D classification | 0.598 | 0.590 | ||||
| I | 32 (45.1) | 11 (40.7) | 12 (54.5)f | 3 (42.9)f | ||
| II | 33 (46.5) | 15 (55.6) | 10 (45.5)f | 4 (57.1)f | ||
| III, IV, V | 6 (8.5) | 1 (3.7) | ||||
| Adjuvant CT | < 0.001* | 0.331 | ||||
| Yes | 13 (18.3) | 15 (55.6) | 8 (36.4) | 4 (57.1) | ||
| No | 58 (81.7) | 12 (44.4) | 14 (63.6) | 3 (42.9) | ||
| Neoadjuvant CRT | 0.744 | 0.631 | ||||
| Yes | 4 (5.6) | 2 (7.4) | 5 (22.7) | 1 (14.3) | ||
| No | 67 (94.4) | 25 (96.2) | 17 (77.3) | 6 (85.7) | ||
| Variable | Univariate analysis | Multivariate analysis | ||||
|---|---|---|---|---|---|---|
| HR | 95% CI | P | HR | 95% CI | P | |
| *P values indicate statistical significance (P < 0.05). HR: hazard ratio; CI: confidence interval; PTL: peritumoral lymphocytic. | ||||||
| Colorectal cancer | ||||||
| TNM stage (III/IV) | 2.486 | 1.390–4.445 | 0.002* | 1.888 | 1.024–3.481 | 0.042* |
| PTL response (presence) | 0.465 | 0.252–0.858 | 0.014* | 0.391 | 0.196–0.780 | 0.005* |
| Perineural invasion (presence) | 2.374 | 1.064–5.299 | 0.035* | — | — | — |
| Tumor deposits (presence) | 4.194 | 1.869–9.411 | 0.001* | 3.049 | 1.206–7.706 | 0.018* |
| Rectal cancer | — | — | ||||