Figures
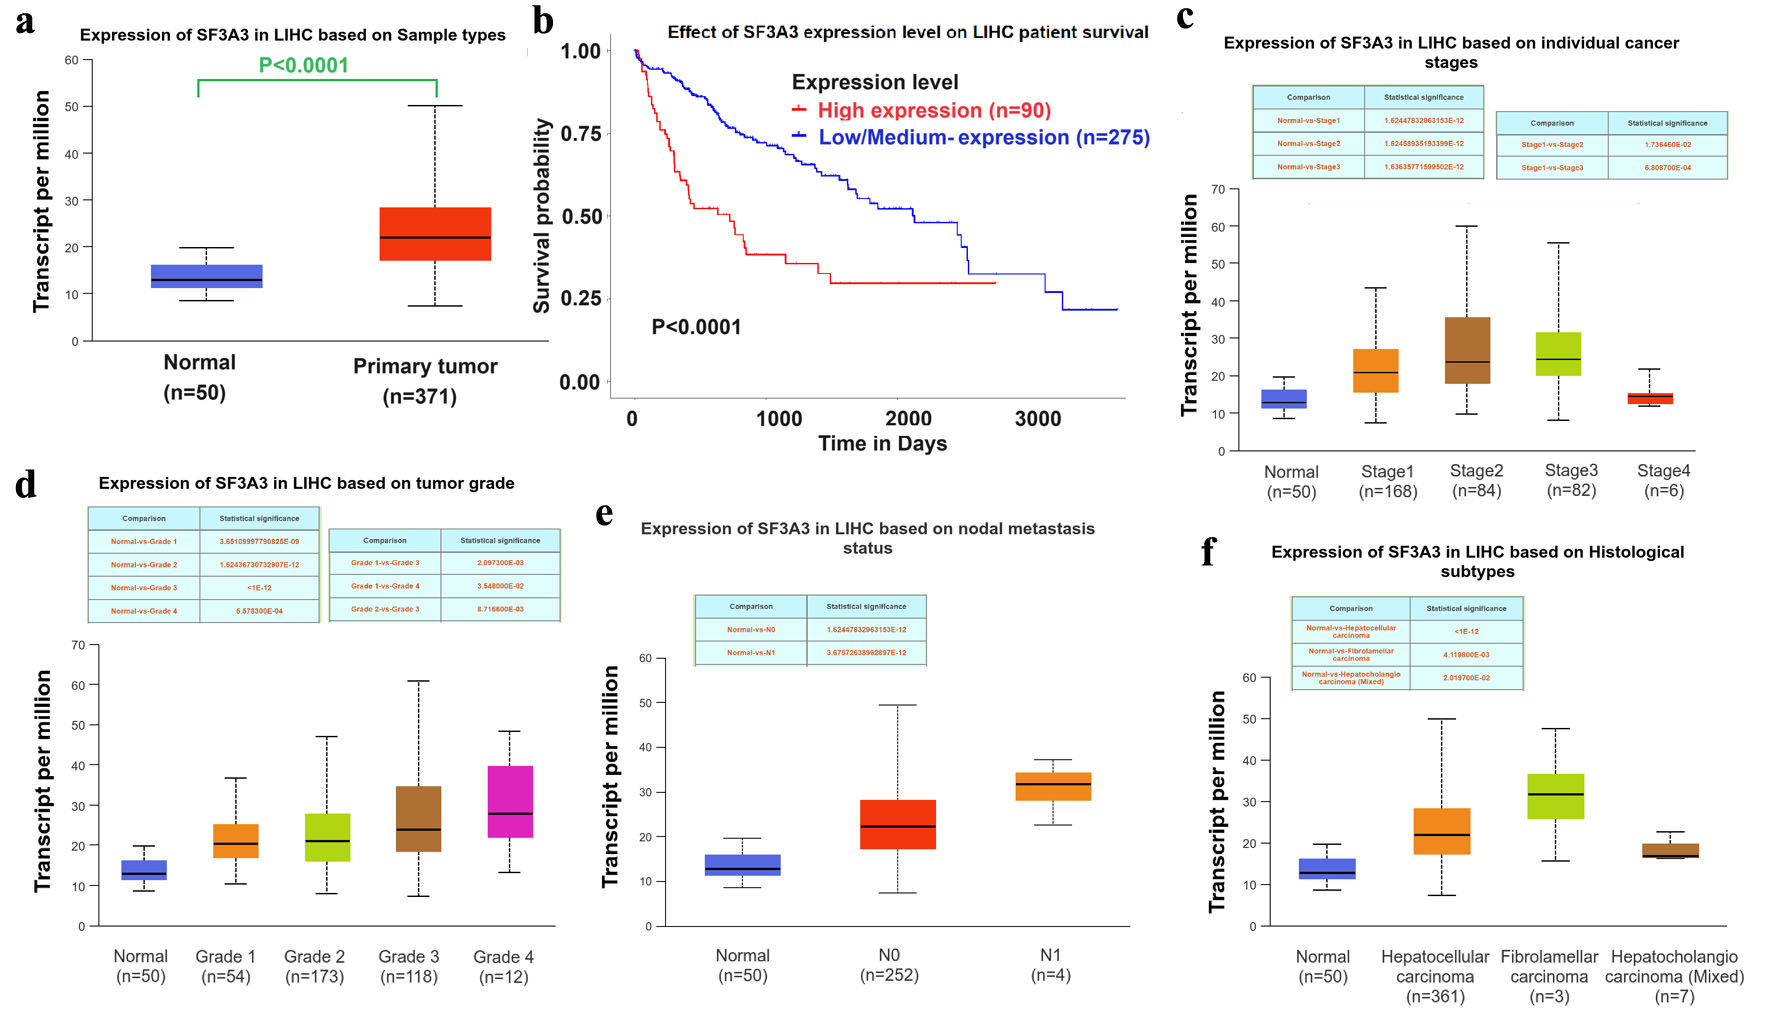
↓ Figure 1. SF3A3 expression and clinical significance in hepatocellular carcinoma (HCC). (a) Expression of SF3A3 in primary LIHC tissues versus normal liver tissues (TCGA cohort). (b) Kaplan–Meier survival curves of LIHC patients stratified by SF3A3 expression. SF3A3 expression levels stratified by (c) cancer stage, (d) tumor grade, (e) nodal metastasis status, and (f) histological subtypes. Data are presented as mean ± SEM.
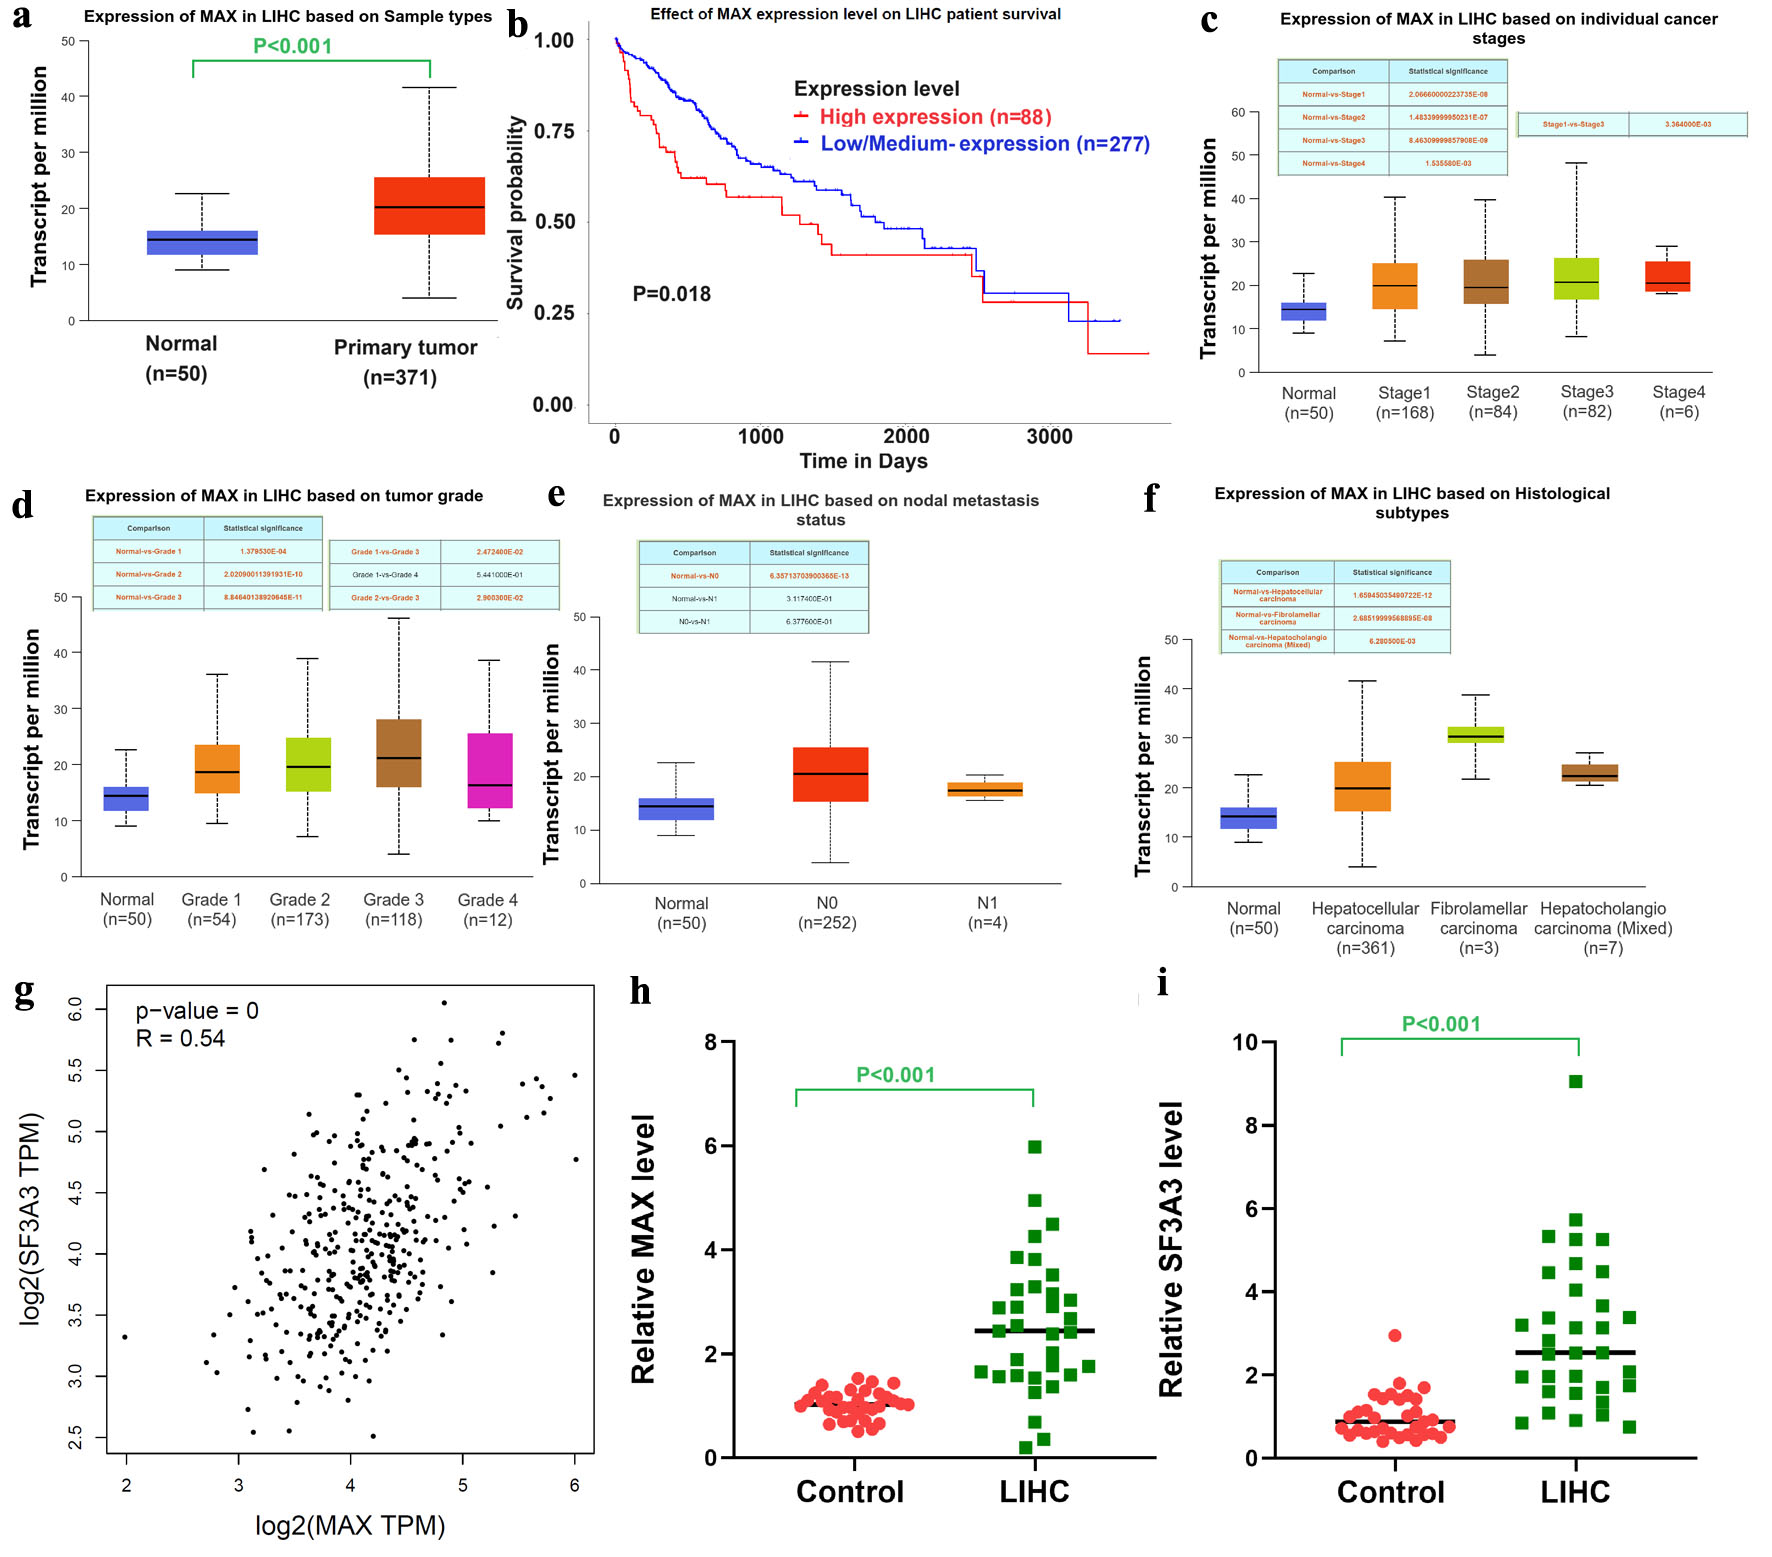
↓ Figure 2. MAX expression and its correlation with SF3A3 in HCC. (a) Expression of MAX in primary LIHC tissues versus normal liver tissues (TCGA cohort). (b) Kaplan–Meier survival curves of LIHC patients stratified by MAX expression. MAX expression levels stratified by (c) cancer stage, (d) tumor grade, (e) nodal metastasis status, and (f) histological subtypes. (g) Correlation between MAX and SF3A3 expression in the TCGA-LIHC dataset. qRT-PCR analysis of MAX (h) and SF3A3 (i) mRNA levels in 33 paired HCC and adjacent normal liver tissues. Data are analyzed using a paired t-test and presented as mean ± SEM.
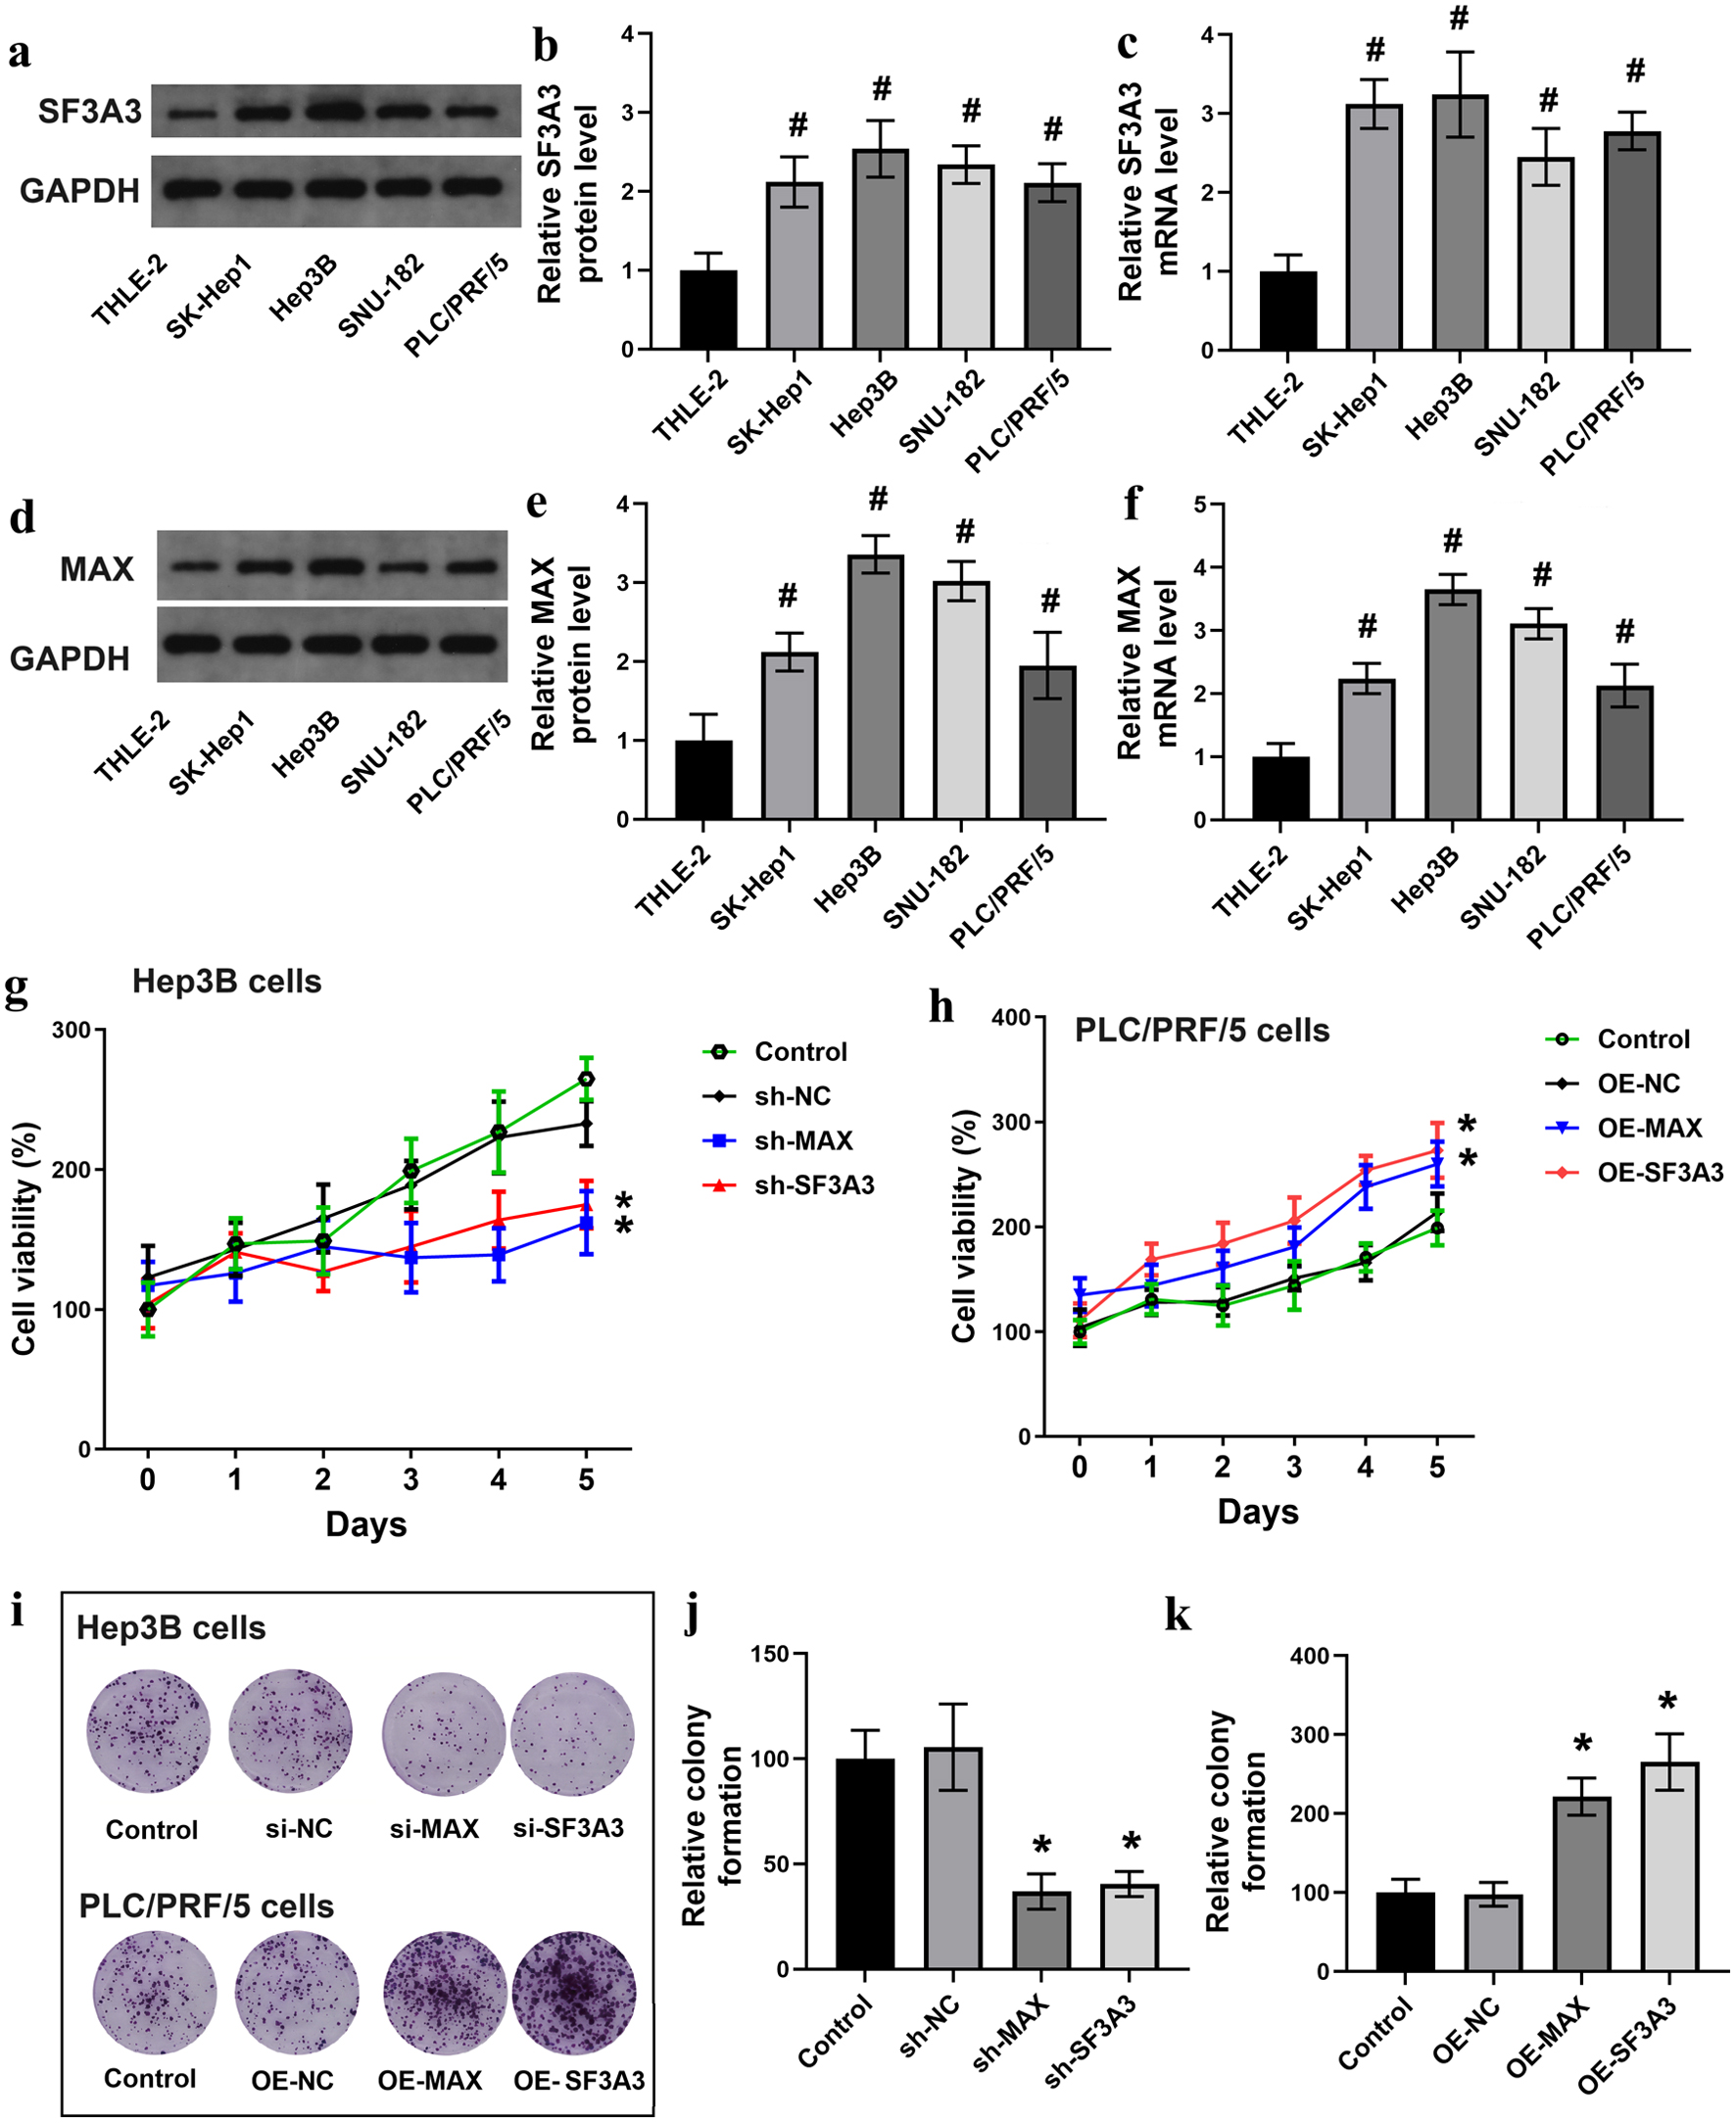
↓ Figure 3. MAX and SF3A3 promote HCC cell proliferation in vitro. Baseline mRNA and protein expression of SF3A3 (a–c) and MAX (d–f) in the normal human liver cell line (THLE-2) and four HCC cell lines. CCK-8 assays evaluating cell proliferation over 5 days in Hep3B cells with MAX/SF3A3 knockdown (g) and PLC/PRF/5 cells with MAX/SF3A3 overexpression (h). (i)–(k) Colony formation assays for the indicated cell groups. Data are presented as mean ± SEM (n = 3). #P < 0.05 compared to THLE-2 cells; *P < 0.05 compared to the respective control group.
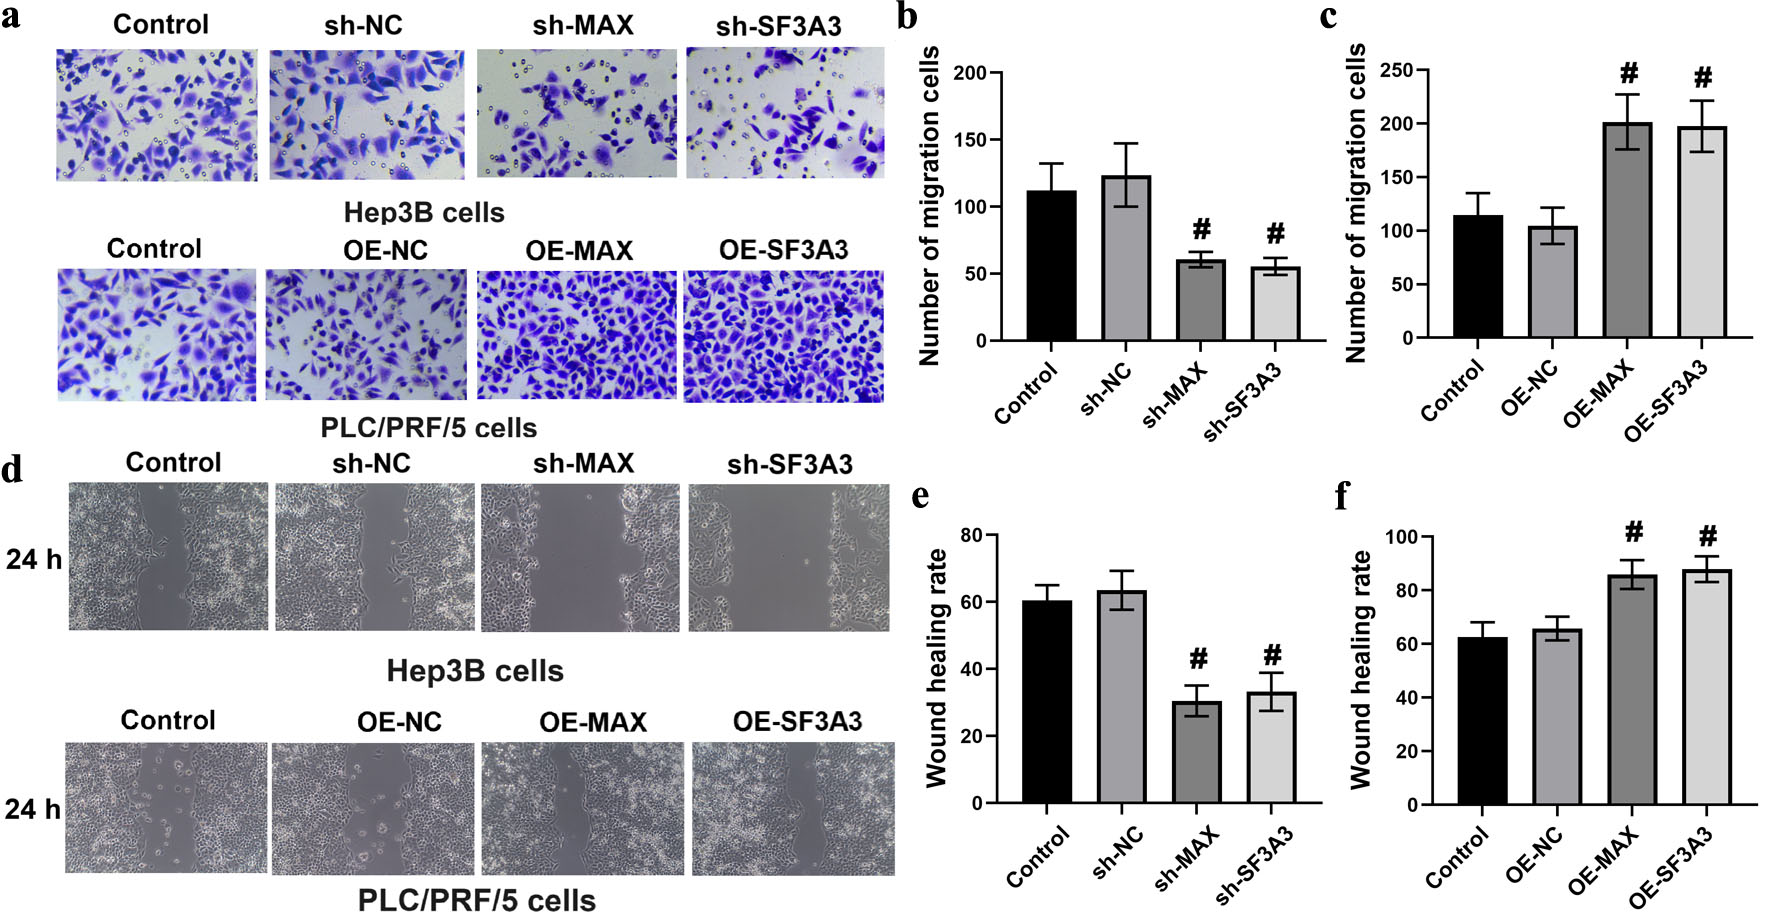
↓ Figure 4. MAX and SF3A3 regulate HCC cell migration. (a)–(c) Transwell migration assays of Hep3B cells (knockdown) and PLC/PRF/5 cells (overexpression). (d)–(f) Wound healing assays evaluating the migration rate of the indicated cell groups at 0 and 24 h. Data are presented as mean ± SEM (n = 3). #P < 0.01 compared to the respective control group.
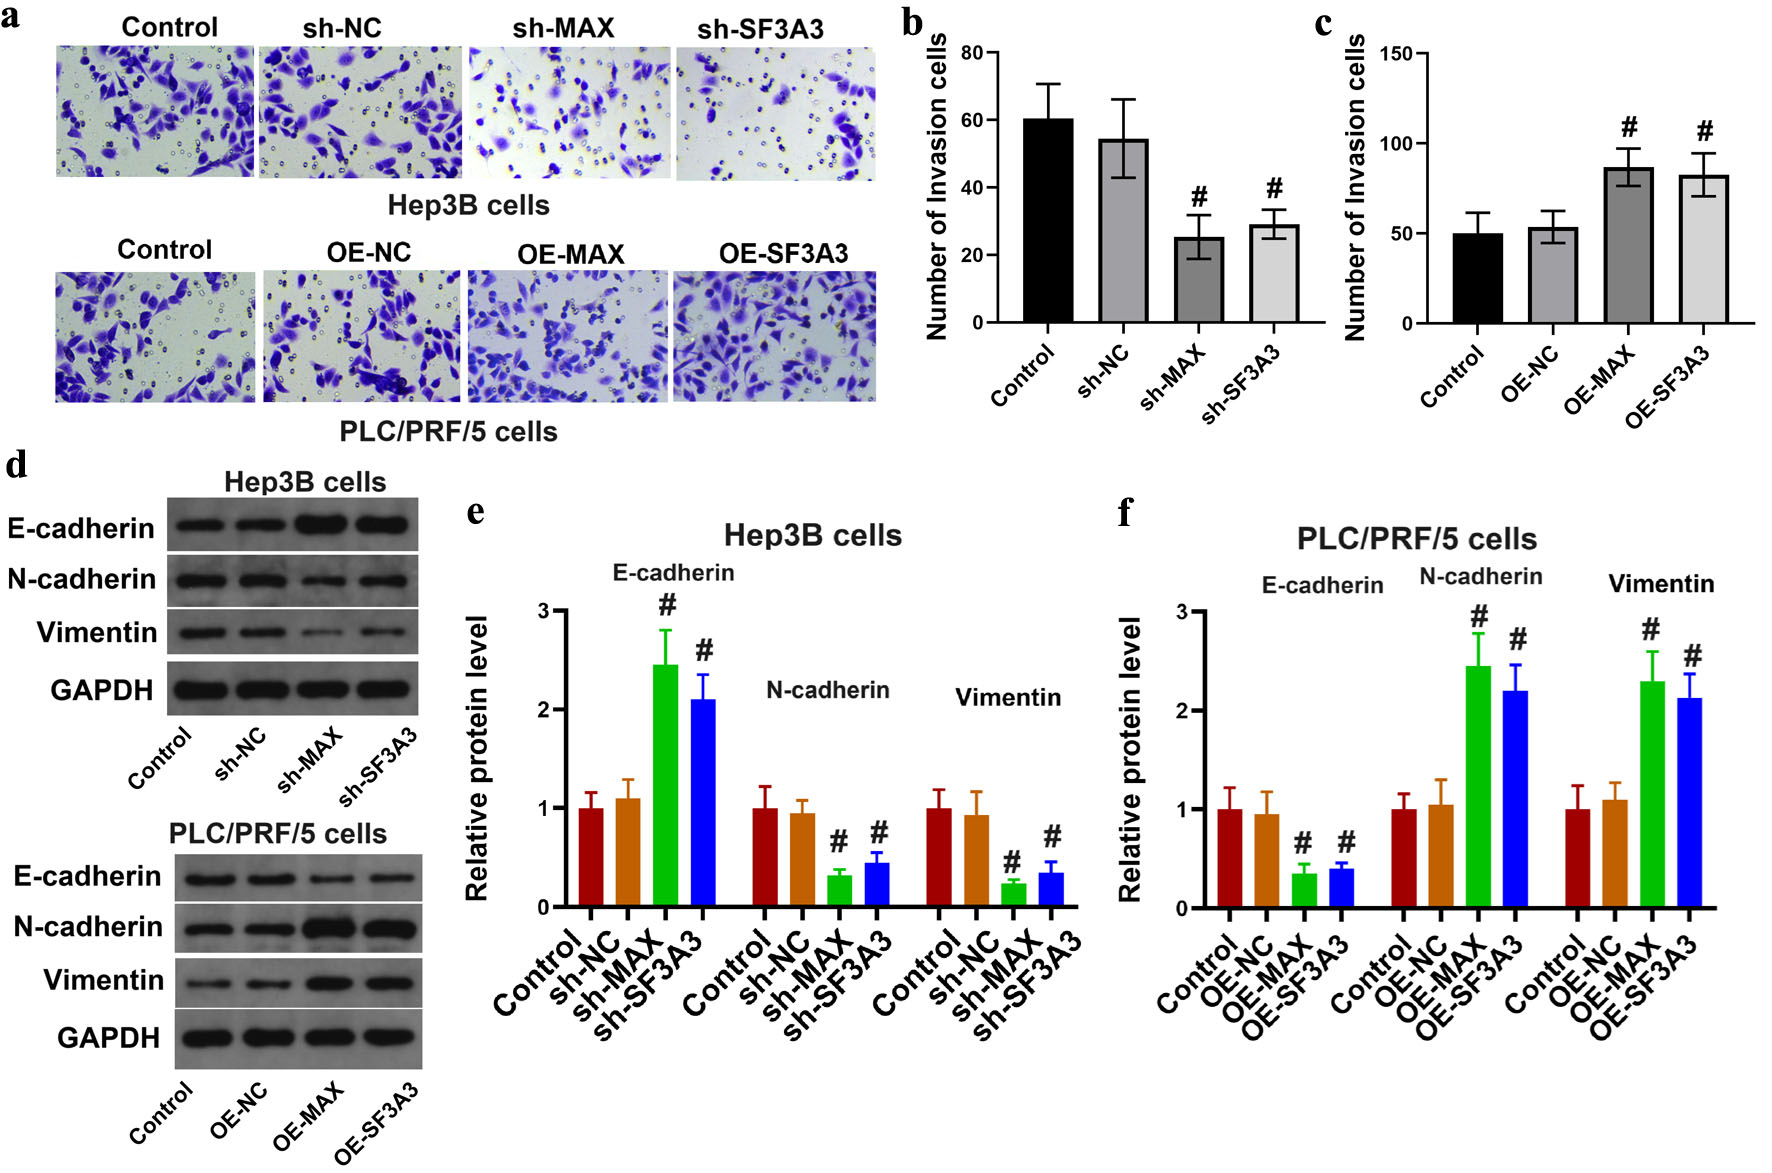
↓ Figure 5. MAX and SF3A3 regulated liver cancer cell invasion and EMT. (a)–(c) Matrigel Transwell invasion assays of Hep3B cells (knockdown) and PLC/PRF/5 cells (overexpression). (d)–(f) Western blot analysis of EMT-related proteins (E-cadherin, N-cadherin, and vimentin) in the indicated cell groups. GAPDH was used as the loading control. Data are presented as mean ± SEM (n = 3). #P < 0.05 compared to the respective control group.
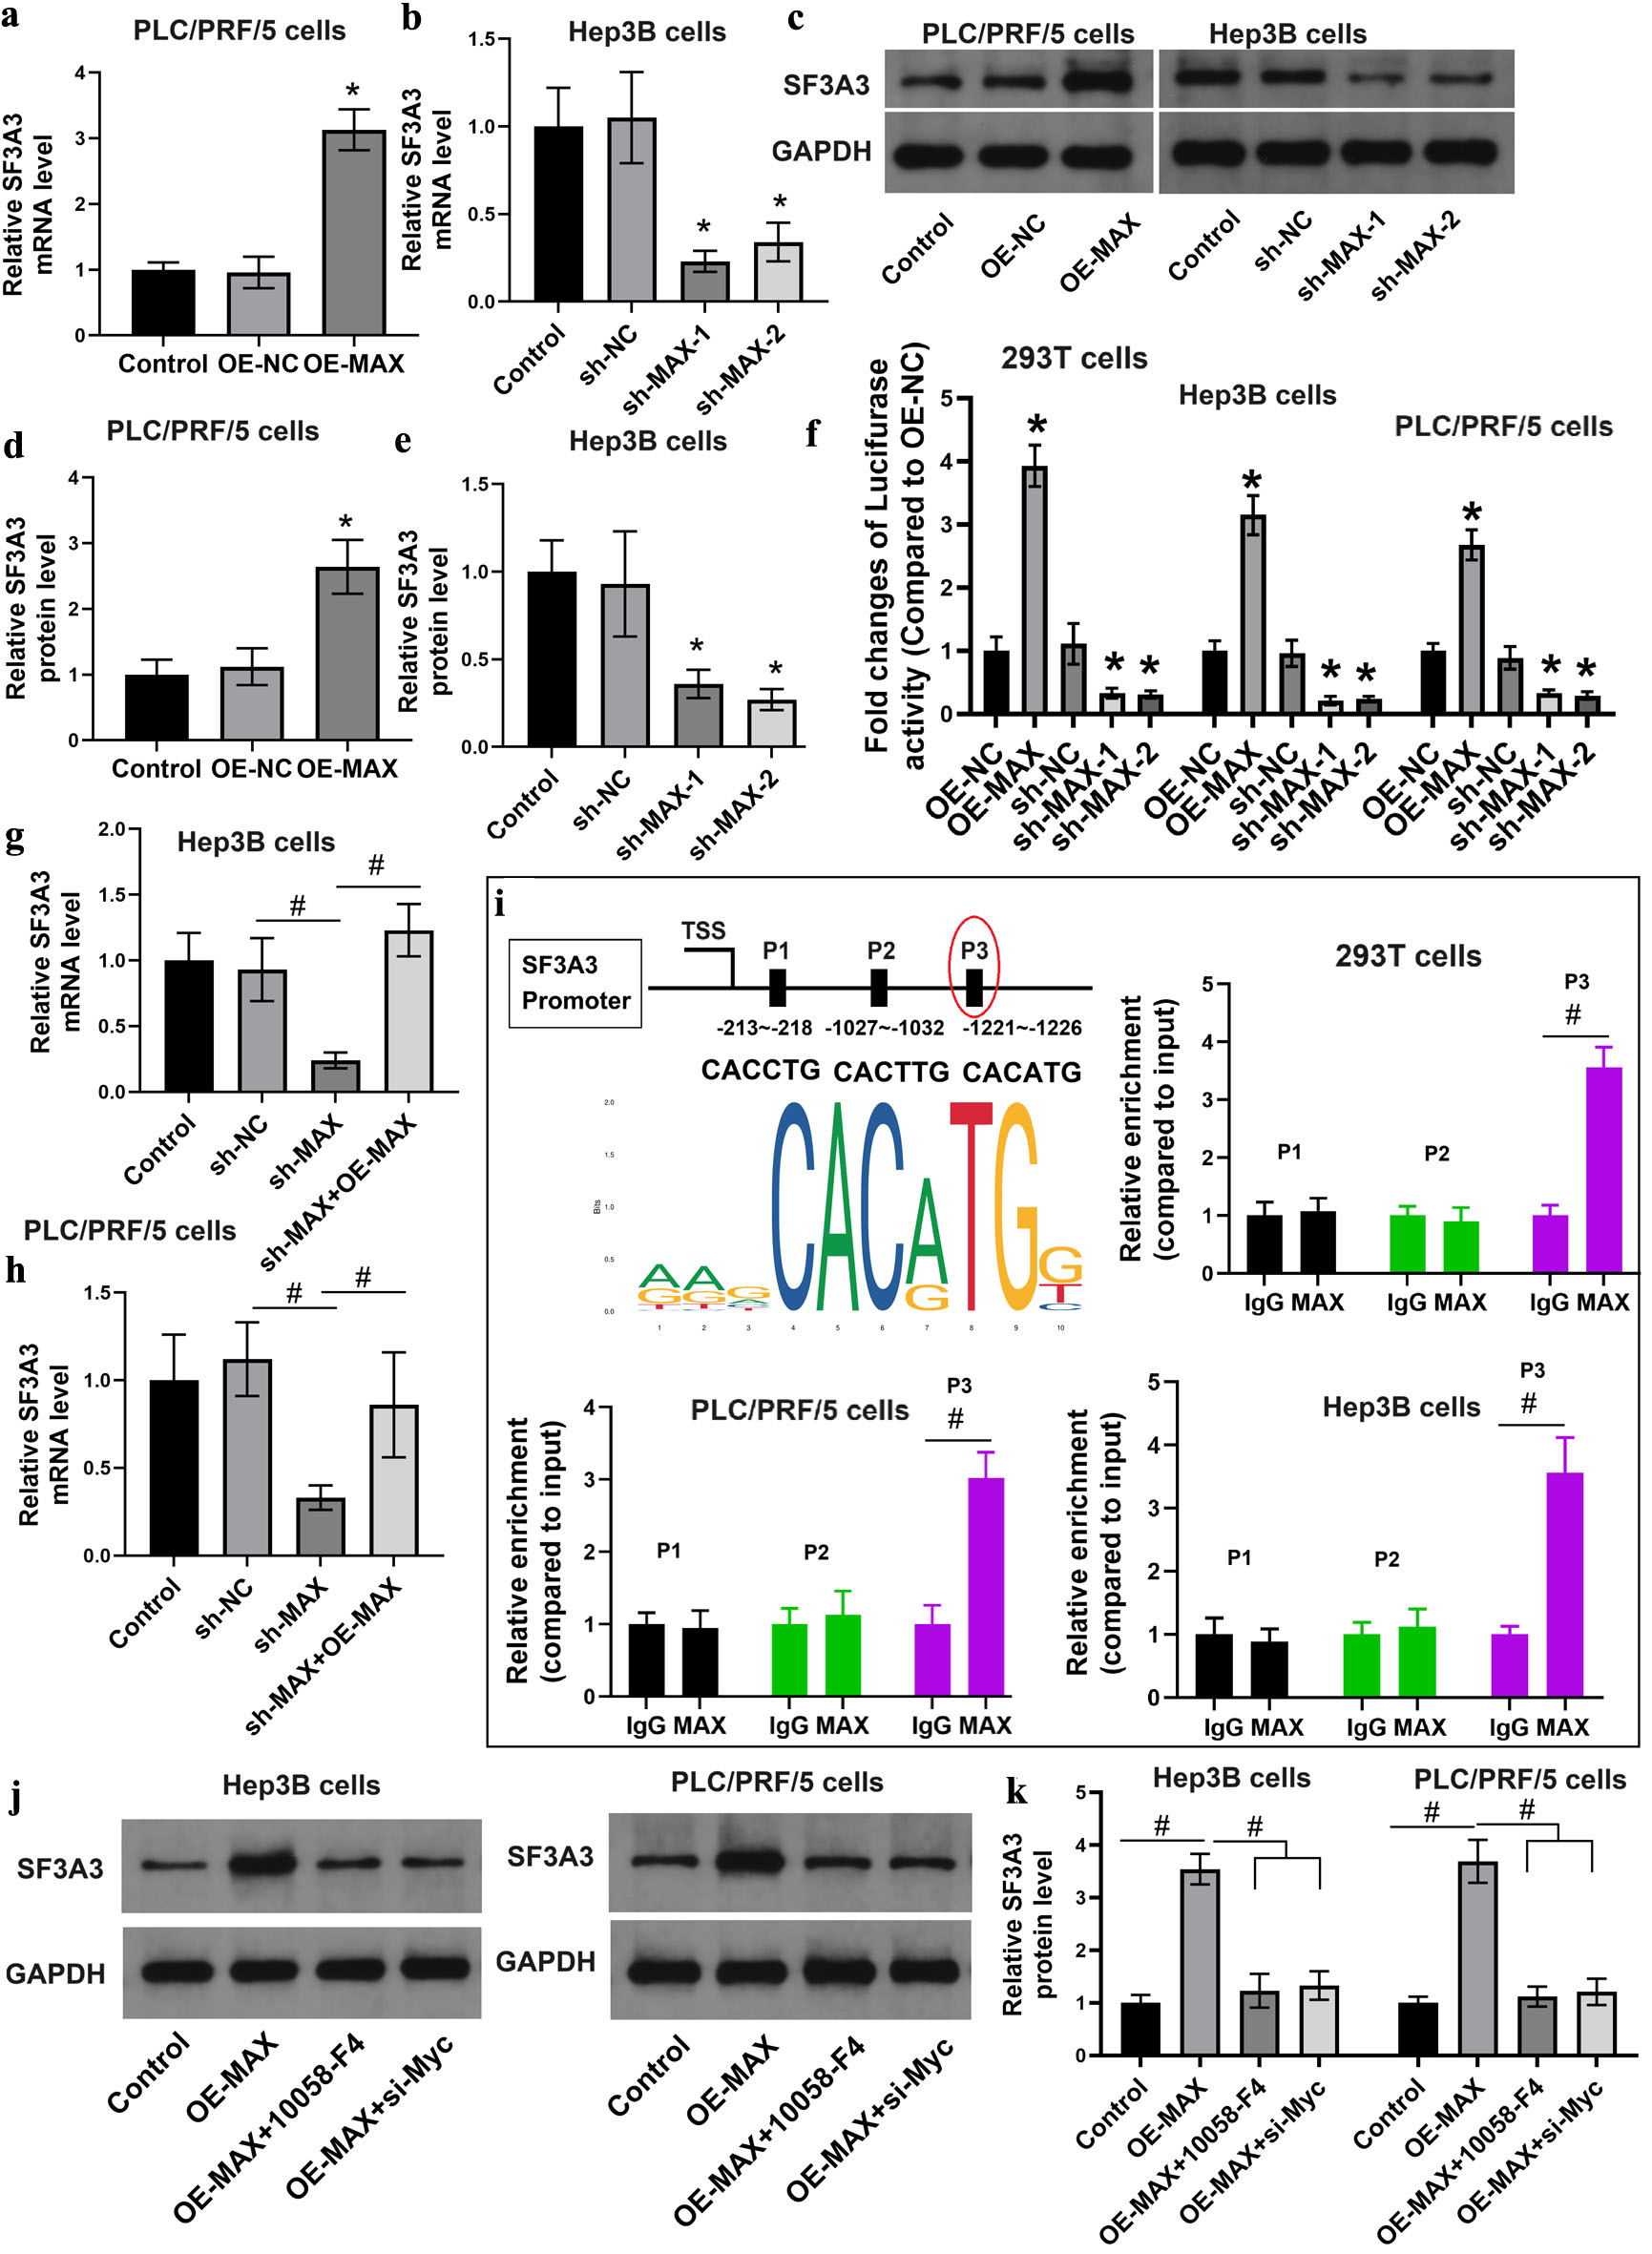
↓ Figure 6. The transcriptional factor MAX enhanced the expression of SF3A3. (a)–(e) qRT-PCR and Western blot analyses of SF3A3 expression following MAX knockdown in Hep3B cells or overexpression in PLC/PRF/5 cells (*P < 0.05 compared to OE-NC or sh-NC). (f) Relative luciferase reporter activity of the SF3A3 promoter in 293T and Hep3B cells following MAX overexpression or knockdown (*P < 0.05 compared to OE-NC or sh-NC). (g) and (h) qRT-PCR evaluation of SF3A3 mRNA rescue by exogenous MAX-expression plasmid in sh-MAX-treated cells (#P < 0.05 between indicated groups). (i) ChIP-qPCR analysis of MAX binding enrichment at predicted E-box sites (P1–P3) within the SF3A3 promoter (#P < 0.05 between indicated groups). Western blot analysis (j) and quantification (k) of SF3A3 protein levels following co-treatment with OE-MAX and MYC inhibitor (10058-F4) or si-MYC. Data are mean ± SEM (n = 3) (#P < 0.05 between indicated groups). Data are presented as mean ± SEM, n = 3 independent experiments.
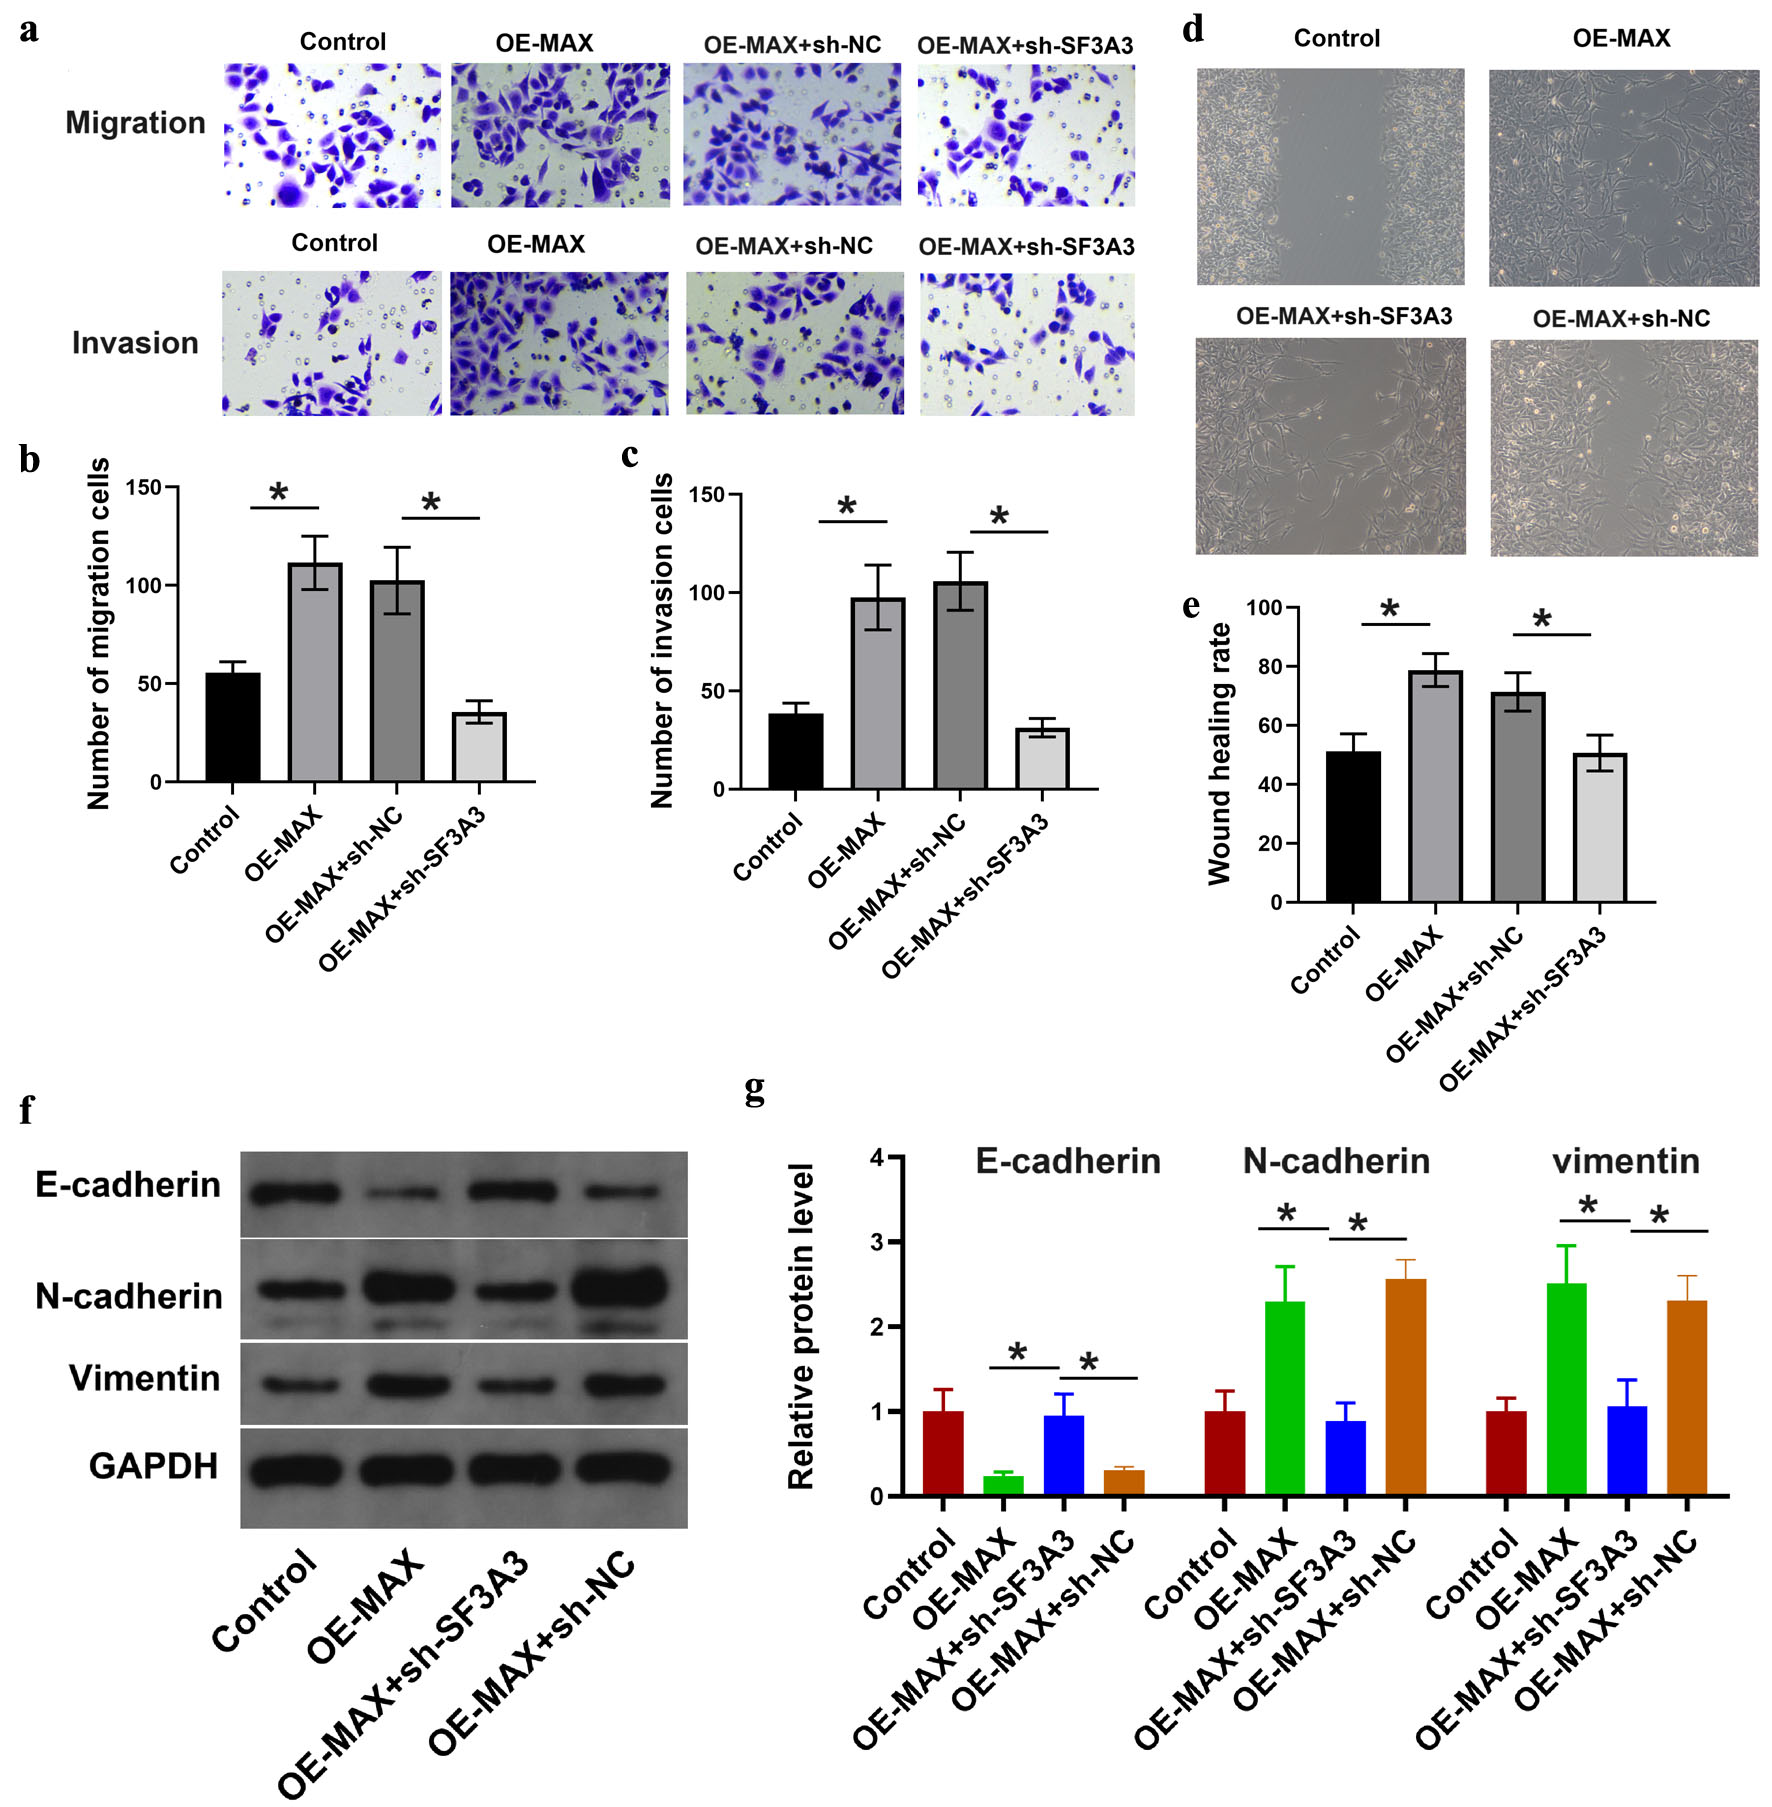
↓ Figure 7. SF3A3 knockdown counteracted the effects of overexpressed MAX on liver cancer cell migration, invasion, and EMT. Functional assays evaluating cell migration (a, c), invasion (a, b), and wound healing (d, e) in PLC/PRF/5 cells co-transfected with MAX overexpression plasmid and sh-SF3A3. Data are presented as mean ± SEM, n = 3 independent experiments; *P < 0.05 between indicated groups. (f) and (g) Western blot analysis of EMT-related markers in the indicated co-transfected PLC/PRF/5 cells. Data are presented as mean ± SEM (n = 3). *P < 0.05 between indicated groups.
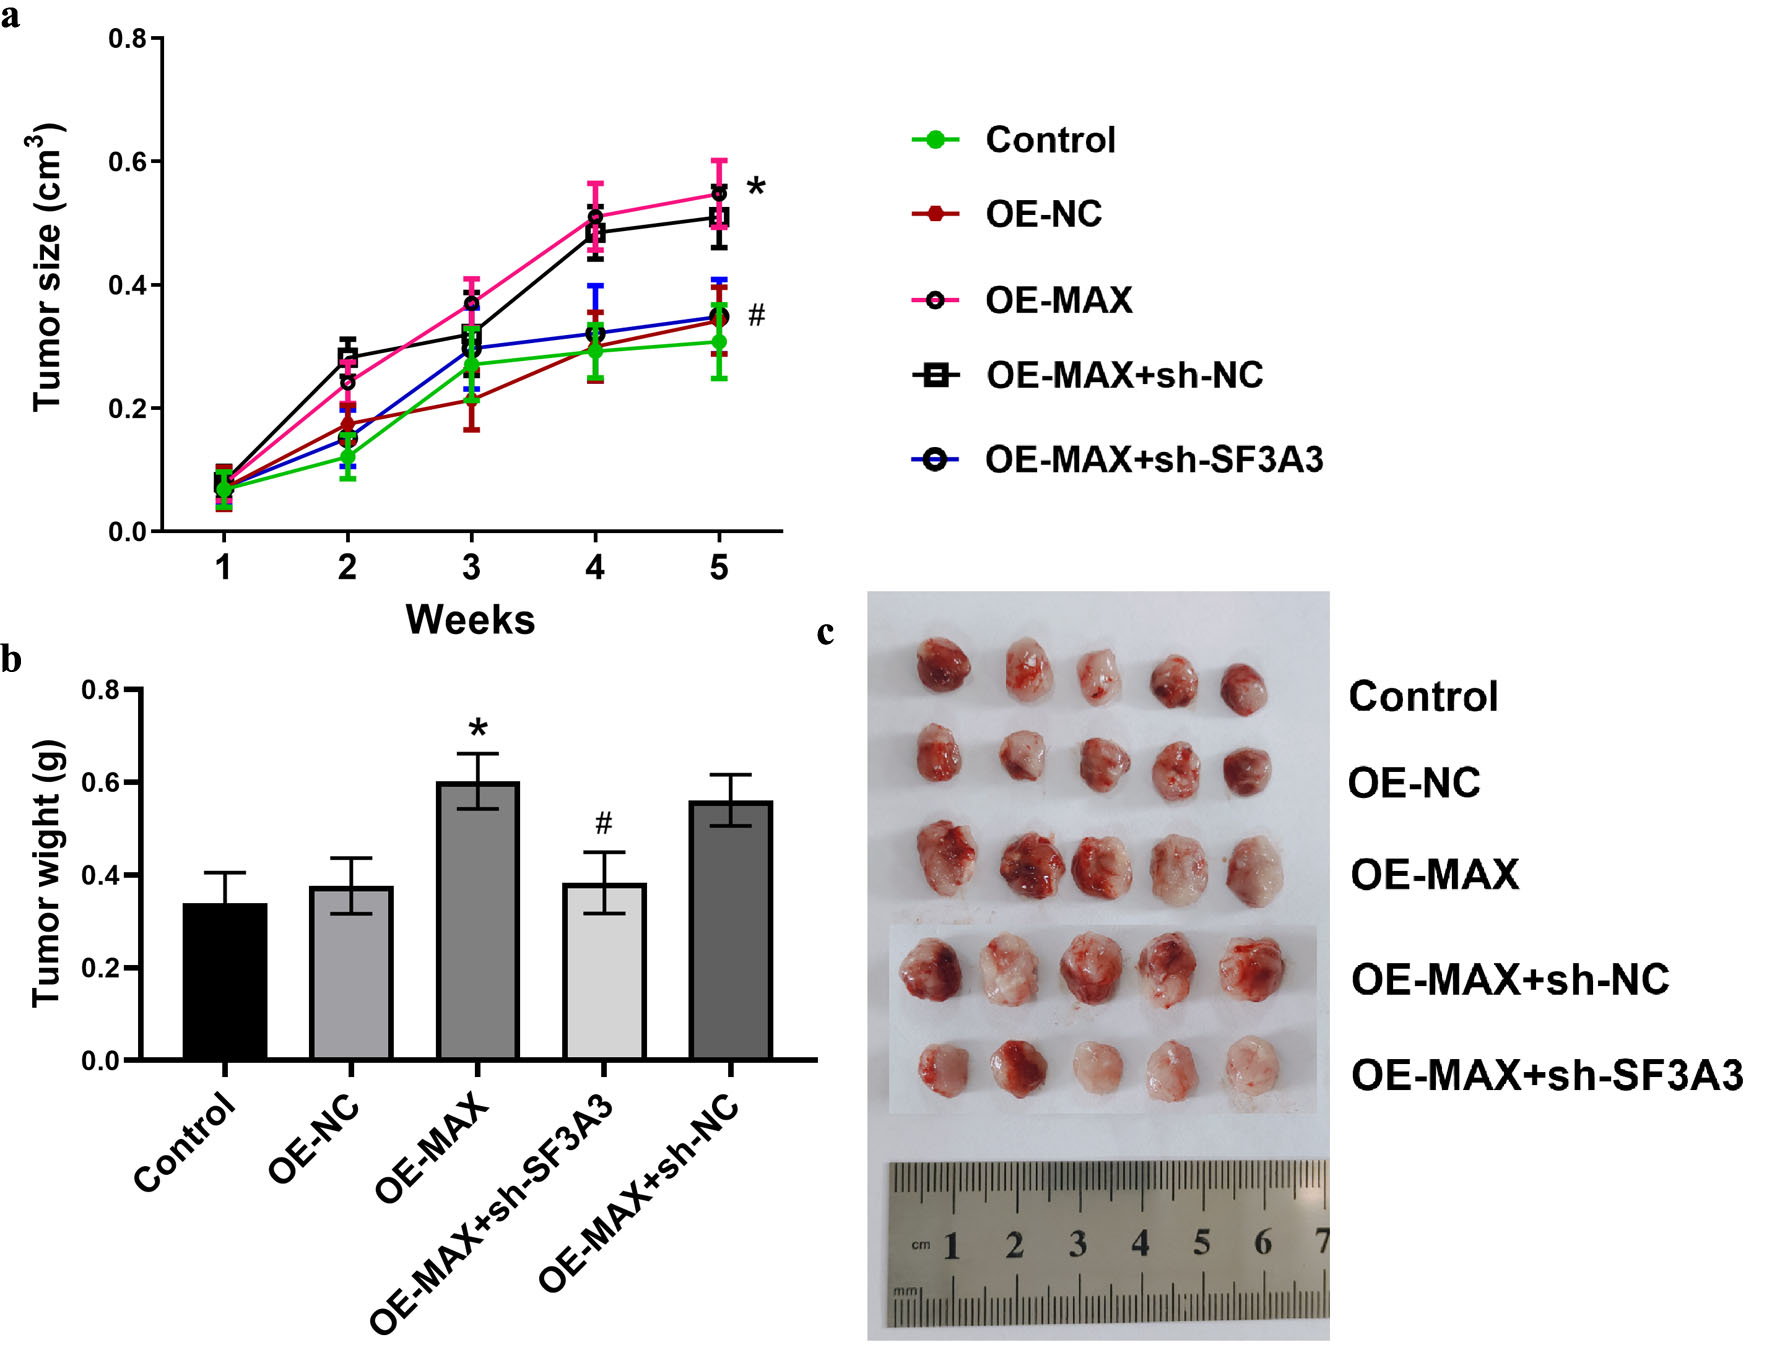
↓ Figure 8. SF3A3 knockdown attenuates MAX-induced tumor growth in vivo. (a) Tumor growth curves of subcutaneous xenografts in nude mice injected with the indicated PLC/PRF/5 cell lines over 5 weeks. (b) Representative images of the excised tumors at the experimental endpoint. (c) Final tumor weights. Data are presented as mean ± SEM (n = 5). *P < 0.05 vs. Control group; #P < 0.05 vs. OE-MAX group.