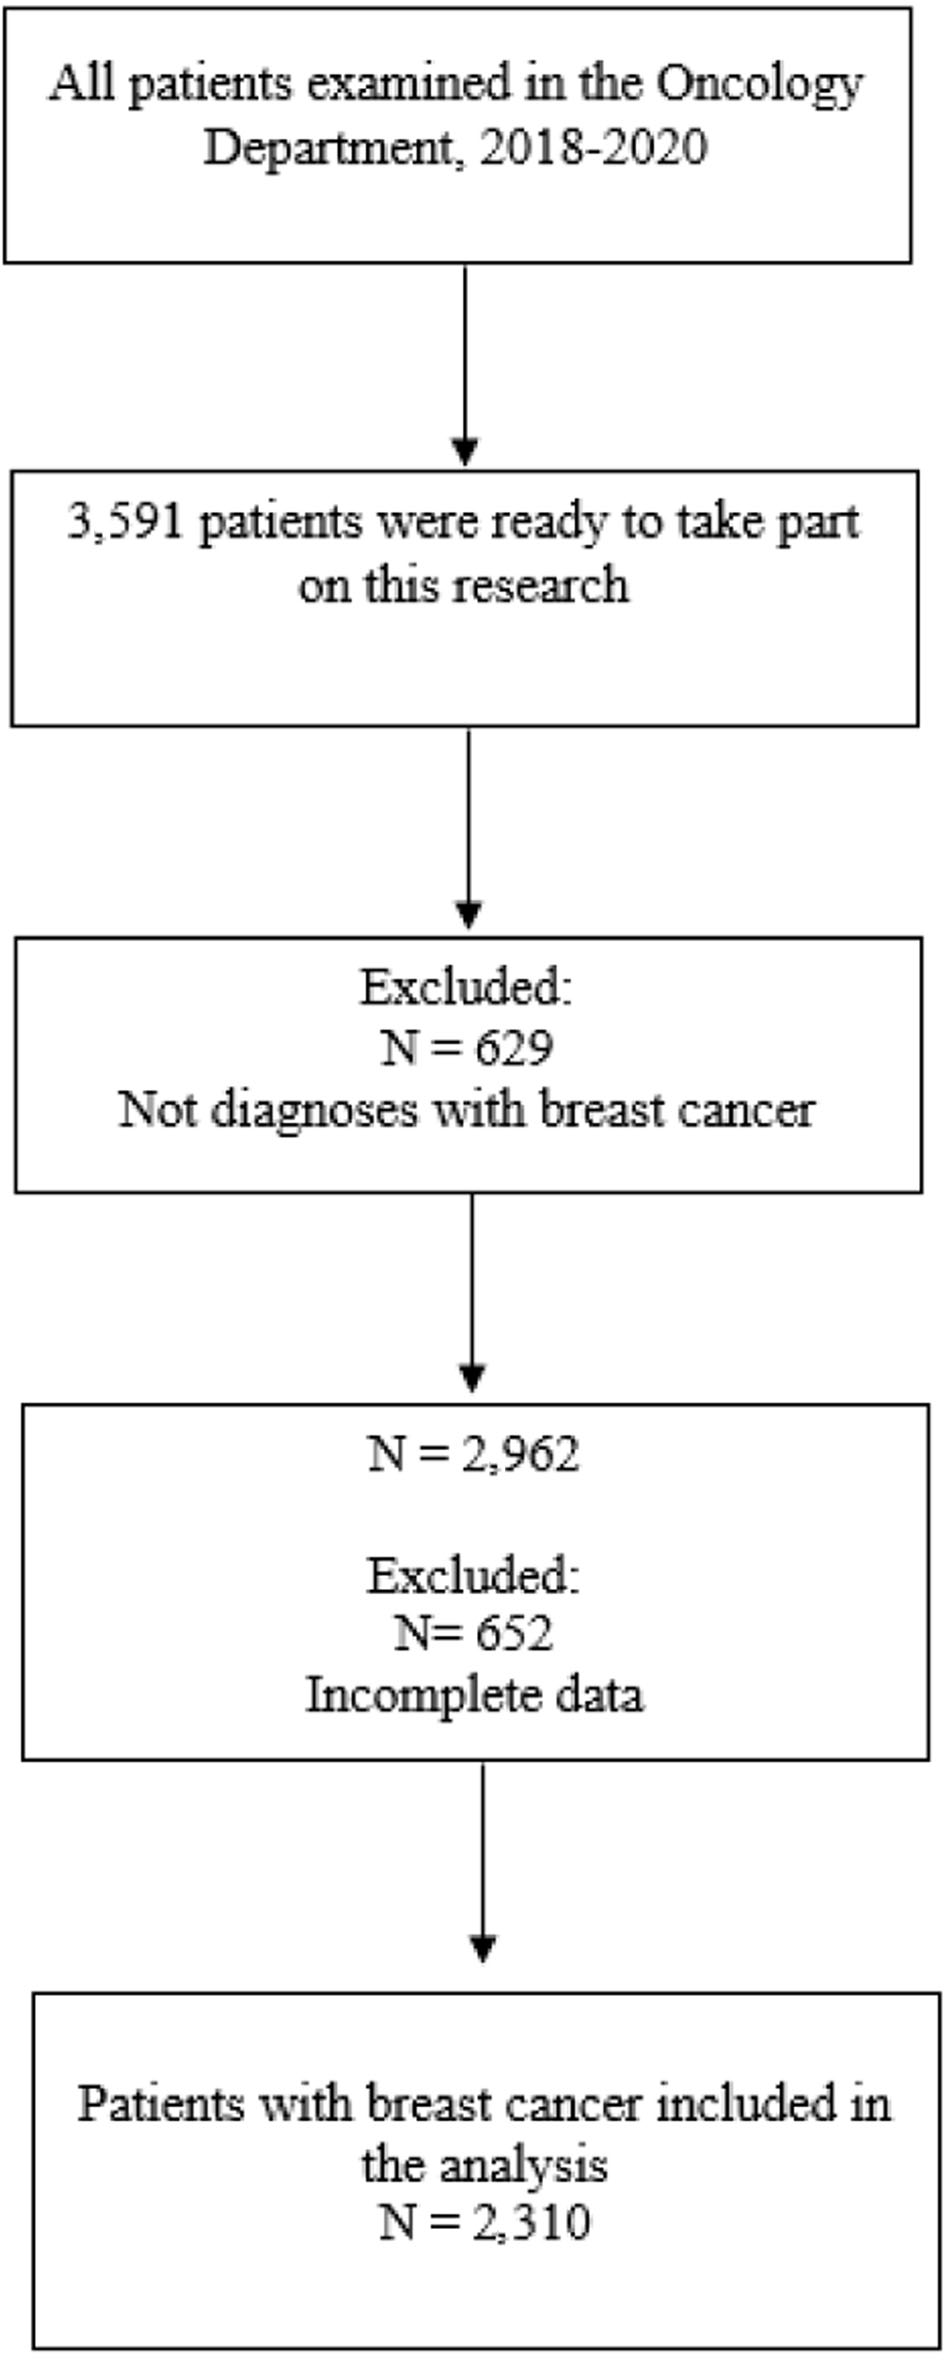
↓ Figure 1. Flow chart of the study process.
| World Journal of Oncology, ISSN 1920-4531 print, 1920-454X online, Open Access |
| Article copyright, the authors; Journal compilation copyright, World J Oncol and Elmer Press Inc |
| Journal website https://wjon.elmerpub.com |
Original Article
Volume 17, Number 4, August 2026, pages 547-555
Human Epidermal Growth Factor Receptor 2 Negative, Low, and Overexpression in Breast Cancer Patients: Study on Recurrence-Free and Overall Survival
Figures
Tables
| Total study population | ||
|---|---|---|
| N | % | |
| HER2: human epidermal growth factor receptor 2. | ||
| Age | ||
| < 45 | 305 | 13.2 |
| 45–55 | 821 | 35.5 |
| > 55 | 1,184 | 51.2 |
| Stadium | ||
| 1 | 59 | 2.6 |
| 2 | 571 | 24.7 |
| 3 | 1,666 | 72.1 |
| 4 | 14 | 0.6 |
| HER2 status | ||
| Negative | 1,007 | 43.6 |
| Low | 491 | 21.3 |
| Overexpression | 812 | 35.2 |
| Outcome | ||
| Death | 1,450 | 62.7 |
| Alive | 860 | 37.2 |
| HER2 | Mean | Median | ||||||
|---|---|---|---|---|---|---|---|---|
| Estimate | Standard error | 95% Confidence interval | Estimate | Standard error | 95% Confidence interval | |||
| Lower bound | Upper bound | Lower bound | Upper bound | |||||
| HER2: human epidermal growth factor receptor 2. | ||||||||
| Negative | 6.382 | 0.169 | 6.050 | 6.713 | ||||
| Low | 5.585 | 0.251 | 5.092 | 6.078 | 4.000 | 0.803 | 2.426 | 5.574 |
| Overexpression | 4.793 | 0.187 | 4.427 | 5.160 | 3.000 | 0.372 | 2.271 | 3.729 |
| Overall | 6.134 | 0.140 | 5.858 | 6.409 | 3.000 | 0.383 | 2.249 | 3.751 |
| 0 | 1 | |||||||
| HER2 | Chi-square | Sig. | Chi-square | Sig. | ||||
| Log-rank (Mantel–Cox) | 0 | 5.863 | 0.015 | |||||
| 1 | 5.863 | 0.015 | 0.852 | 0.356 | ||||
| 2 | 0.852 | 0.356 | ||||||