World Journal of Oncology, ISSN 1920-4531 print, 1920-454X online, Open Access
Article copyright, the authors; Journal compilation copyright, World J Oncol and Elmer Press Inc
Journal website https://wjon.elmerpub.com

Original Article

Volume 17, Number 4, August 2026, pages 524-533


Spatial Immune Remodeling Across the Gallbladder Carcinogenesis Spectrum: A Multicenter Digital Pathology Study

Figures

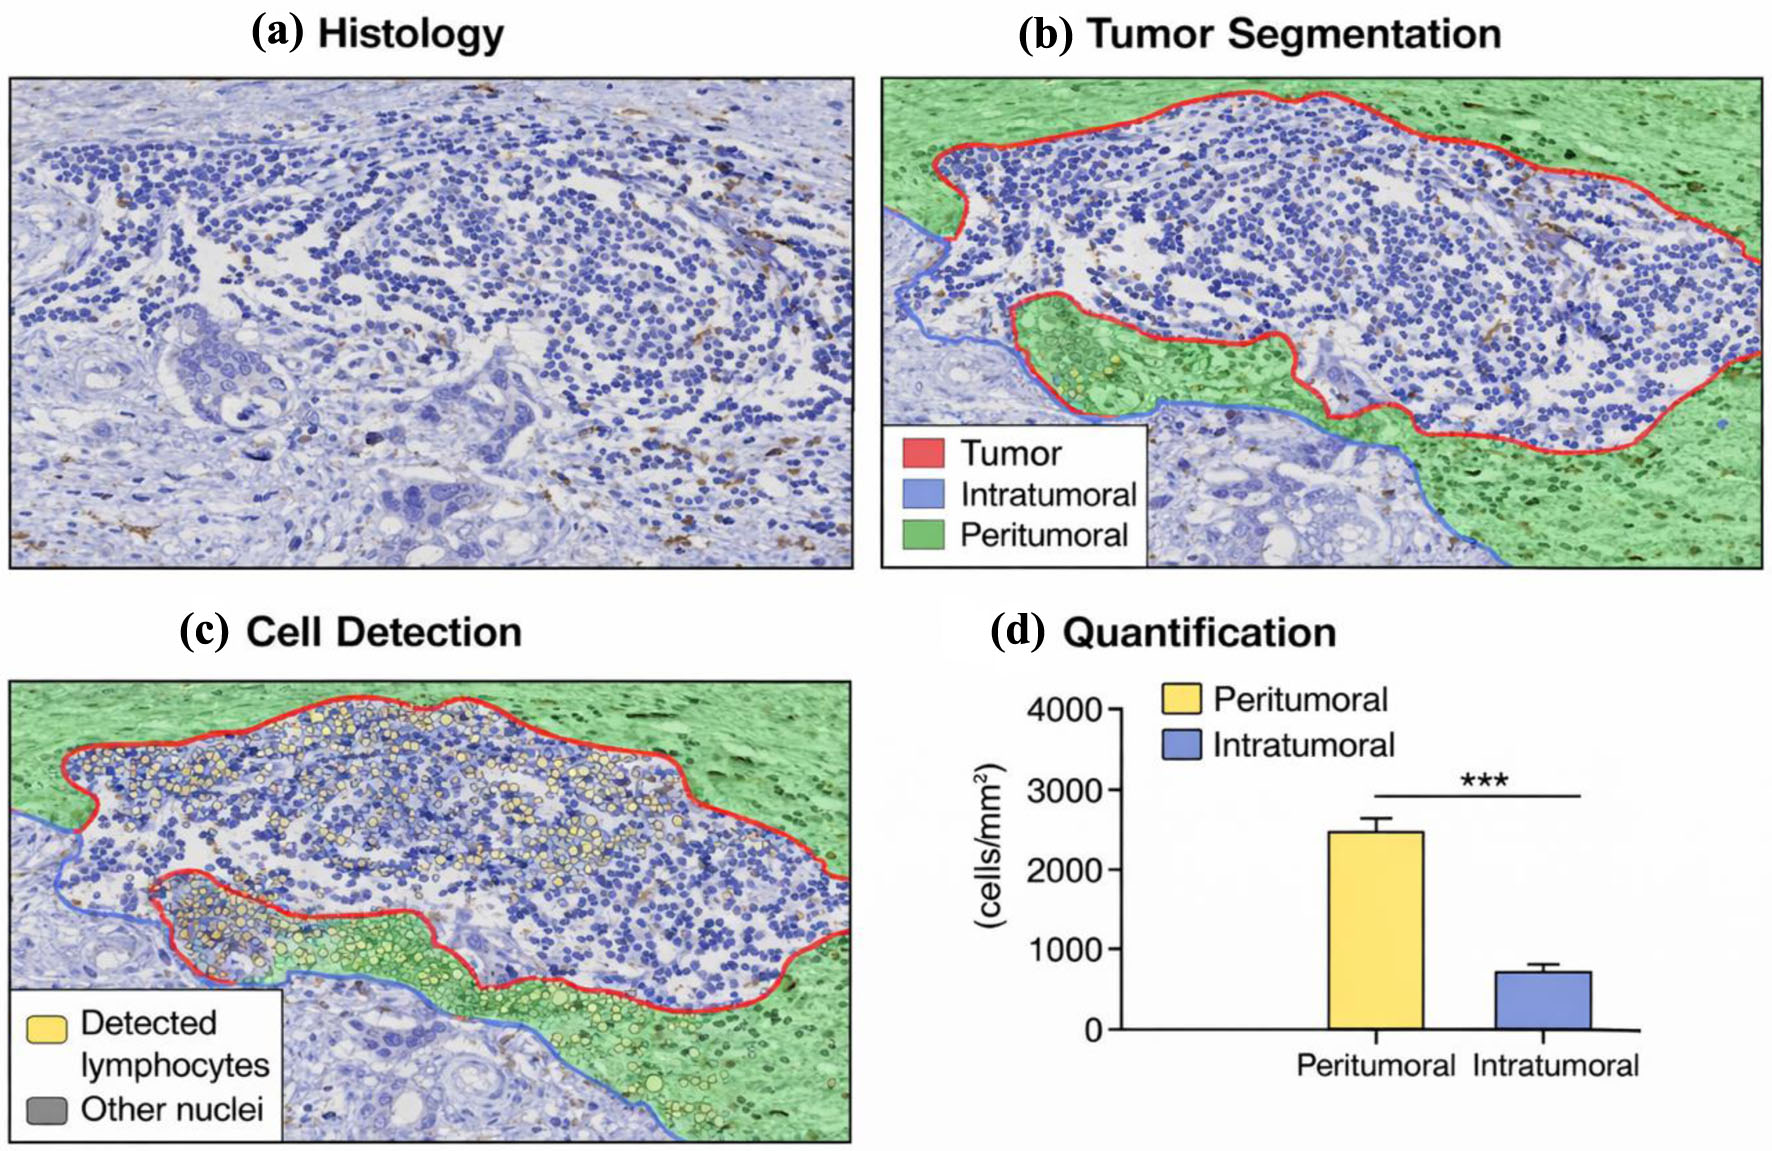
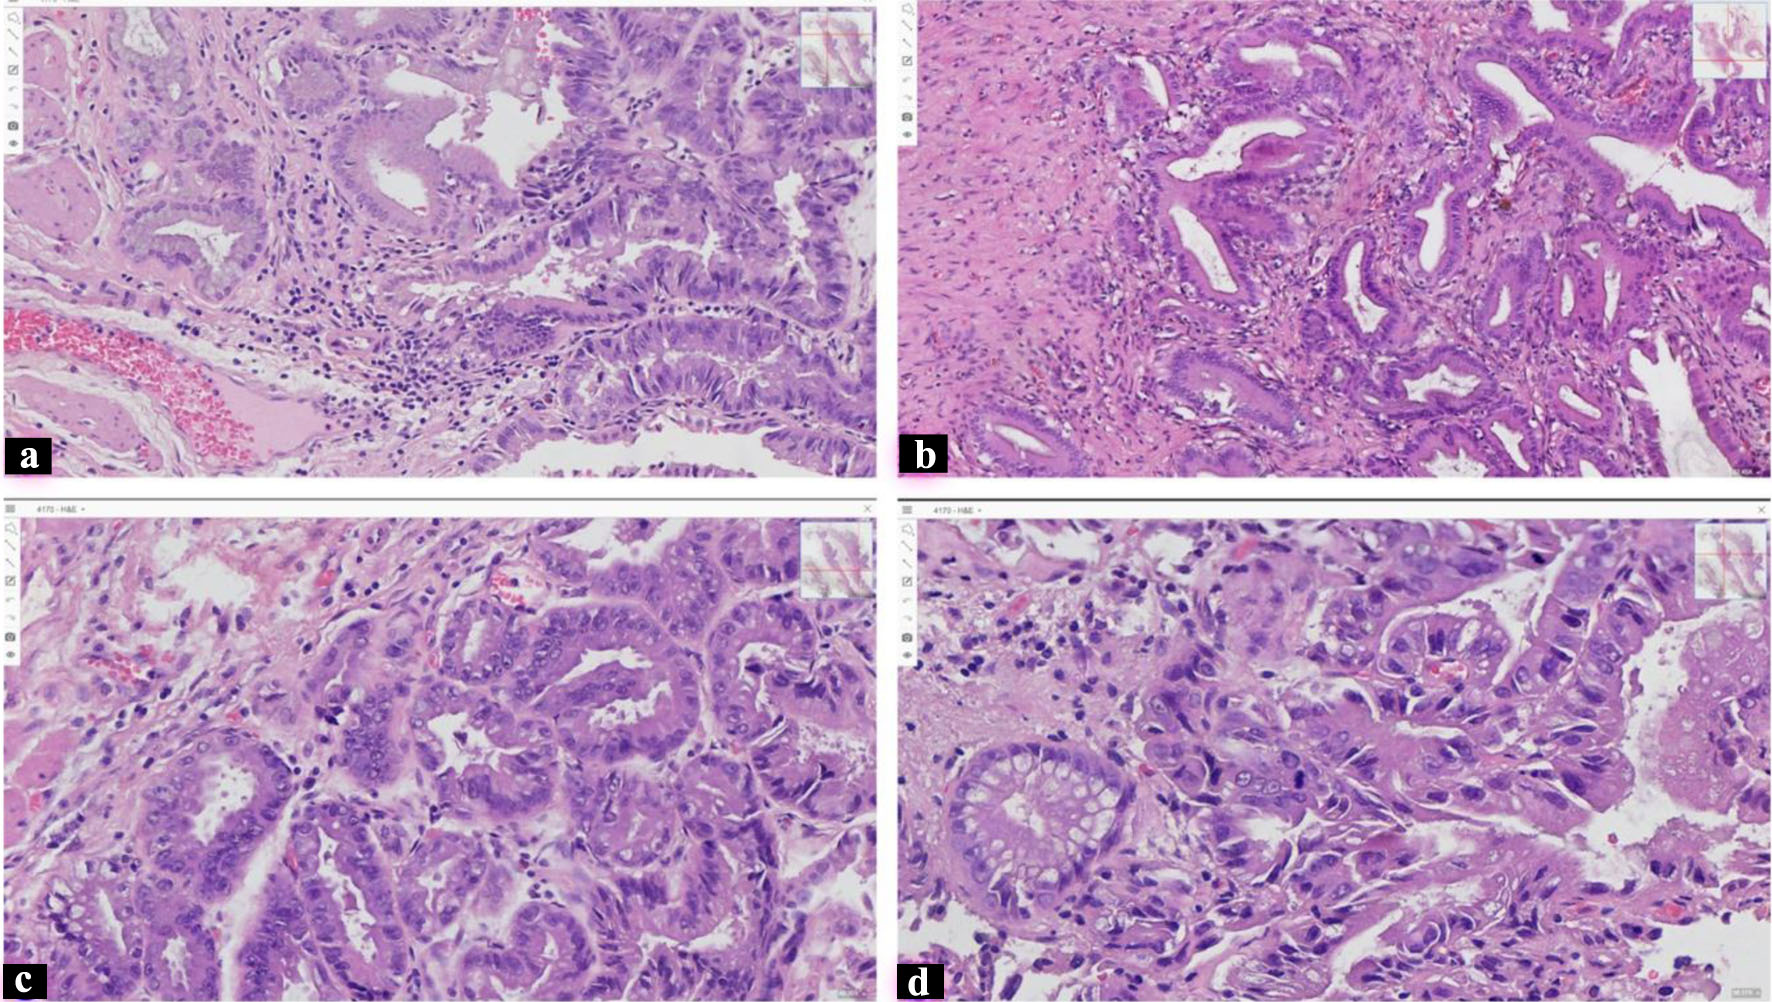
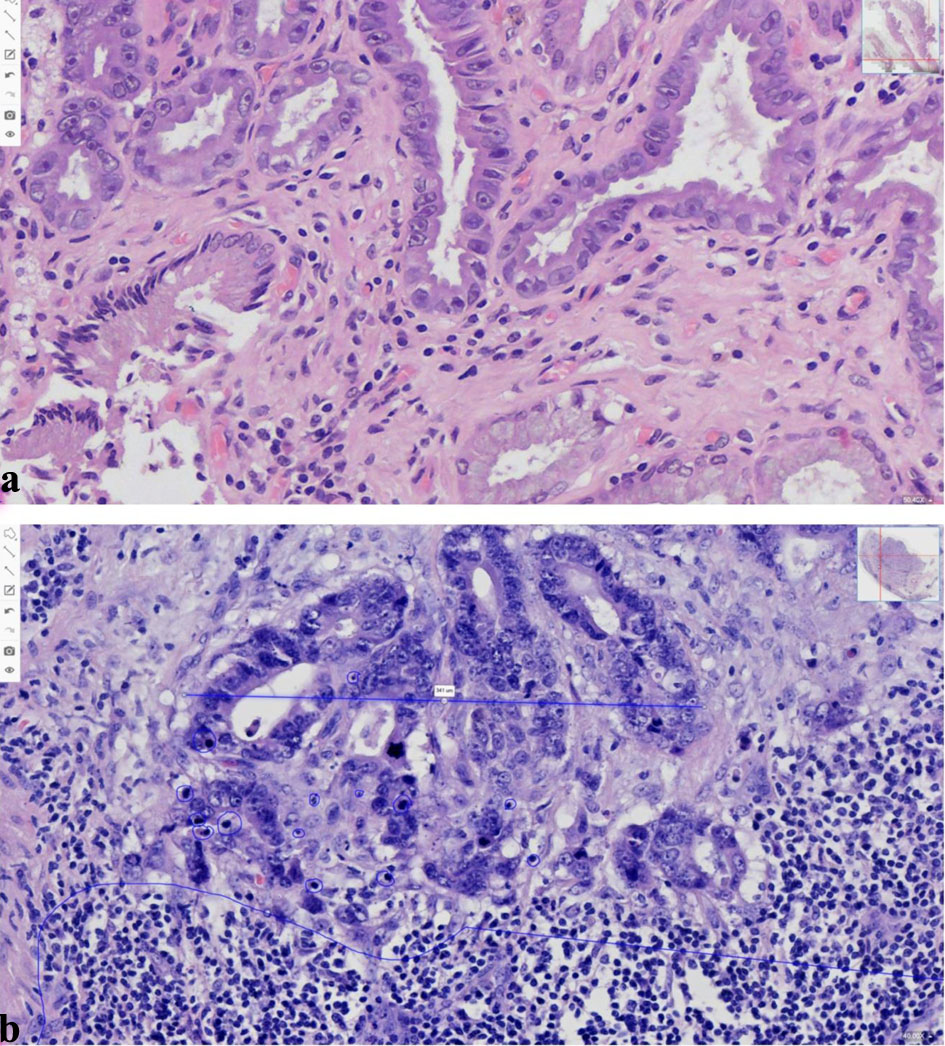
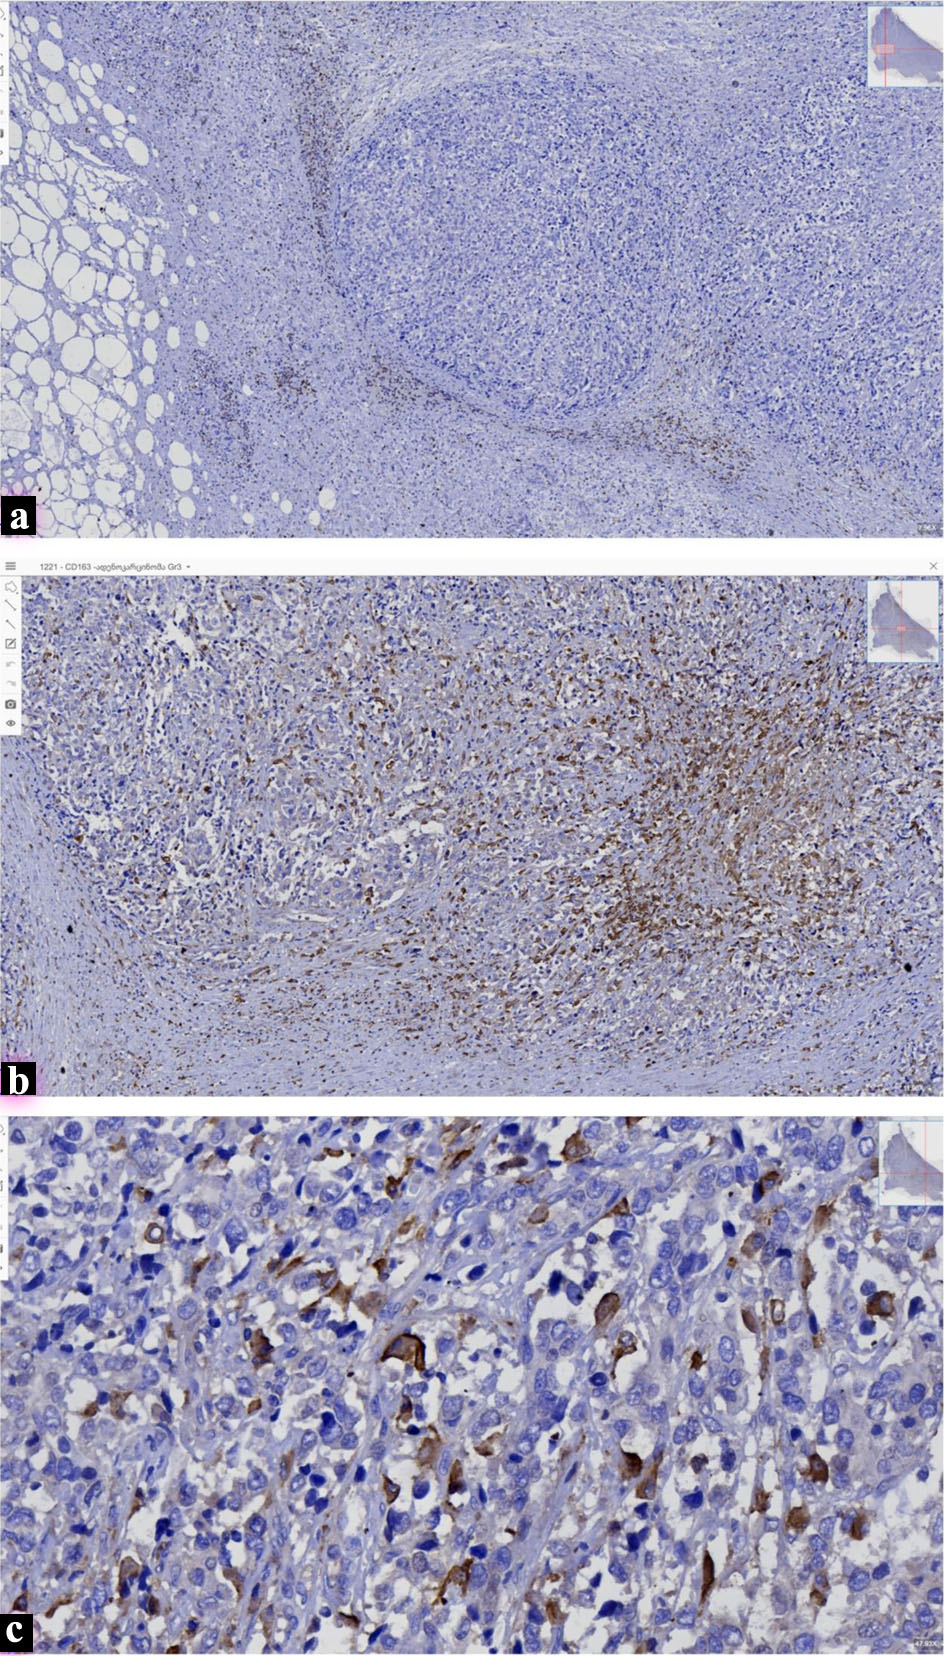
↓  Figure 1. Spatial digital analysis of immune cell infiltration in gallbladder adenocarcinoma. (a) Representative high-power field (× 40) showing tumor glands with surrounding lymphoid infiltrate. (b) Digital segmentation distinguishing tumor and stromal compartments. (c) Automated lymphocyte detection using digital pathology analysis. (d) Quantification of immune cell density demonstrating higher lymphocyte accumulation in the peritumoral region compared with the intratumoral compartment.
Figure 1.
↓  Figure 2. Histological spectrum of gallbladder epithelial lesions. Representative hematoxylin–eosin (H&E) stained sections illustrating the morphological progression from inflammatory to dysplastic gallbladder lesions. (a) Chronic cholecystitis showing inflammatory mucosa with prominent lymphoid infiltration. (b) Biliary intraepithelial neoplasia grade 1 (BilIN-1) characterized by mild epithelial atypia and preserved glandular architecture. (c) Biliary intraepithelial neoplasia grade 2 (BilIN-2) demonstrating moderate nuclear atypia and epithelial stratification. (d) Biliary intraepithelial neoplasia grade 3 (BilIN-3/carcinoma in situ) with marked nuclear pleomorphism, loss of polarity, and pronounced epithelial dysplasia. All images were obtained at × 400 magnification.
Figure 2.
↓  Figure 3. Inflammatory microenvironment in non-neoplastic and malignant gallbladder lesions. Representative whole-slide images (WSI) of hematoxylin–eosin (H&E) stained gallbladder tissue at × 500 magnification. (a) Chronic cholecystitis demonstrating foci of Inflammatory mucosa with minimal lymphocytic infiltration within the lamina propria and reactive epithelial changes. (b) Gallbladder adenocarcinoma showing invasive tumor glands surrounded by a dense peritumoral inflammatory infiltrate. The tumor region is highlighted, and intratumoral lymphocytes are indicated to illustrate the immune cell distribution within the tumor microenvironment.
Figure 3.
↓  Figure 4. Quantitative and spatial characterization of immune cell populations across gallbladder inflammatory, premalignant, and malignant lesions. (a) CD8+ cytotoxic T-cell density across chronic cholecystitis, intestinal metaplasia, biliary intraepithelial neoplasia (BilIN-1–3), and invasive carcinoma. (b) FOXP3+ regulatory T-cell density across the same lesion spectrum. (c) CD163+ macrophage density across diagnostic categories. (d) Spatial distribution of immune cells in carcinoma, comparing tumor center and invasive front. (e) Comparison of immune cell densities between non-metastatic and liver-metastatic carcinomas. (f) Spearman correlation matrix showing relationships among immune variables and the composite immune index.
Figure 4.
↓  Figure 5. Immune cell infiltration in gallbladder adenocarcinoma and metastatic lesions. Representative immunohistochemical staining demonstrating immune cell populations associated with gallbladder adenocarcinoma. (a) CD8 immunostaining showing cytotoxic T-lymphocyte infiltration within a metastatic liver nodule in a patient with a clinical history of biliary adenocarcinoma (× 40). (b) CD163 immunohistochemistry highlighting tumor-associated macrophages within the metastatic liver lesion (× 300). (c) High-power view demonstrating abundant CD163-positive macrophages within the tumor center of poorly differentiated gallbladder adenocarcinoma (G3) (× 450).
Figure 5.

Tables

↓  Table 1. Immunohistochemical Antibodies Used in the Study
 
MarkerCloneDilutionLocalization
List of primary antibodies applied for immunohistochemical analysis, including marker name, antibody clone, working dilution, and expected subcellular localization of staining. The panel included epithelial markers (E-cadherin, β-catenin, CK17, CK19), mesenchymal marker (vimentin), intestinal differentiation marker (CDX2), proliferation marker (Ki-67), tumor suppressor protein (p53), immune markers (FOXP3, CD8, CD163), and HER2 receptor status.
E-cadherinNCH-381:100Membranous
β-cateninE2471:100Membranous/nuclear
VimentinV91:200Cytoplasmic
CK17E31:100Cytoplasmic
CK19A53-B/A21:150Cytoplasmic
CDX2EPR2764Y1:100Nuclear
Ki-67MIB-11:200Nuclear
p53DO-71:100Nuclear
FOXP3236A/E71:100Nuclear
CD8C8/144B1:100Membranous
CD16310D61:100Cytoplasmic
HER24B5Ready-to-useMembranous


↓  Table 2. Estimated Lymphocyte Counts and Immune Cell Density Derived From Digital Spatial Analysis of Representative Tumor Regions
 
RegionLymphocytes (n)Area (mm2)Density (cells/mm2)
Peritumoral compartment∼320∼0.08∼4,000
Intratumoral compartment∼80∼0.08∼1,000


↓  Table 3. Clinicopathological Characteristics of the Study Cohort
 
ParameterChronic cholecystitis (n = 10)Intestinal metaplasia (n = 10)BilIN (n = 30)Invasive carcinoma (n = 40)Total cohort (n = 90)
Age, mean ± SD (years)59.3 ± 8.158.7 ± 7.560.9 ± 9.262.1 ± 8.860.7 ± 8.9
Female sex, n (%)7 (70%)6 (60%)17 (57%)20 (50%)50 (55.6%)
Male sex, n (%)3 (30%)4 (40%)13 (43%)20 (50%)40 (44.4%)
Cholelithiasis present, n (%)8 (80%)7 (70%)18 (60%)24 (60%)57 (63%)
Specimen type: cholecystectomy, n (%)10 (100%)10 (100%)30 (100%)40 (100%)90 (100%)
High-grade dysplasia (BilIN-3), n (%)10 (33%)
Tumor grade (G2–G3), n (%)28 (70%)
Lymphovascular invasion, n (%)14 (35%)
Perineural invasion, n (%)10 (25%)
Liver metastasis during follow-up, n (%)8 (20%)


↓  Table 4. Quantitative Immune Microenvironment Parameters Across Gallbladder Lesion Spectrum
 
Marker (cells/mm2)Chronic cholecystitisIntestinal metaplasiaBilINCarcinomaP-value
CD8 cytotoxic lymphocytes350 (120–620)320 (110–590)300 (90–540)290 (80–520)0.041
FOXP3 regulatory T cells180 (60–320)210 (70–350)260 (110–430)320 (140–520)< 0.001
CD163 macrophages520 (240–800)640 (320–920)760 (400–1,200)880 (450–1,800)< 0.001
CD8/FOXP3 ratio1.941.521.150.910.006
CD8/CD163 ratio0.670.500.390.330.012


↓  Table 5. Spatial Immune Architecture in Invasive Gallbladder Carcinoma
 
MarkerTumor center (cells/mm2)Invasive tumor front (cells/mm2)P-value
CD8 cytotoxic T lymphocytes220 (80–420)410 (160–760)< 0.001
FOXP3 regulatory T cells290 (120–480)340 (150–540)0.031
CD163 macrophages780 (420–1,320)920 (510–1,500)0.018


↓  Table 6. Immune Microenvironment and Metastatic Behavior in Gallbladder Carcinoma
 
MarkerNon-metastatic tumors (n = 32)Metastatic tumors (n = 8)P-value
CD8 density (cells/mm2)310 (150–580)210 (80–340)0.012
FOXP3 density (cells/mm2)300 (120–480)390 (210–650)0.009
CD163 density (cells/mm2)820 (420–1,280)1,040 (600–1,650)0.015
Immune suppression index1.351.920.004