Figures
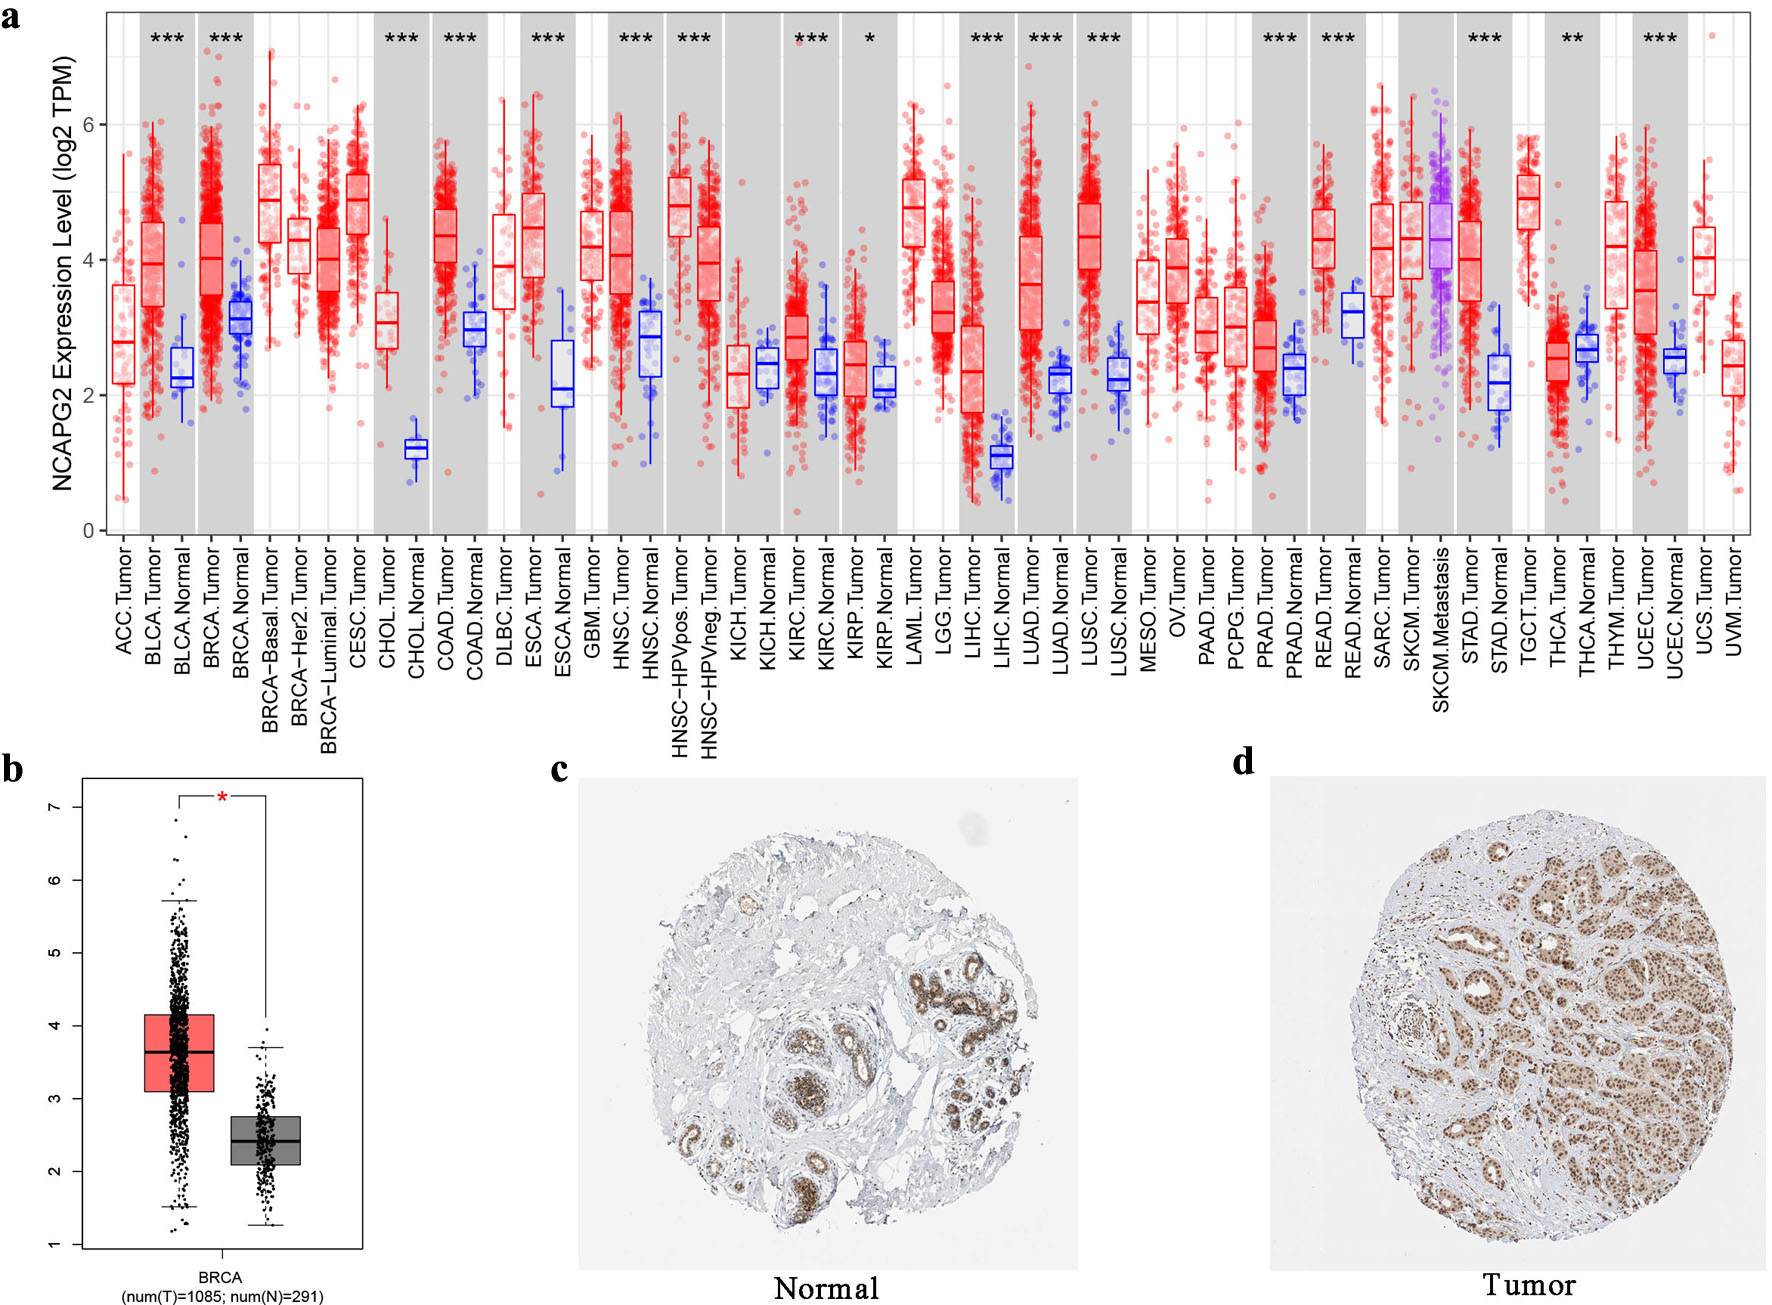
↓ Figure 1. The mRNA and protein expression of NCAPG2 in BRCA. (a) NCAPG2 was upregulated in 18 cancer types in the TIMER database. (b) The mRNA expression of NCAPG2 in BRCA in the GEPIA database. (c, d) The protein expression of NCAPG2 in normal tissue and breast cancer tissue in the HPA database.
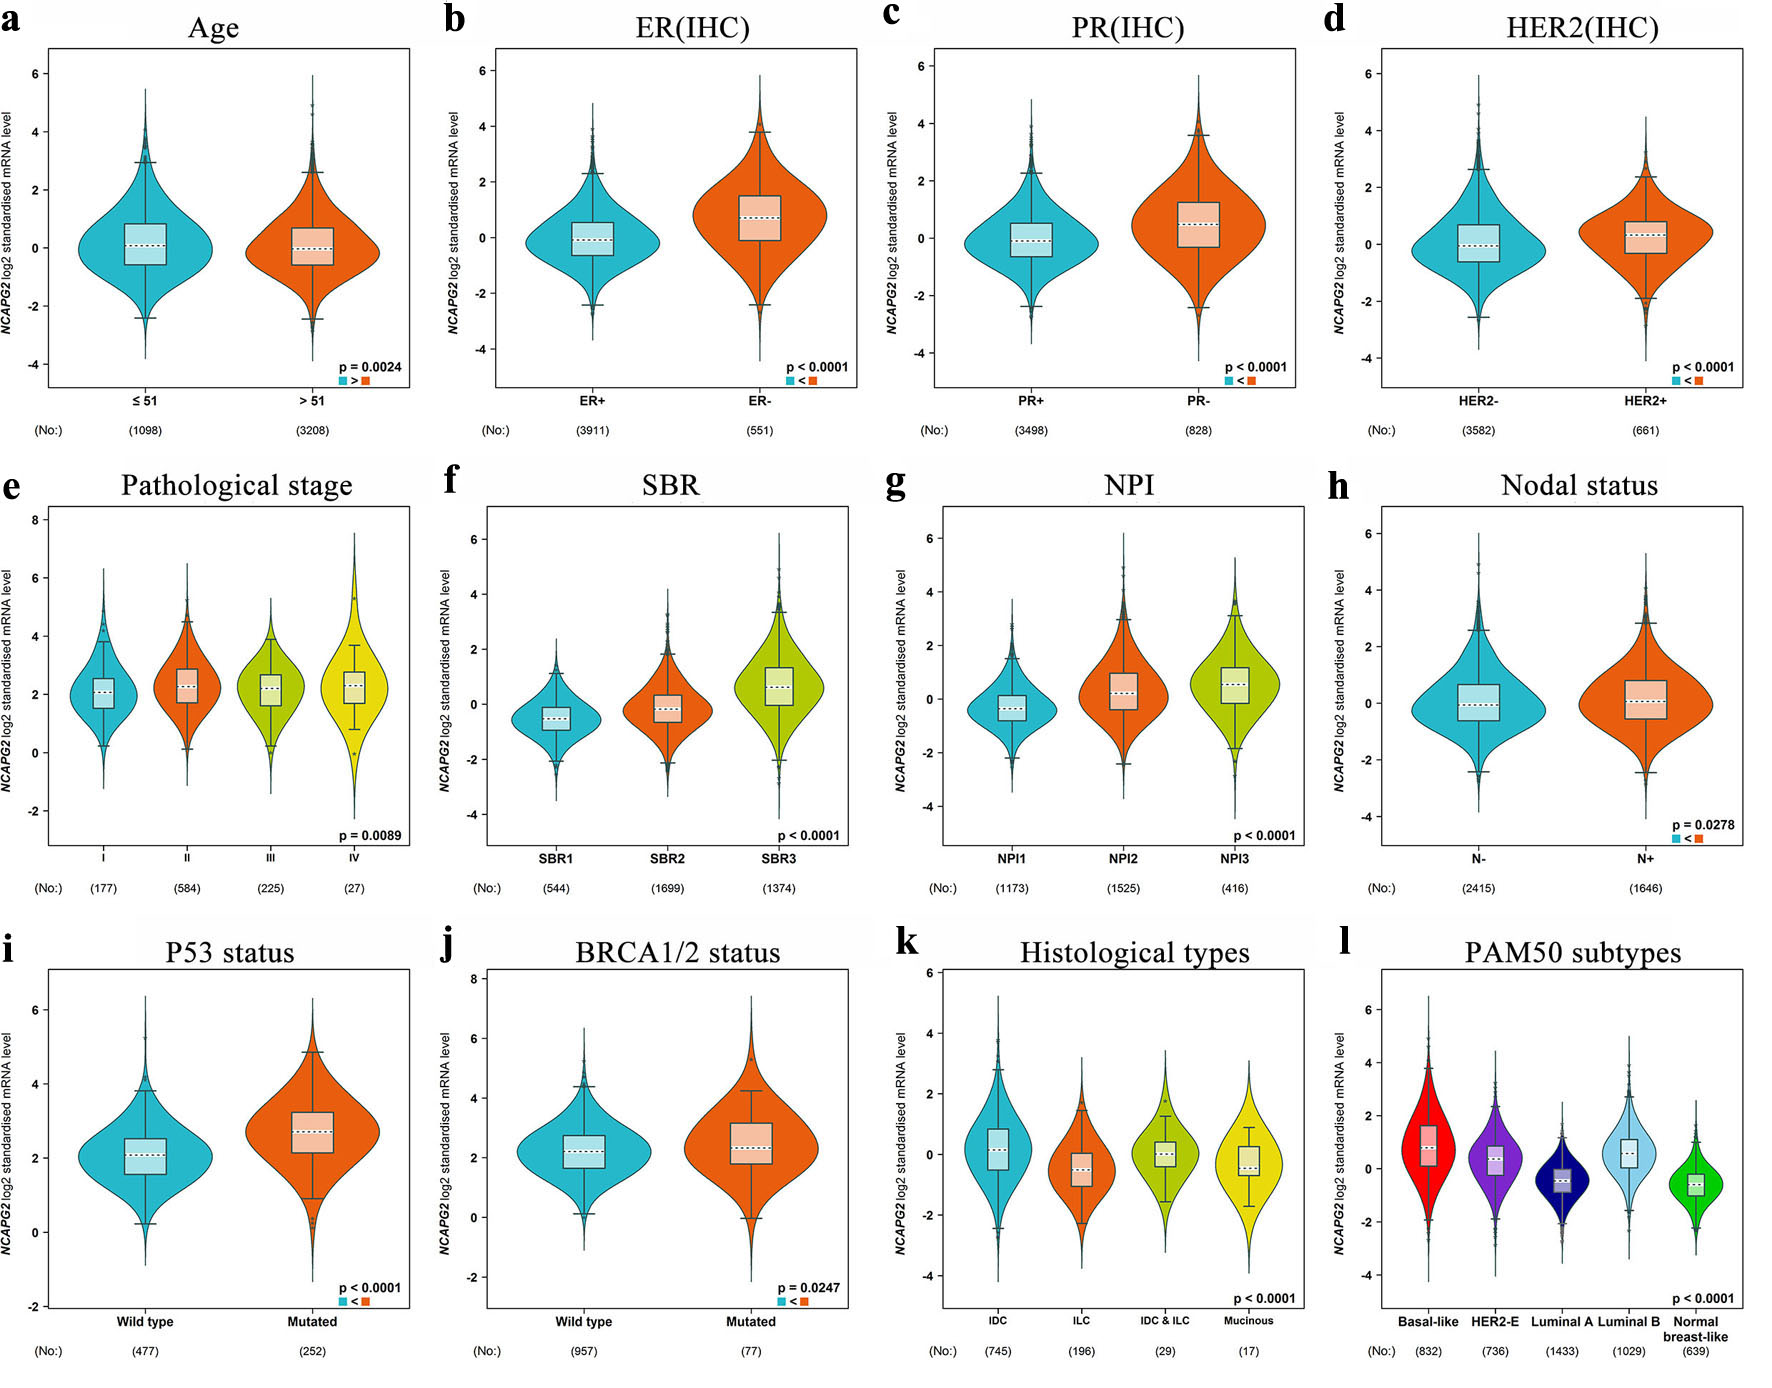
↓ Figure 2. The transcription level of NCAPG2 in the subgroup of BRCA patients. The boxplots of BRCA patients classified by age (a), ER (b), PR (c), HER2 (d), pathological stage (e), SBR (f), NPI (g), node status (h), TP53 mutation status (i), BRCA1/2 mutation status (j), histological type (k), and PAM50 subtypes (l).
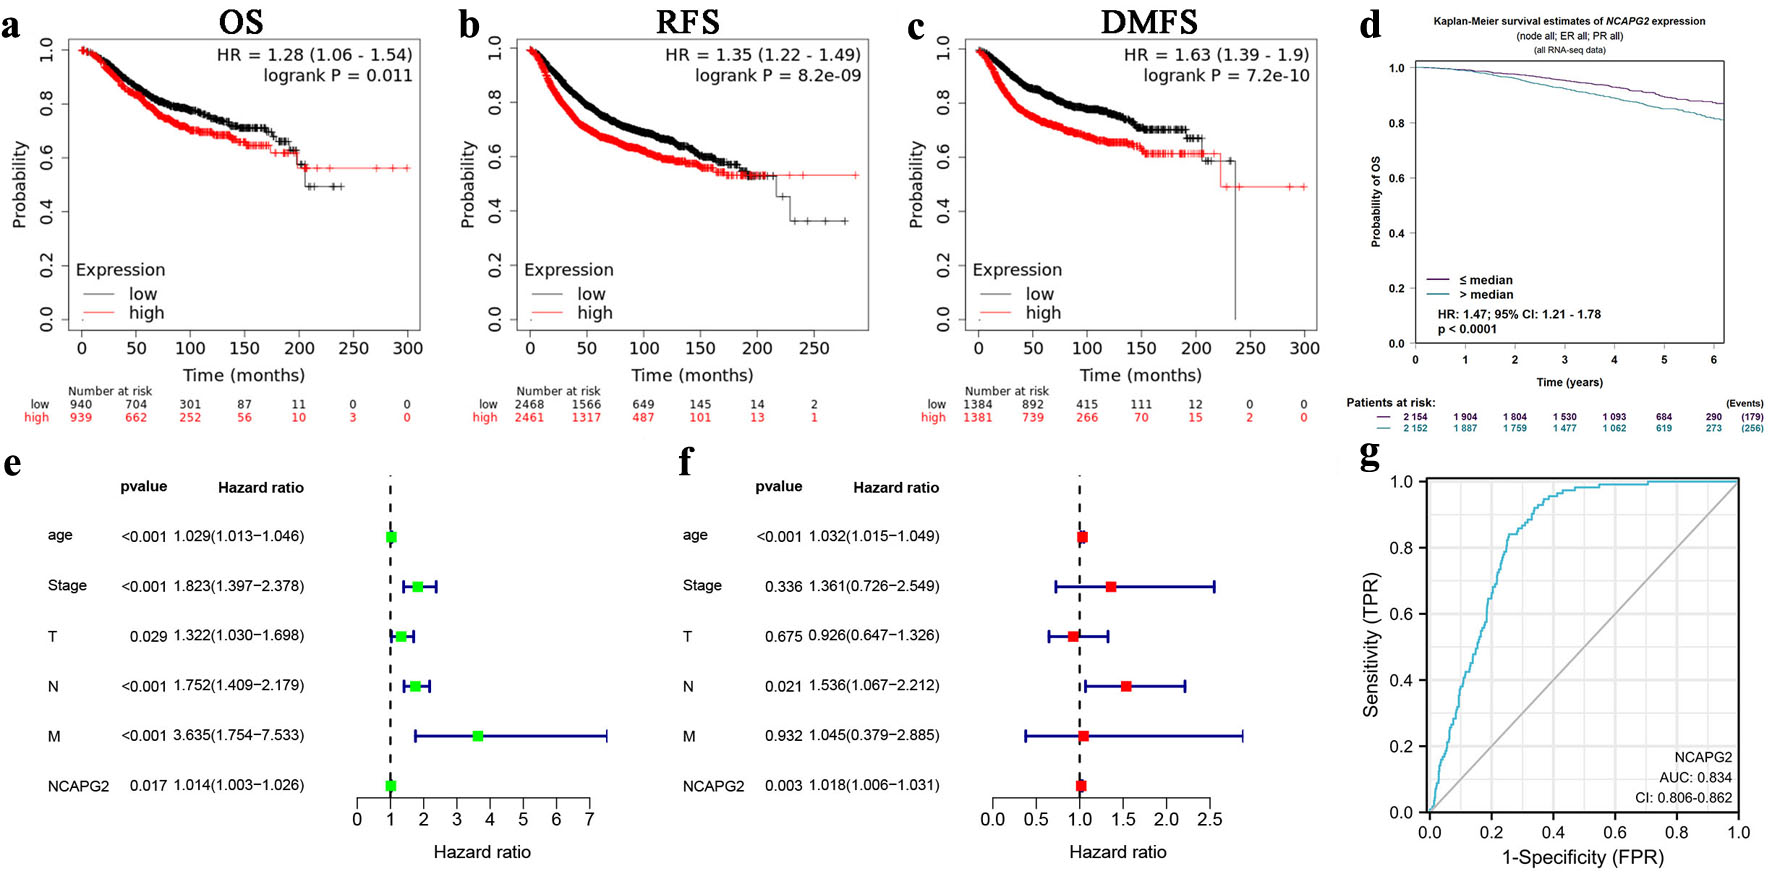
↓ Figure 3. Prognostic and diagnostic roles of NCAPG2 in BRCA. Survival curve of differential NCAPG2 expression in BRCA in the Kaplan–Meier plotter database (a–c) and the bc-GenExMiner (d). Univariate (e) and multivariate (f) Cox analyses of clinicopathological parameters and NCAPG2 in BRCA. (g) The ROC curve of NCAPG2 in BRCA.
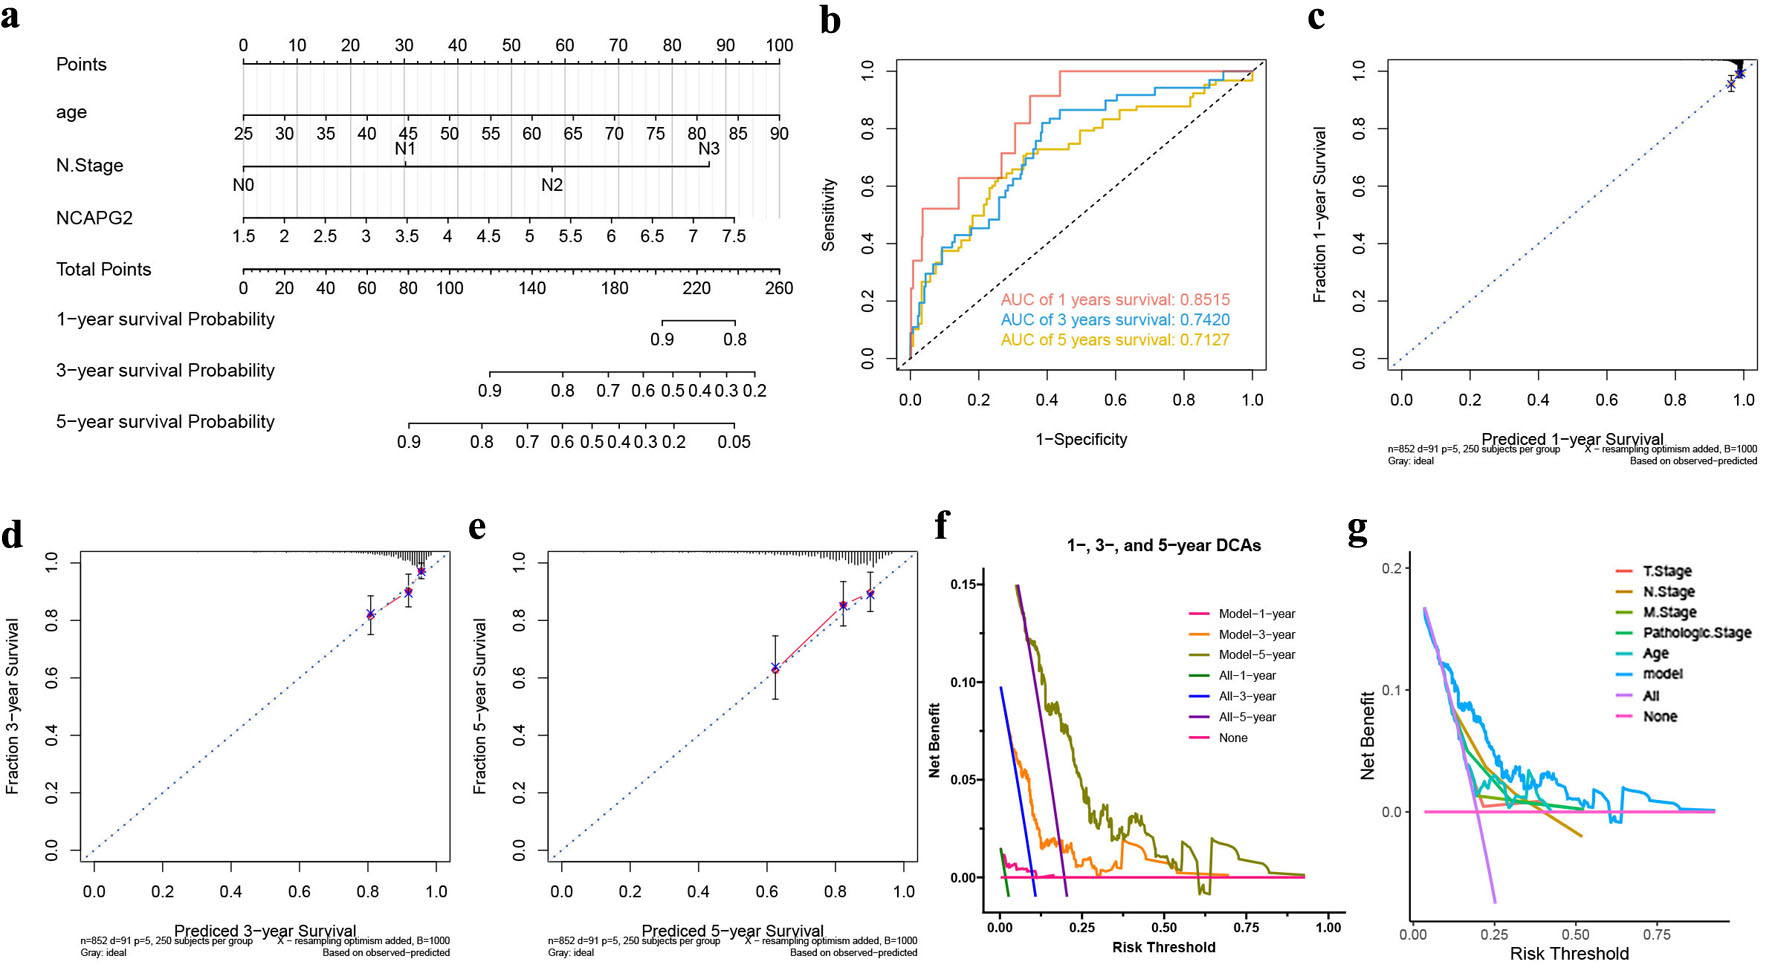
↓ Figure 4. A nomogram based on NCAPG2 to predict the survival probability of BRCA. (a) A nomogram for predicting BRCA prognosis with NCAPG2 expression. The 1-, 3-, and 5-year ROC curves (b), calibration curves (c–e), and DCA curves (f). (g) The DCA curves of the nomogram and different clinicopathological parameters.
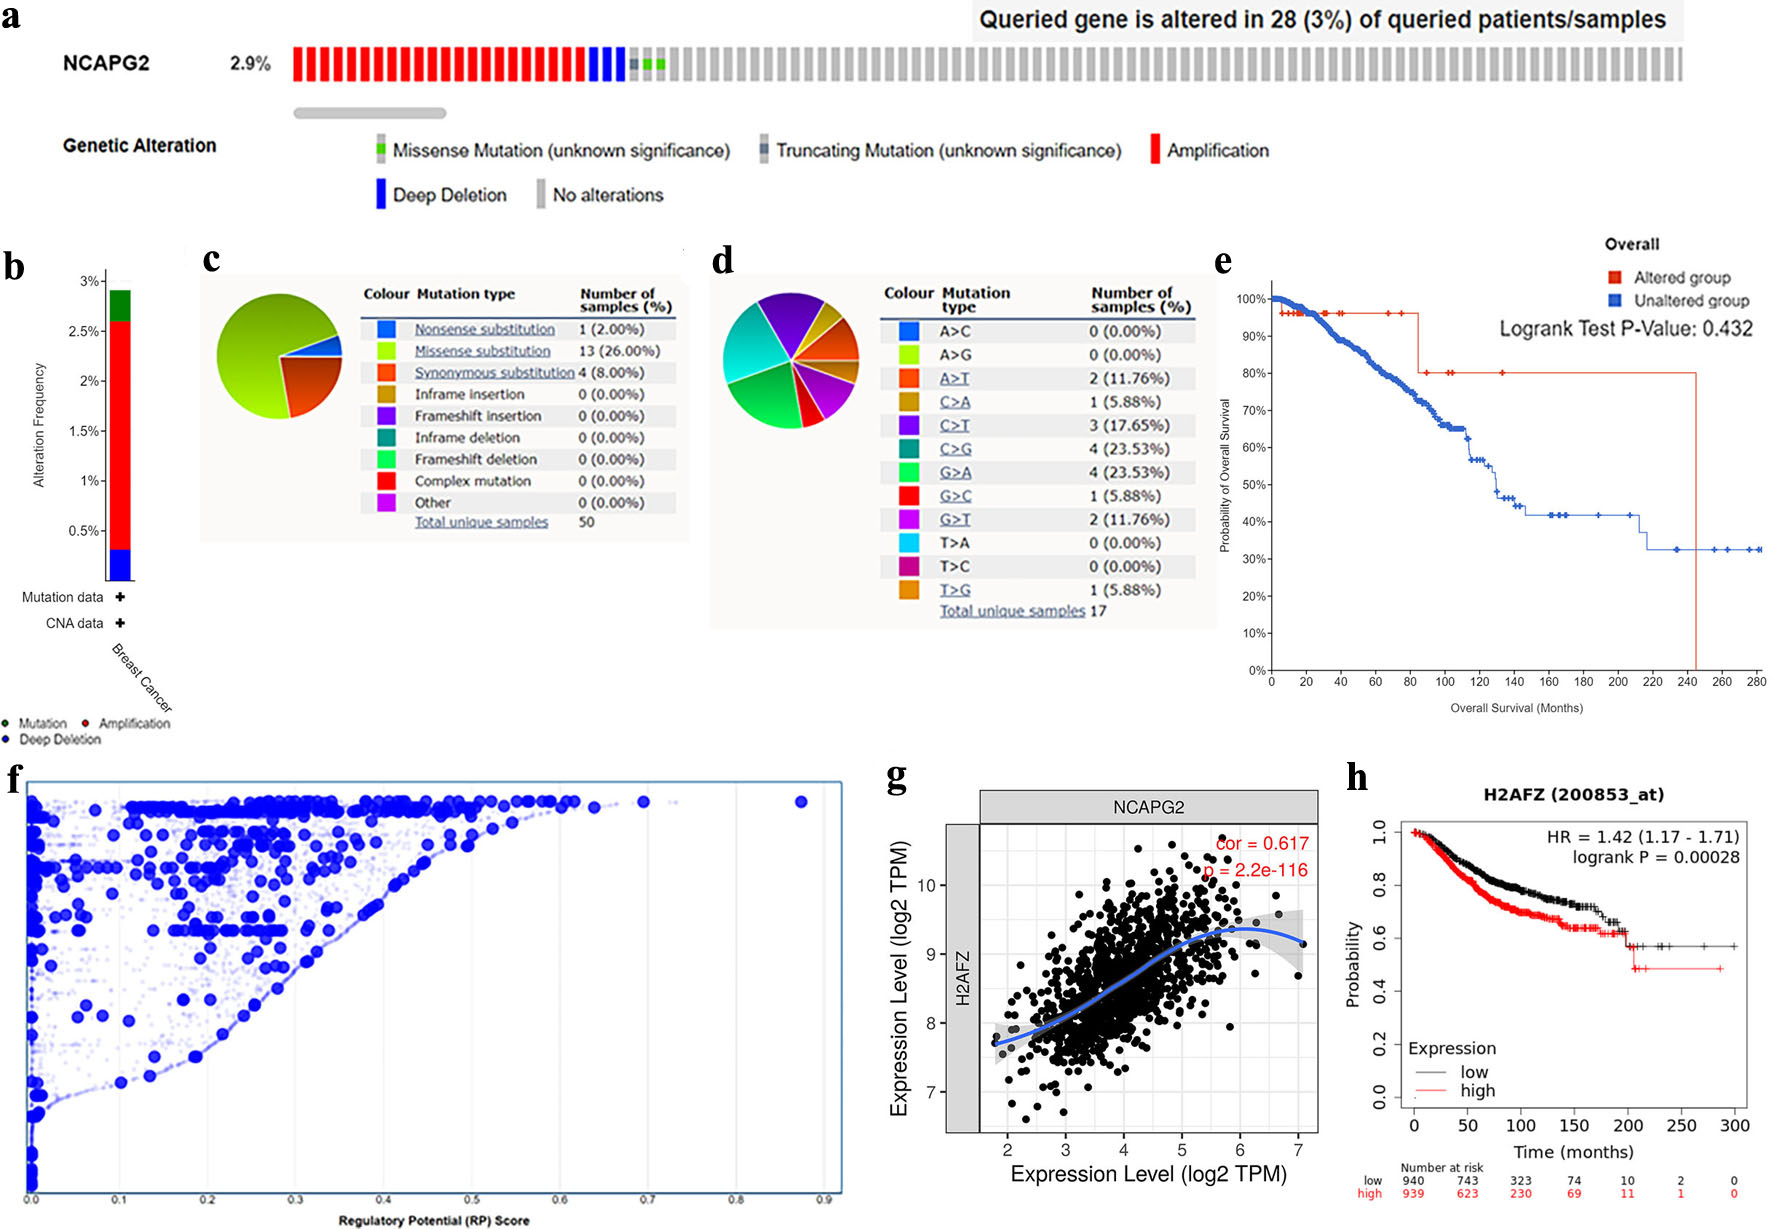
↓ Figure 5. Mutant and transcriptional regulation analysis of NCAPG2 in BRCA. (a, b) The overview of alteration types and corresponding frequencies of NCAPG2. (c, d) The summary of mutation types and substitutional types of NCAPG2 in the COSMIC database. (e) The Kaplan–Meier survival curve in different mutation status. (f) The potential transcription factors of NCAPG2 in breast cancer (10 k distance to TSS). (g) The correlation of H2AFZ and NCAPG2 expression in BRCA in the TIMER database. (h) The prognosis value of H2AFZ in BRCA in the Kaplan–Meier plotter database.
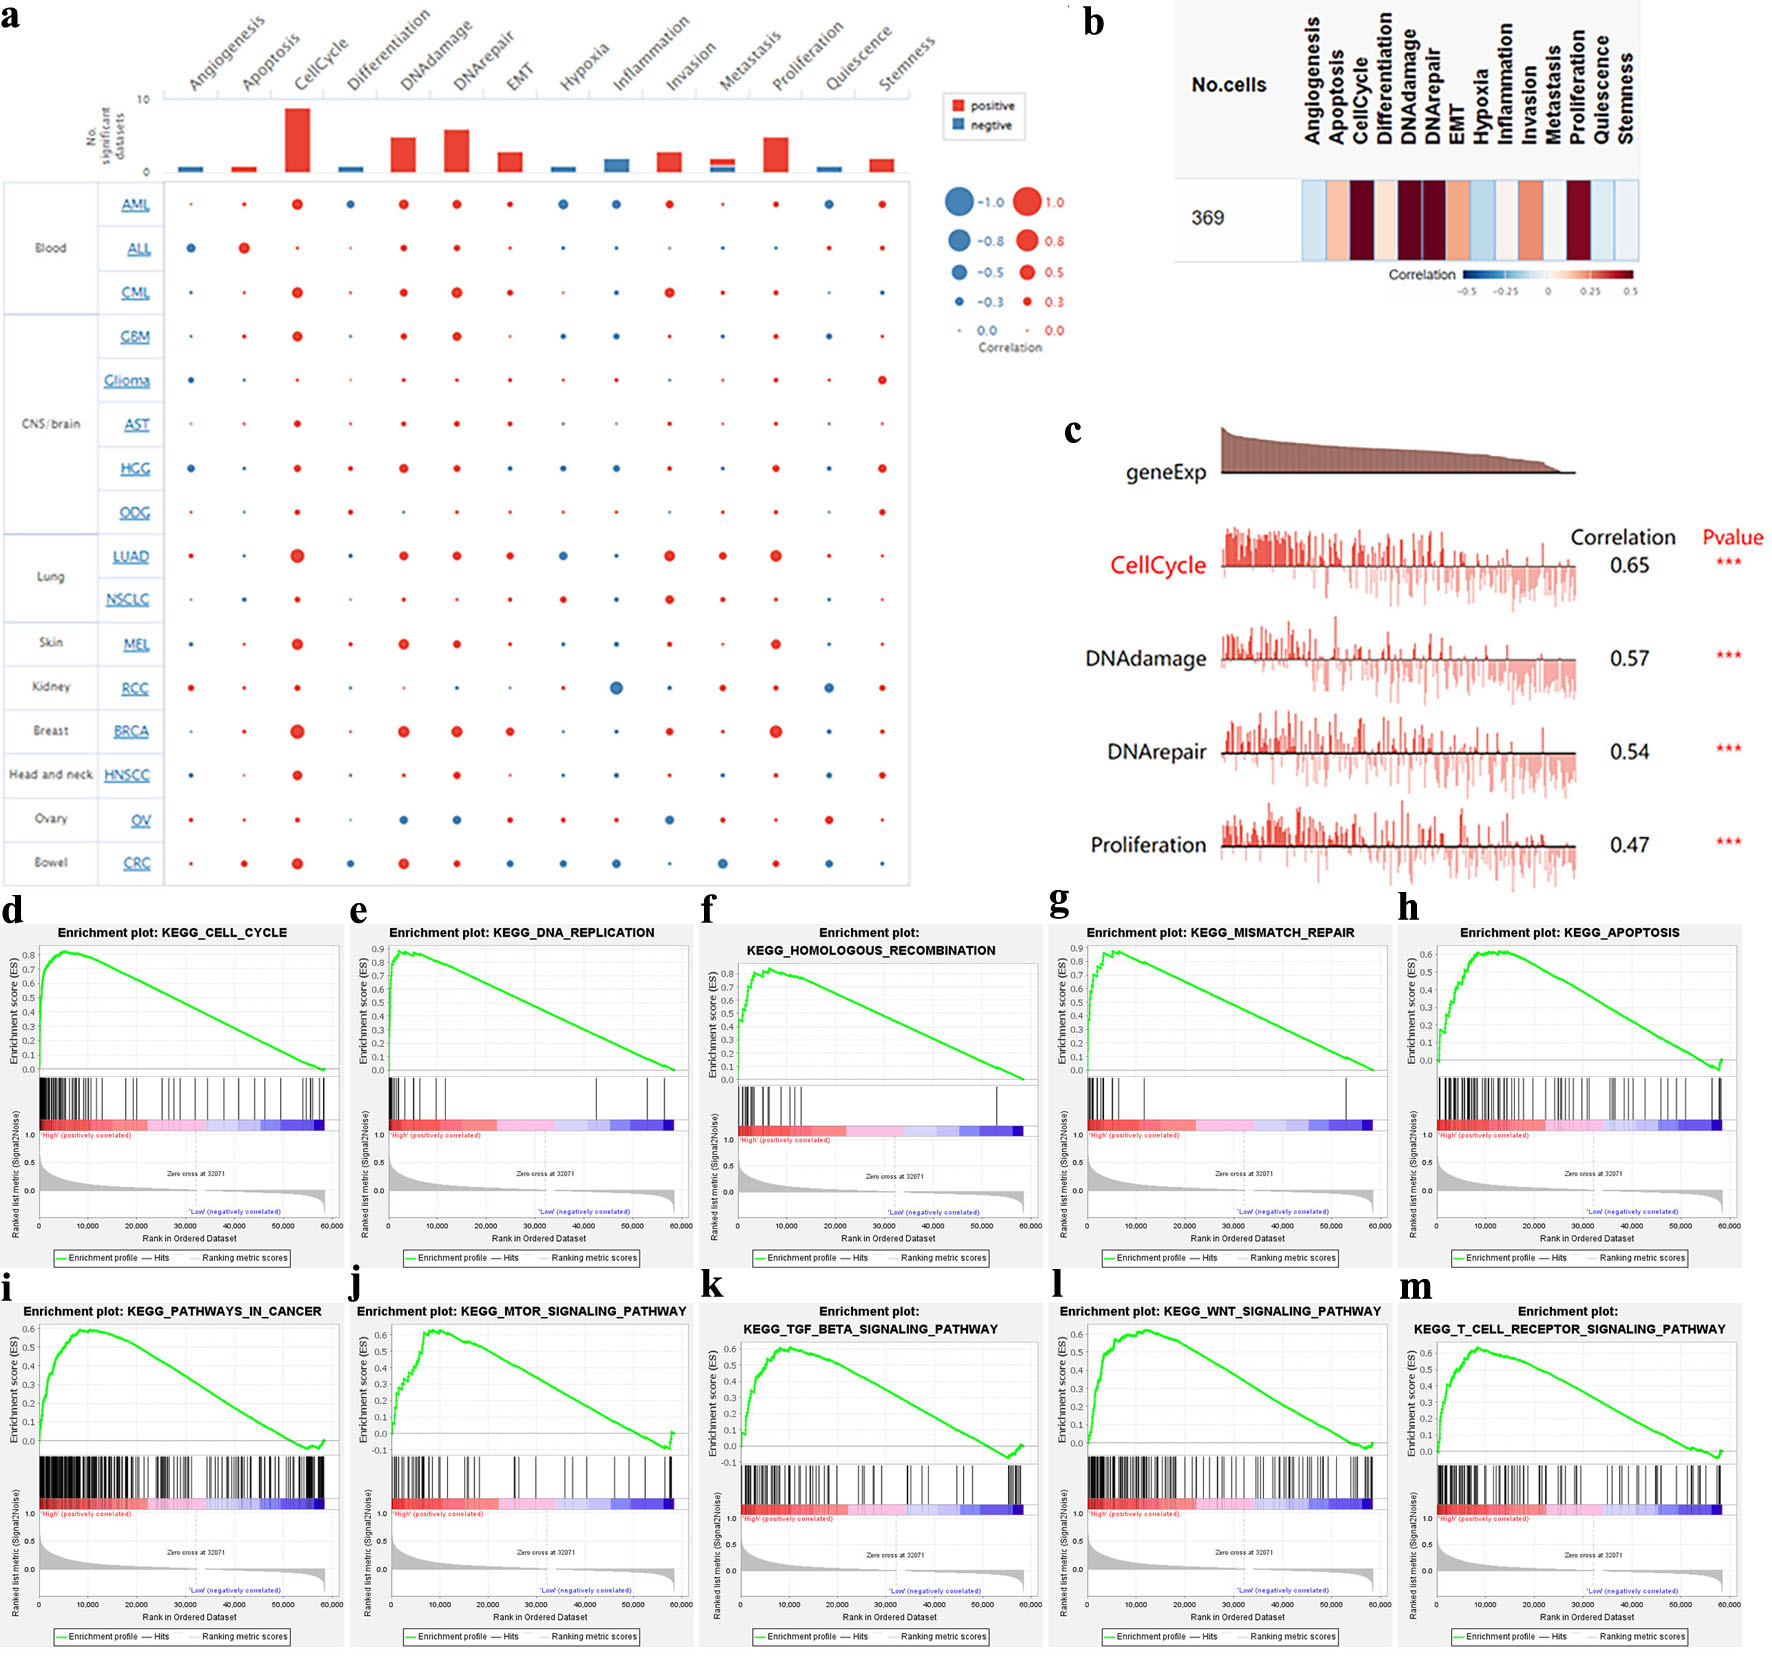
↓ Figure 6. Single-cell functional analysis of NCAPG2. (a, b) The NCAPG2-related functional states in various cancers and BRCA. (c) The four functional states significantly correlated with NCAPG2. (d–m) Parts of the results of GSEA.
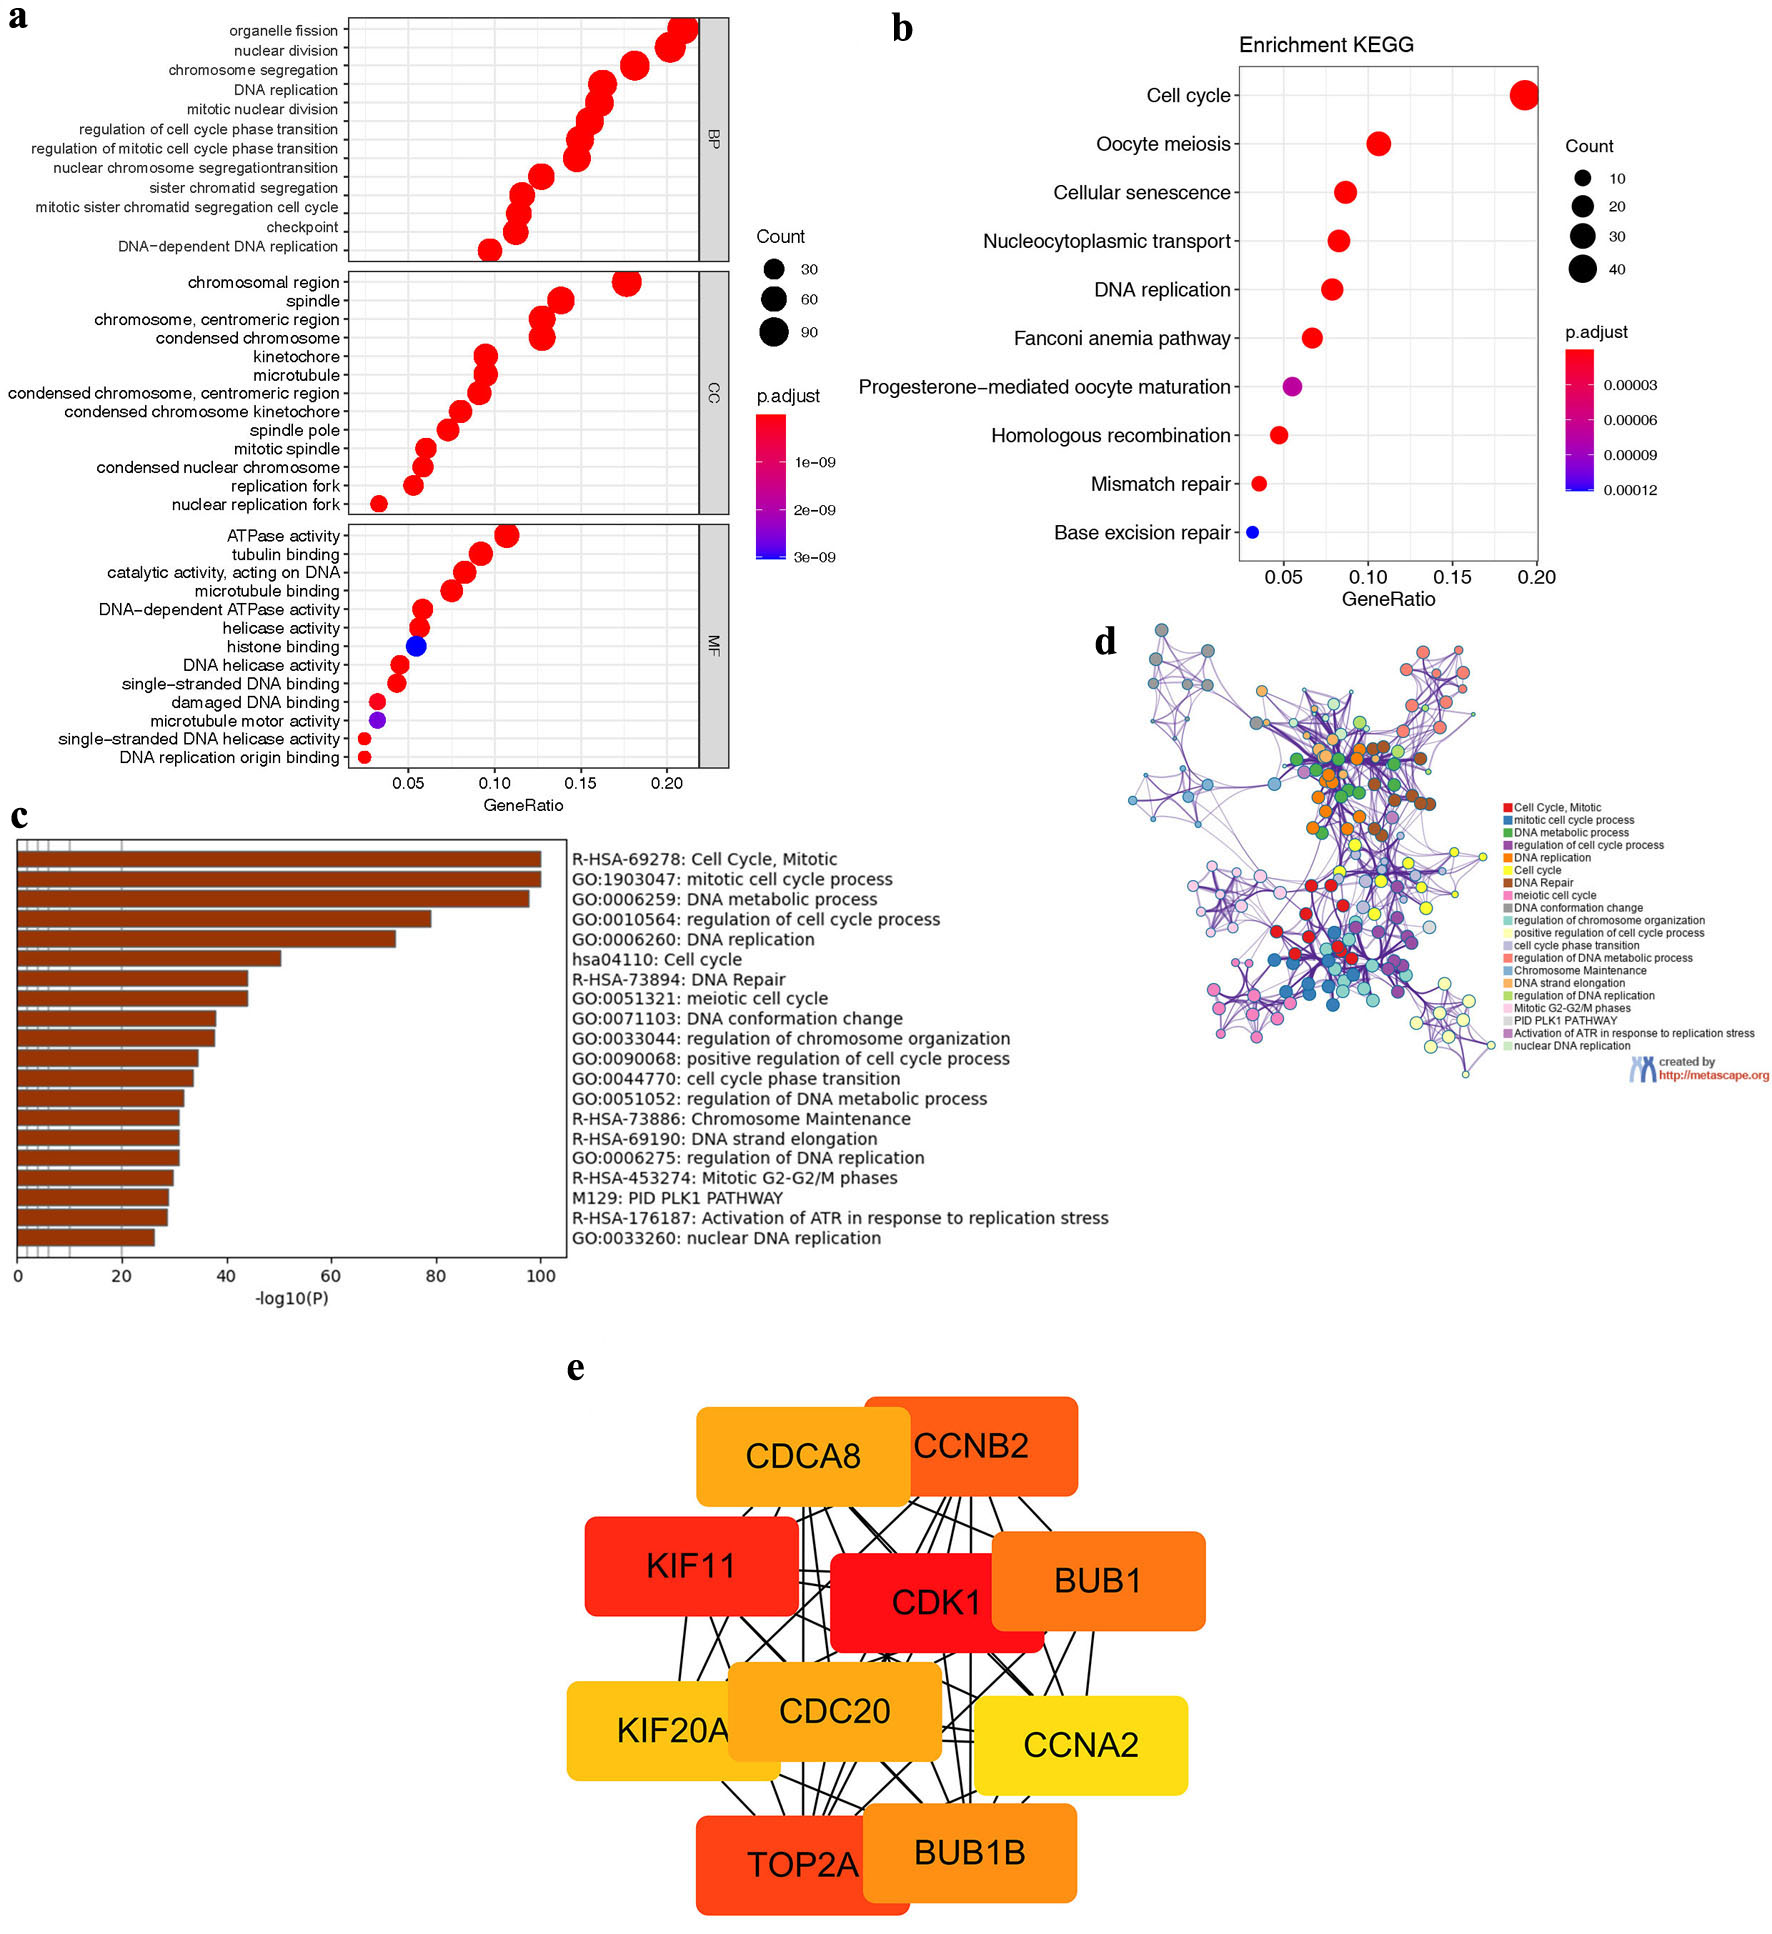
↓ Figure 7. The co-expressed genes of NCAPG2, PPI network, and hub genes. (a) The result of GO analysis of the co-expressed genes, including biological progress, cellular component, and cellular component. (b) The result of KEGG analysis of the co-expressed genes. (c, d) The functional enrichment analysis results of the co-expressed genes in the Metascape database. (e) The 10 hub genes of the PPI network identified with Cytoscape.
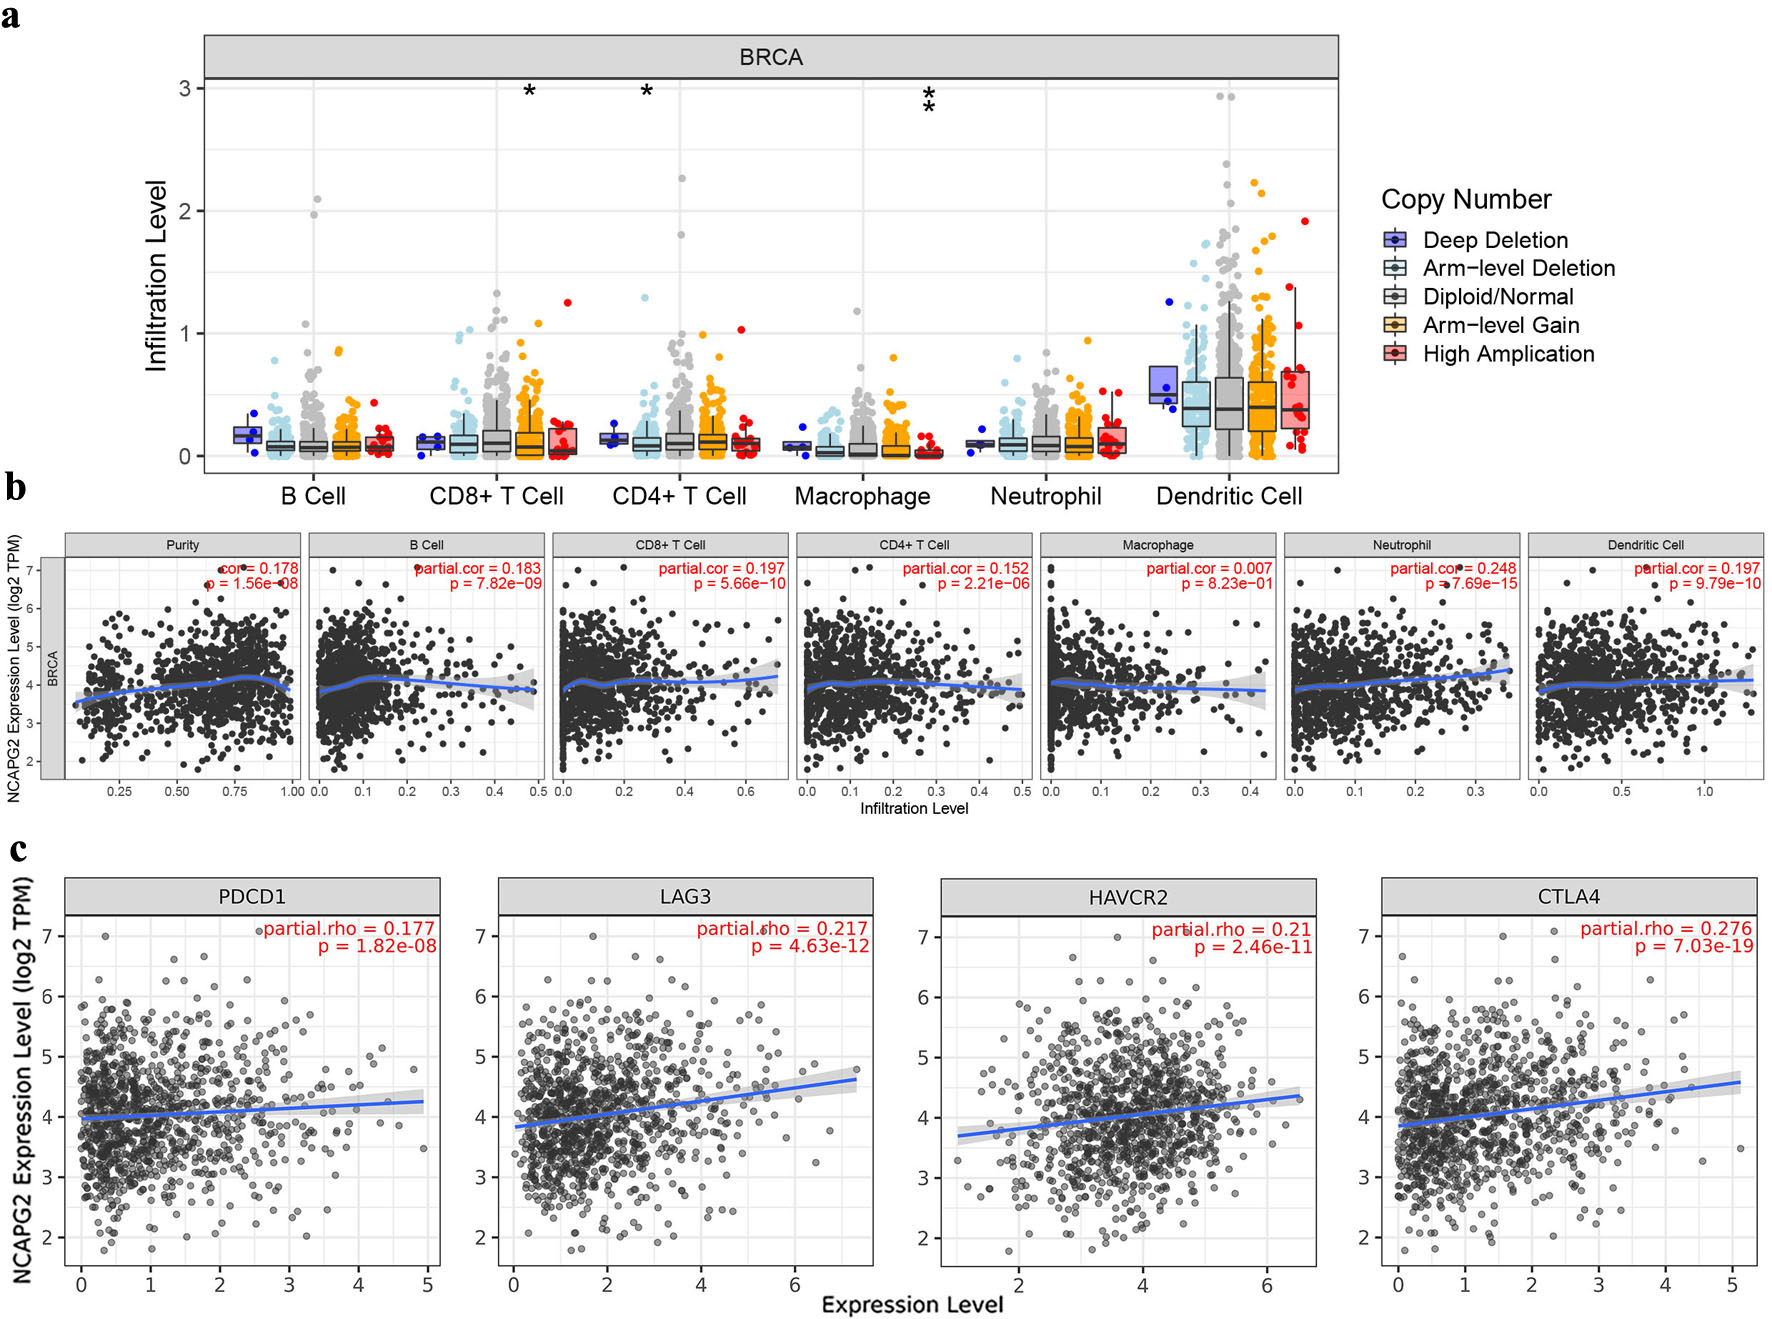
↓ Figure 8. Association between NCAPG2 and immune infiltration in BRCA. (a) The correlation of the copy number of NCAPG2 and the infiltration levels of six immune cells. (b) The correlation between NCAPG2 expression and the infiltration levels of the immune cells. (c) The association of NCAPG2 expression and PD-1 (PDCD1), LAG3, TIM-3 (HAVCR2), and CTLA4.
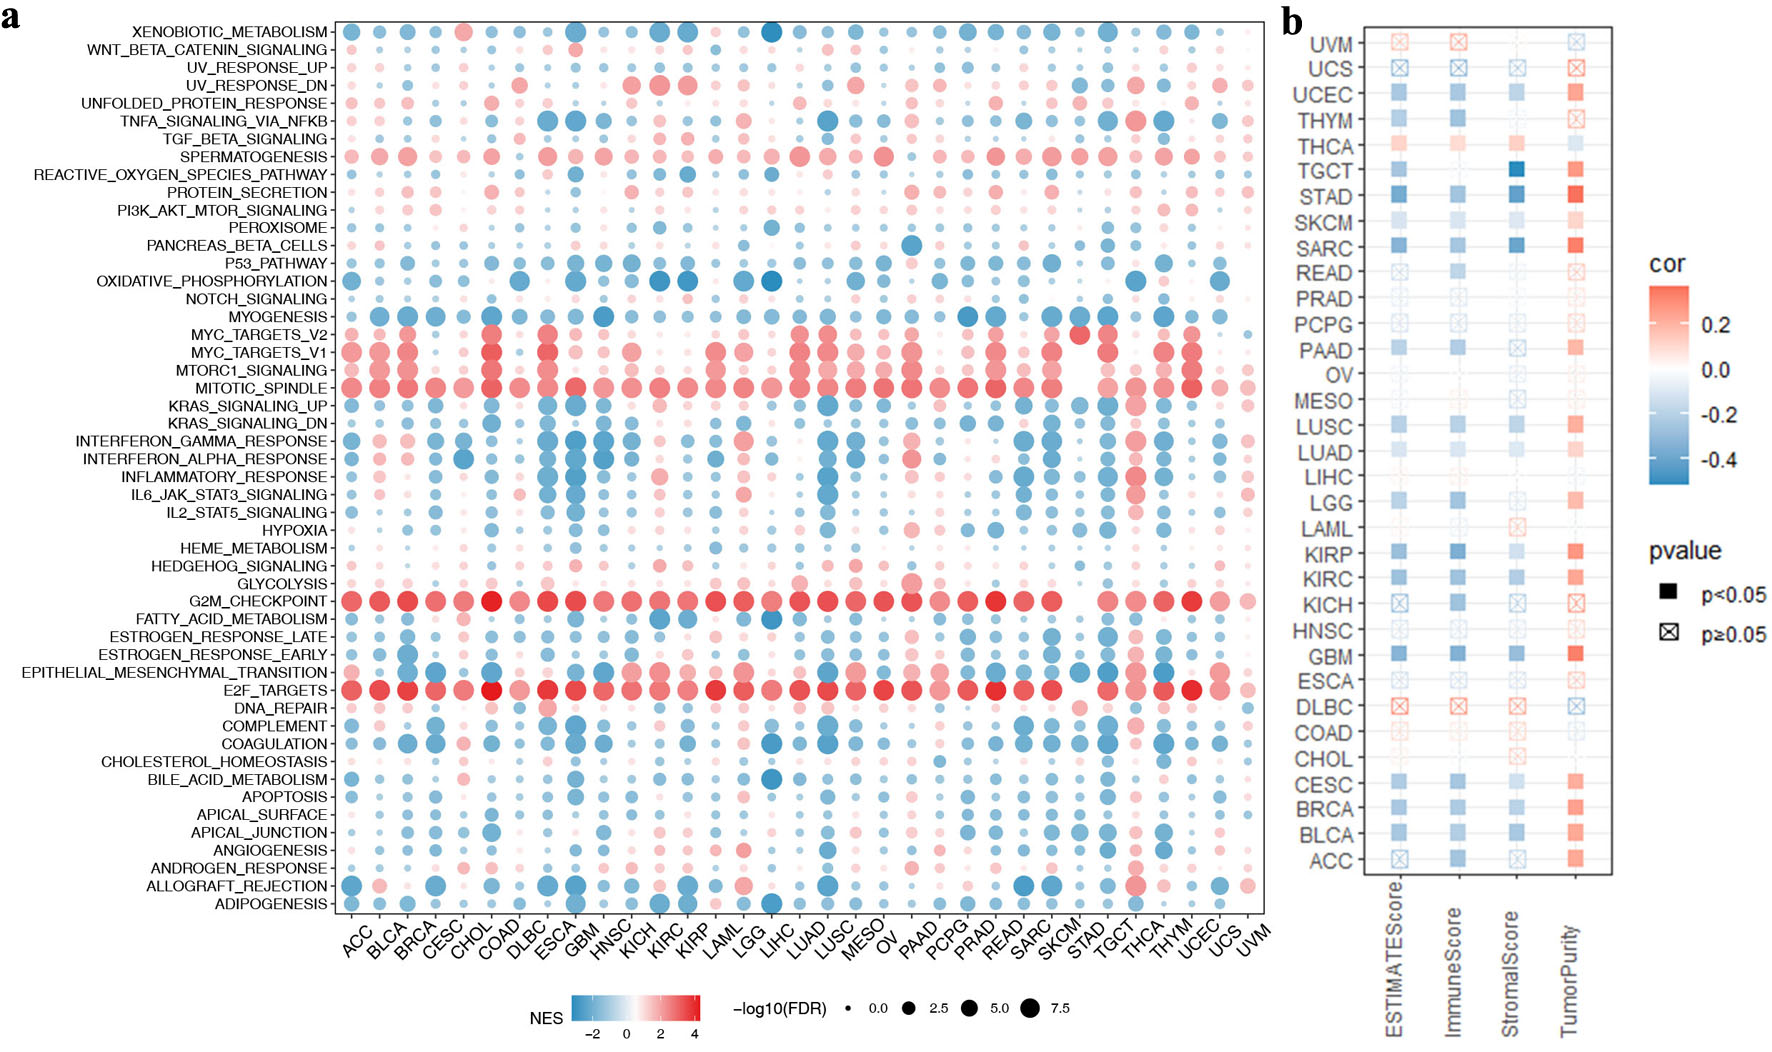
↓ Figure 9. Associations between the NCAPG2 expression and immune landscape in pan-cancers. (a) The association between NCAPG2 expression and cancer-related pathways in pan-cancers. (b) The association between NCAPG2 expression and immune landscape in pan-cancers.
Table
↓ Table 1. The Correlation Between NCAPG2 Expression and the Molecular Markers of Immunological Cells
| Description | Gene markers | BRCA (n = 1,093) |
|---|
| None | Purity |
|---|
| cor | P | cor | P |
|---|
| CD8+ T cell | CD8A | 0.055 | 0.0663 | 0.188 | *** |
| CD8B | 0.019 | 0.532 | 0.139 | *** |
| T cell (general) | CD3D | −0.005 | 0.861 | 0.119 | *** |
| CD3E | 0.013 | 0.66 | 0.147 | *** |
| CD2 | 0.067 | 0.0273 | 0.201 | *** |
| B cell | CD19 | 0.015 | 0.614 | 0.105 | *** |
| CD79A | −0.009 | 0.775 | 0.092 | ** |
| Monocyte | CD86 | 0.137 | *** | 0.226 | *** |
| CD115 (CSF1R) | −0.025 | 0.413 | 0.059 | 0.0609 |
| TAM | CCL2 | 0.093 | ** | 0.183 | *** |
| CD68 | 0.119 | *** | 0.193 | *** |
| IL10 | 0.202 | *** | 0.287 | *** |
| M1 macrophage | INOS (NOS2) | 0.16 | *** | 0.118 | *** |
| IRF5 | 0.058 | 0.0543 | 0.209 | *** |
| COX2 (PTGS2) | 0.14 | *** | 0.144 | * |
| M2 macrophage | CD163 | 0.238 | *** | 0.323 | *** |
| VSIG4 | 0.036 | 0.227 | 0.107 | *** |
| MS4A4A | 0.116 | *** | 0.219 | *** |
| Neutrophils | CD66B (CEACAM8) | 0.054 | 0.0738 | 0.046 | 0.151 |
| CD11B (ITGAM) | 0.075 | 0.0133 | 0.138 | *** |
| CCR7 | 0.048 | 0.11 | 0.17 | *** |
| Natural killer cell | KIR2DL1 | 0.056 | 0.062 | 0.111 | *** |
| KIR2DL3 | 0.131 | *** | 0.178 | *** |
| KIR2DL4 | 0.158 | *** | 0.224 | *** |
| KIR3DL1 | 0.107 | *** | 0.164 | *** |
| KIR3DL2 | 0.089 | ** | 0.174 | *** |
| KIR3DL3 | 0.078 | ** | 0.112 | *** |
| KIR2DS4 | 0.08 | ** | 0.14 | *** |
| Dendritic cell | HLA-DPB1 | −0.167 | *** | -0.084 | ** |
| HLA-DQB1 | −0.066 | 0.0285 | 0.007 | 0.815 |
| HLA-DRA | 0.015 | 0.619 | 0.122 | *** |
| HLA-DPA1 | −0.044 | 0.142 | 0.054 | 0.0917 |
| BDCA-1 (CD1C) | −0.132 | *** | −0.056 | 0.078 |
| BDCA-4 (NRP1) | 0.027 | 0.375 | 0.104 | *** |
| CD11c (ITGAX) | 0.072 | 0.0166 | 0.16 | *** |
| Th1 | T-bet (TBX21) | 0.04 | 0.19 | 0.168 | *** |
| STAT4 | 0.057 | 0.0589 | 0.181 | *** |
| STAT1 | 0.343 | *** | 0.181 | *** |
| IFN-γ (IFNG) | 0.138 | *** | 0.389 | *** |
| TNF-α (TNF) | 0.215 | *** | 0.231 | *** |
| Th2 | GATA3 | −0.08 | * | 0.252 | *** |
| STAT6 | 0.017 | 0.584 | 0.003 | 0.917 |
| STAT5A | −0.046 | * | −0.08 | ** |
| IL13 | 0.07 | * | 0.051 | 0.0896 |
| Tfh | BCL6 | −0.03 | 0.317 | −0.009 | 0.767 |
| IL21 | 0.177 | *** | 0.228 | *** |
| Th17 | STAT3 | 0.168 | *** | 0.185 | *** |
| IL17A | 0.091 | ** | 0.134 | ** |
| Treg | FOXP3 | 0.189 | *** | 0.292 | *** |
| CCR8 | 0.327 | *** | 0.405 | *** |
| STAT5B | 0.01 | 0.733 | 0.039 | 0.215 |
| TGF-β (TGFB1) | −0.199 | *** | −0.127 | *** |