Figures
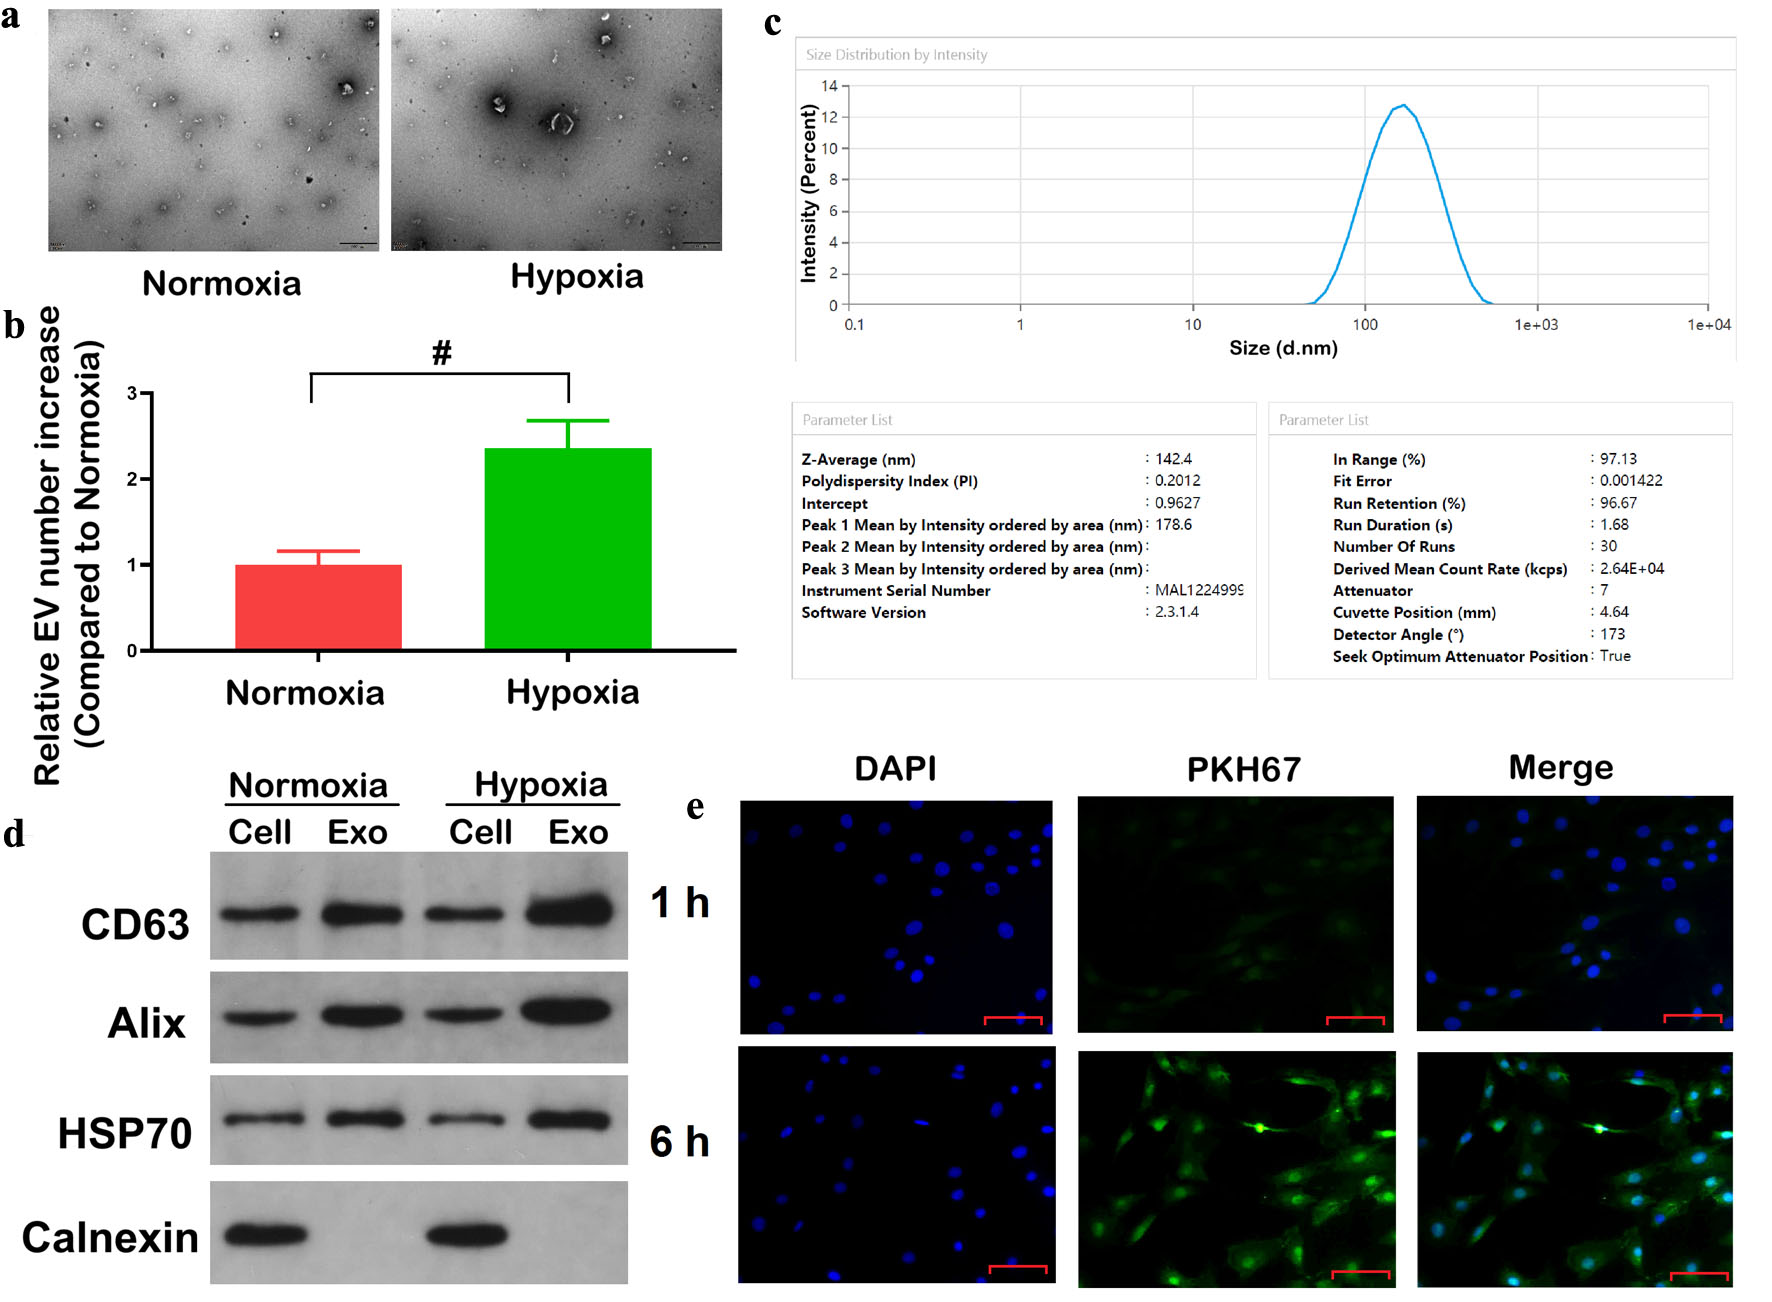
↓ Figure 1. Hypoxia promotes exosome secretion from colorectal cancer cells. (a) TEM of exosomes derived from HCT116 cells under normoxic and hypoxic conditions. Scale bar = 500 nm. (b) Quantification of relative exosomes numbers under normoxia and hypoxia by NTA. (c) Size distribution and mean diameter of isolated exosomes determined by DLS. (d) The protein levels of exosomal markers (CD63, Alix, HSP70) and negative control Calnexin in cell lysates and exosomal fractions. (e) The co-culture of PKH67-labelled exosome samples derived from hypoxic HCT116 cells with HCT116 cells was conducted over a period of 1 and 6 h. Scale bar = 50 µm. Confocal microscopy showed internalization of exosomes (green) into DAPI-stained cells (blue). Data are presented as mean ± SD (n = 3 independent experiments). #P < 0.05 between normoxic and hypoxia groups. TEM: transmission electron microscopy; NTA: nanoparticle tracking analysis; DLS: dynamic light scattering; DAPI: 4',6-diamidino-2-phenylindole.
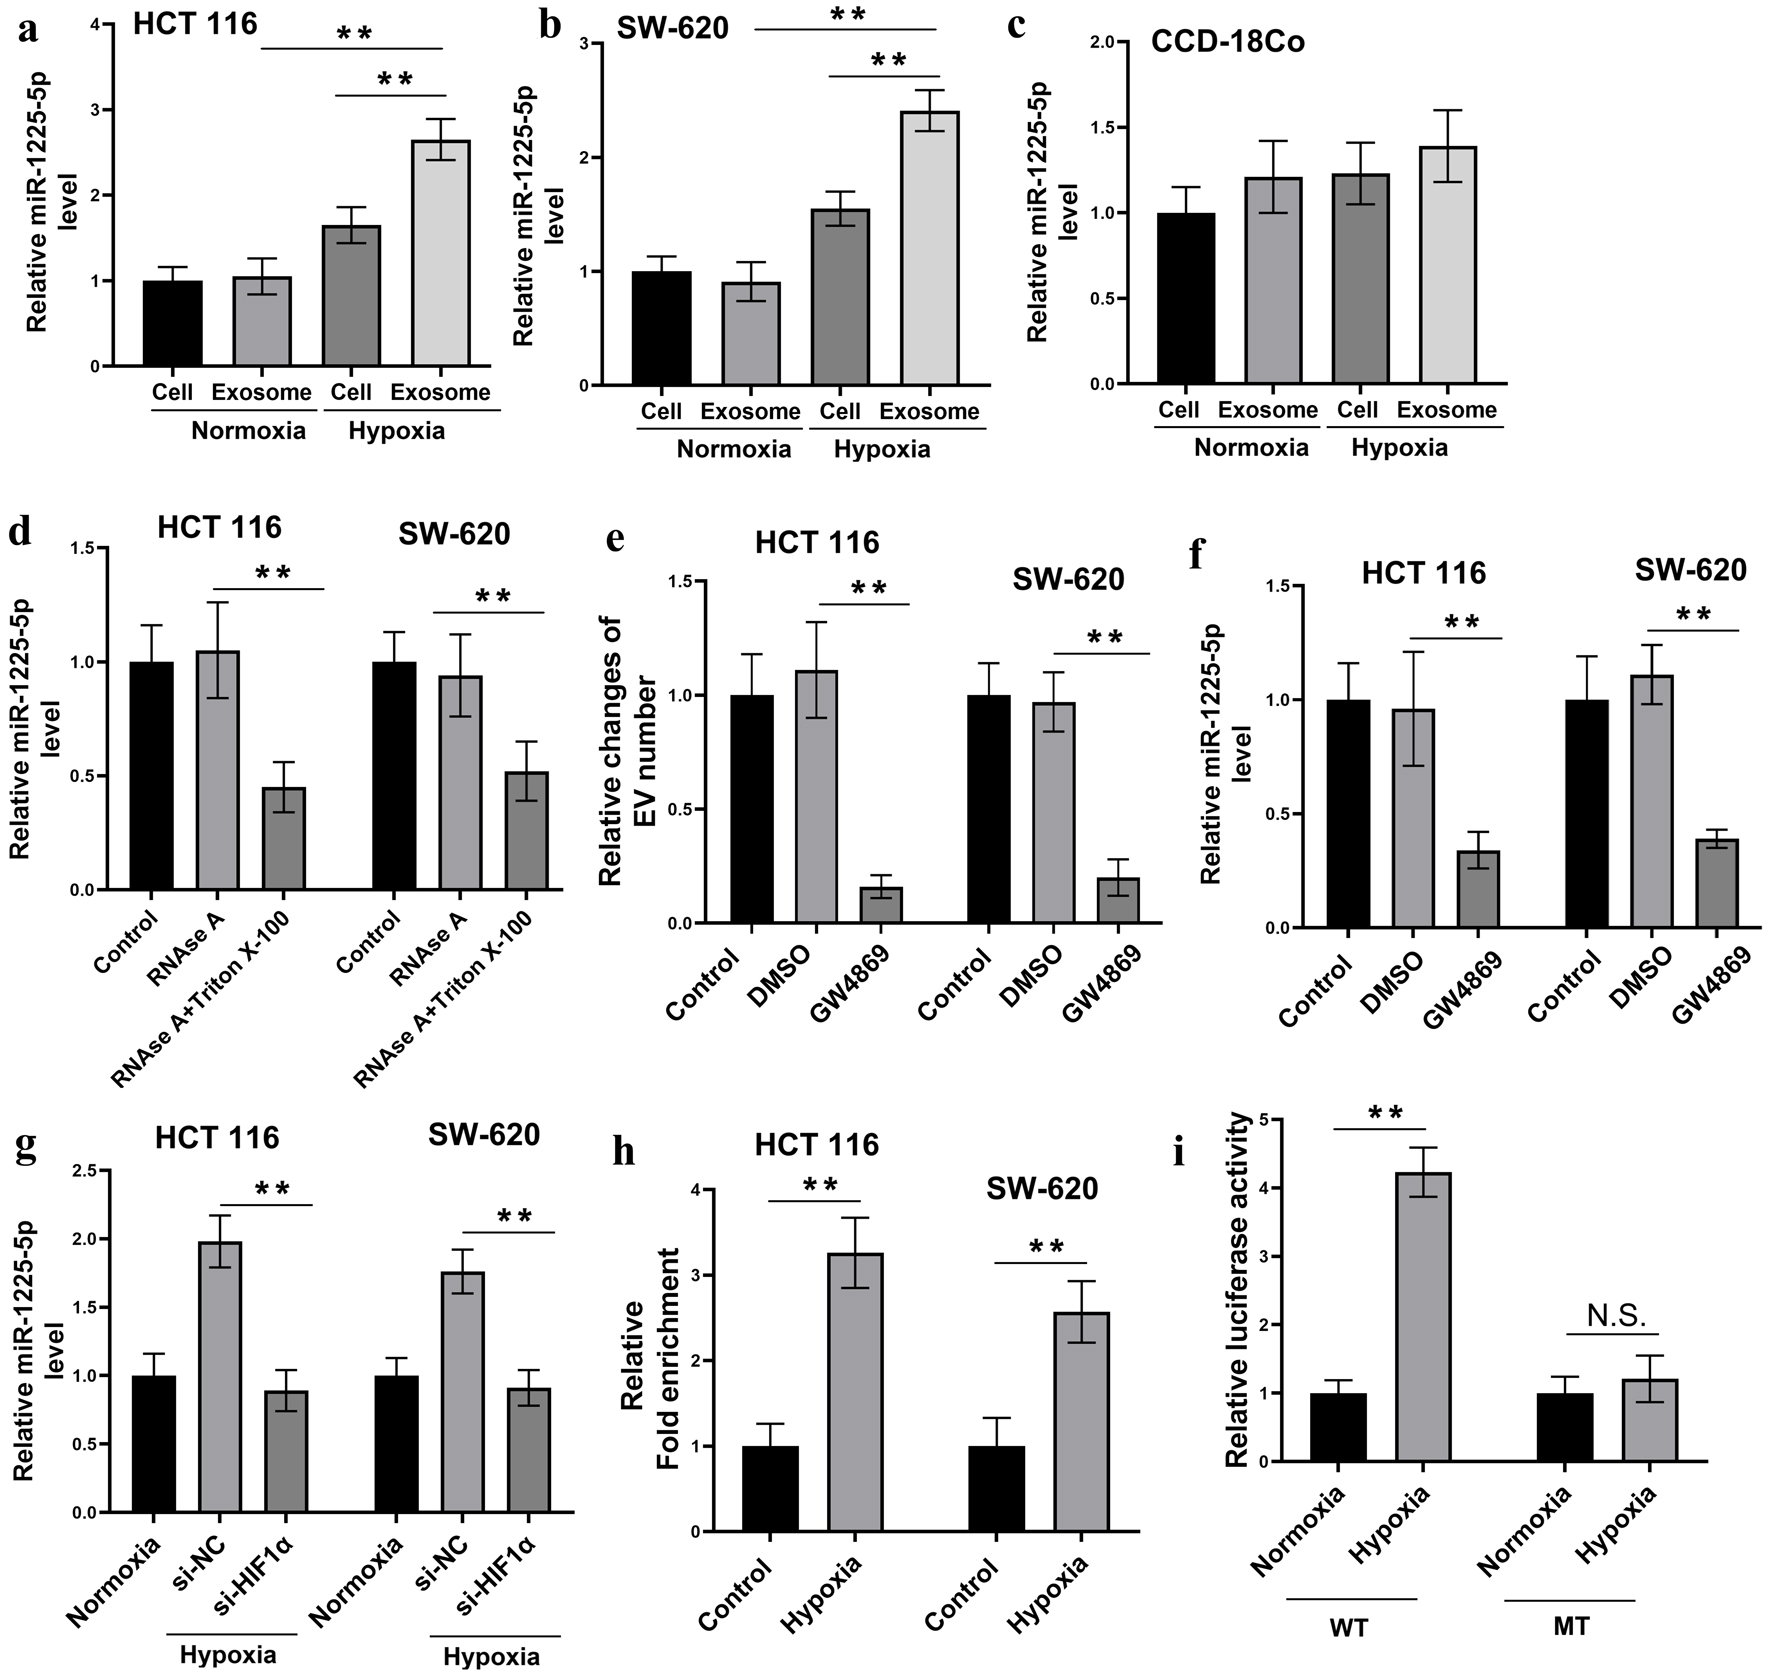
↓ Figure 2. Hypoxia promotes exosomal secretion of miR-1225-5p in CRC cells. (a–c) Relative expression levels of miR-1225-5p in HCT116 (a), SW620 (b) and CCD-18Co (c) cells and their exosomes under normoxic and hypoxic conditions, measured by qRT-PCR. (d) Conditioned media from HCT116 and SW620 cells were treated with RNase A or RNase A + Triton X-100. The results of the QRT-PCR analysis showed that miR-1225-5p levels were not affected by RNase A alone, but were significantly decreased by RNase A + Triton X-100. (e) Relative changes of EV numbers in CM after CRC cells were treated with the exosome secretion inhibitor GW4869 or vehicle control (DMSO). (f) CRC cells were treated with GW4869 or DMSO. The qRT-PCR analysis revealed reduced miR-1225-5p levels in CM after GW4869 treatment. (g) The levels of miR-1225-5p after siRNA was used to knock down the expression of HIF-1α under hypoxia condition. (h, i) The direct transcriptional regulation via HIF-1α binding to the miR-1225-5p promoter was verified by CHIP assay (h) and the luciferase activity assay (i). Data are presented as mean ± SD (n = 3 independent experiments). **P < 0.01 between indicated groups. CRC: colorectal cancer; qRT-PCR: quantitative real-time polymerase chain reaction; CM: conditioned medium; DMSO: dimethyl sulfoxide; siRNA: small interfering RNA; HIF-1α: hypoxia-inducible factor 1-alpha; ChIP: chromatin immunoprecipitation; NC: negative control.
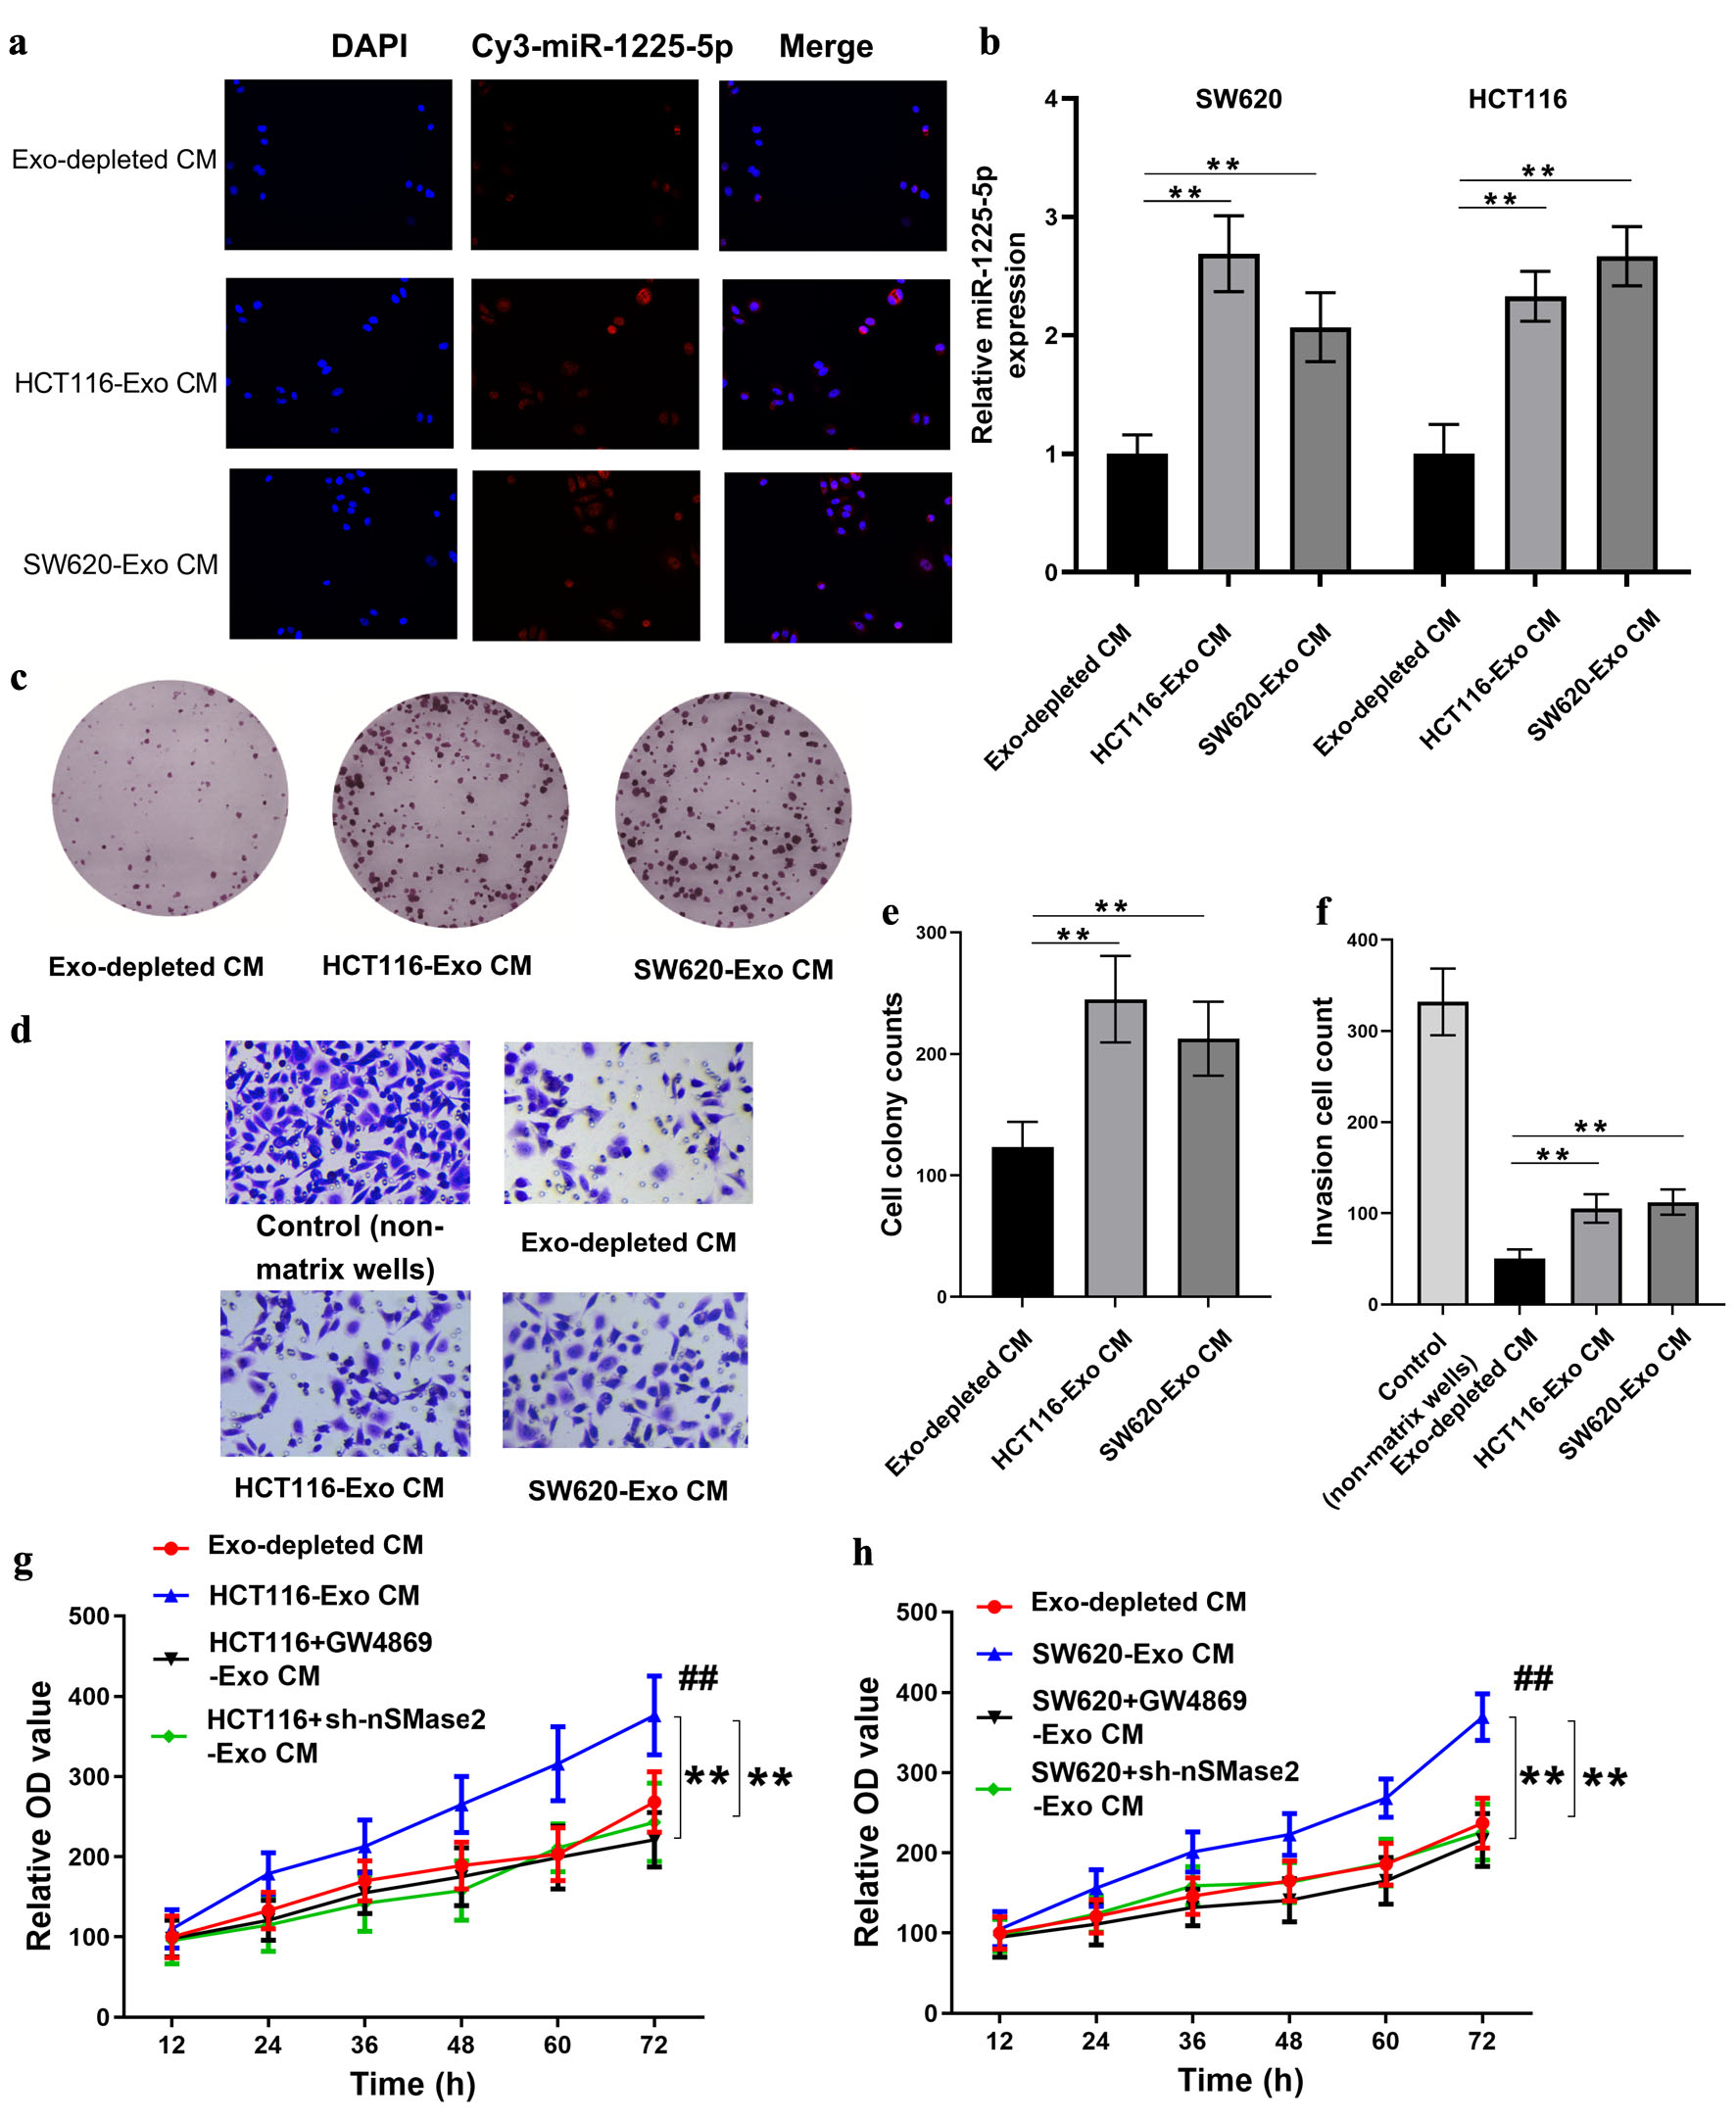
↓ Figure 3. Exosomal miR-1225-5p is transferred into recipient CRC cells and induces cell aggressiveness. (a) Fluorescence microscopy of HCT116 cells after co-culture with Cy3-labeled miR-1225-5p exosomes derived from HCT116 or SW620 cells. Red fluorescence indicated miR-1225-5p transfer. (b) The intracellular miR-1225-5p levels in CRC cells after treatment with exosome-depleted CM or exosomes-containing CM from HCT116 or SW620 cells. (c, e) Colony formation assay and quantification showing increased proliferation after exosomal treatment. (d, f) Transwell invasion assay and quantification showing enhanced invasive capacity in recipient cells exposed to exosomes-containing CM. (g, h) Cell viability was assessed by CCK-8 assay to evaluate the effect of GW4869 and sh-nSMase2. **P < 0.01 between indicated groups. Data are presented as mean ± SD (n = 3 independent experiments). ##P < 0.01 compared to Exo-depleted CM. CRC: colorectal cancer; Exo: exosomes; Exo-CM: exosome-containing conditioned medium; Exo-depleted CM: exosome-depleted conditioned medium; CCK-8: cell counting kit-8; sh: short hairpin RNA; NC: negative control.
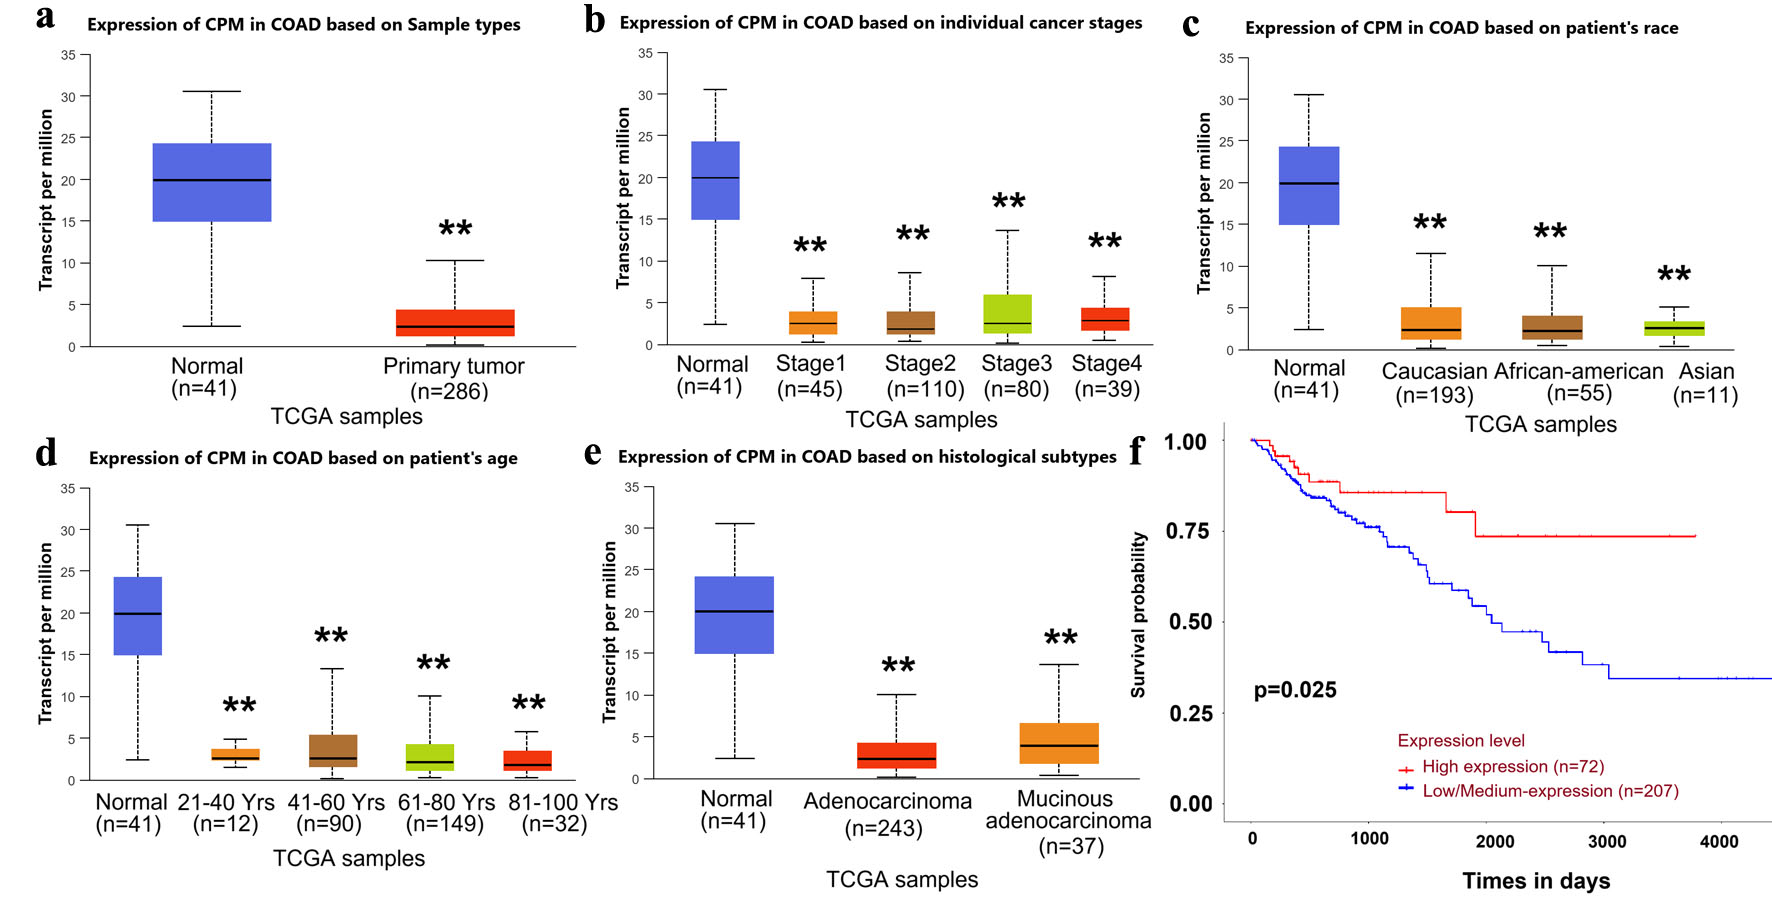
↓ Figure 4. Bioinformatic analysis reveals low CPM expression in CRC and its association with poor prognosis. (a) CPM expression in normal compared with primary tumor samples (TCGA-COAD dataset). (b) CPM expression stratified by tumor stage. (c) CPM expression based on patient race. (d) CPM expression in different age groups. (e) CPM expression across histological subtypes. (f) Kaplan–Meier curves comparing overall survival in CRC patients with high and low/medium CPM expression levels. Data are presented as mean ± SD. **P < 0.01 between indicated groups. CRC: colorectal cancer; CPM: carboxypeptidase M; TCGA-COAD: The Cancer Genome Atlas-Colon Adenocarcinoma.
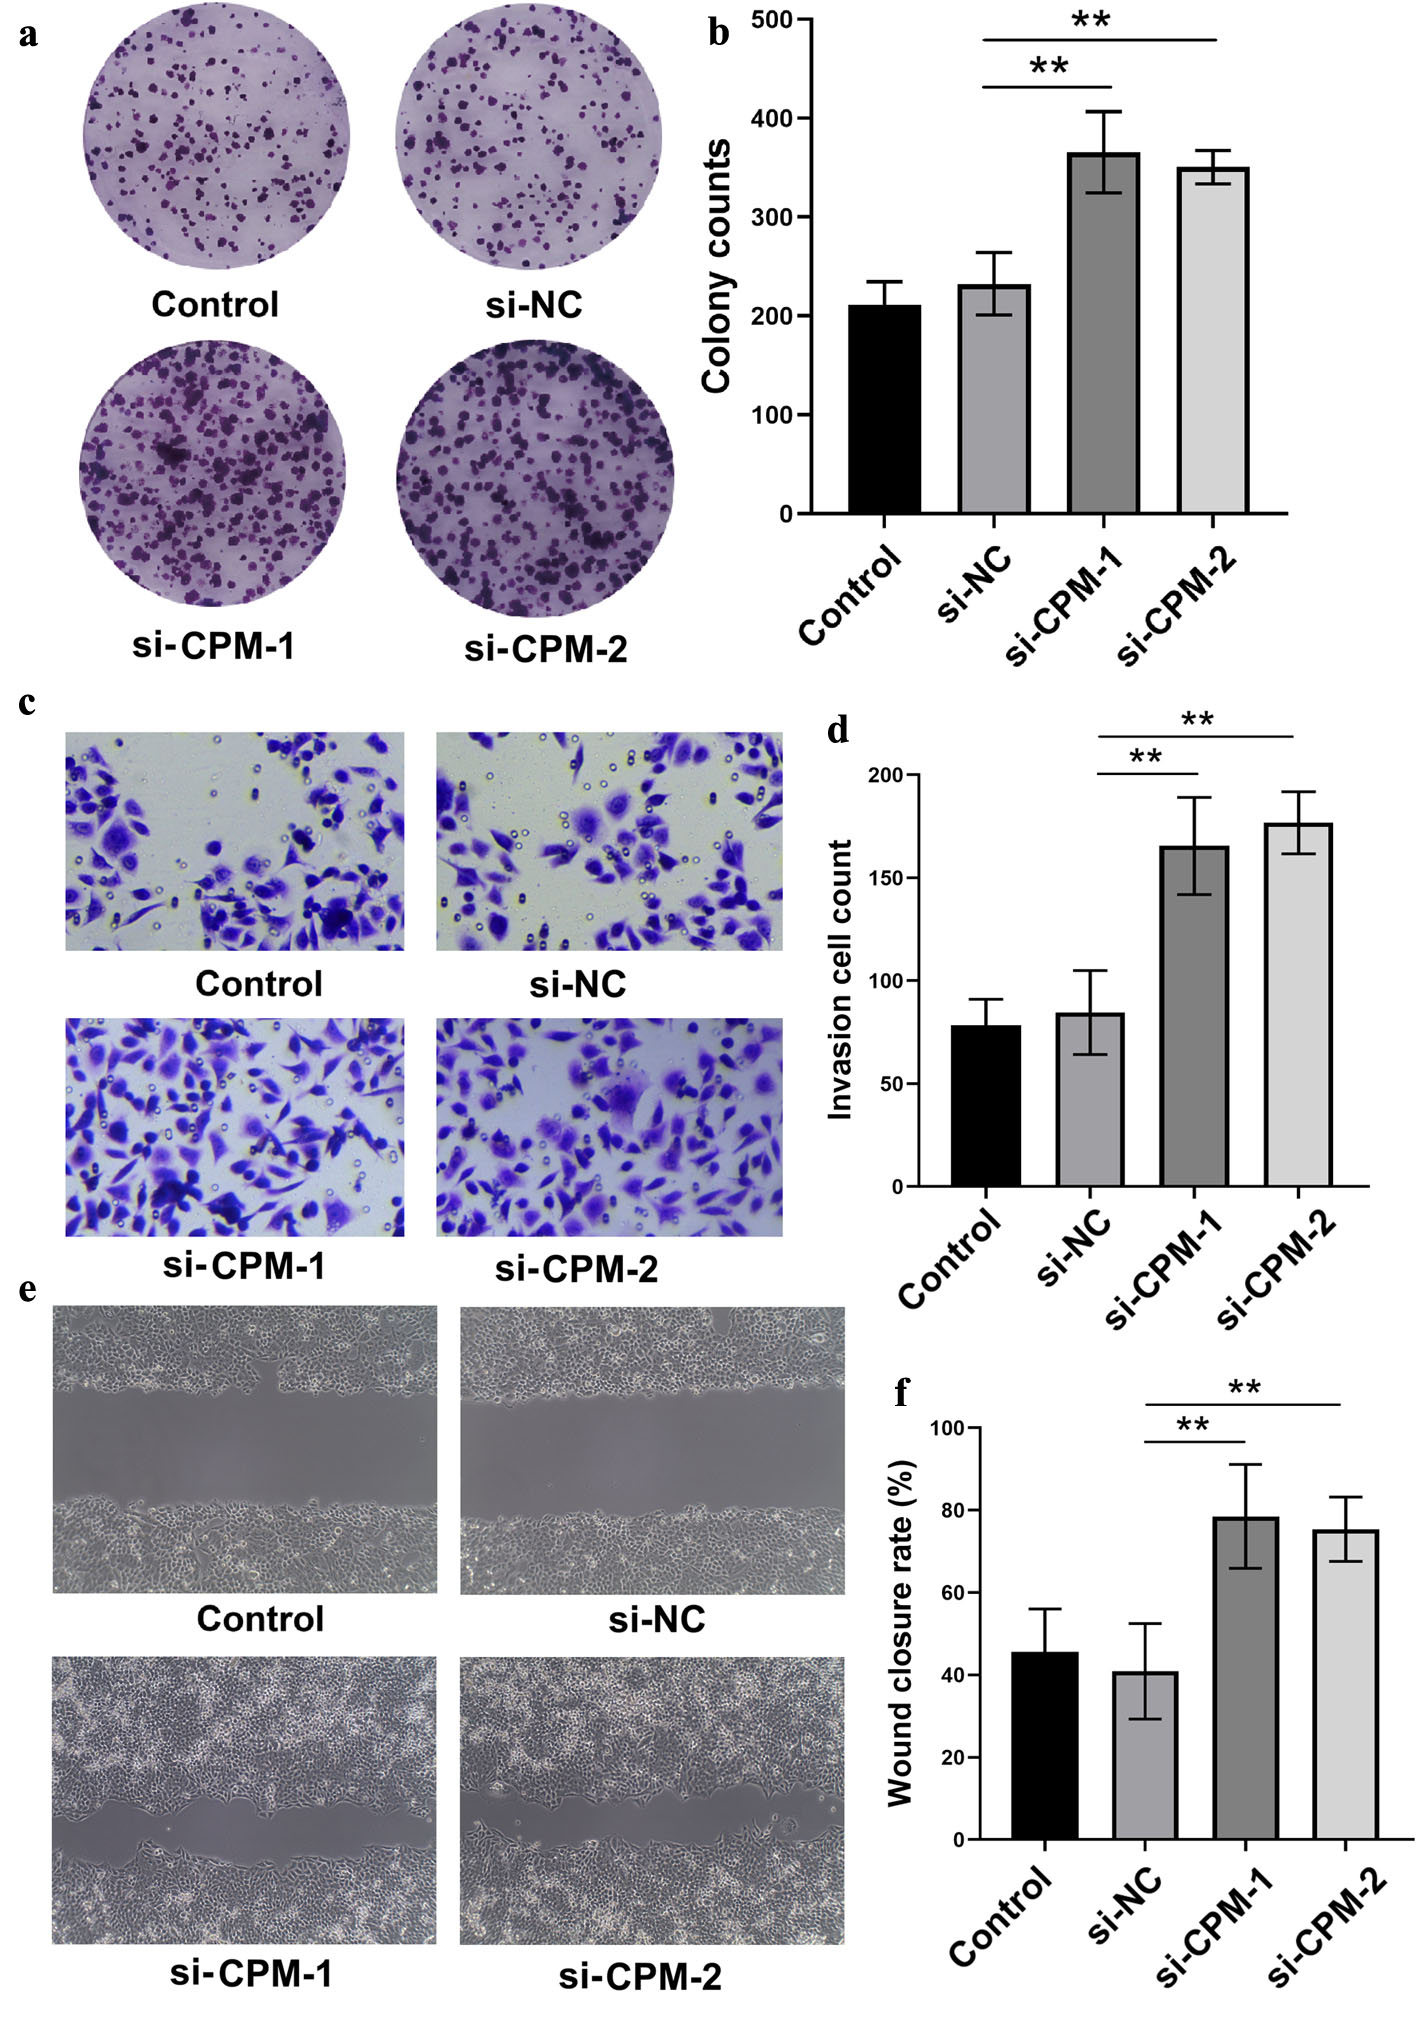
↓ Figure 5. Knockdown of CPM facilitates CRC cell aggressiveness. (a, b) Colony formation assay and quantification in SW620 cells after transfection with si-CPM or control siRNA. (c, d) Transwell invasion assay showing increased invasive cell counts upon CPM knockdown. (e, f) Wound healing assay showing enhanced cell migration following CPM silencing. **P < 0.01 between indicated groups. CRC: colorectal cancer; CPM: carboxypeptidase M; siRNA/si: small interfering RNA; NC: negative control; KD: knockdown.
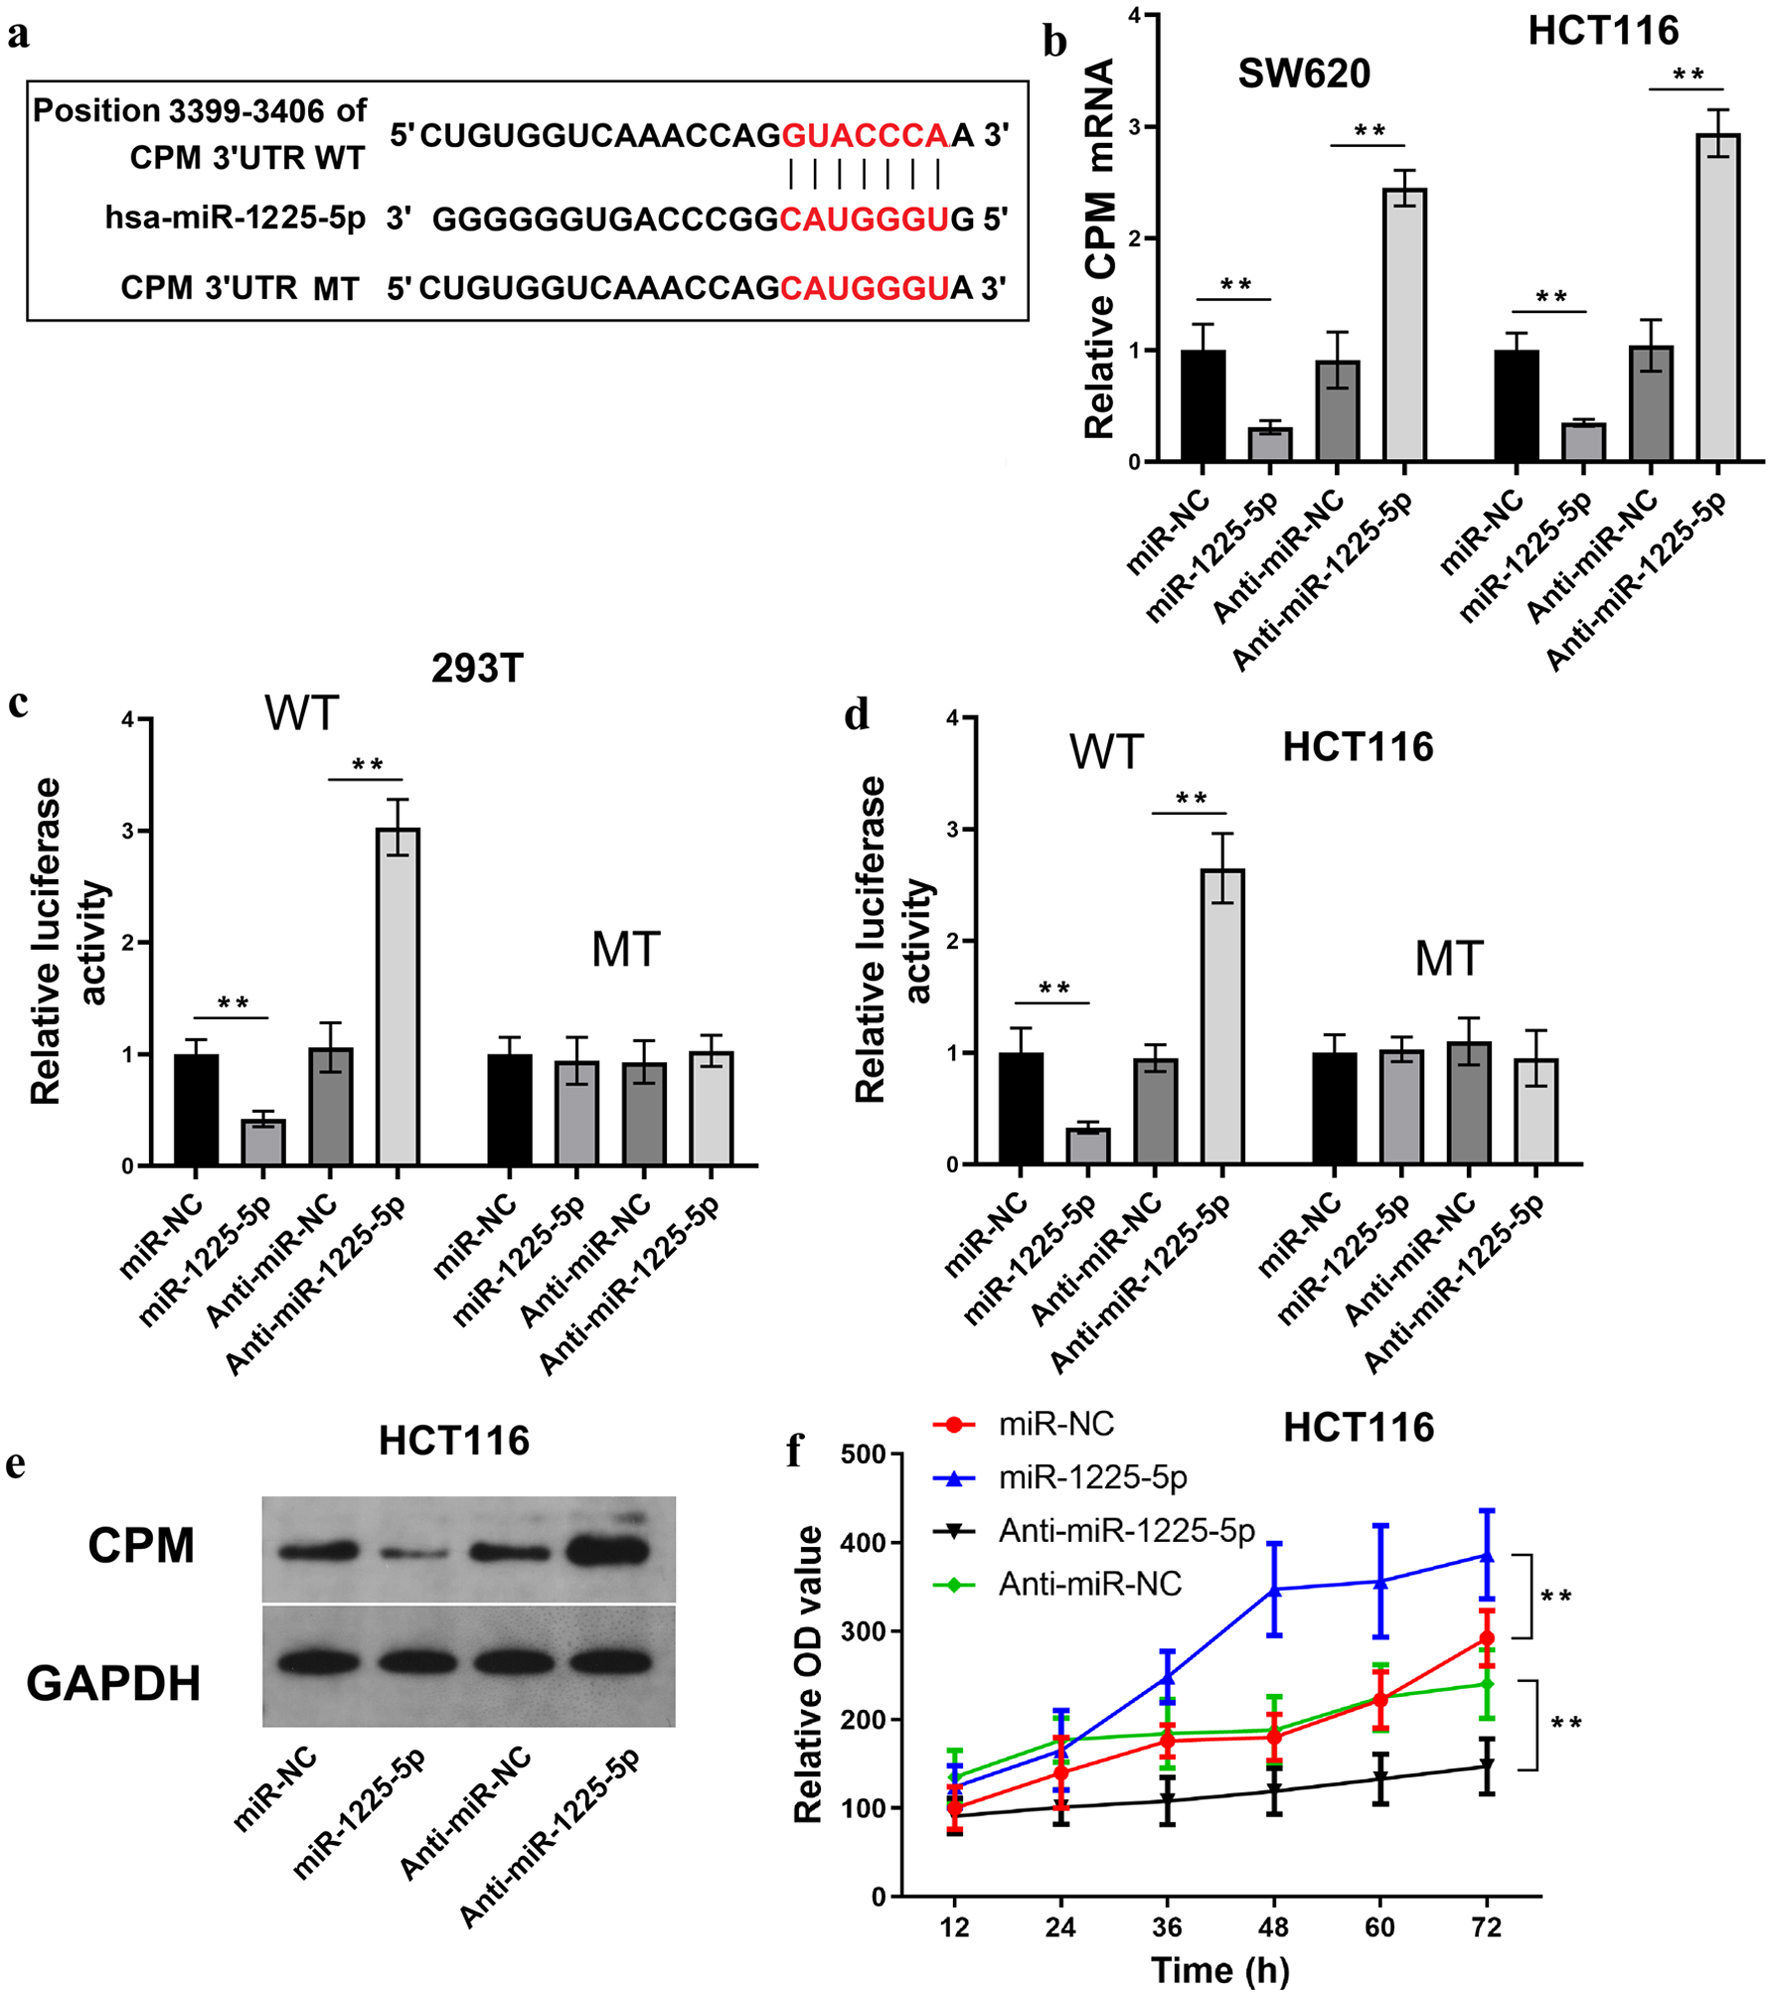
↓ Figure 6. MiR-1225-5p facilitates CRC cell proliferation by directly targeting CPM. (a) Predicted binding site of miR-1225-5p in the CPM 3'UTR and the sequence of the mutant construct. (b) Relative CPM mRNA levels in SW620 and HCT116 cells transfected with miR-1225-5p mimic or inhibitor. (c, d) Luciferase reporter assays in 293T and HCT116 cells co-transfected with miR-1225-5p mimic or inhibitor and WT or MT CPM 3'UTR constructs. (e) Protein levels of CPM in HCT116 cells after miR-1225-5p modulation. (f) CCK-8 proliferation assays in HCT116 cells transfected with miR-1225-5p mimic or inhibitor. Data are presented as mean ± SD (n = 3 independent experiments). **P < 0.01 between indicated groups. CRC: colorectal cancer; CPM: carboxypeptidase M; UTR: untranslated region; WT: wild-type; MT: mutant; CCK-8: cell counting kit-8; NC: negative control.
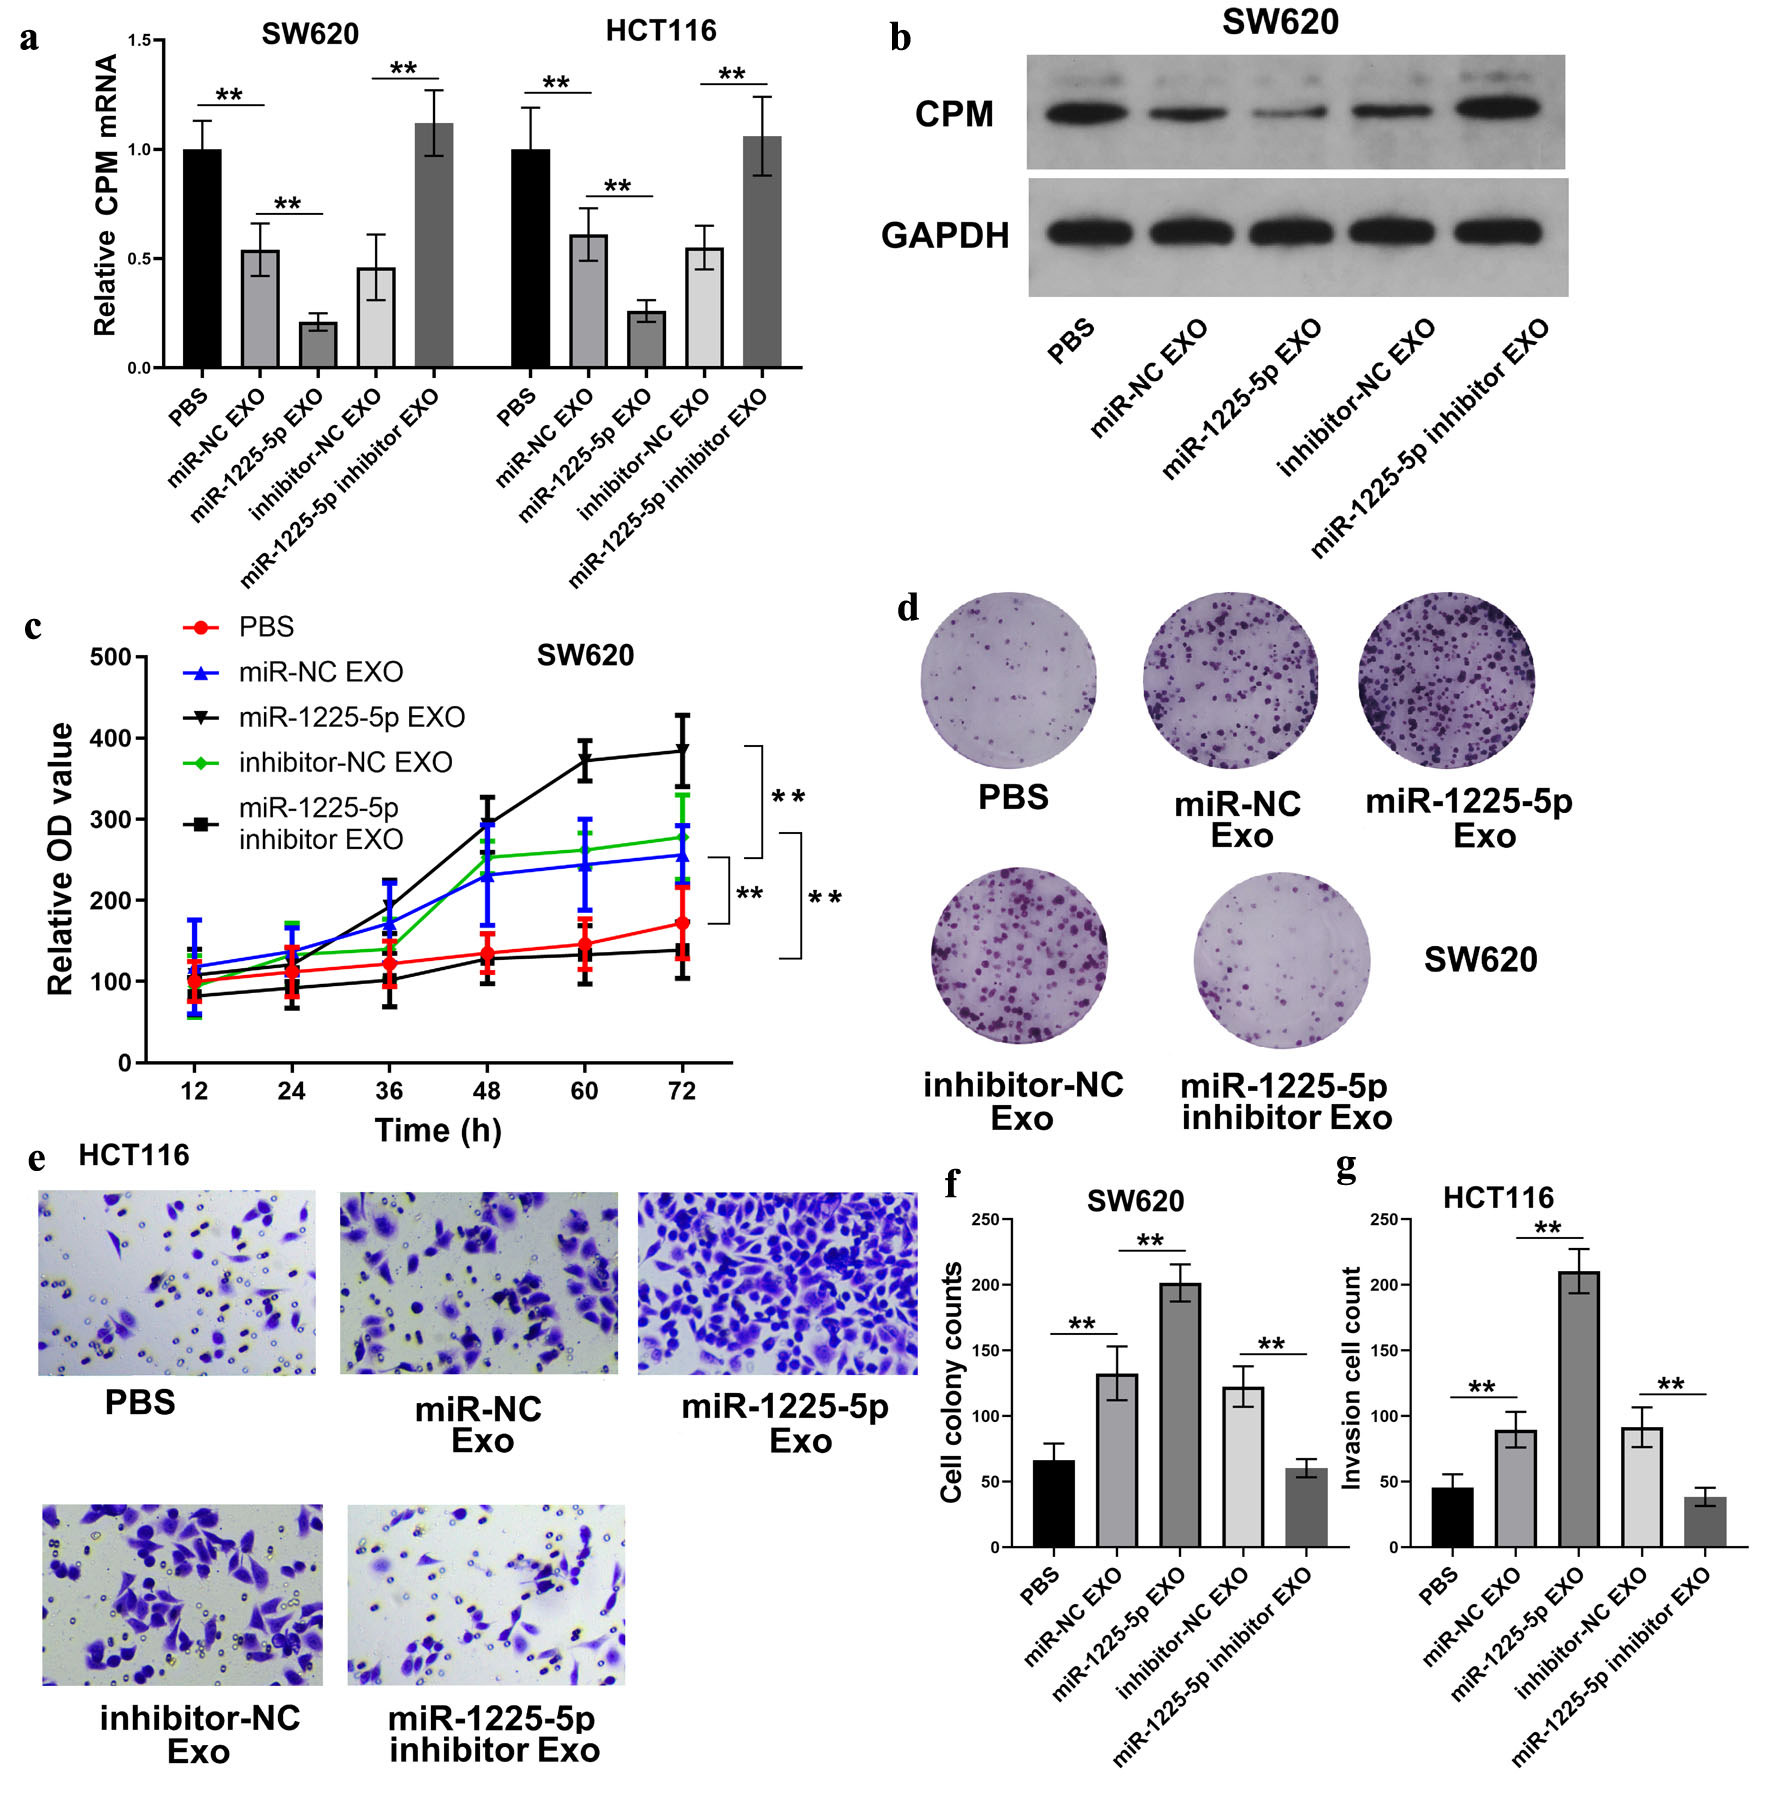
↓ Figure 7. Exosomal miR-1225-5p promotes CRC cell malignancy via CPM suppression. (a) CPM mRNA levels in CRC cells exposed to exosomes from hypoxia-conditioned SW620 cells that were transfected with miR-1225-5p mimic or inhibitor. (b) Protein levels of CPM in SW620 cells treated with corresponding exosomes. (c) CCK-8 assays showing SW620 cell proliferation after exosome treatment. (d, f) Colony formation assays and quantification in SW620 cells. (e, g) Transwell invasion assays and quantification in HCT116 cells. Data are presented as mean ± SD (n = 3 independent experiments). **P < 0.01 between indicated groups. CRC: colorectal cancer; CPM: carboxypeptidase M; CCK-8: cell counting kit-8; Exo: exosomes; CM: conditioned medium; NC: negative control.
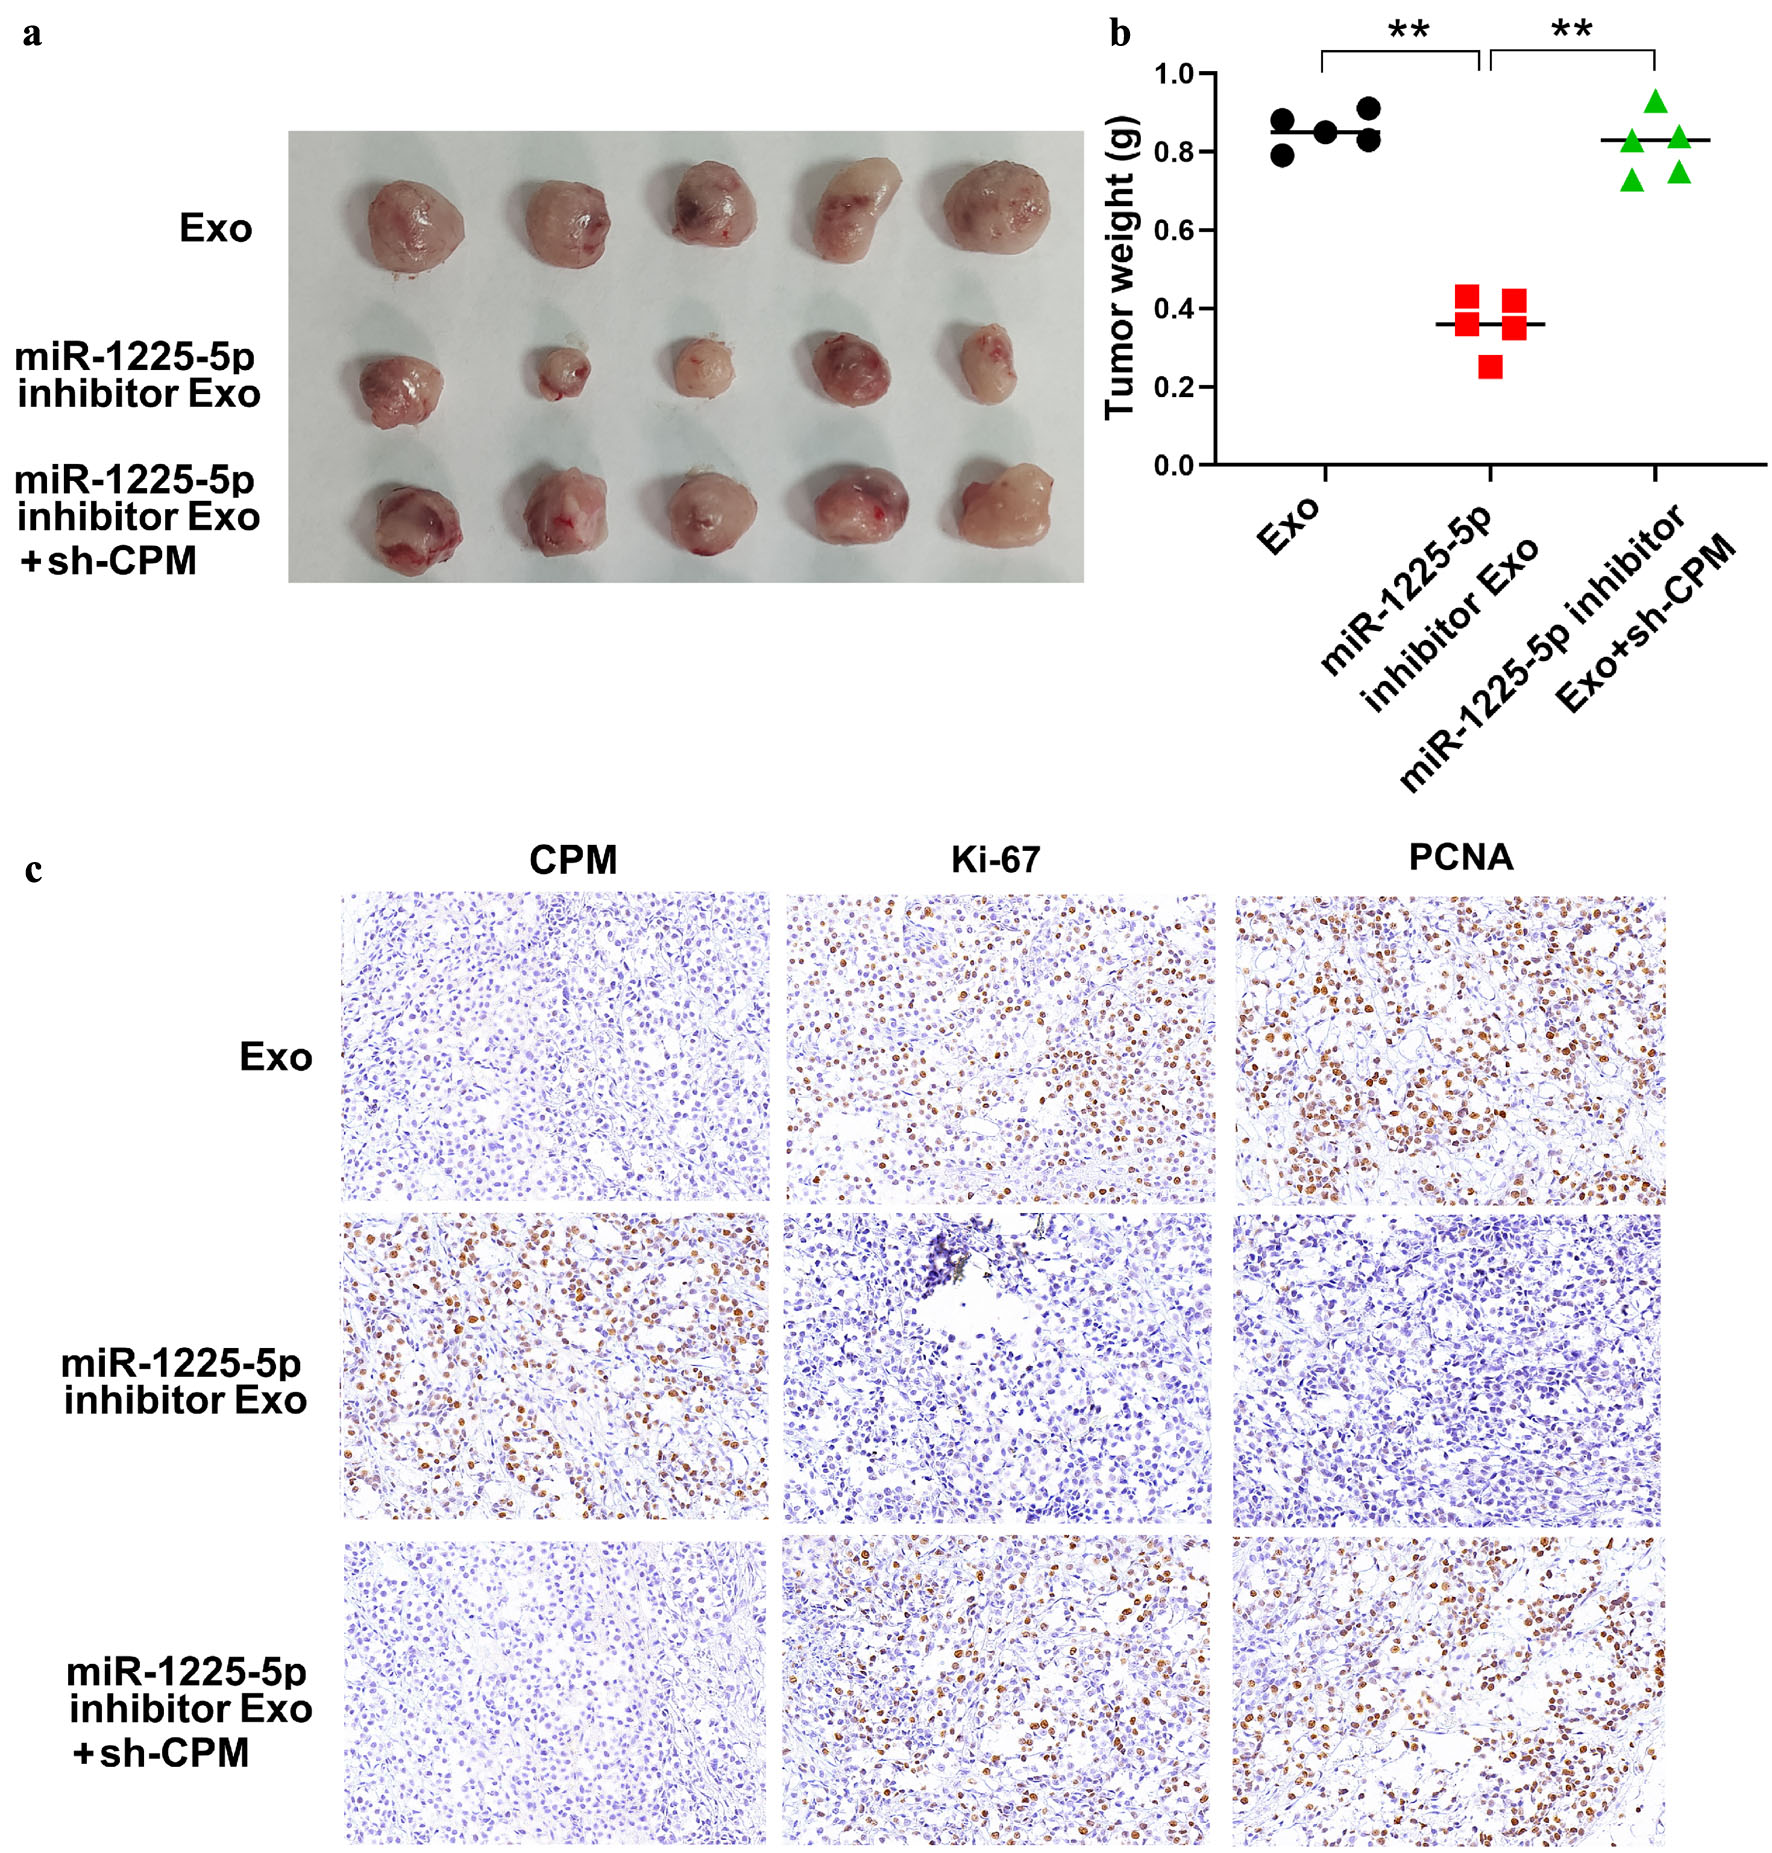
↓ Figure 8. In vivo experiments revealed the role of exosome-derived miR-1225-5p and CPM in tumor growth. (a) Images of tumors from three groups in tumor xenograft experiments. (b) The result of tumor weight measurement. (c) Representative images of the IHC assays of CPM, Ki-67, and PCNA in tumor tissue in tumor xenograft experiments. Exo: the tumors were implanted with normal SW620 cells and injected with exosomes from hypoxia-exposed SW620 cells; miR-1225-5p inhibitor Exo: the tumors were implanted with normal SW620 cells and injected with exosomes from hypoxia-exposed SW620 cells transfected with a miR-1225-5p inhibitor; miR-1225-5p inhibitor Exo+sh-CPM: the tumors were implanted with SW620 cells pretreated with sh-CPM and injected with exosomes from hypoxia-exposed SW620 cells co-transfected with the miR-1225-5p inhibitor. Data are presented as mean ± SD (n = 5 mice per group). **P < 0.01 between indicated groups. IHC: immunohistochemistry; CPM: carboxypeptidase M; PCNA: proliferating cell nuclear antigen; Exo: exosomes; sh: short hairpin RNA; NC: negative control; KD: knockdown.