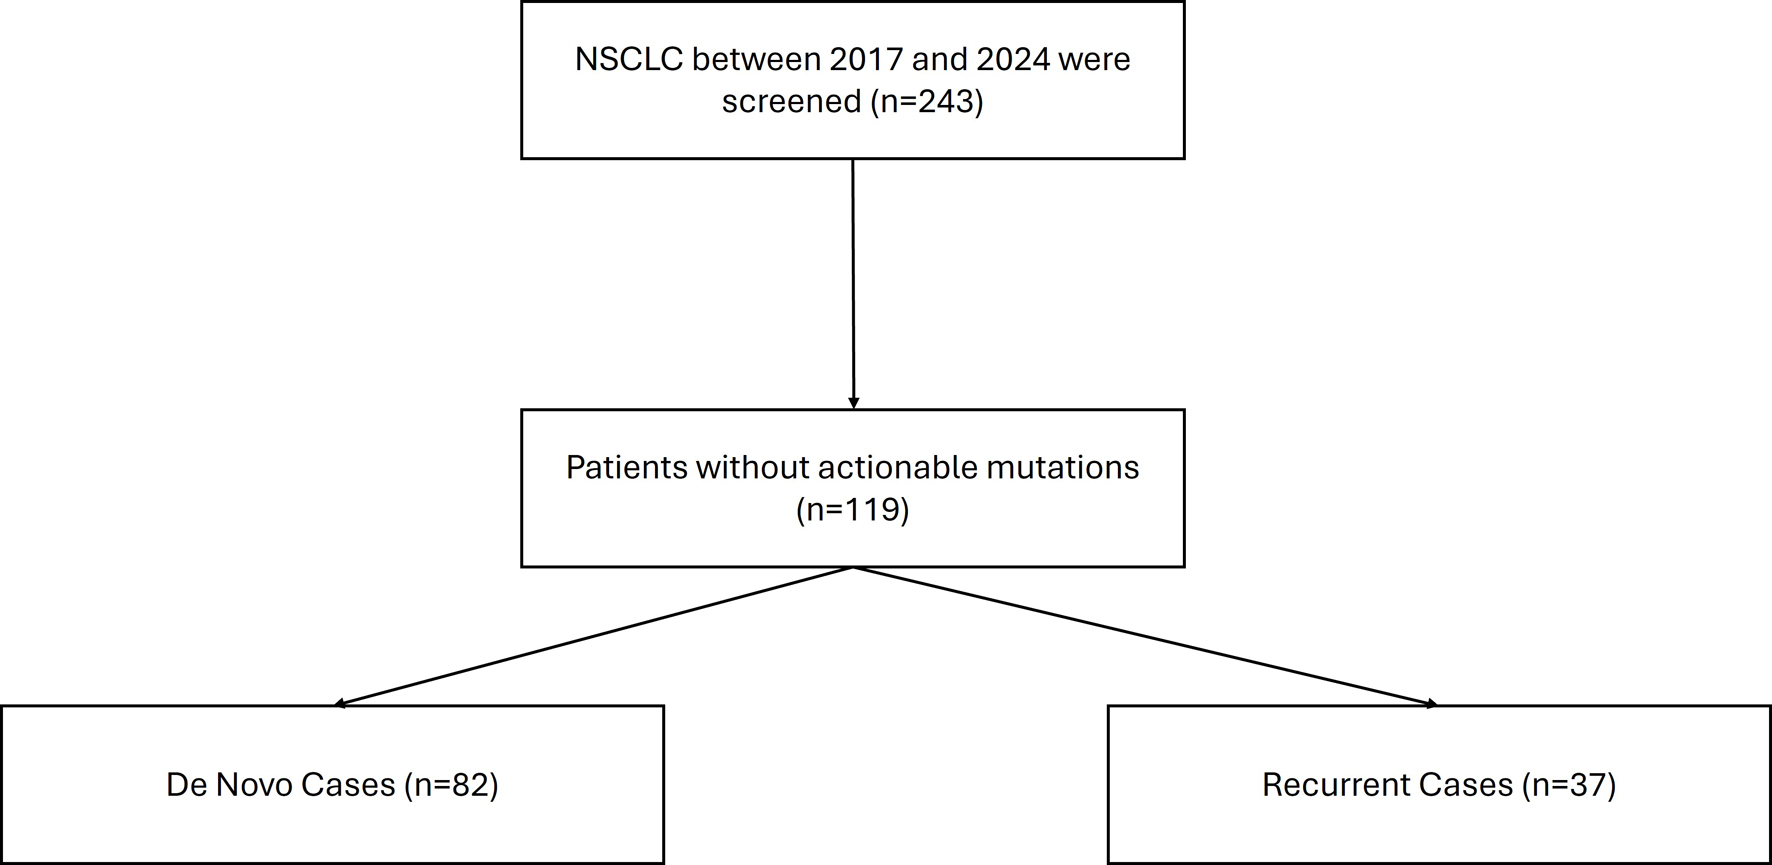
↓ Figure 1. Consort diagram for case selection.
| World Journal of Oncology, ISSN 1920-4531 print, 1920-454X online, Open Access |
| Article copyright, the authors; Journal compilation copyright, World J Oncol and Elmer Press Inc |
| Journal website https://wjon.elmerpub.com |
Original Article
Volume 17, Number 3, June 2026, pages 310-321
Incidence and Prognostic Value of TP53, STK11, and KEAP1 Mutations Between De Novo Versus Recurrent Actionable Mutation–Negative Non-Small Cell Lung Cancer: A Single-Center Retrospective Study
Figures
Tables
| Factors | De novo (n = 82) | Recurrent (n = 37) | P value |
|---|---|---|---|
| Age at diagnosis | |||
| Mean | 68.1 | 68.6 | 0.67 |
| Smoking status | |||
| Never | 11 (13%) | 3 (8%) | 0.7 |
| Former | 50 (61%) | 25 (67%) | |
| Current | 21 (26%) | 9 (25%) | |
| Sex | |||
| Male | 48 (58%) | 26 (70%) | 0.31 |
| Female | 34 (42%) | 11 (30%) | |
| Race | |||
| White NH | 74 (90%) | 32 (87%) | 0.54 |
| Other | 8 (10%) | 5 (13%) | |
| ECOG at diagnosis | |||
| 0 | 26 (32%) | 15 (41%) | 0.63 |
| 1 | 34 (41%) | 12 (32%) | |
| 2 | 10 (12%) | 6 (16%) | |
| 3 | 7 (9%) | 1 (3%) | |
| 4 | 1 (1%) | 0 | |
| Unknown | 4 (5%) | 3 (8%) | |
| Number of comorbidities | |||
| Mean | 2.3 | 2.1 | 0.47 |
| Family history of lung cancer | |||
| Yes | 17 (21%) | 13 (35%) | 0.11 |
| No | 65 (79%) | 24 (65%) | |
| Histology | |||
| Adeno | 47 (57%) | 21 (57%) | 0.48 |
| Squamous | 22 (27%) | 13 (35%) | |
| Others/unknown | 16 (16%) | 3 (8%) | |
| Stage on diagnosis | |||
| I | 3 (4%) | 17 (46%) | < 0.001 |
| II | 5 (6%) | 11 (30%) | |
| III | 22 (27%) | 8 (22%) | |
| IV | 52 (63%) | 1 (2%) | |
| Surgery | |||
| Yes | 7 (8%) | 21 (57%) | < 0.001 |
| No | 75 (92%) | 16 (43%) | |
| Radiation | |||
| Yes | 55(67%) | 27 (73%) | 0.66 |
| No | 27 (33%) | 10 (27%) | |
| Chemotherapy | |||
| Yes | 54 (66%) | 32 (86%) | 0.02 |
| No | 28 (34%) | 5 (13.5%) | |
| Immunotherapy | |||
| Yes | 53 (65%) | 26 (70%) | 0.68 |
| No | 29 (35%) | 11 (30%) | |
| PD-L1 (22c3) expression | |||
| Absent/0% | 42 (51%) | 17 (46%) | 0.73 |
| 1–49% | 23 (28%) | 13 (35%) | |
| 50–100% | 17 (21%) | 7 (19%) | |
| TP53 status | |||
| Mutated | 50 (61%) | 20 (54%) | 0.54 |
| Wild-type | 32 (39%) | 17 (46%) | |
| STK11 status | |||
| Mutated | 8 (10%) | 2 (5%) | 0.72 |
| Wild-type | 74 (90%) | 35 (95%) | |
| KEAP1 status | |||
| Mutated | 9 (11%) | 6 (16%) | 0.55 |
| Wild-type | 73 (89%) | 31 (84%) | |
| KEAP1–STK11 co-mutation | |||
| Yes | 3 (4%) | 2 (5%) | 0.66 |
| No | 79 (96%) | 35 (95%) | |
| TP53–STK11 co-mutation | 0.31 | ||
| Yes | 4 (5%) | 0 | |
| No | 78 (95%) | 37 (100%) | |
| TP53–KEAP1 co-mutation | |||
| Yes | 5 (6%) | 4 (11%) | 0.66 |
| No | 77 (94%) | 33 (89%) |
| Group | De novo (n = 82) | Recurrent (n = 37) | ||||||
|---|---|---|---|---|---|---|---|---|
| STK11 Neg | STK11 Pos | P value | OR | STK11 Neg | STK11 Pos | P value | OR | |
| Neg: negative; OR: odds ratio; Pos: positive. | ||||||||
| KEAP1 Neg | 68 (93%) | 5 (7%) | 0.03 | 6.53 (0.82–45.01) | 31 (100%) | 0 | 0.02 | NA |
| KEAP1 Pos | 6 (67%) | 3 (33%) | 4 (67%) | 2 (33%) | ||||
| Group | ||||||||
|---|---|---|---|---|---|---|---|---|
| STK11 Neg | STK11 Pos | P value | OR | KEAP1 Neg | KEAP Pos | P value | OR | |
| Neg: negative; OR: odds ratio; Pos: positive. | ||||||||
| De novo (n = 82) | ||||||||
| TP53 Neg | 35 (90%) | 4 (10%) | 1 | 0.89 (0.22–3.58) | 34 (89%) | 4 (11%) | 1 | 1.07 (0.28–4.02) |
| TP53 Pos | 39 (91%) | 4 (9%) | 39 (89%) | 5 (11%) | ||||
| Recurrent (n = 37) | ||||||||
| TP53 Neg | 19 (90%) | 2 (10%) | 0.5 | 0.24 (0.01–5.28) | 15 (88%) | 2 (12%) | 0.66 | 1.7 (0.31–9.2) |
| TP53 Pos | 16 (100%) | 0 | 16 (80%) | 4 (20%) | ||||
| Factors | OS (HR) | PFS (HR) |
|---|---|---|
| HR: hazard ratio; OS: overall survival; PFS: progression-free survival; WT: wild-type. | ||
| Age at diagnosis | 1.01 (1–1.03) P = 0.22 | 0.989 (0.97–1.009) P = 0.28 |
| Number of comorbidities | 1.27 (1.09–1.47) P = 0.001 | 1.14 (1.001–1.29) P = 0.04 |
| Sex (female vs. male) | 0.73 (0.44–1.19) P = 0.2 | 0.84 (0.55–1.26) P = 0.39 |
| Race (non-White vs. White) | 1.14 (0.55–2.4) P = 0.72 | 1.04 (0.55–2) P = 0.90 |
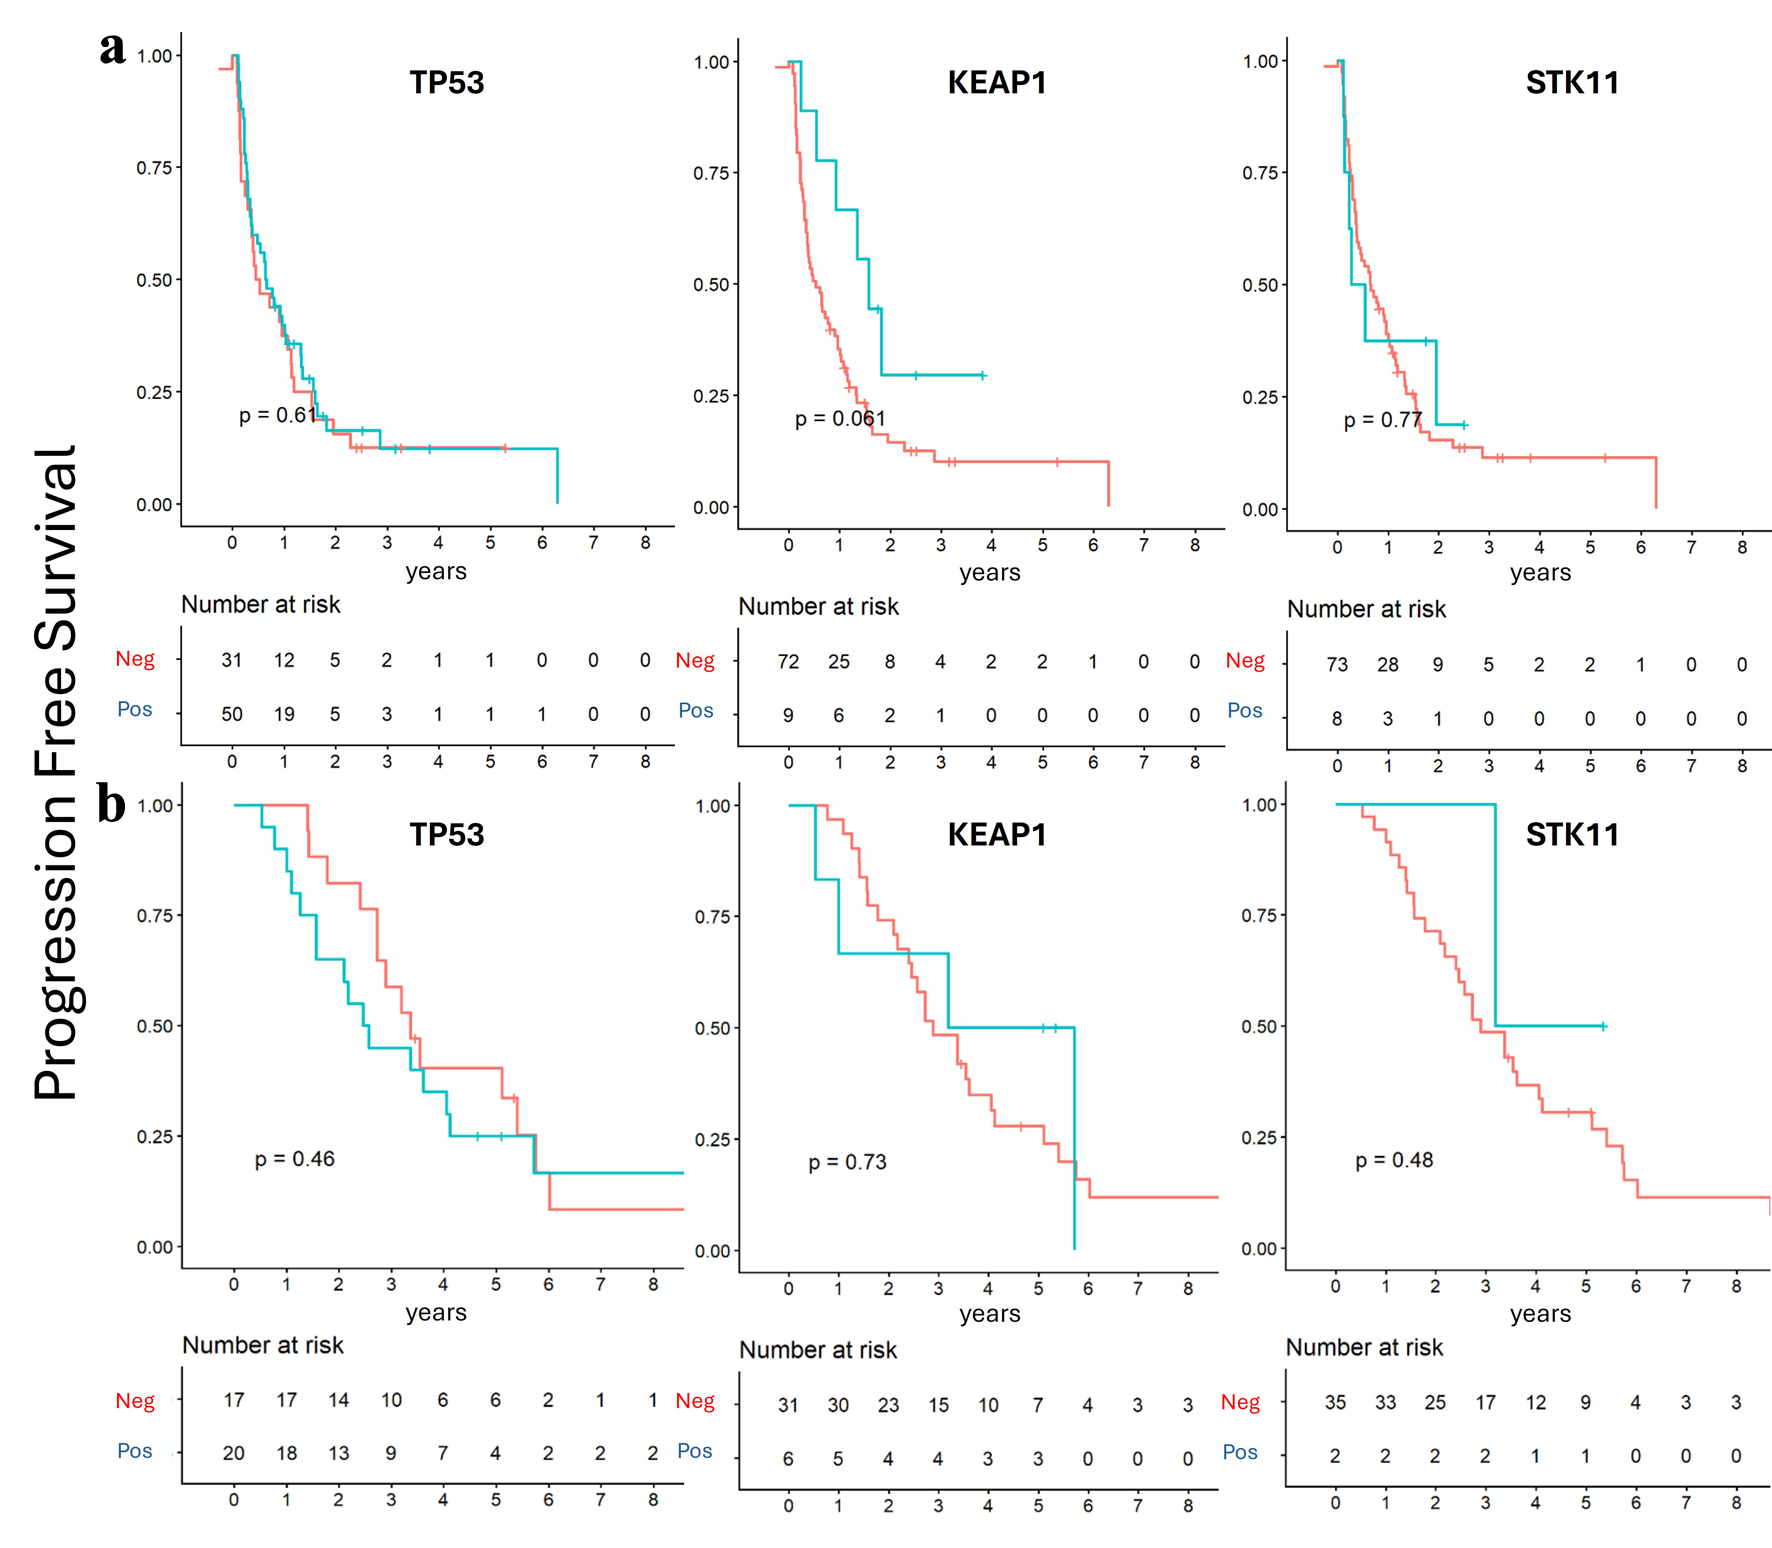
| TP53 status (mutated vs. WT) | 1.21 (0.75–1.95) P = 0.44 | 1.09 (0.73–1.63) P = 0.66 |
| STK11 status (mutated vs. WT) | 1.05 (0.42–2.6) P = 0.92 | 0.94 (0.43–2.02) P = 0.87 |
| KEAP1 status (mutated vs. WT) | 0.57 (0.26–1.24) P = 0.16 | 0.59 (0.30–1.13) P = 0.11 |
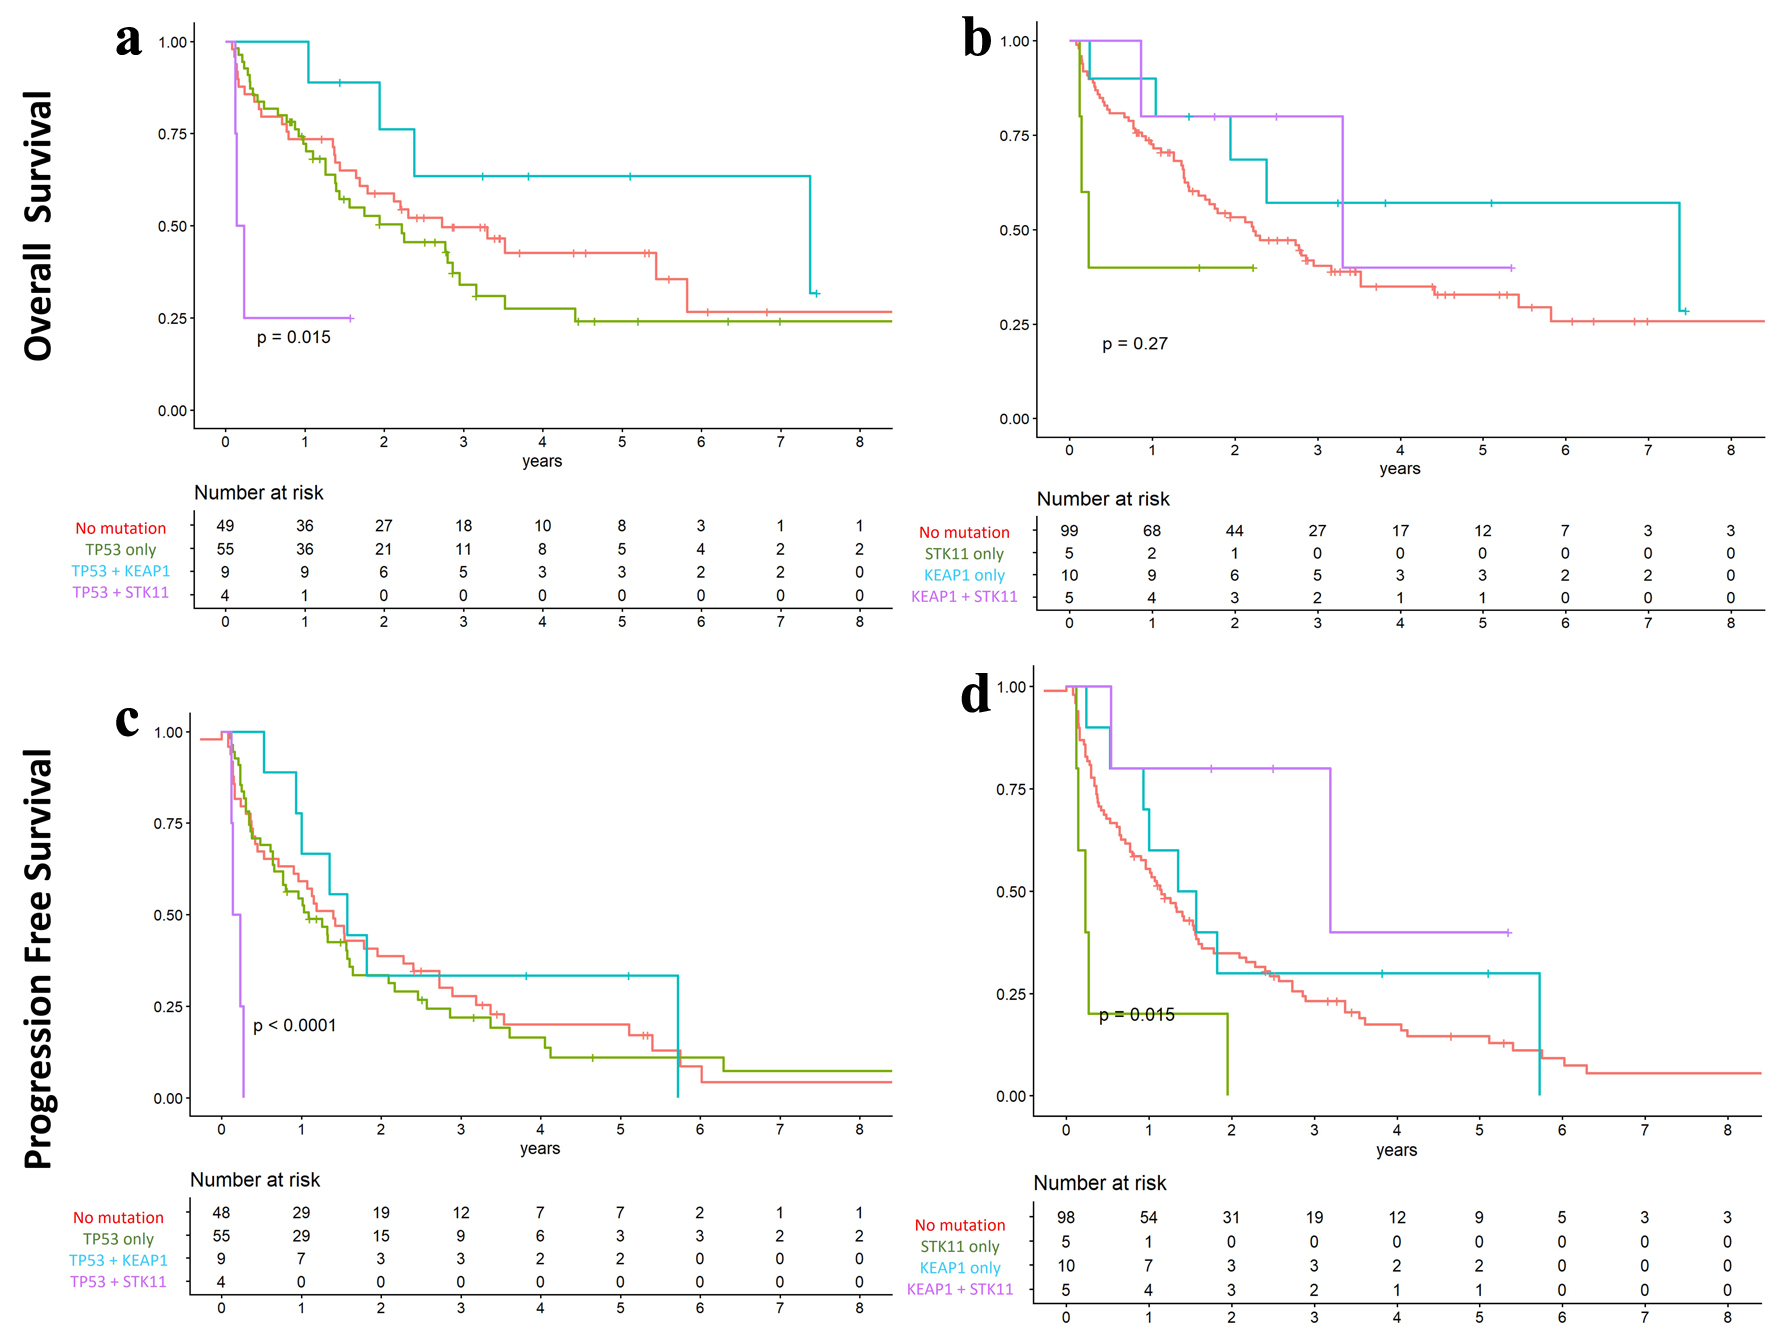
| KEAP1–STK1 co-mutation (yes vs. no) | 0.55 (0.13–2.26) P = 0.41 | 0.33 (0.08–1.34) P = 0.12 |