World Journal of Oncology, ISSN 1920-4531 print, 1920-454X online, Open Access
Article copyright, the authors; Journal compilation copyright, World J Oncol and Elmer Press Inc
Journal website https://wjon.elmerpub.com

Original Article

Volume 17, Number 3, June 2026, pages 419-427


Immunohistochemistry as a Cornerstone in Lung Cancer Diagnosis: Subtyping Based on the 2021 World Health Organization Classification and Its Practical Application

Figures

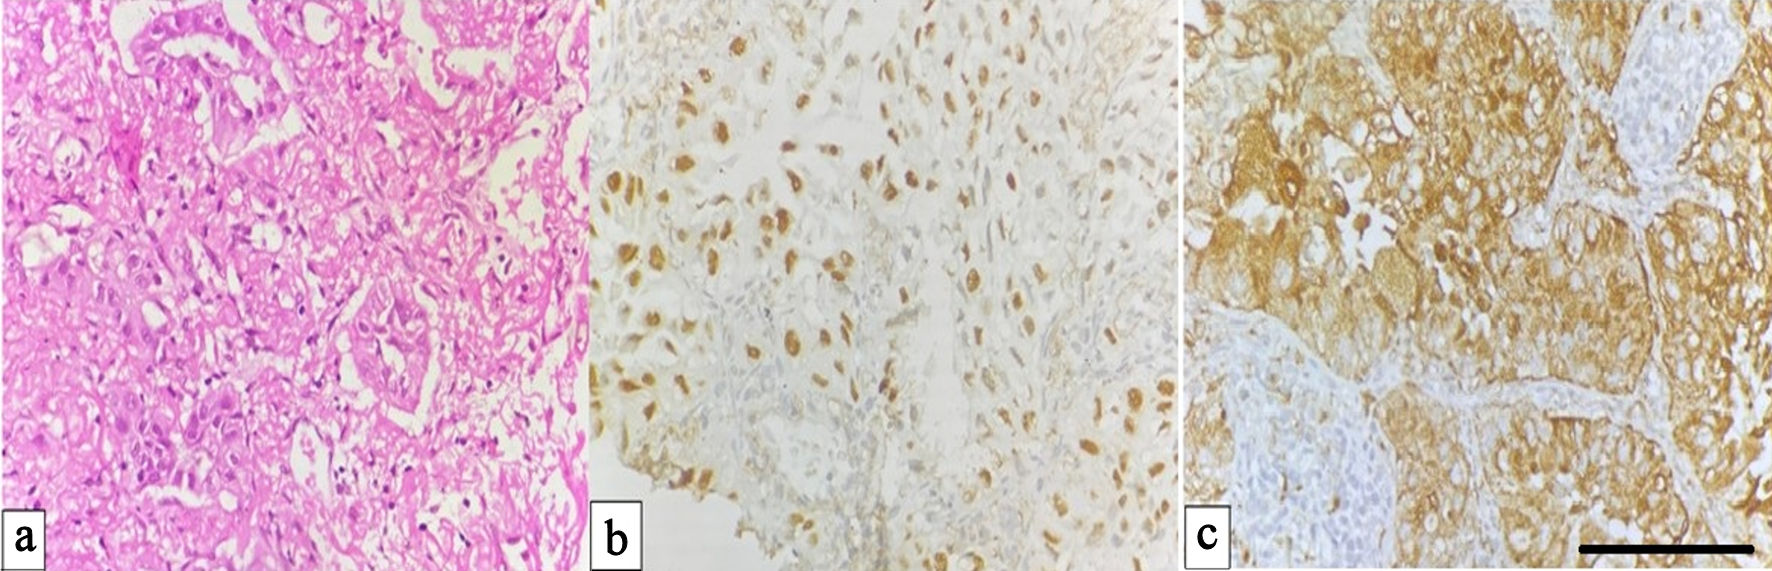
↓  Figure 1. Adenocarcinoma of the lung. (a) Hematoxylin and eosin (H&E) section showing malignant gland-forming epithelial cells (× 400). (b) Immunohistochemical staining demonstrating nuclear positivity for TTF-1 in tumour cells (× 400). (c) Cytoplasmic staining for napsin A confirming adenocarcinomatous differentiation in tumor cells (× 400, scale bar = 50 µm). TTF-1: thyroid transcription factor-1.
Figure 1.
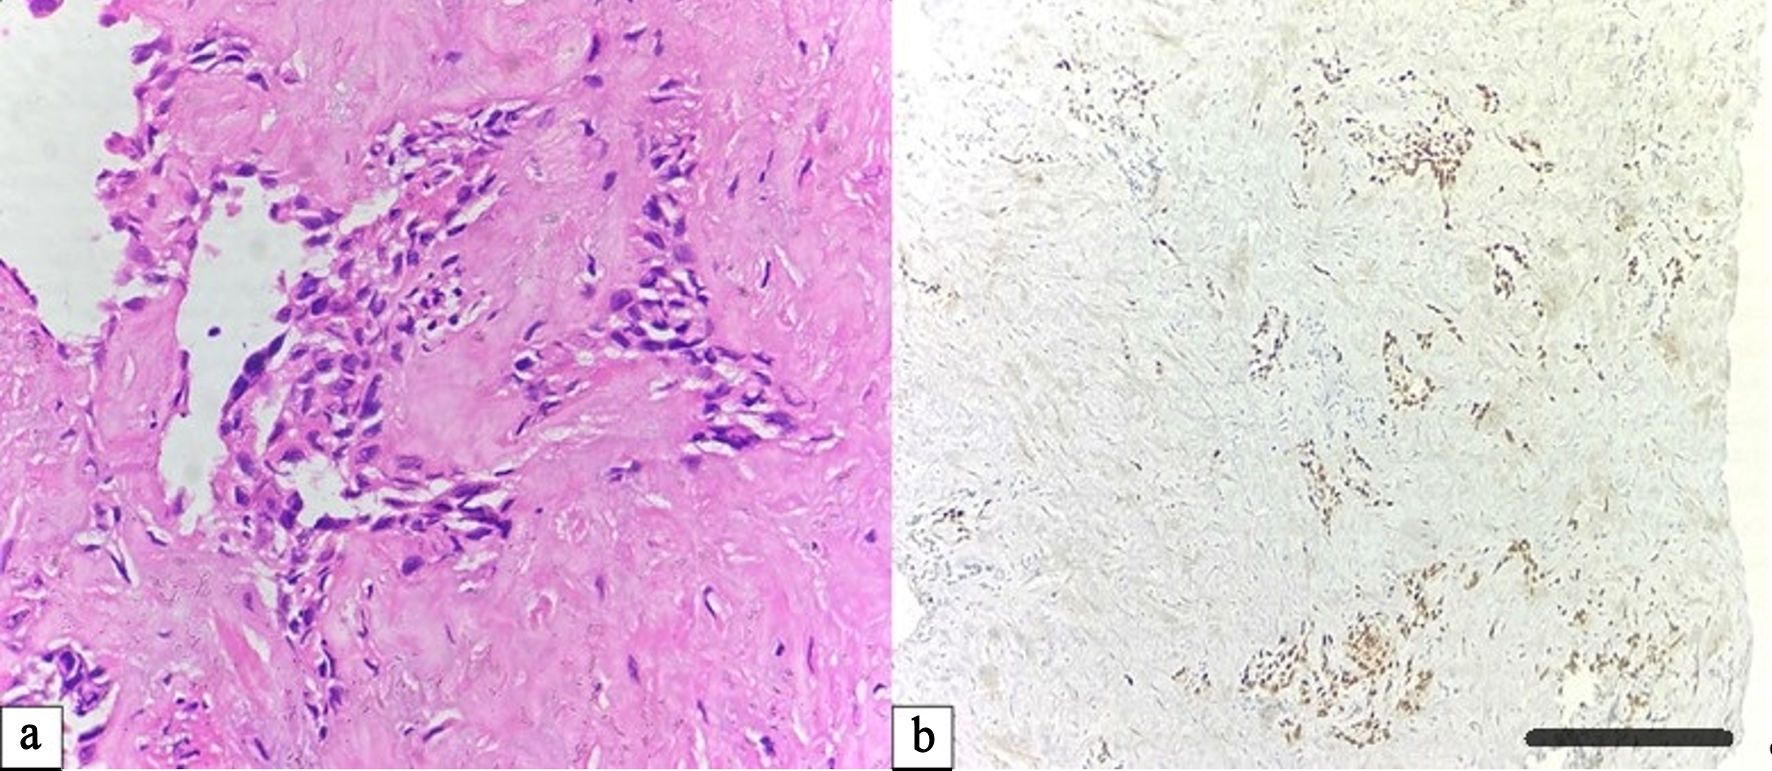
↓  Figure 2. Pulmonary metastasis from oral squamous cell carcinoma. (a) Hematoxylin and eosin (H&E) section showing nests of keratinizing squamous cells with marked pleomorphism and intercellular bridges (× 400). (b) Tumor cells exhibit diffuse nuclear immunoreactivity for P63, supporting squamous origin (× 100, scale bar = 100 µm).
Figure 2.
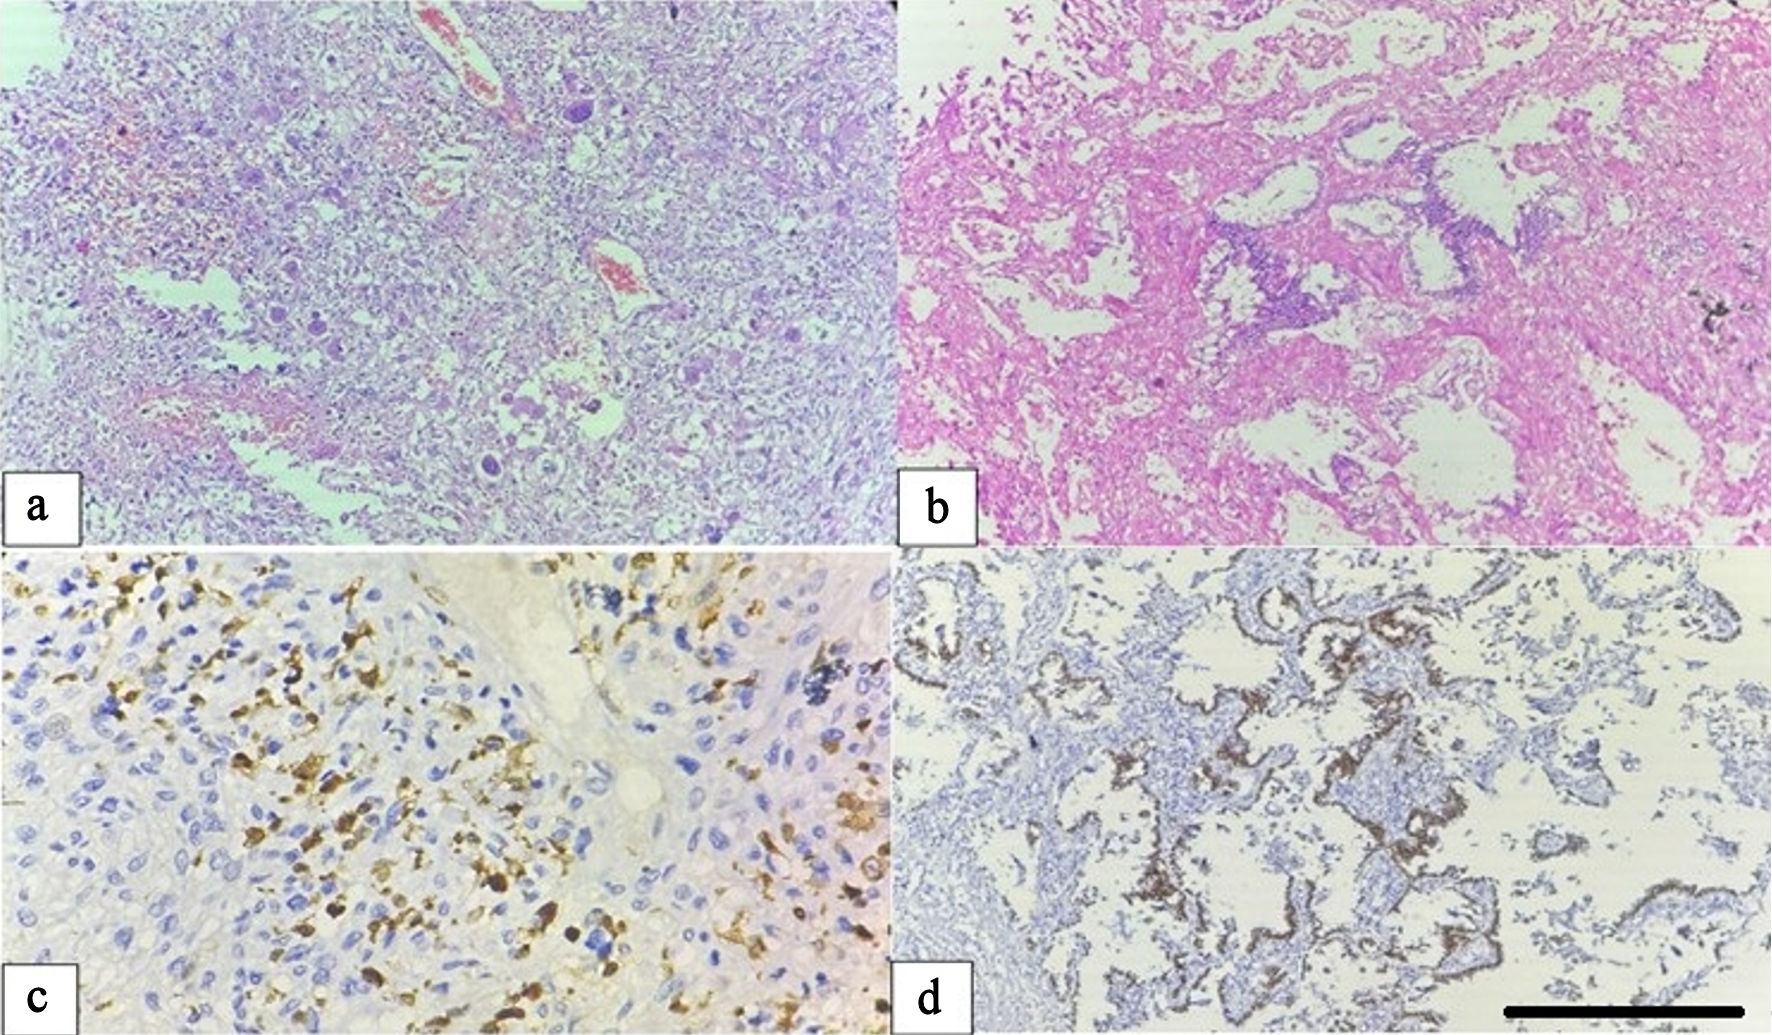
↓  Figure 3. Carcinosarcoma of the lung. (a) Hematoxylin and eosin (H&E) section illustrating the sarcomatous component composed of pleomorphic spindle cells and tumor giant cells with prominent inflammatory infiltration (× 100). (b) Adenocarcinomatous component displaying glandular structures lined by atypical epithelial cells (× 100). (c) The sarcomatous component shows diffuse cytoplasmic positivity for S-100 protein (× 400). (d) The epithelial component exhibits nuclear TTF-1 positivity, confirming biphasic differentiation (× 100, scale bar = 100 µm). TTF-1: thyroid transcription factor-1.
Figure 3.

Tables

↓  Table 1. Distribution of Lung Tumor Subtypes (N = 151)
 
Histopathological diagnosisFrequencyPercentage (%)
Adenocarcinoma8858.3
Lung neuroendocrine neoplasms2617.2
Metastatic lesions2013.2
Adenosquamous carcinoma96.0
Squamous cell carcinoma42.6
Carcinosarcoma21.3
Mucoepidermoid carcinoma21.3
Total151100.0


↓  Table 2. IHC Expression Pattern and Specificity (N = 151)
 
IHC markerAdeno (+/−)Neuroendocrine (+/−)Adenosquamous (+/−)Squamous (+/−)Carcinosarcoma (+/−)Mucoepidermoid (+/−)Specificity (%)
IHC: immunohistochemistry; Adeno: adenocarcinoma; TTF-1: thyroid transcription factor-1; SMA: smooth muscle actin; S-100: S-100 protein; Pan-CK: pan-cytokeratin.
TTF-175/13 (85/15%)0/26 (0/100%)1/8 (12.5/87.5%)0/4 (0/100%)2/0 (100/0%)0/2 (0/100%)48.5
Napsin A83/5 (94/6%)0/26 (0/100%)0/9 (0/100%)0/4 (0/100%)0/2 (0/100%)0/2 (0/100%)80.0
CK780/8 (91/9%)8/18 (31/69%)9/0 (100/0%)4/0 (100/0%)0/2 (0/100%)2/0 (100/0%)25.0
CK5/60/88 (0/100%)0/26 (0/100%)8/1 (89/11%)4/0 (100/0%)0/2 (0/100%)2/0 (100/0%)88.6
P630/88 (0/100%)0/26 (0/100%)4/5 (44/56%)4/0 (100/0%)0/2 (0/100%)2/0 (100/0%)96.0
Synaptophysin0/88 (0/100%)25/1 (96/4%)0/9 (0/100%)0/4 (0/100%)0/2 (0/100%)0/2 (0/100%)97.4
Chromogranin0/88 (0/100%)26/0 (100/0%)0/9 (0/100%)0/4 (0/100%)0/2 (0/100%)0/2 (0/100%)98.5
Vimentin2/0 (100/0%)
SMA2/0 (100/0%)
S-1002/0 (100/0%)
Pan-CK2/0 (100/0%)


↓  Table 3. Diagnostic Performance of Key Immunohistochemical Markers
 
MarkerTargetSensitivitySpecificity
TTF-1: thyroid transcription factor-1;
TTF-1Adenocarcinoma85.2%95.2%
Napsin AAdenocarcinoma94.3%100%
CK5/6Squamous92.3%98.6%
P63Squamous61.5%98.6%
SynaptophysinNeuroendocrine96.1%100%
ChromograninNeuroendocrine100%100%


↓  Table 4. IHC Profiles of Metastatic Lesions to the Lung
 
IHC markerBreast (n = 10)Oral (n = 4)Kidney (n = 6)
IHC: immunohistochemistry; ER: estrogen receptor; PR: progesterone receptor; HER2: human epidermal growth factor receptor 2; CK: cytokeratin; TTF-1: thyroid transcription factor-1.
ER7/100/40/6
PR7/100/40/6
HER25/100/40/6
E-cadherin8/100/40/6
PAX-20/100/46/6
PAX-80/100/46/6
CD100/100/45/6
CK5/60/104/40/6
P630/104/40/6
CK78/100/40/6
TTF-10/100/40/6


↓  Table 5. Correlation Analysis Between Lineage-Specific Immunohistochemical Markers
 
Tumor subtypeImmunomarker pairCorrelation coefficient (r)Significance (P)Interpretation
TTF-1: thyroid transcription factor-1; CK: cytokeratin.
AdenocarcinomaTTF-1 vs napsin A0.88< 0.001Strong positive correlation confirming coexpression of glandular differentiation markers
Squamous/adenosquamous carcinomaP63 vs CK5/60.93< 0.001Excellent positive correlation indicating robust concordance of squamous-lineage markers
Neuroendocrine neoplasmsSynaptophysin vs chromogranin0.87< 0.001Highly significant correlation supporting consistent neuroendocrine marker expression