Figures
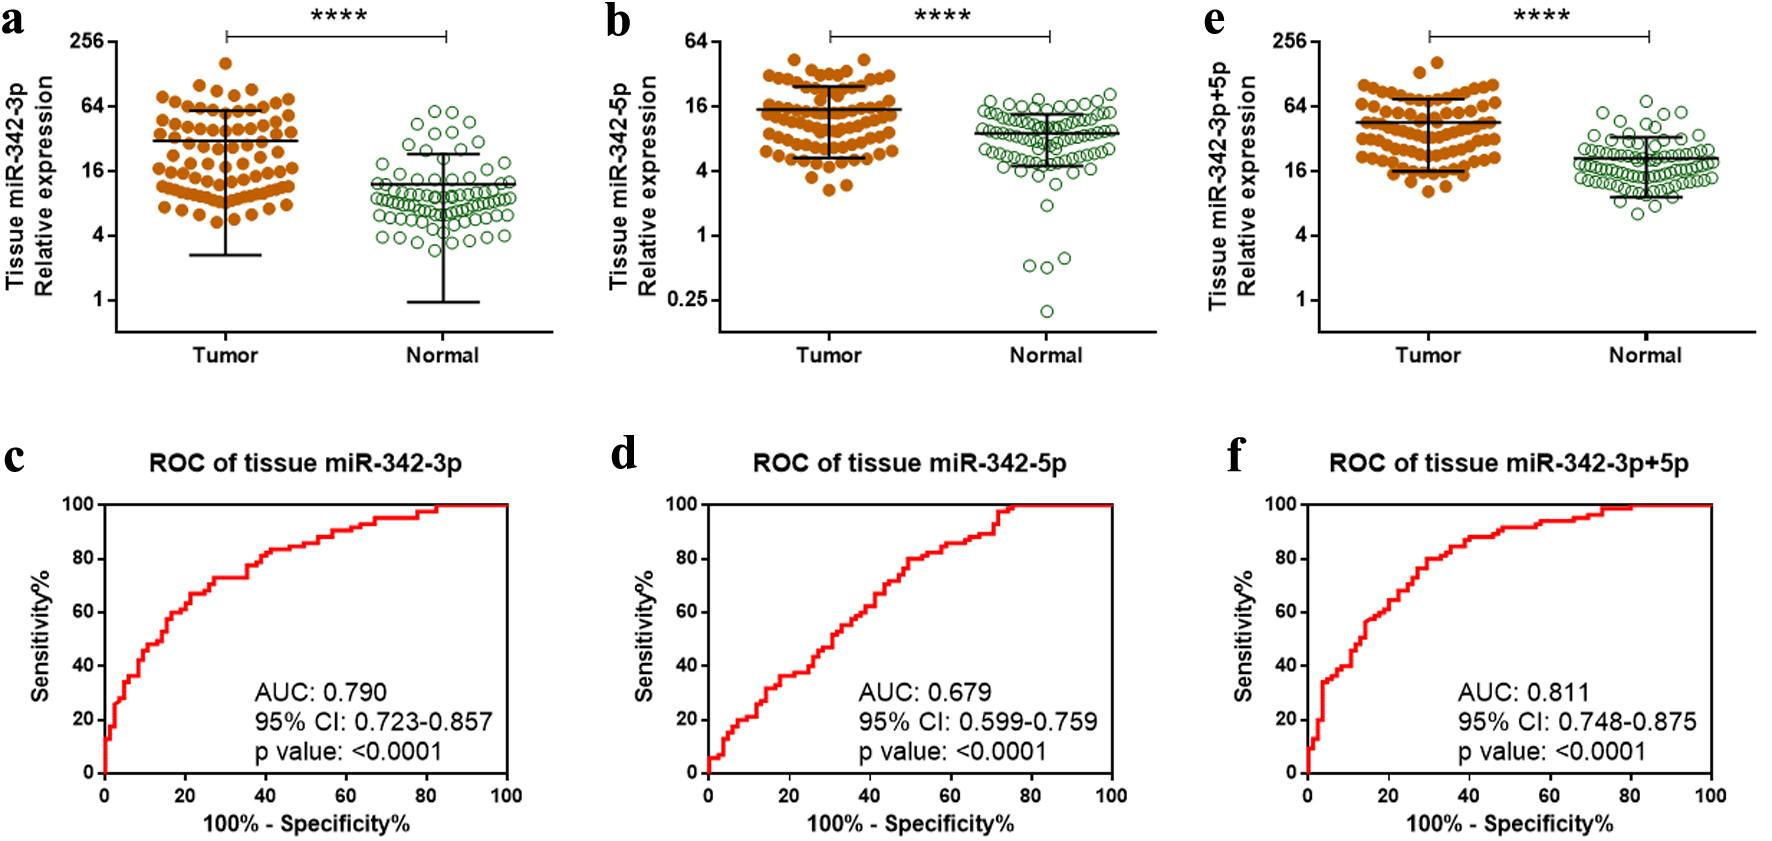
↓ Figure 1. Overexpression of miR-342-3p and miR-342-5p in ccRCC tumor tissues. (a, b) Relative expression of miR-342-3p (a) and miR-342-5p (b) in 85 paired ccRCC tumor and adjacent normal tissues measured by qRT-PCR. (c, d) Diagnostic performance of tissue miR-342-3p (c) and miR-342-5p (d) assessed by ROC analysis. (e) Combined expression of miR-342-3p and miR-342-5p (miR-342-3p+5p) in tumor versus normal tissues. (f) ROC analysis of combined miR-342-3p+5p expression for ccRCC diagnosis. ****P < 0.0001. ccRCC: clear cell renal cell carcinoma; qRT-PCR: quantitative reverse transcription polymerase chain reaction; ROC: receiver operating characteristic.
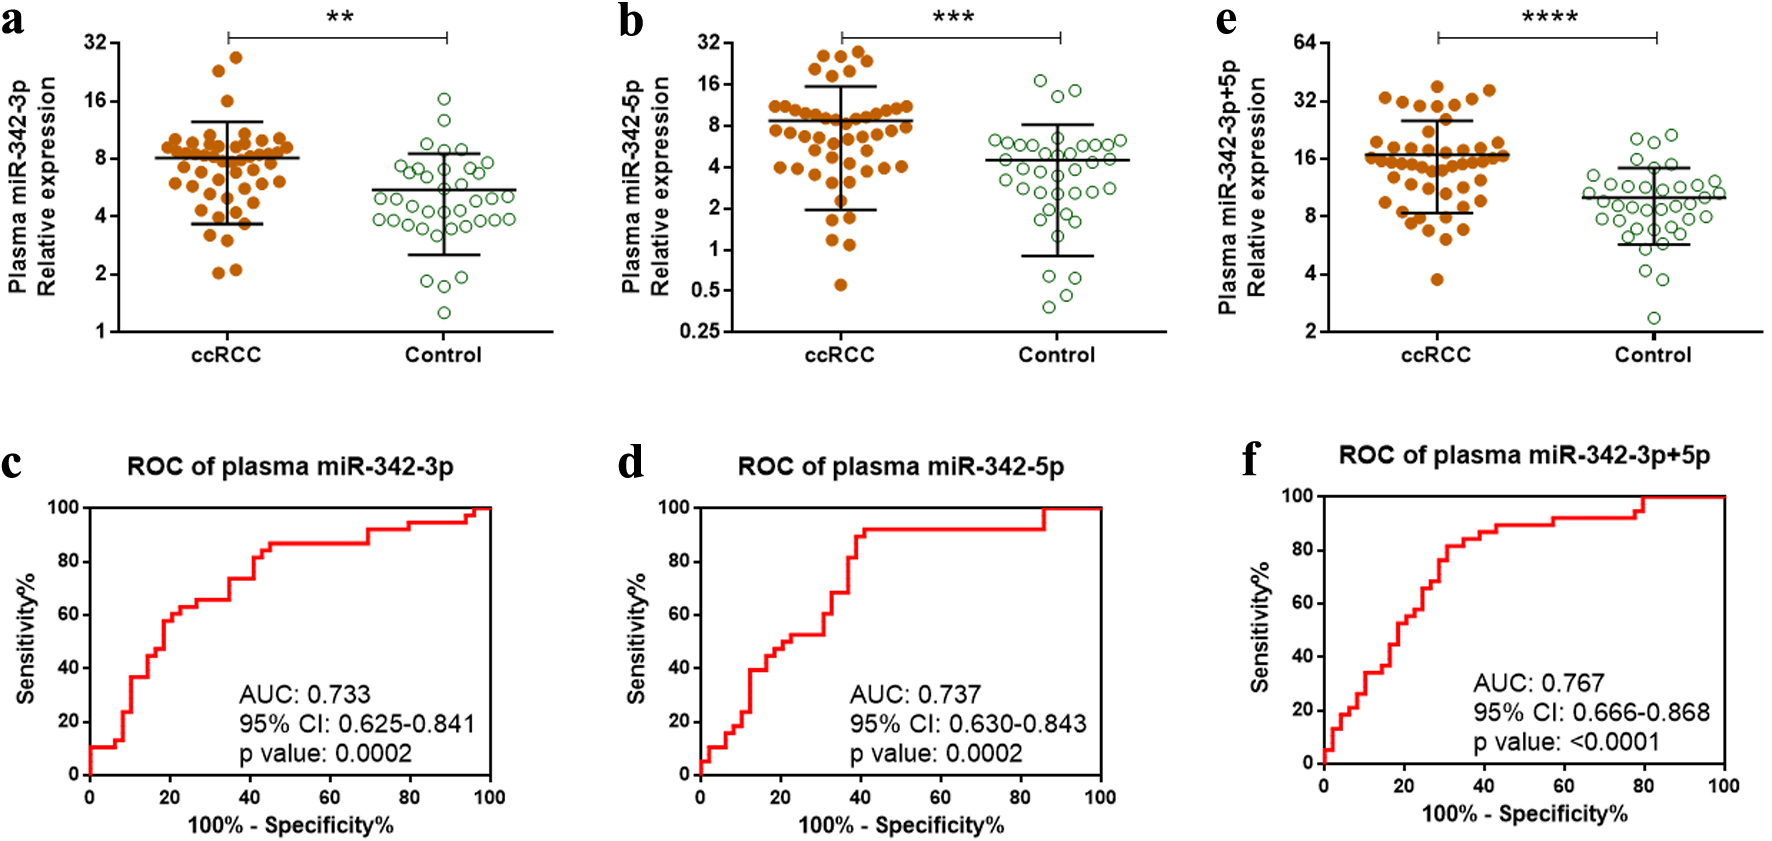
↓ Figure 2. Overexpression of plasma miR-342-3p and miR-342-5p in ccRCC patients. (a, b) Relative plasma expression of miR-342-3p (a) and miR-342-5p (b) in 49 ccRCC patients versus 38 healthy controls measured by qRT-PCR. (c, d) Diagnostic performance of plasma miR-342-3p (c) and miR-342-5p (d) assessed by ROC analysis. (e) Combined plasma expression of miR-342-3p and miR-342-5p (miR-342-3p+5p) in ccRCC patients versus controls. (f) ROC analysis of combined plasma miR-342-3p+5p for ccRCC detection. **P < 0.01; ***P < 0.001; ****P < 0.0001. ccRCC: clear cell renal cell carcinoma; qRT-PCR: quantitative reverse transcription polymerase chain reaction; ROC: receiver operating characteristic.
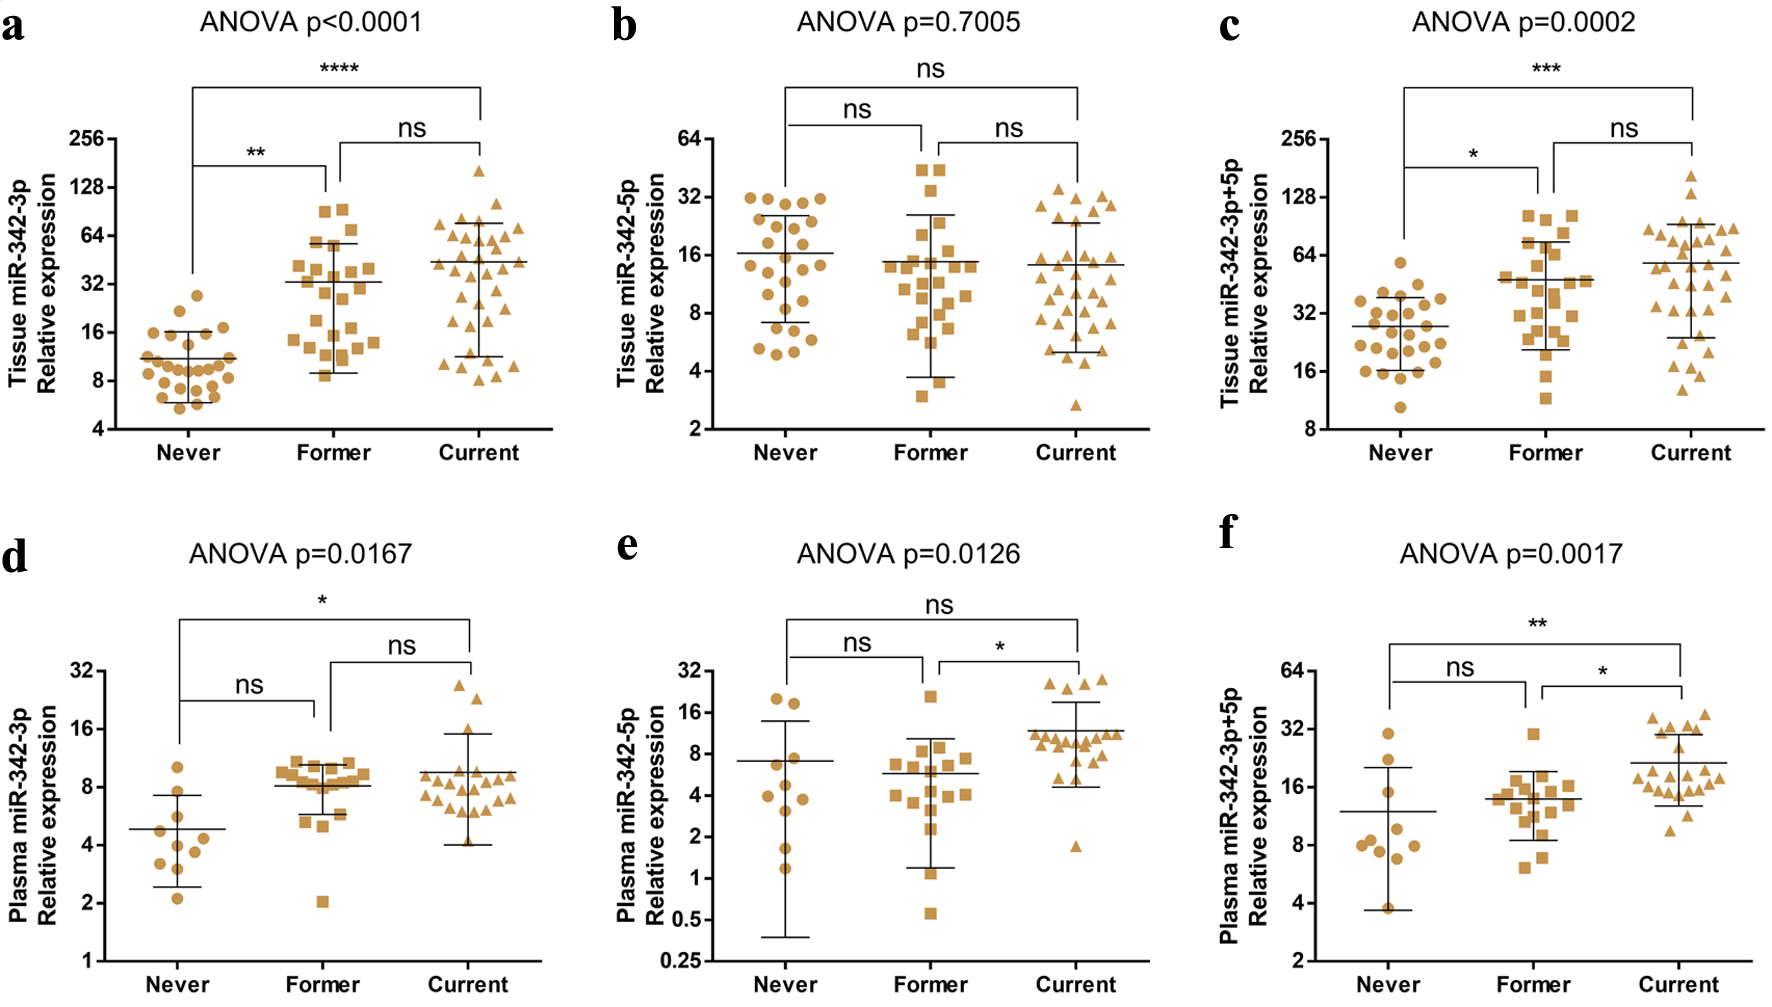
↓ Figure 3. miR-342-3p expression levels are related to the smoking status of ccRCC patients. (a–c) Tissue levels of miR-342-3p (a), miR-342-5p (b), and combined miR-342-3p+5p (c) across smoking-status groups with ccRCC. (d–f) Plasma levels of miR-342-3p (d), miR-342-5p (e), and combined miR-342-3p+5p (f) across smoking-status groups with ccRCC. ns: no significant change; *P < 0.05; **P < 0.01; ***P < 0.001; ****P < 0.0001. ccRCC: clear cell renal cell carcinoma.
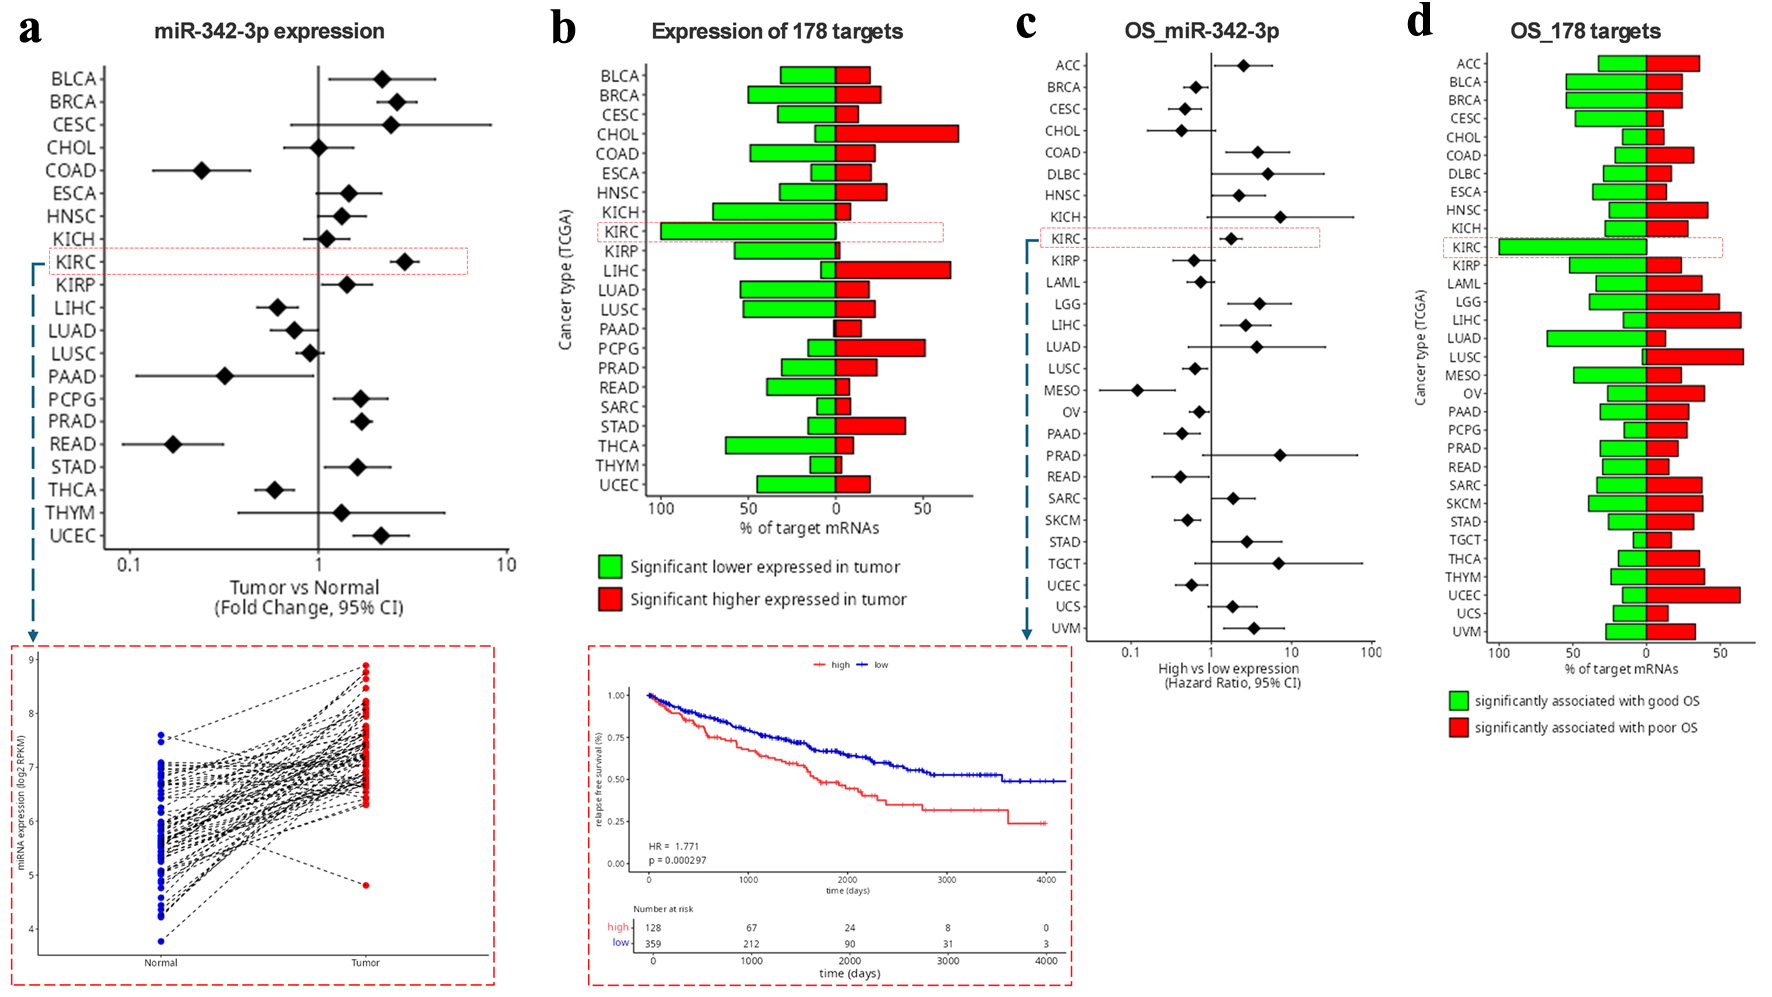
↓ Figure 4. Identification of miR-342-3p targets in ccRCC using miRTarget. (a) miR-342-3p expression in tumor versus normal tissues across the indicated cancer types. The red rectangle highlights miR-342-3p expression in KIRC. (b) Proportion of the 178 putative KIRC-related miR-342-3p targets that are upregulated or downregulated in tumors compared with normal tissues. (c) Associations between miR-342-3p expression levels and OS across the indicated cancer types. The red rectangle highlights the KIRC survival curve. (d) Proportion of the 178 targets associated with favorable or poor OS in KIRC. ccRCC: clear cell renal cell carcinoma; KIRC: clear cell renal carcinoma; OS: overall survival.
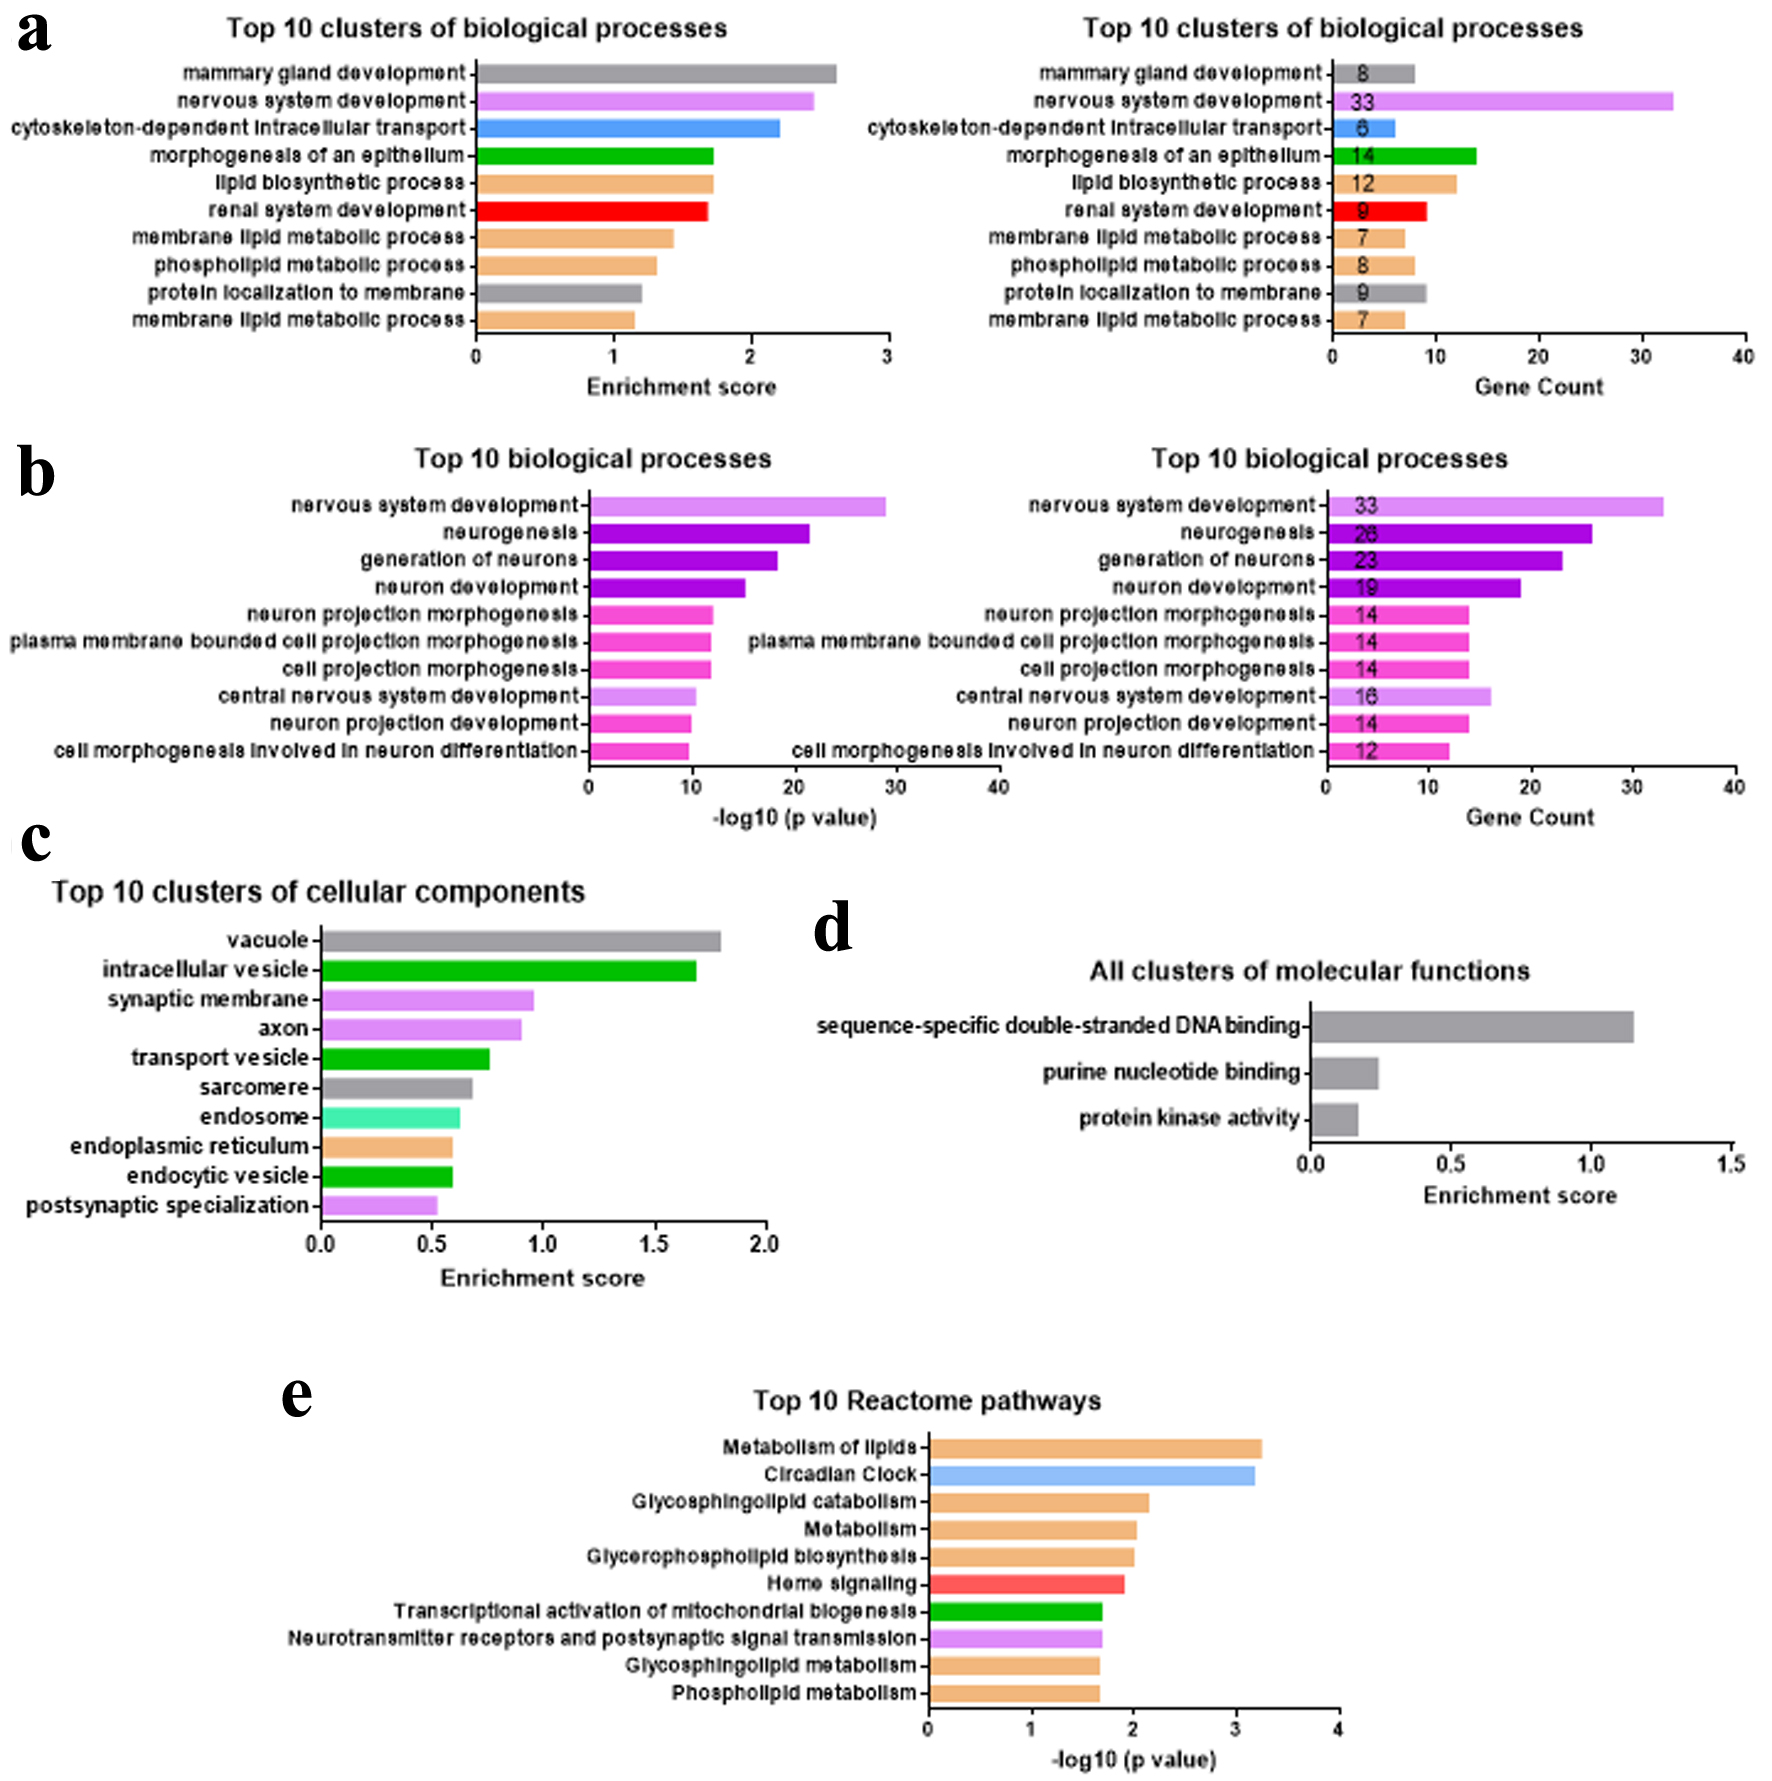
↓ Figure 5. miR-342-3p regulates genes involved in lipid metabolism and neurogenesis. (a–d) Top 10 or all enriched biological process (a, b), cellular component (c), or molecular function (d) clusters among 178 miR-342-3p ccRCC-related target genes. (e) Top 10 Reactome pathways in 178 miR-342-3p ccRCC-related targets. ccRCC: clear cell renal cell carcinoma.
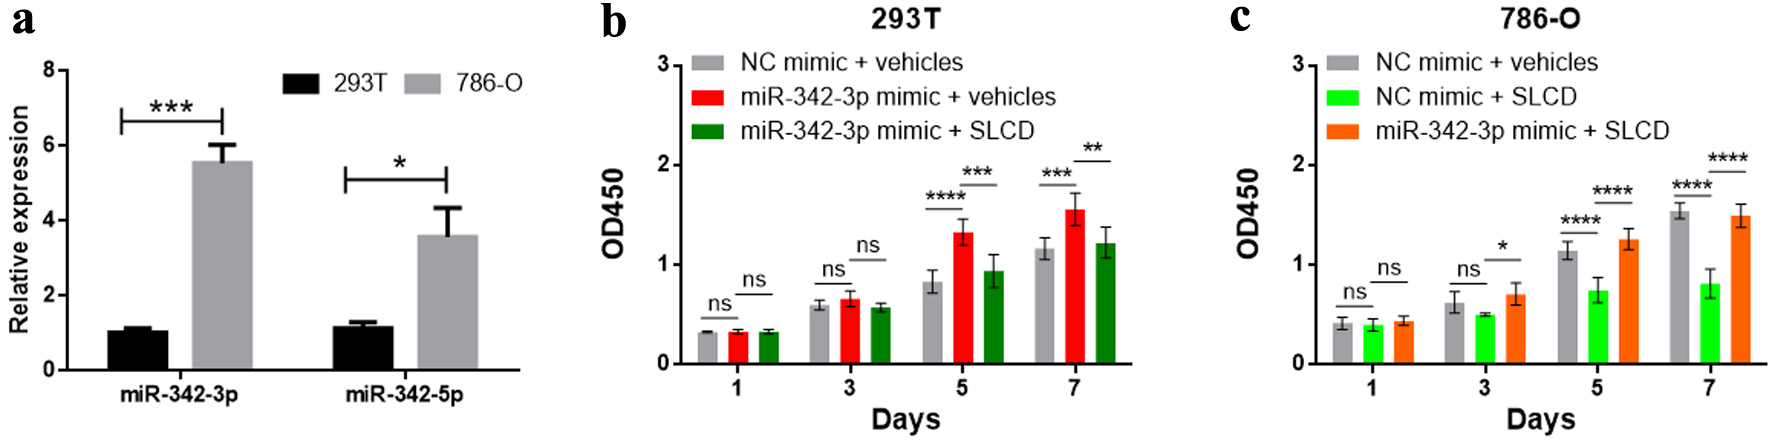
↓ Figure 6. Quantitative analysis of cell proliferation by CCK-8 assay. (a) miR-342-3p and miR-342-5p expression levels in 293T and 786-O cells determined by qRT-PCR. (b, c) The cell proliferation was measured by CCK-8. ns: not significant; *P < 0.05; **P < 0.01; ***P < 0.001; ****P < 0.0001. CCK-8: cell counting kit-8; qRT-PCR: quantitative reverse transcription polymerase chain reaction.
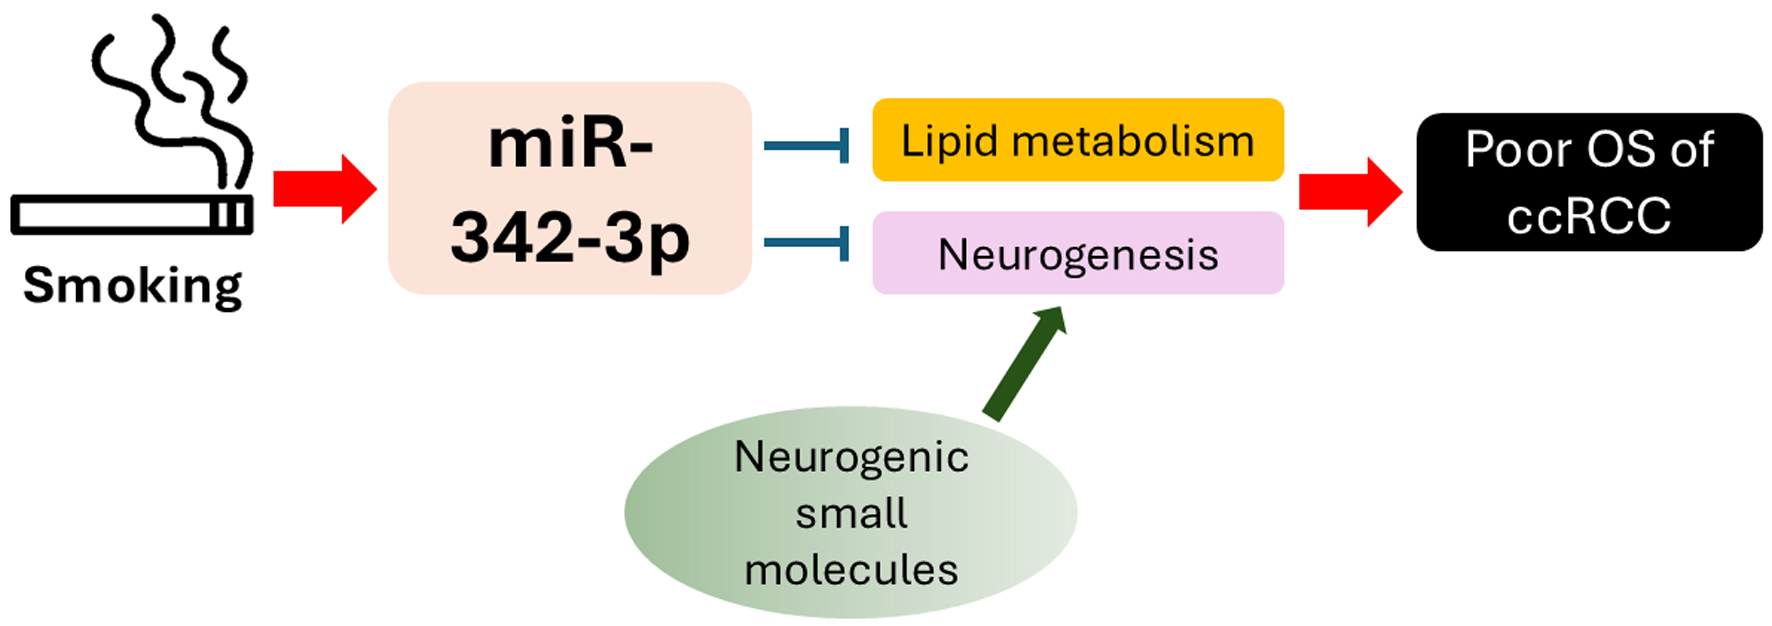
↓ Figure 7. Schematic summarizing the proposed biological functions of miR-342-3p in ccRCC. ccRCC: clear cell renal cell carcinoma.
Tables
↓ Table 1. Clinical Characteristics of ccRCC Patients
| Characteristic | Current smokers | Former smokers | Never smokers |
|---|
| Tissue | Plasma | Tissue | Plasma | Tissue | Plasma |
|---|
| ccRCC: clear cell renal cell carcinoma; SD: standard deviation. |
| Age, years (mean ± SD) | 58 ± 11 | 57 ± 13 | 61 ± 15 | 59 ± 12 | 62 ± 15 | 60 ± 13 |
| Gender, male/female | 24/10 | 15/7 | 18/7 | 10/7 | 16/10 | 5/5 |
| Tumor size, cm (mean ± SD) | 7.1 ± 2.2 | 6.9 ± 3.1 | 7.2 ± 2.5 | 7.0 ± 2.8 | 6.2 ± 1.7 | 6.3 ± 2.1 |
| T stage, pT1 | 16 | 14 | 14 | 10 | 17 | 6 |
| T stage, pT2 | 15 | 7 | 10 | 6 | 8 | 3 |
| T stage, pT3 | 2 | 1 | 1 | 1 | 1 | 1 |
| T stage, pT4 | 1 | 0 | 0 | 0 | 0 | 0 |
| N stage, N0 | 32 | 21 | 24 | 17 | 26 | 10 |
| N stage, N1 | 2 | 1 | 1 | 0 | 0 | 0 |
| M stage, M0 | 33 | 22 | 25 | 17 | 26 | 10 |
| M stage, M1 | 1 | 0 | 0 | 0 | 0 | 0 |
| Fuhrman grade 1 | 10 | 9 | 6 | 5 | 10 | 3 |
| Fuhrman grade 2 | 17 | 11 | 13 | 8 | 11 | 6 |
| Fuhrman grade 3 | 5 | 1 | 4 | 2 | 4 | 1 |
| Fuhrman grade 4 | 2 | 1 | 2 | 2 | 1 | 0 |
↓ Table 2. FC and P Value of 26 Neurogenesis-Related Targets of miR-342-3p in KIRC as Compared to Normal Kidney Tissues (Extracted From OncoDB 2.0)
| Gene | KIRC (n = 545) vs. normal (n = 72) |
|---|
| log2FC | FC | P value |
|---|
| FC: fold change; KIRC: clear cell renal carcinoma. |
| CHL1 | −4.7700 | 0.0367 | 2.90 × 10⁻³⁰ |
| ERBB4 | −4.1000 | 0.0583 | 3.00 × 10⁻²⁴ |
| SEMA6D | −3.4300 | 0.0928 | 7.20 × 10⁻¹⁷ |
| SLC44A4 | −3.3800 | 0.0961 | 6.50 × 10⁻²³ |
| THRB | −2.4200 | 0.1869 | 7.60 × 10⁻³¹ |
| NTN1 | −2.2300 | 0.2132 | 6.00 × 10⁻² |
| FLRT3 | −2.0500 | 0.2415 | 4.50 × 10⁻²⁸ |
| PBX1 | −1.8700 | 0.2736 | 1.30 × 10⁻³⁵ |
| NTN4 | −1.8300 | 0.2813 | 6.70 × 10⁻¹⁸ |
| KLF15 | −1.6400 | 0.3209 | 1.10 × 10⁻⁷ |
| COBL | −1.5300 | 0.3463 | 3.30 × 10⁻²⁴ |
| CTF1 | −1.4800 | 0.3585 | 4.60 × 10⁻²² |
| MYO6 | −1.4600 | 0.3635 | 7.70 × 10⁻³⁵ |
| SOX6 | −1.4000 | 0.3789 | 3.00 × 10⁻²⁷ |
| ATP9A | −1.3400 | 0.3950 | 3.40 × 10⁻²² |
| GABRB3 | −1.3200 | 0.4005 | 1.70 × 10⁻⁸ |
| LAMC3 | −1.1700 | 0.4444 | 2.90 × 10⁻⁵ |
| PTCH1 | −1.1500 | 0.4506 | 1.00 × 10⁻¹⁹ |
| ADCY1 | −1.1300 | 0.4569 | 2.70 × 10⁻⁵ |
| FZD3 | −1.0400 | 0.4863 | 5.30 × 10⁻²⁵ |
| SEMA5A | −1.0300 | 0.4897 | 1.80 × 10⁻⁸ |
| APLP2 | −0.8700 | 0.5471 | 6.40 × 10⁻³⁴ |
| WASL | −0.7200 | 0.6071 | 6.20 × 10⁻²⁶ |
| CLN8 | −0.6600 | 0.6329 | 4.70 × 10⁻⁷ |
| ID4 | −0.6000 | 0.6598 | 8.40 × 10⁻⁶ |
| PPP1R12B | −0.5900 | 0.6643 | 9.80 × 10⁻³ |