World Journal of Oncology, ISSN 1920-4531 print, 1920-454X online, Open Access
Article copyright, the authors; Journal compilation copyright, World J Oncol and Elmer Press Inc
Journal website https://wjon.elmerpub.com

Original Article

Volume 17, Number 5, October 2026, pages 623-632


Siglec-15 Expression in Gastric Carcinoma and Its Association With Clinicopathological Variables

Figures

↓  Figure 1. Representative immunohistochemistry images of Siglec-15 expression in gastric cancer tissues. (a) Positive Siglec-15 expression. (b) Negative Siglec-15 expression. (c) Positive membranous and cytoplasmic expression in tumor cells and Positive expression in tumor-associated macrophages (TAMs).
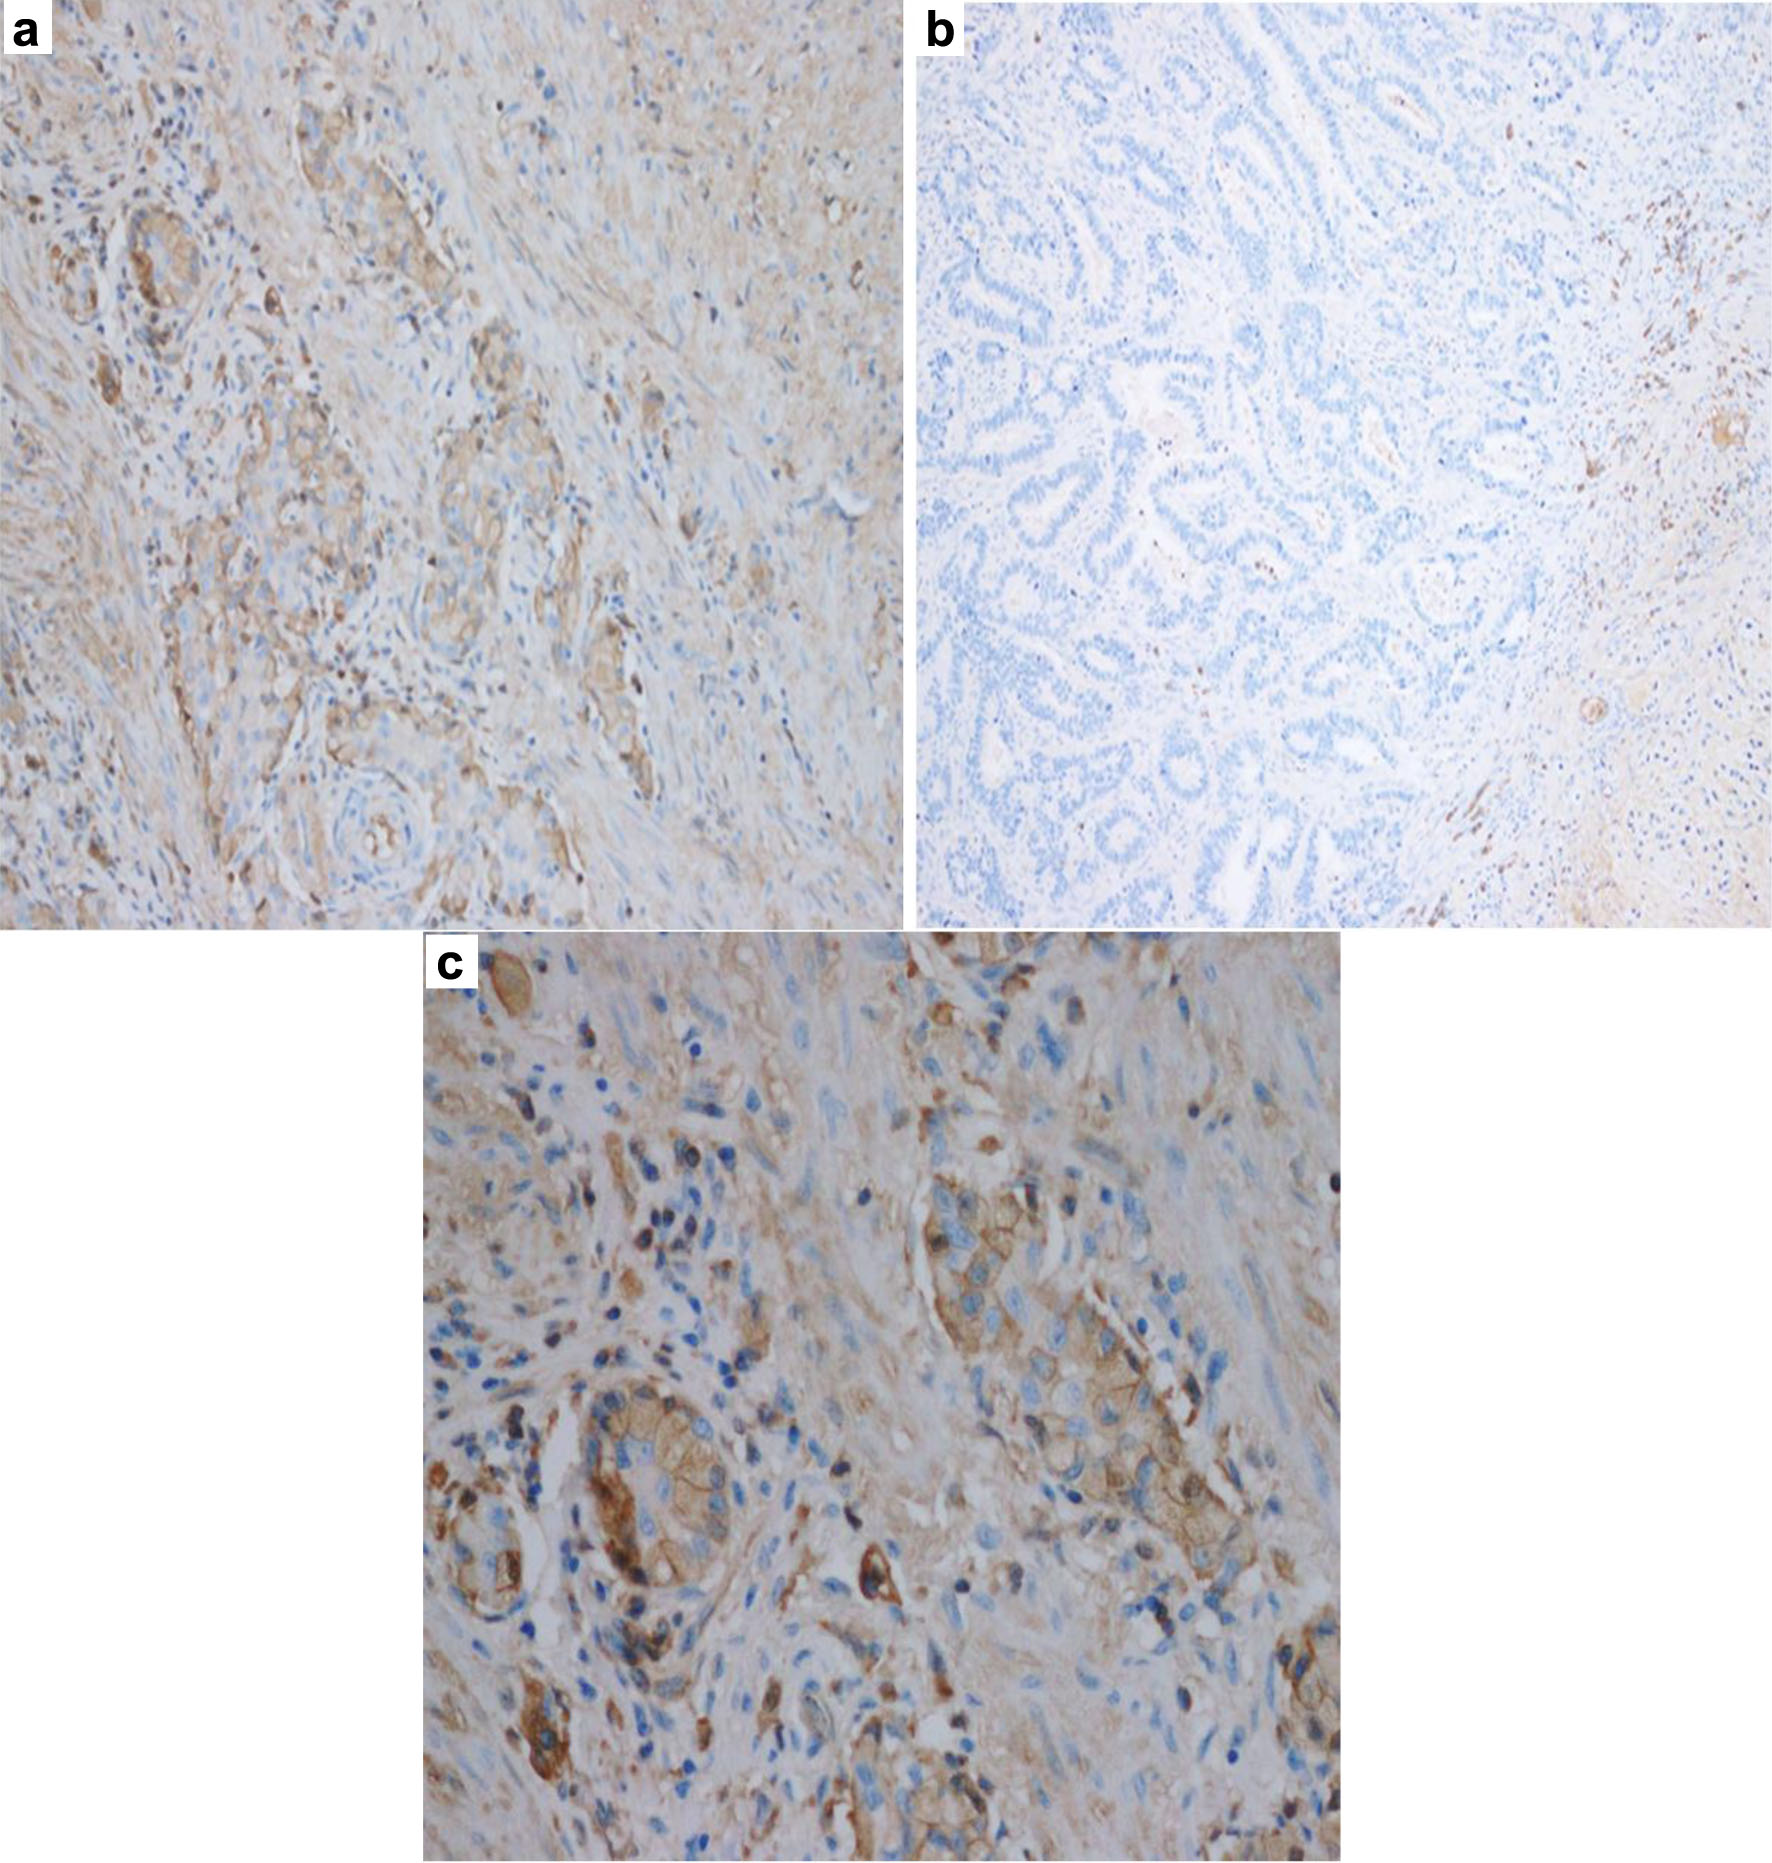
Figure 1.
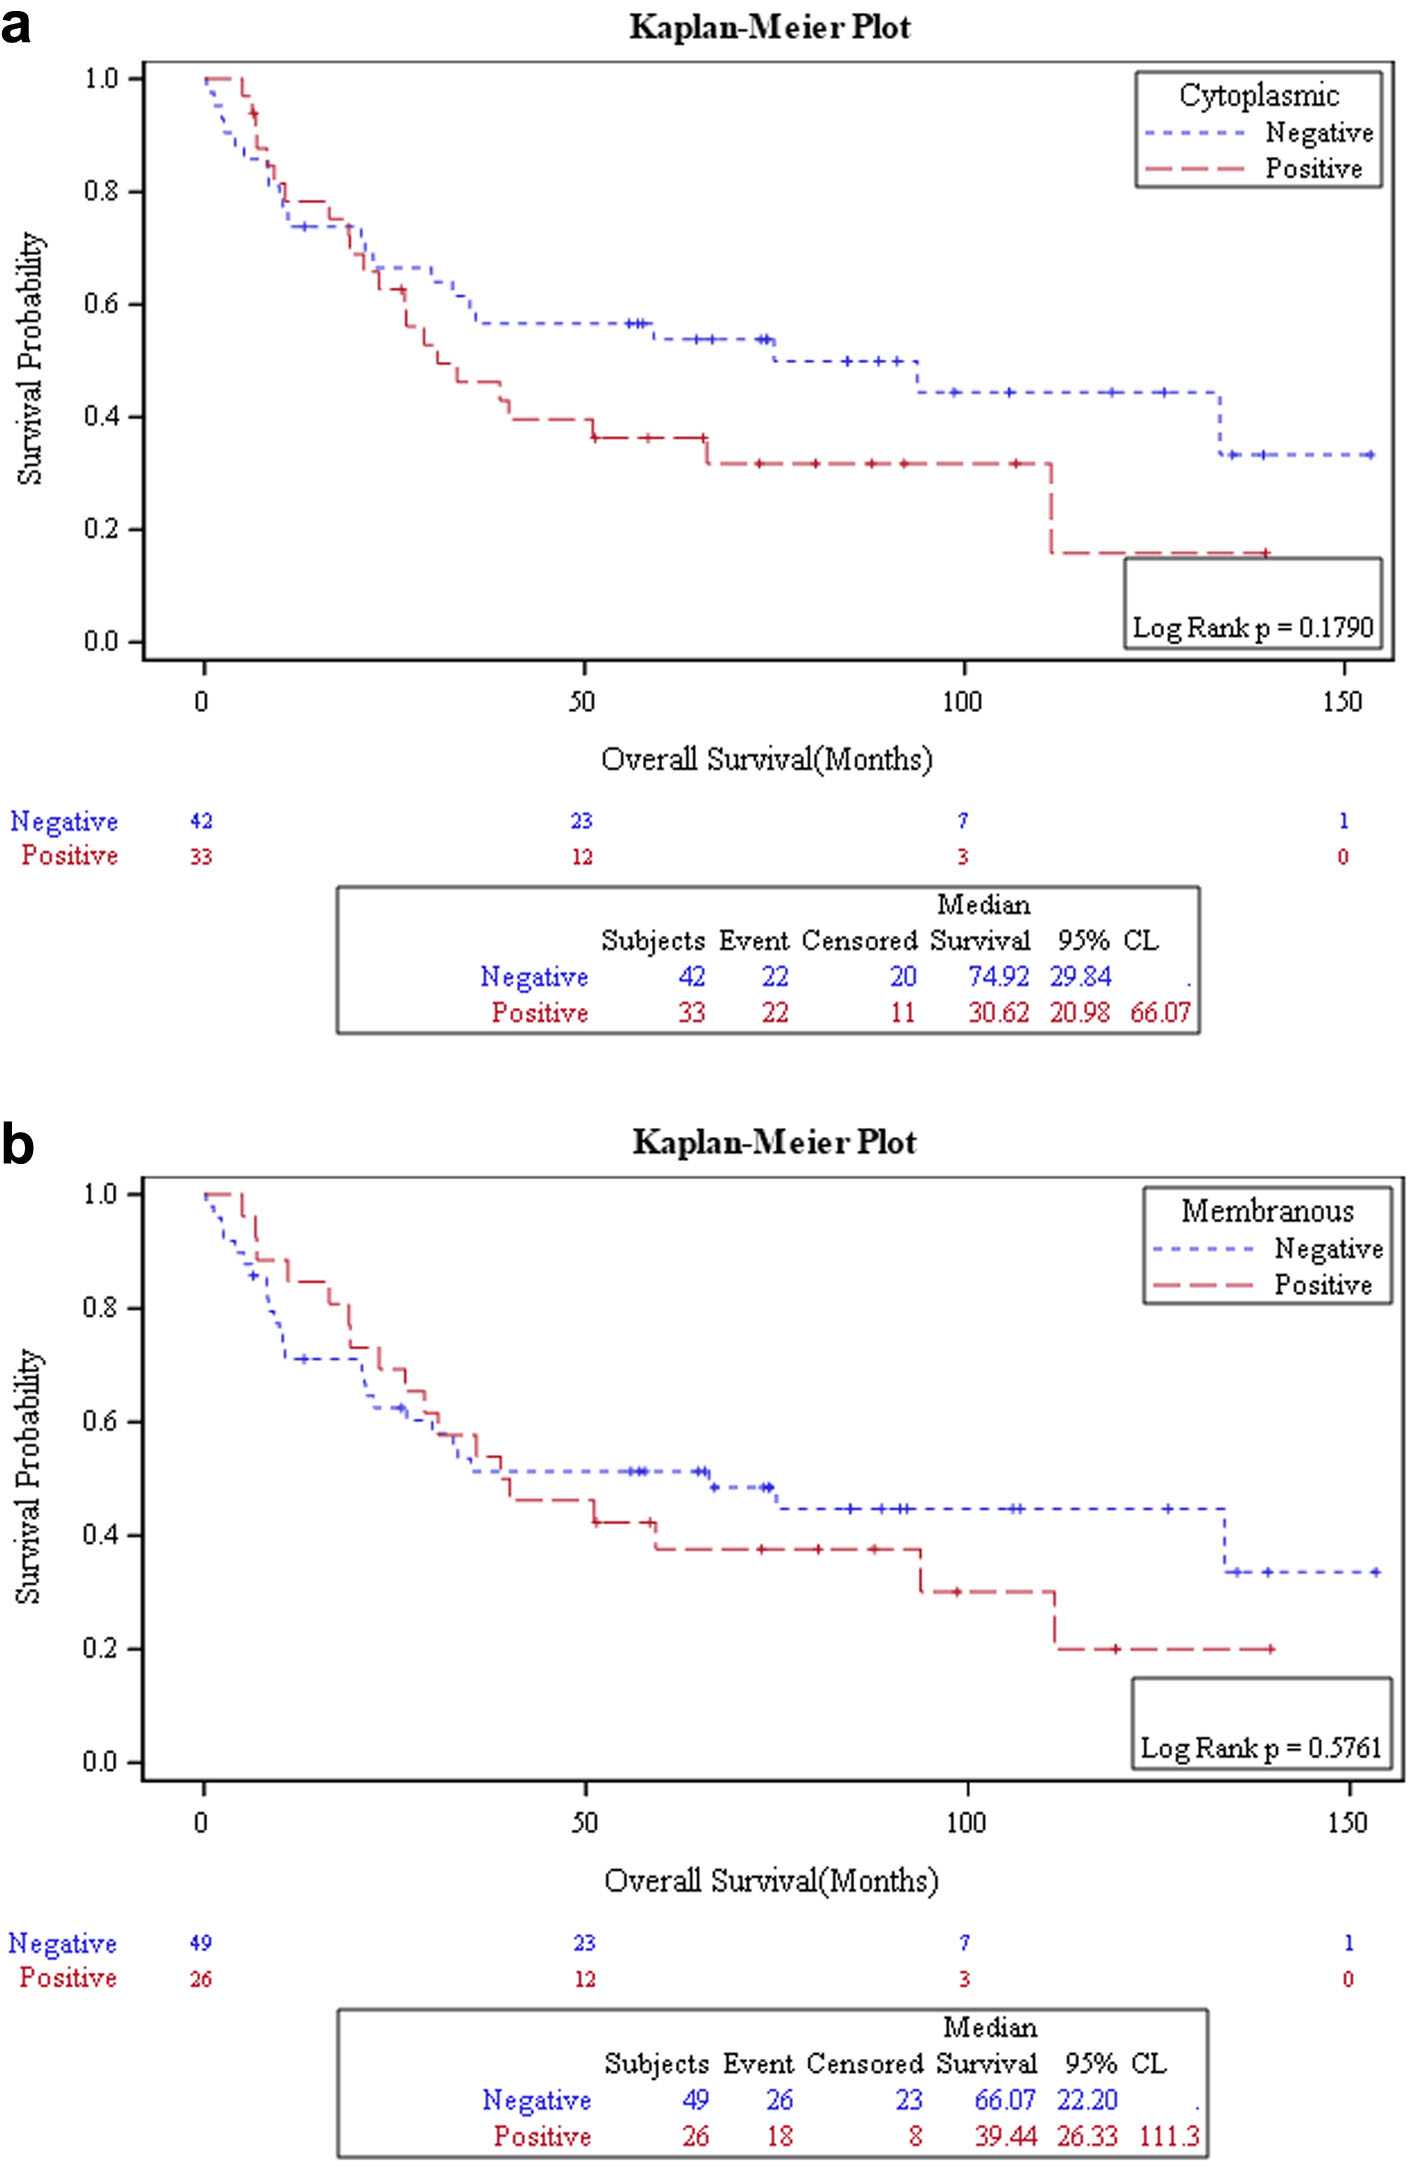
↓  Figure 2. Kaplan–Meier curve analysis of overall survival in gastric cancer patients. (a) Association between cytoplasmic Siglec-15 expression and overall survival. (b) Association between membranous Siglec-15 expression and overall survival.
Figure 2.
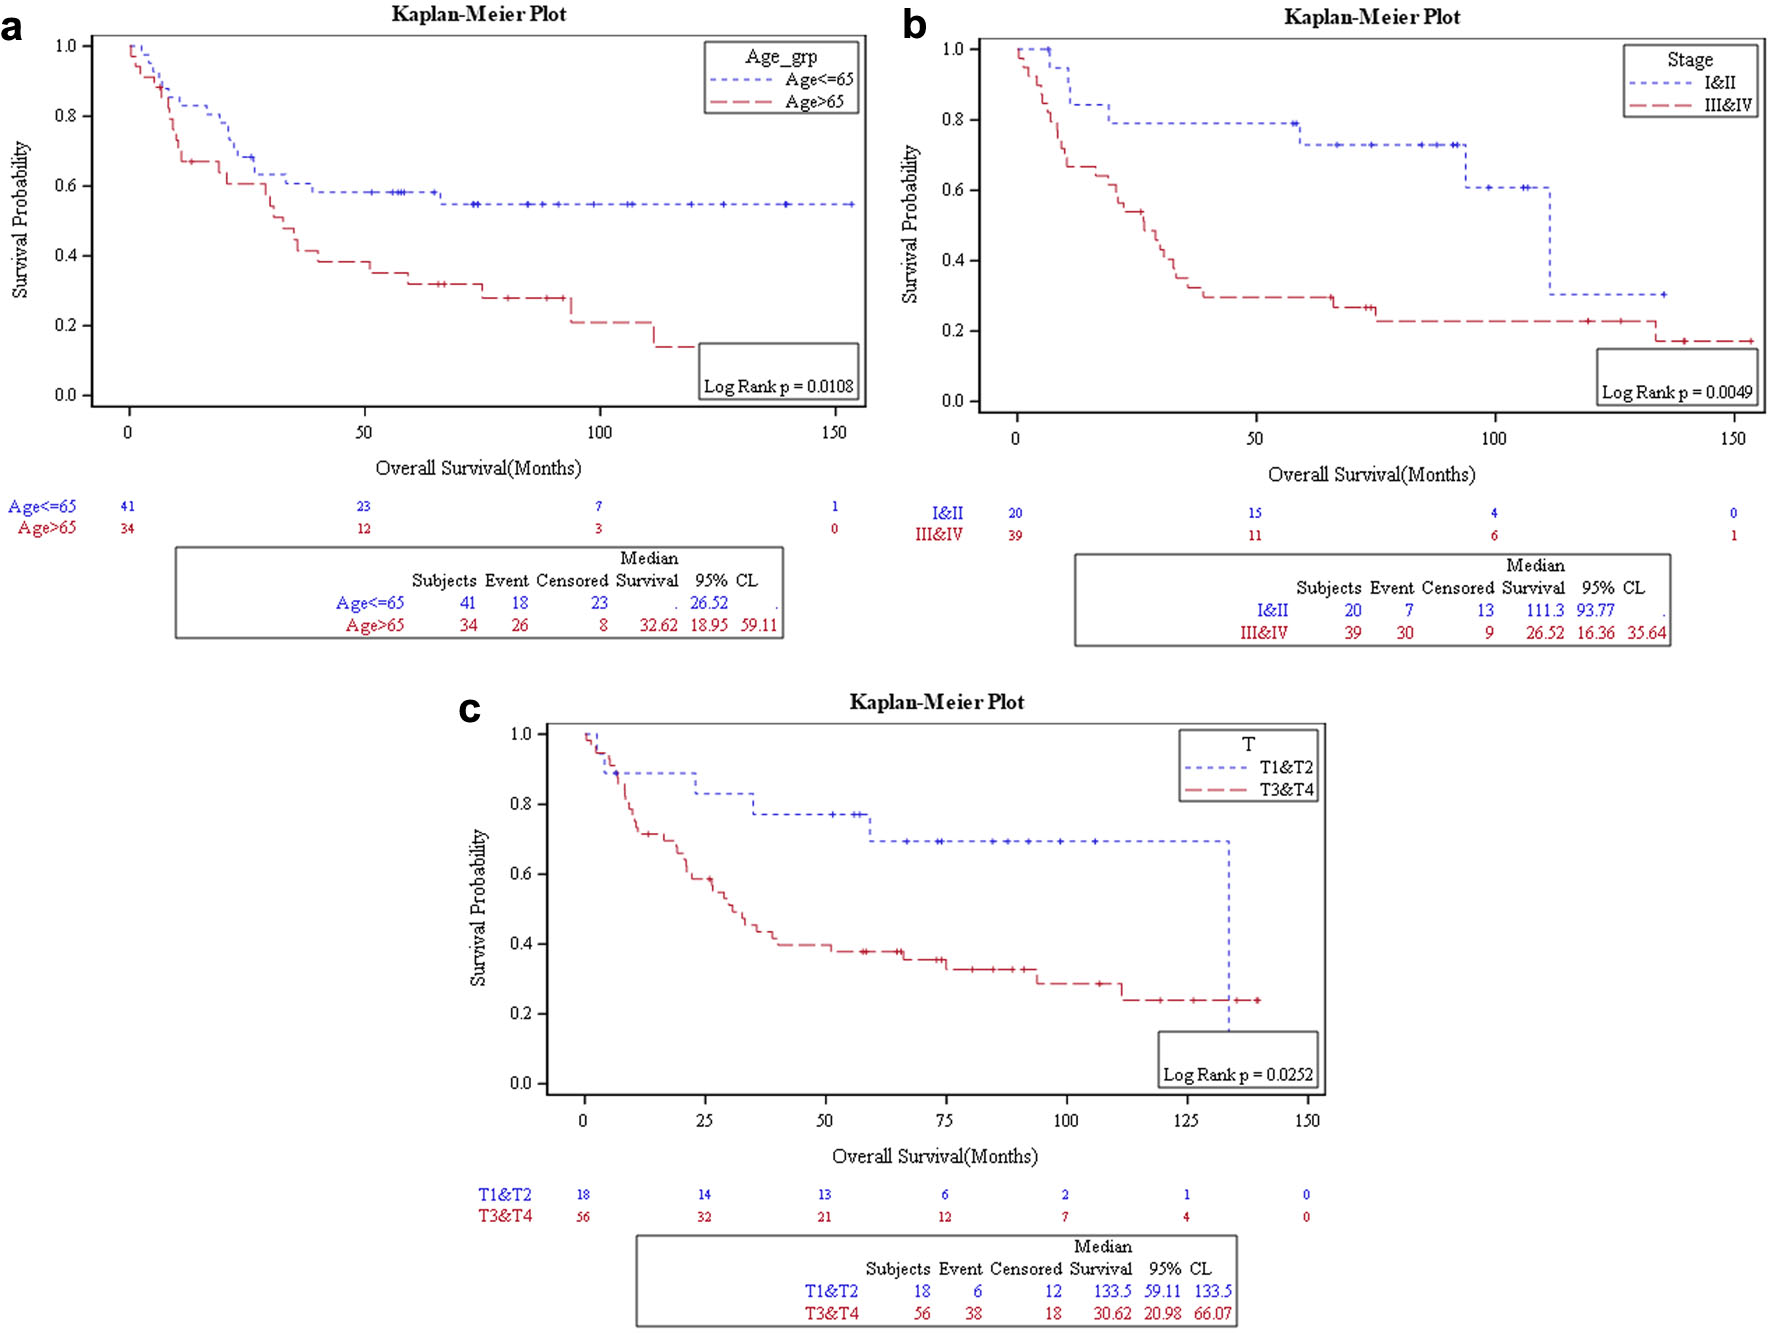
↓  Figure 3. Kaplan–Meier curve analysis of overall survival in gastric cancer patients. (a) Association between age and overall survival. (b) Association between clinical stage and overall survival. (c) Association between pathological T stage and overall survival.
Figure 3.

Tables

↓  Table 1. Demographic, Clinicopathological, and Molecular Characteristics of Gastric Cancer Patients
 
VariableNumberPercentage (%)
GC: gastric cancer; NA: not available; PD-L1: programmed death-ligand 1; TAM: tumor-associated macrophage.
Gender
  Female2937.7%
  Male4862.3%
Differentiation
  NA2
  Moderate3344.0%
  Poor4256.0%
Clinical stage
  NA16
  I69.8%
  II1524.6%
  III3150.8%
  IV914.8%
Sigent cell
  NA1
  No5369.7%
  Yes2330.3%
Location
  NA3
  Distal3851.3%
  Proximal2331.1%
  Whole1317.6%
Neoadjuvant therapy
  No5166.2%
  Yes2633.8%
Gastritis
  No6483.1%
  Yes1316.9%
H. pylori
  No6989.6%
  Yes810.4%
Lymphovascular invasion
  Yes4051.9%
  No3748.1%
PD-L1
  NEG2633.8%
  POS5166.2%
pT
  NA1
  T167.9%
  T21317.1%
  T32836.8%
  T42938.2%
pN
  NA
  N positive5776%
  N01824.0%
pM
  NA1
  04457.9%
  13242.1%
Laurén classification
  Diffuse2937.7%
  Indeterminate2937.7%
  Intestinal1924.6%
Cytoplasmic Siglec-15 expression in GC cells
  Negative4457.1%
  Positive (≥ 40%)3342.9%
Membranous Siglec-15 expression in GC cells
  Negative5166.2%
  Positive (≥ 20%)2633.8%
Siglec-15 expression in TAM cells
  Negative4963.6%
  Positive (≥ 20%)2836.4%


↓  Table 2. Membranous and Cytoplasmic Siglec-15 Expression and Its Association With Various Clinical Variables in Gastric Cancer Patients
 
VariableCategoryMembranousP-valueCytoplasmicP-value
Negative (%)Positive (%)Negative (%)Positive (%)
*Statistically significant. PD-L1: programmed death-ligand 1.
Age (years)≤ 6527 (52.9%)14 (53.8%)0.94021 (47.7%)20 (60.6%)0.262
> 6524 (47.1%)12 (46.2%)23 (52.3%)13 (39.4%)
GenderFemale20 (39.2%)9 (34.6%)0.69416 (36.4%)13 (39.4%)0.786
Male31 (60.8%)17 (65.4%)28 (63.6%)20 (60.6%)
DifferentiationModerate18 (36.0%)15 (60.0%)0.048*18 (42.9%)15 (45.5%)0.822
Poor32 (64.0%)10 (40.0%)24 (57.1%)18 (54.5%)
Clinical stageI & II12 (30.0%)9 (42.9%)0.31512 (35.3%)9 (33.3%)0.873
III & IV28 (70.0%)12 (57.1%)22 (64.7%)18 (66.7%)
Signet ring cellNo32 (64.0%)21 (80.8%)0.13130 (69.8%)23 (69.7%)0.995
Yes18 (36.0%)5 (19.2%)13 (30.2%)10 (30.3%)
LocationDistal26 (54.2%)12 (46.2%)0.61625 (59.5%)13 (40.6%)0.199
Proximal13 (27.1%)10 (38.5%)12 (28.6%)11 (34.4%)
Whole9 (18.8%)4 (15.4%)5 (11.9%)8 (25.0%)
Neoadjuvant therapyNo35 (68.6%)16 (61.5%)0.53432 (72.7%)19 (57.6%)0.164
Yes16 (31.4%)10 (38.5%)12 (27.3%)14 (42.4%)
GastritisNo41 (80.4%)23 (88.5%)0.52535 (79.5%)29 (87.9%)0.376
Yes10 (19.6%)3 (11.5%)9 (20.5%)4 (12.1%)
H. pyloriNo45 (88.2%)24 (92.3%)0.71039 (88.6%)30 (90.9%)1.000
Yes6 (11.8%)2 (7.7%)5 (11.4%)3 (9.1%)
Lymphovascular invasionYes24 (47.1%)16 (61.5%)0.22919 (43.2%)21 (63.6%)0.075
No27 (52.9%)10 (38.5%)25 (56.8%)12 (36.4%)
PD-L1Negative20 (39.2%)6 (23.1%)0.15714 (31.8%)12 (36.4%)0.676
Positive31 (60.8%)20 (76.9%)30 (68.2%)21 (63.6%)
pT stageT1 & T214 (28.0%)5 (19.2%)0.40214 (32.6%)5 (15.2%)0.111
T3 & T436 (72.0%)21 (80.8%)29 (67.4%)28 (84.8%)
pN statusN012 (24.5%)6 (23.1%)0.89212 (27.9%)6 (18.8%)0.358
N+37 (75.5%)20 (76.9%)31 (72.1%)26 (81.3%)
pM statusM026 (52.0%)18 (69.2%)0.14921 (48.8%)23 (69.7%)0.068
M124 (48.0%)8 (30.8%)22 (51.2%)10 (30.3%)
Laurén typeDiffuse22 (43.1%)7 (26.9%)0.36515 (34.1%)14 (42.4%)0.501
Indeterminate18 (35.3%)11 (42.3%)16 (36.4%)13 (39.4%)
Intestinal11 (21.6%)8 (30.8%)13 (29.5%)6 (18.2%)


↓  Table 3. TAM Siglec-15 Expression and Its Association With Various Clinical Variables in Gastric Cancer Patients
 
VariableCategoryNegative (%)Positive (%)P-value
PD-L1: programmed death-ligand 1; TAM: tumor-associated macrophage.
Age (years)≤ 6524 (49.0%)17 (60.7%)0.321
> 6525 (51.0%)11 (39.3%)
GenderFemale18 (36.7%)11 (39.3%)0.824
Male31 (63.3%)17 (60.7%)
DifferentiationModerate20 (41.7%)13 (48.1%)0.587
Poor28 (58.3%)14 (51.9%)
Clinical stageI & II16 (41.0%)5 (22.7%)0.149
III & IV23 (59.0%)17 (77.3%)
Signet ring cellNo32 (66.7%)21 (75.0%)0.446
Yes16 (33.3%)7 (25.0%)
LocationDistal26 (56.5%)12 (42.9%)0.447
Proximal12 (26.1%)11 (39.3%)
Whole8 (17.4%)5 (17.9%)
Neoadjuvant therapyNo32 (65.3%)19 (67.9%)0.820
Yes17 (34.7%)9 (32.1%)
GastritisNo42 (85.7%)22 (78.6%)0.421
Yes7 (14.3%)6 (21.4%)
H. pyloriNo44 (89.8%)25 (89.3%)1.000
Yes5 (10.2%)3 (10.7%)
Lymphovascular invasionYes22 (44.9%)18 (64.3%)0.101
No27 (55.1%)10 (35.7%)
PD-L1Negative20 (40.8%)6 (21.4%)0.084
Positive29 (59.2%)22 (78.6%)
pT stageT1 & T215 (31.3%)4 (14.3%)0.169
T3 & T433 (68.8%)24 (85.7%)
pN statusN013 (27.1%)5 (18.5%)0.404
N+35 (72.9%)22 (81.5%)
pM statusM028 (58.3%)16 (57.1%)0.919
M120 (41.7%)12 (42.9%)
Laurén typeDiffuse20 (40.8%)9 (32.1%)0.720
Indeterminate18 (36.7%)11 (39.3%)
Intestinal11 (22.4%)10 (28.6%)