Figures
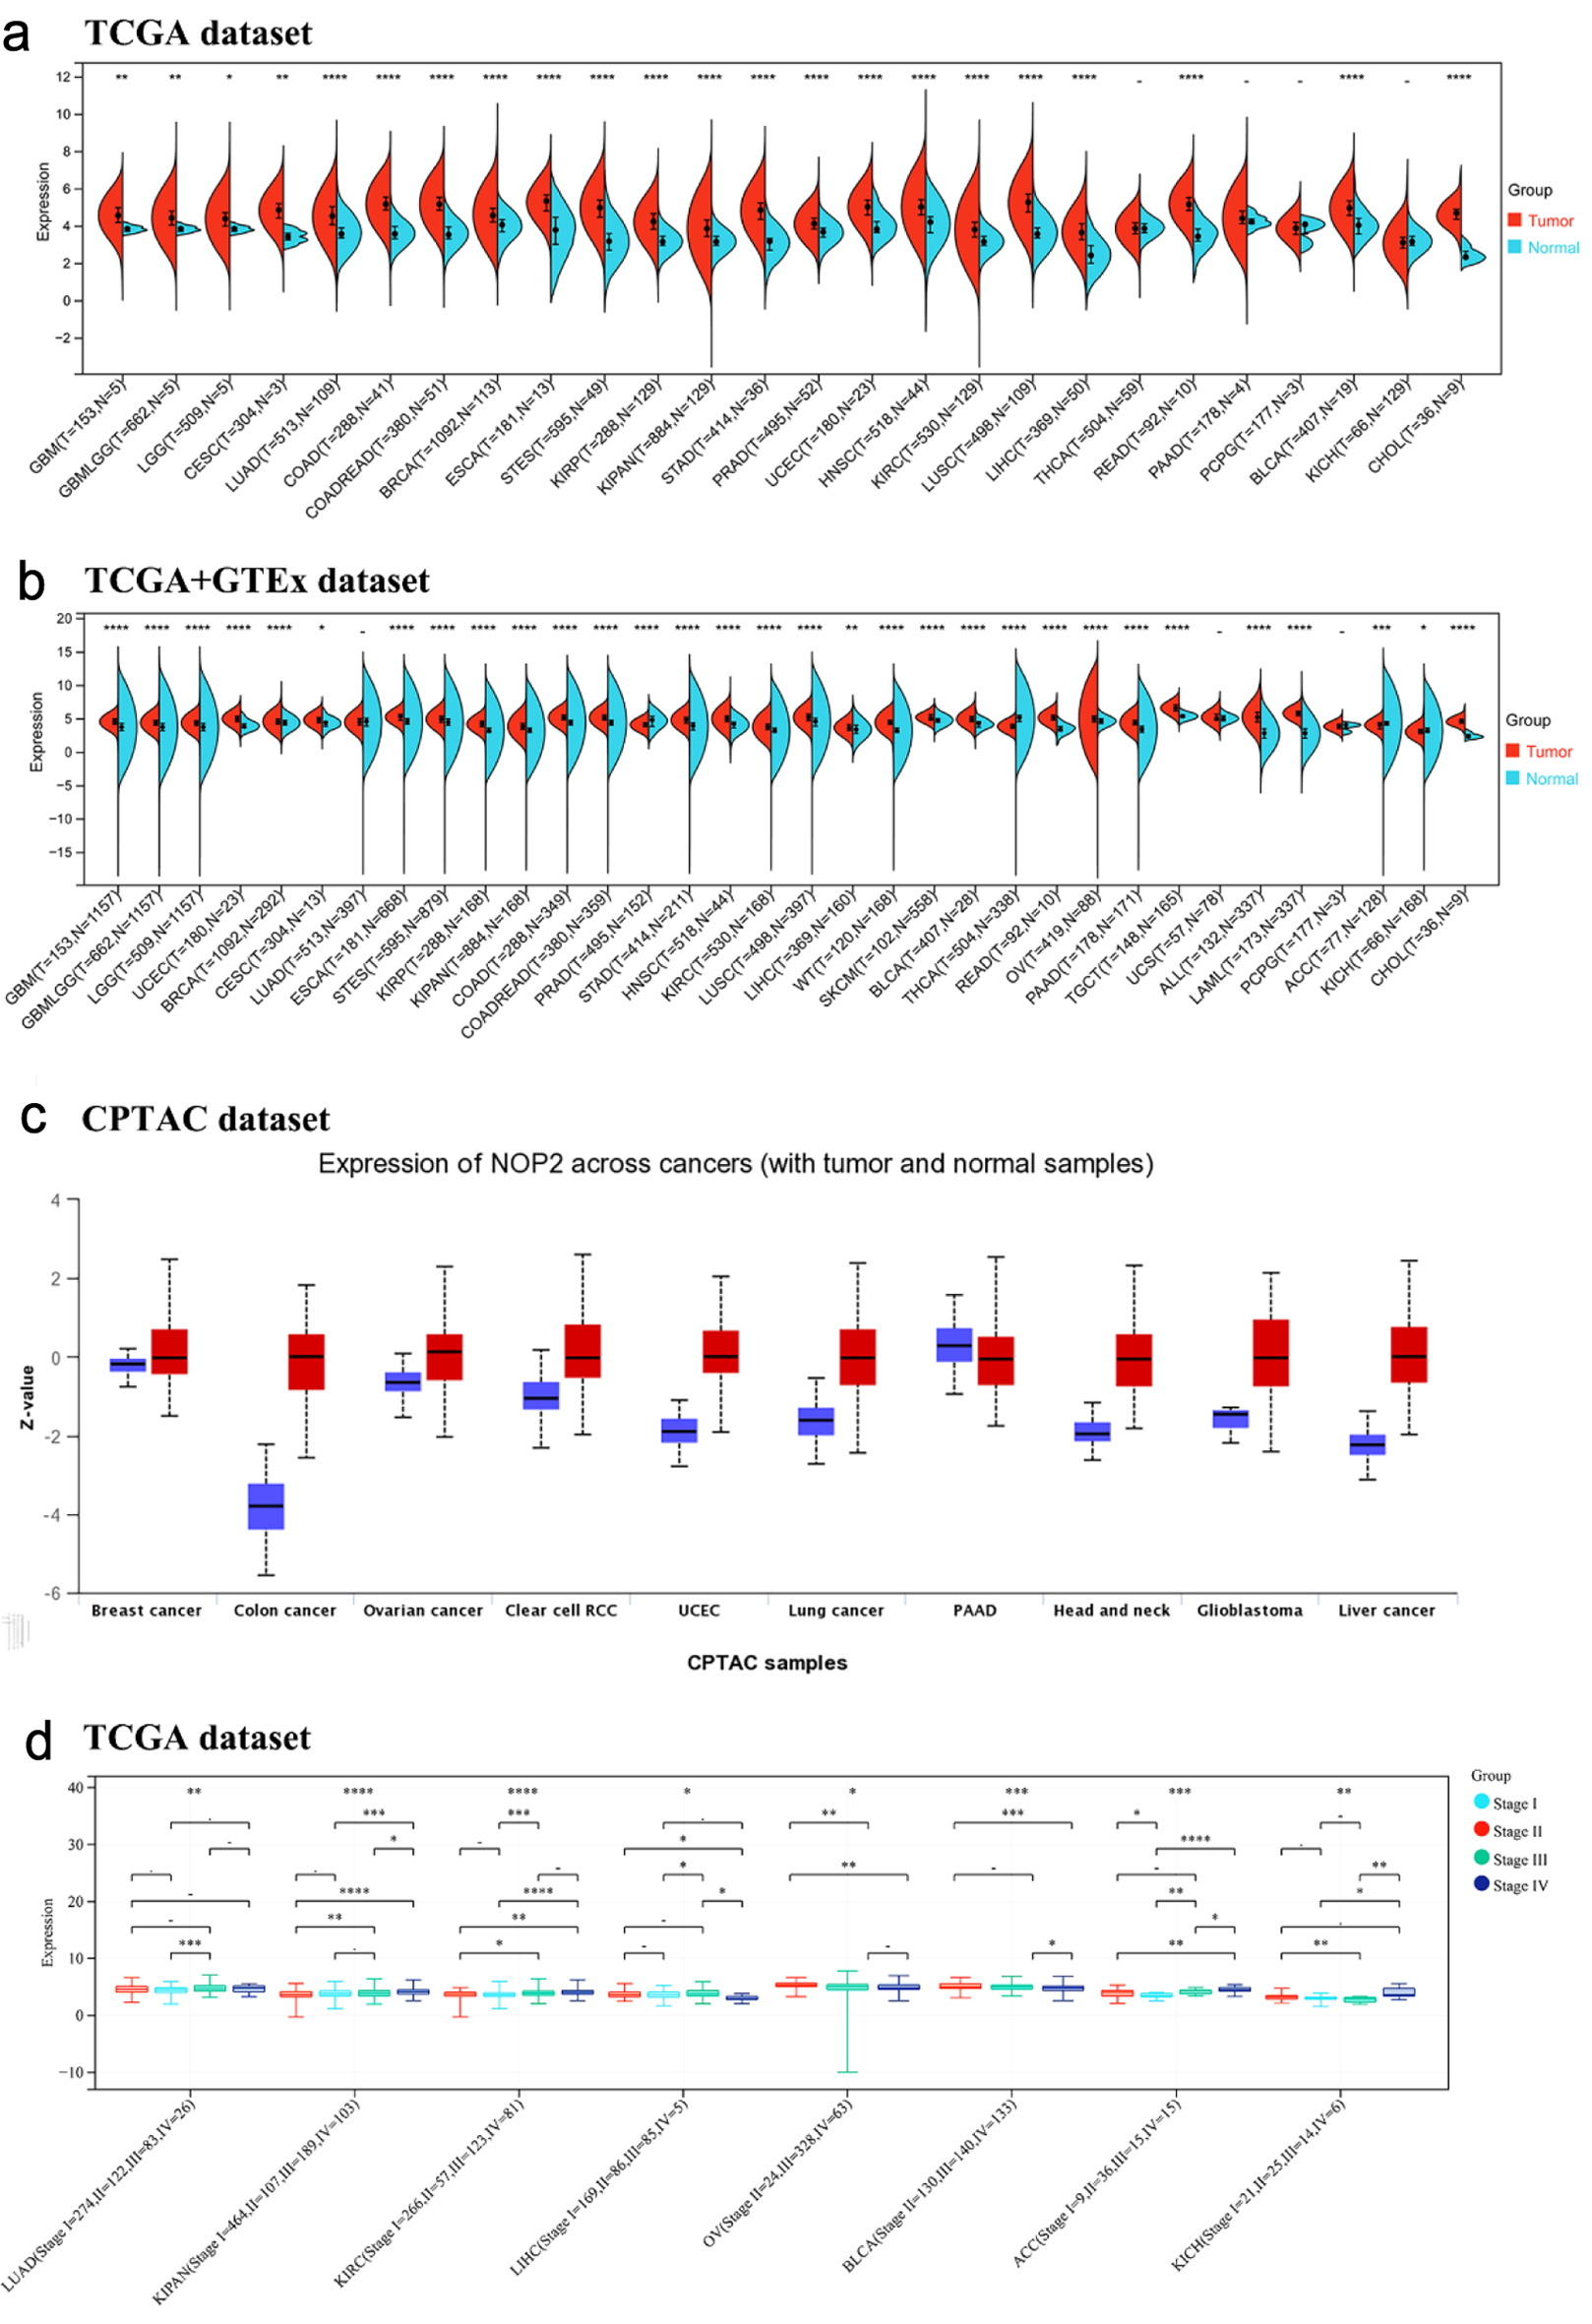
↓ Figure 1. Expression of NOP2 mRNA in pan-cancer tissues. (a) Expression of NOP2 mRNA in 33 tumors in the TCGA database. (b) Expression of NOP2 mRNA in 33 tumors from TCGA-GTEx samples. (c) Total protein expression levels of NOP2 in tumor tissues, including breast cancer, colon cancer, ovarian cancer, PAAD, as well as normal tissues. (d) Differential expression levels of NOP2 at different pathological stages in tumor tissues such as LUAD, KIRC, LIHC. ACC: adrenocortical carcinoma; BLCA: bladder urothelial carcinoma; BRCA: breast invasive carcinoma; CESC: cervical and endocervical cancers; CHOL: cholangiocarcinoma; COAD: colon adenocarcinoma; DLBC: lymphoid neoplasm diffuse large B-cell lymphoma; ESCA: esophageal carcinoma; GBM: glioblastoma multiforme; HNSC: head and neck squamous cell carcinoma; KICH: kidney chromophobe; KIRC: kidney renal clear cell carcinoma; KIRP: kidney renal papillary cell carcinoma; LAML: acute myeloid leukemia; LGG: brain lower grade glioma; LIHC: liver hepatocellular carcinoma; LUAD: lung adenocarcinoma; LUSC: lung squamous cell carcinoma; MESO: mesothelioma; OV: ovarian serous cystadenocarcinoma; PAAD: pancreatic adenocarcinoma; PCPG: pheochromocytoma and paraganglioma; PRAD: prostate adenocarcinoma; READ: rectum adenocarcinoma; SARC: sarcoma; SKCM: skin cutaneous melanoma; STAD: stomach adenocarcinoma; STES: stomach and esophageal carcinoma; TGCT: testicular germ cell tumors; THCA: thyroid carcinoma; THYM: thymoma; UCEC: uterine corpus endometrial carcinoma; UCS: uterine carcinosarcoma; UVM: uveal melanoma (Ns, P > 0.05; *P < 0.05; **P < 0.01; ***P < 0.001).
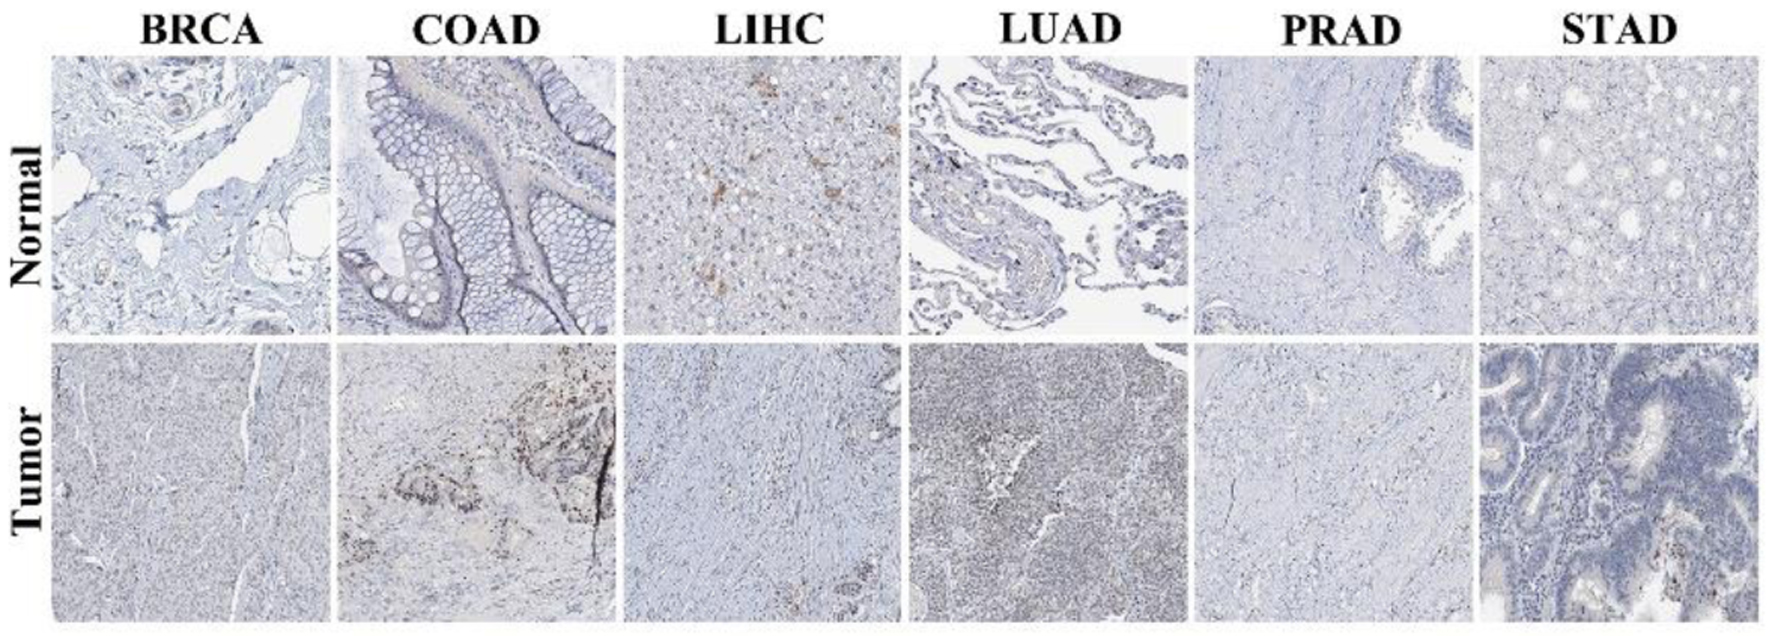
↓ Figure 2. Immunohistochemical staining of NOP2 in normal and tumor tissues. Representative immunohistochemistry (IHC) images of NOP2 expression in normal and corresponding tumor tissues obtained from the Human Protein Atlas (HPA) database.
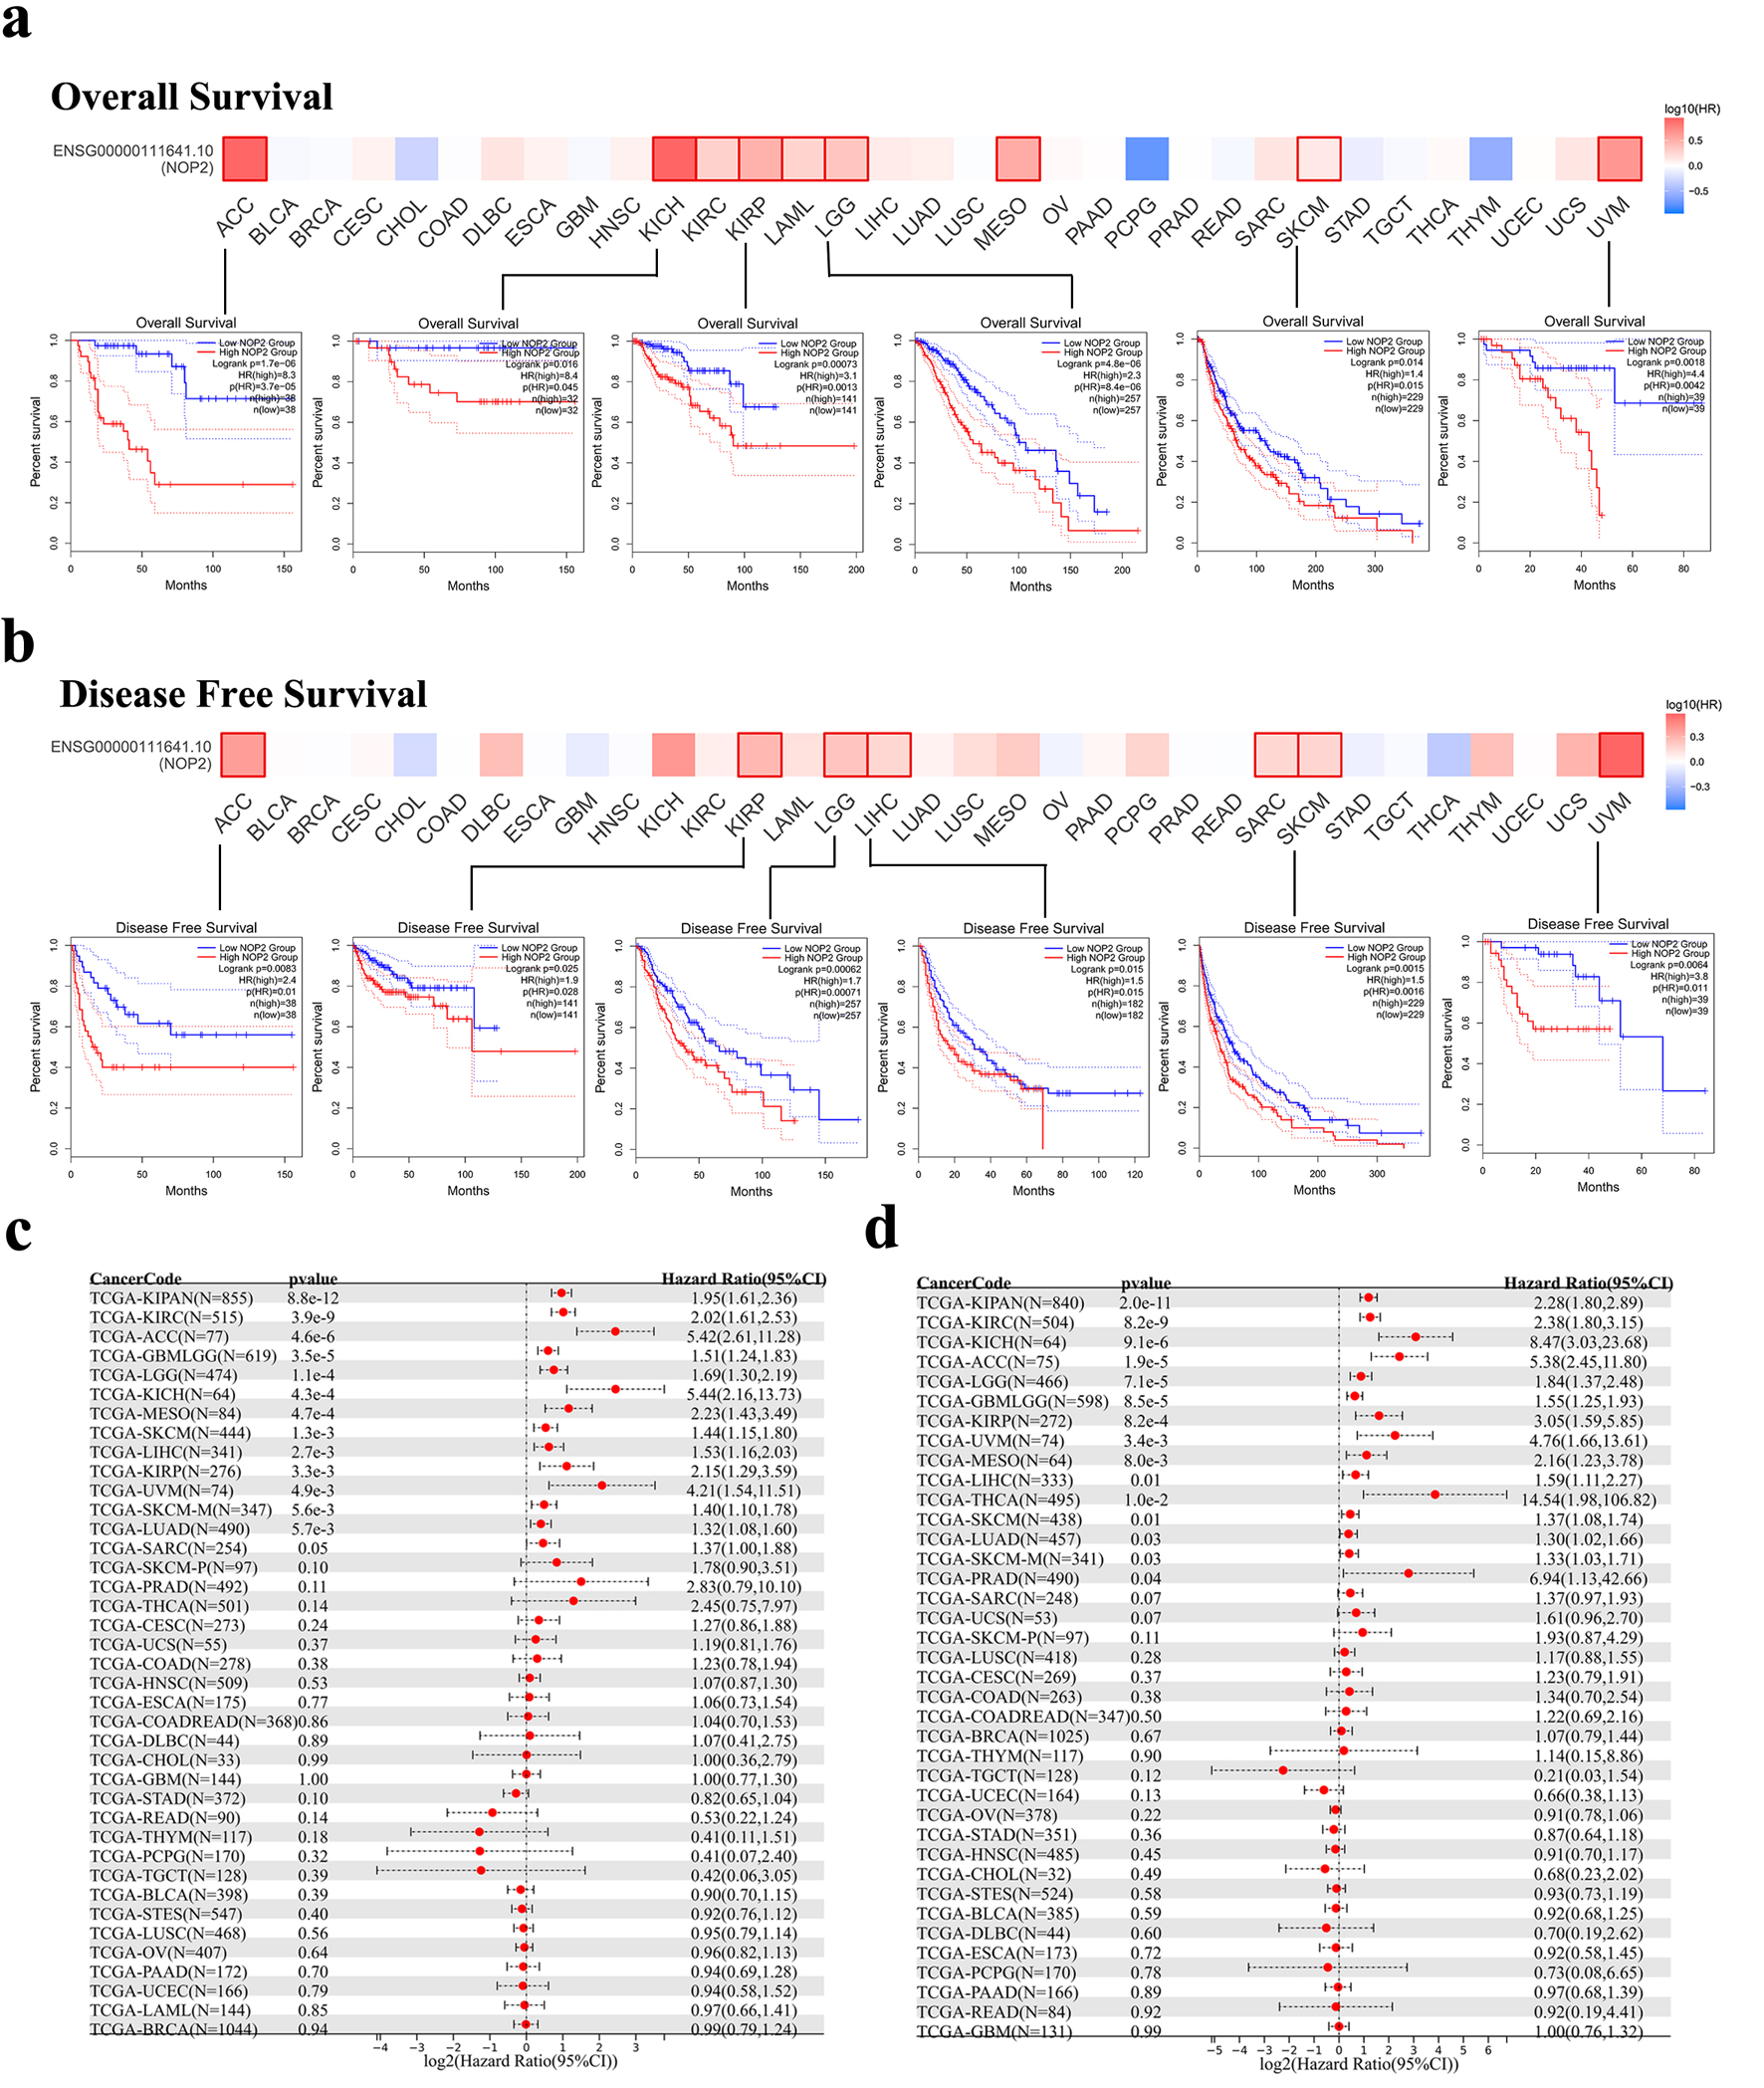
↓ Figure 3. Association between NOP2 expression and survival outcomes in TCGA cancers. (a) Kaplan–Meier analysis of overall survival (OS) according to NOP2 expression levels in ACC, KICH, KIRP, LGG, SKCM, and UVM. (b) Kaplan–Meier analysis of disease-free survival (DFS) according to NOP2 expression levels in ACC, KIRP, LGG, LIHC, SKCM, and UVM. (c) Forest plot summarizing the association between NOP2 expression and OS across 33 cancer types. (d) Forest plot summarizing the association between NOP2 expression and DFS across 33 cancer types. ACC: adrenocortical carcinoma; KICH: kidney chromophobe; KIRP: kidney renal papillary cell carcinoma; LGG: brain lower grade glioma; LIHC: liver hepatocellular carcinoma; SKCM: skin cutaneous melanoma; UVM: uveal melanoma.
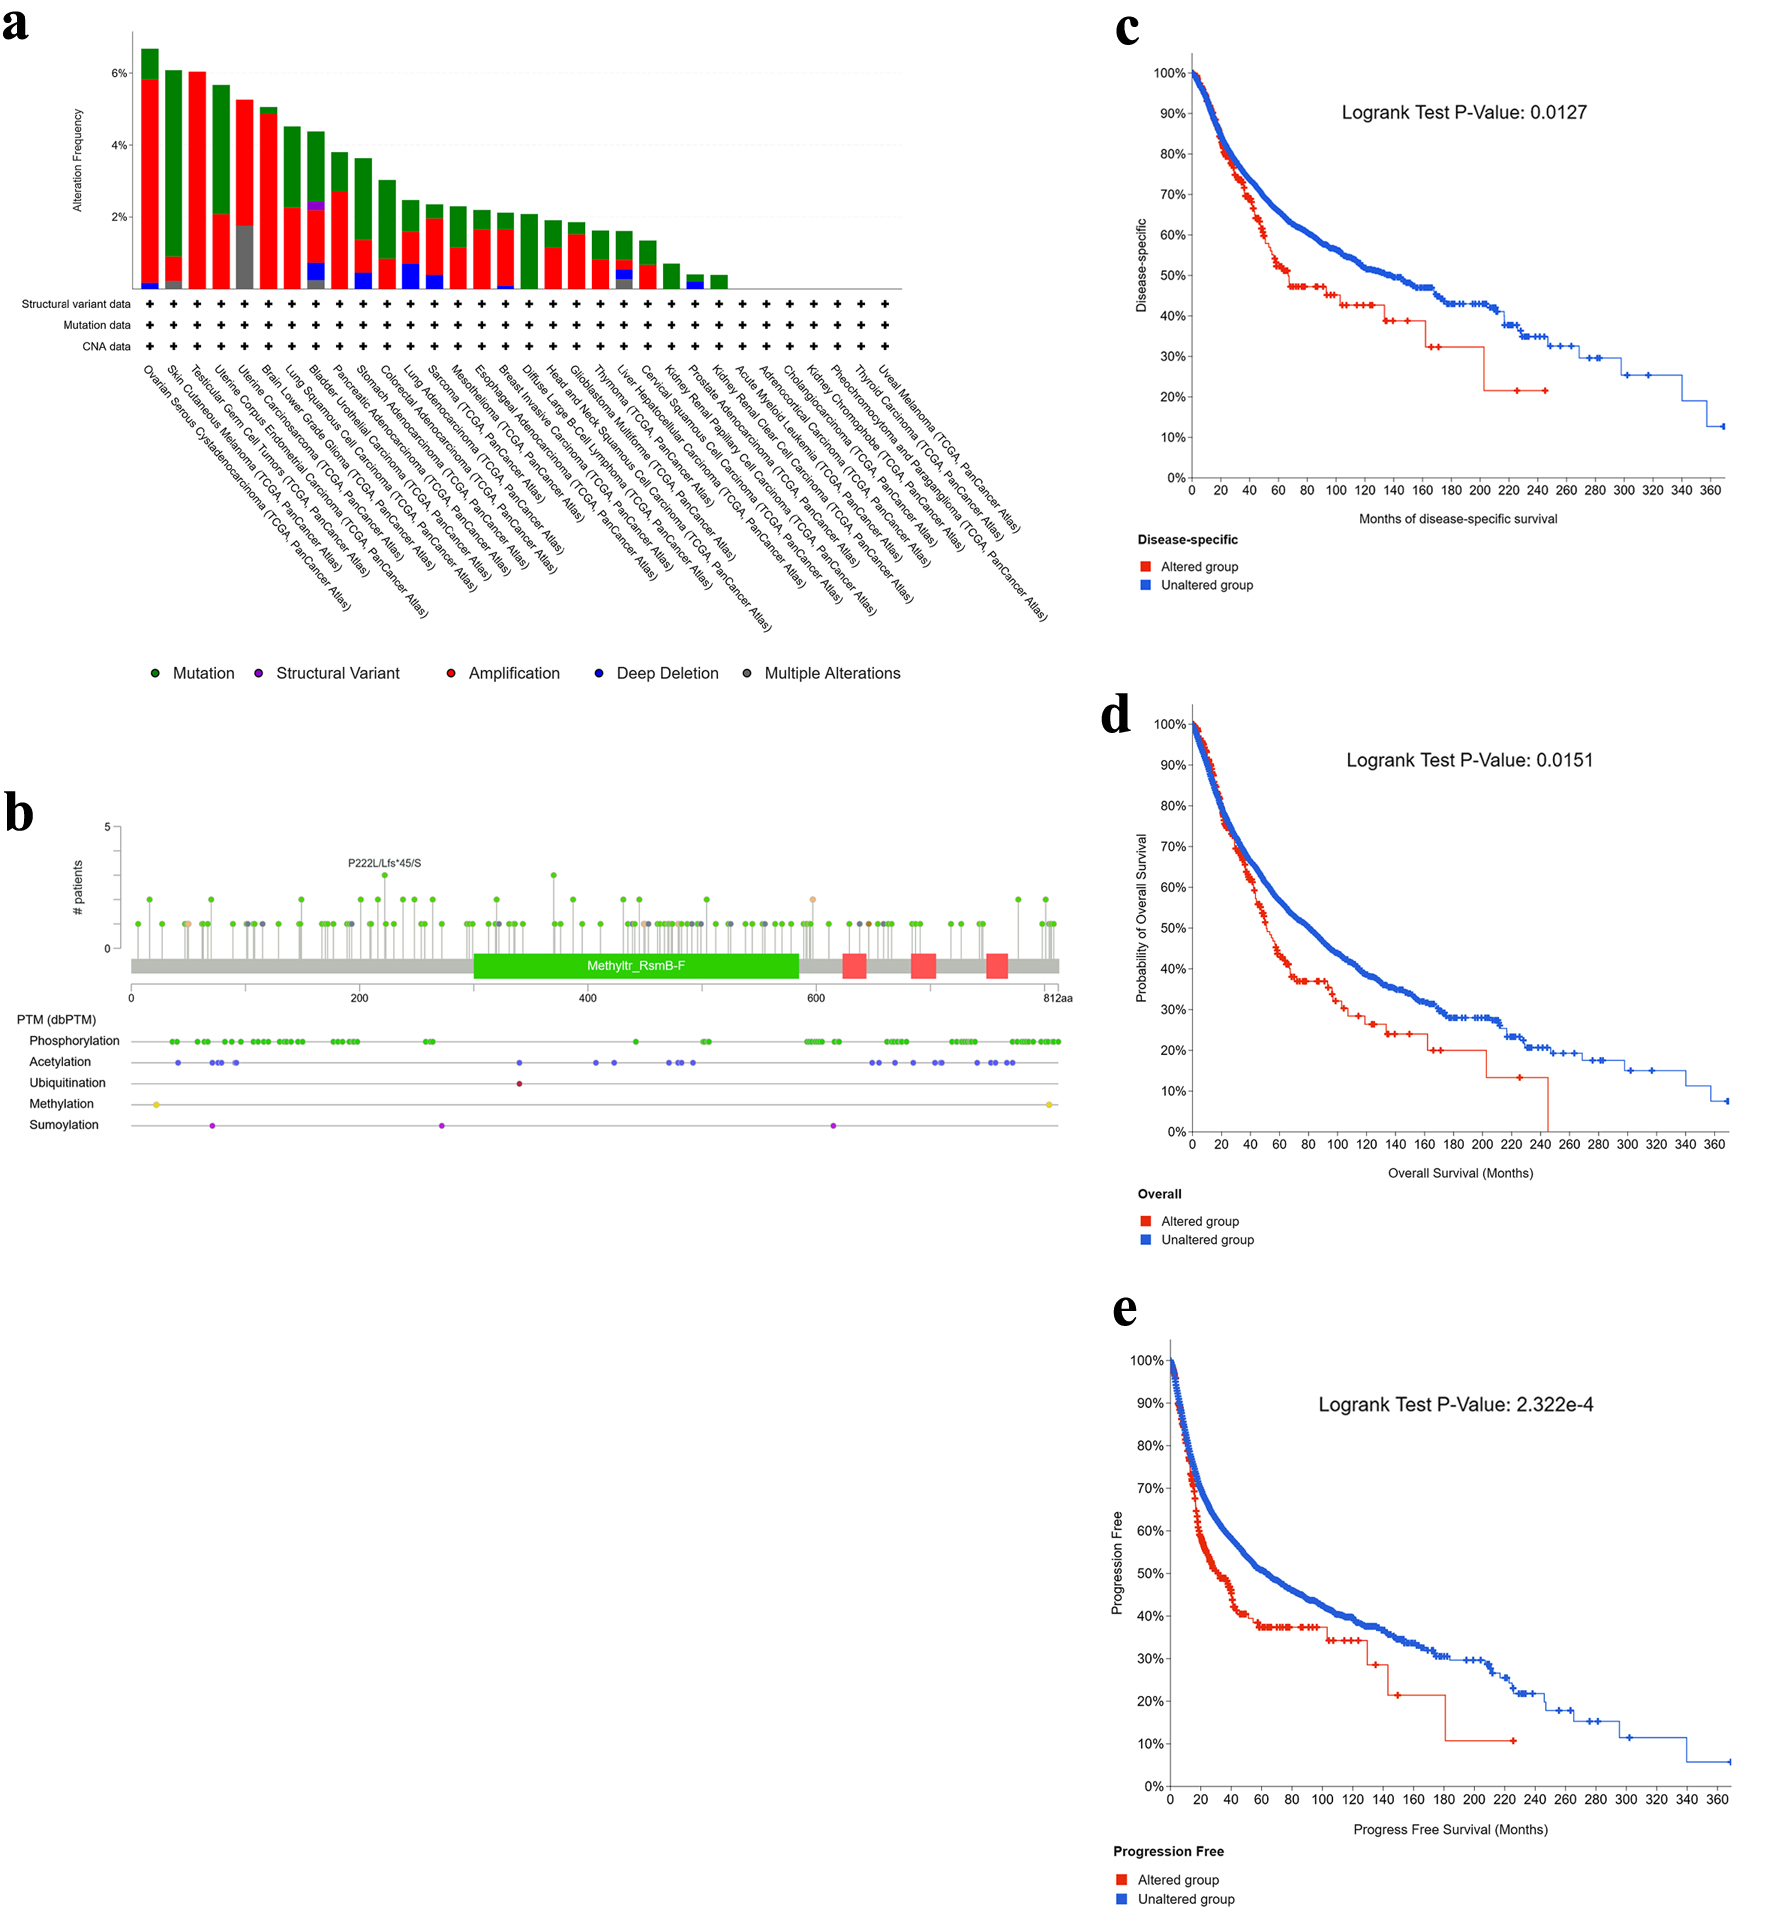
↓ Figure 4. Genetic alteration landscape of NOP2 across cancers. (a) Alteration frequency of NOP2 across different tumor types. (b) Distribution of NOP2 mutation types, mutation sites, and affected cases. (c–e) Kaplan–Meier analyses illustrating the impact of NOP2 genetic alterations on disease-specific survival (DSS), overall survival (OS), and progression-free survival (PFS), respectively.
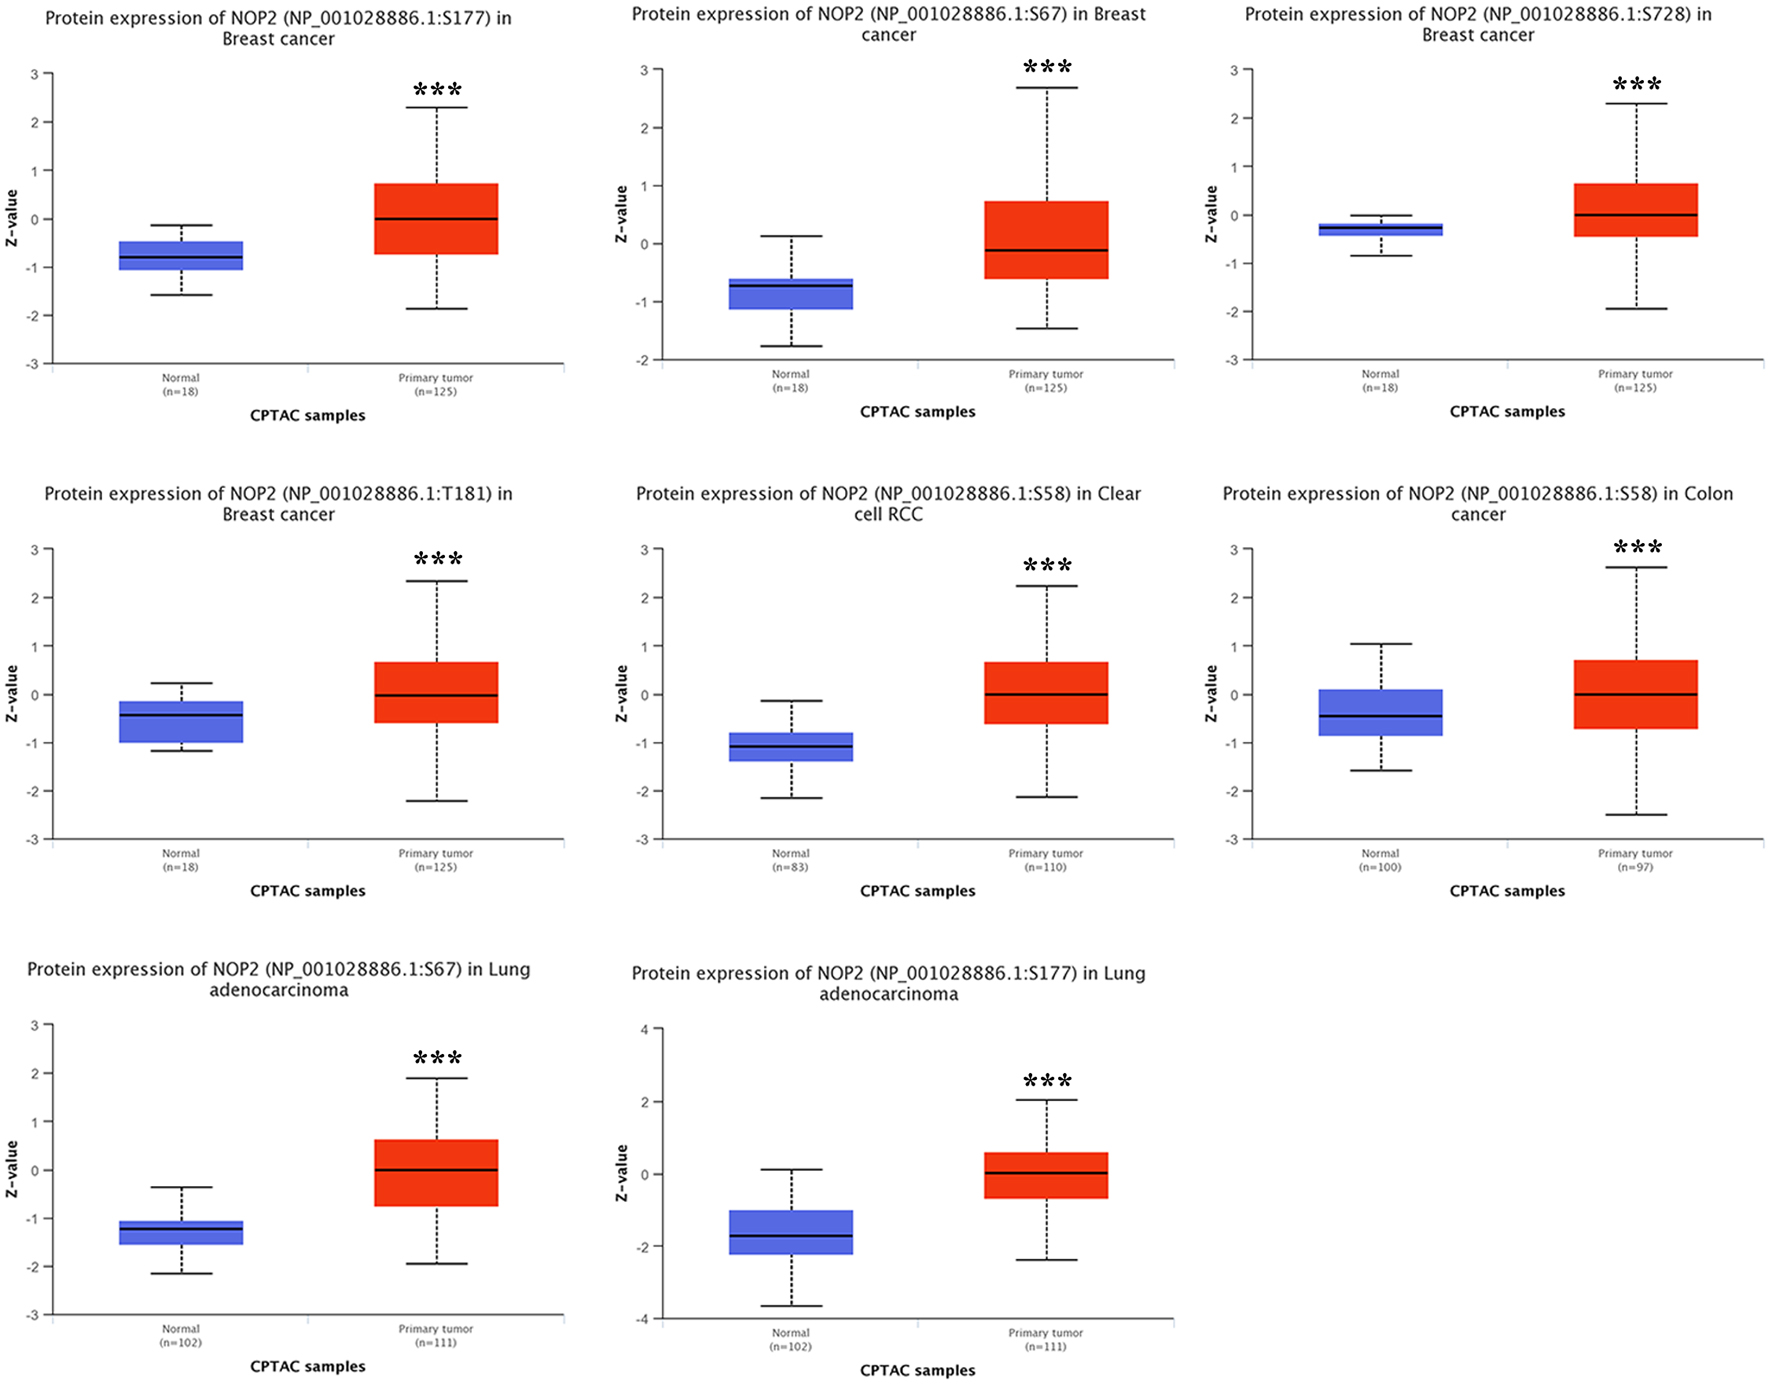
↓ Figure 5. Comparison of NOP2 phosphorylation levels between tumor and normal tissues. NOP2 phosphorylation levels at specific sites in tumor and corresponding normal tissues based on CPTAC datasets across selected cancer types.
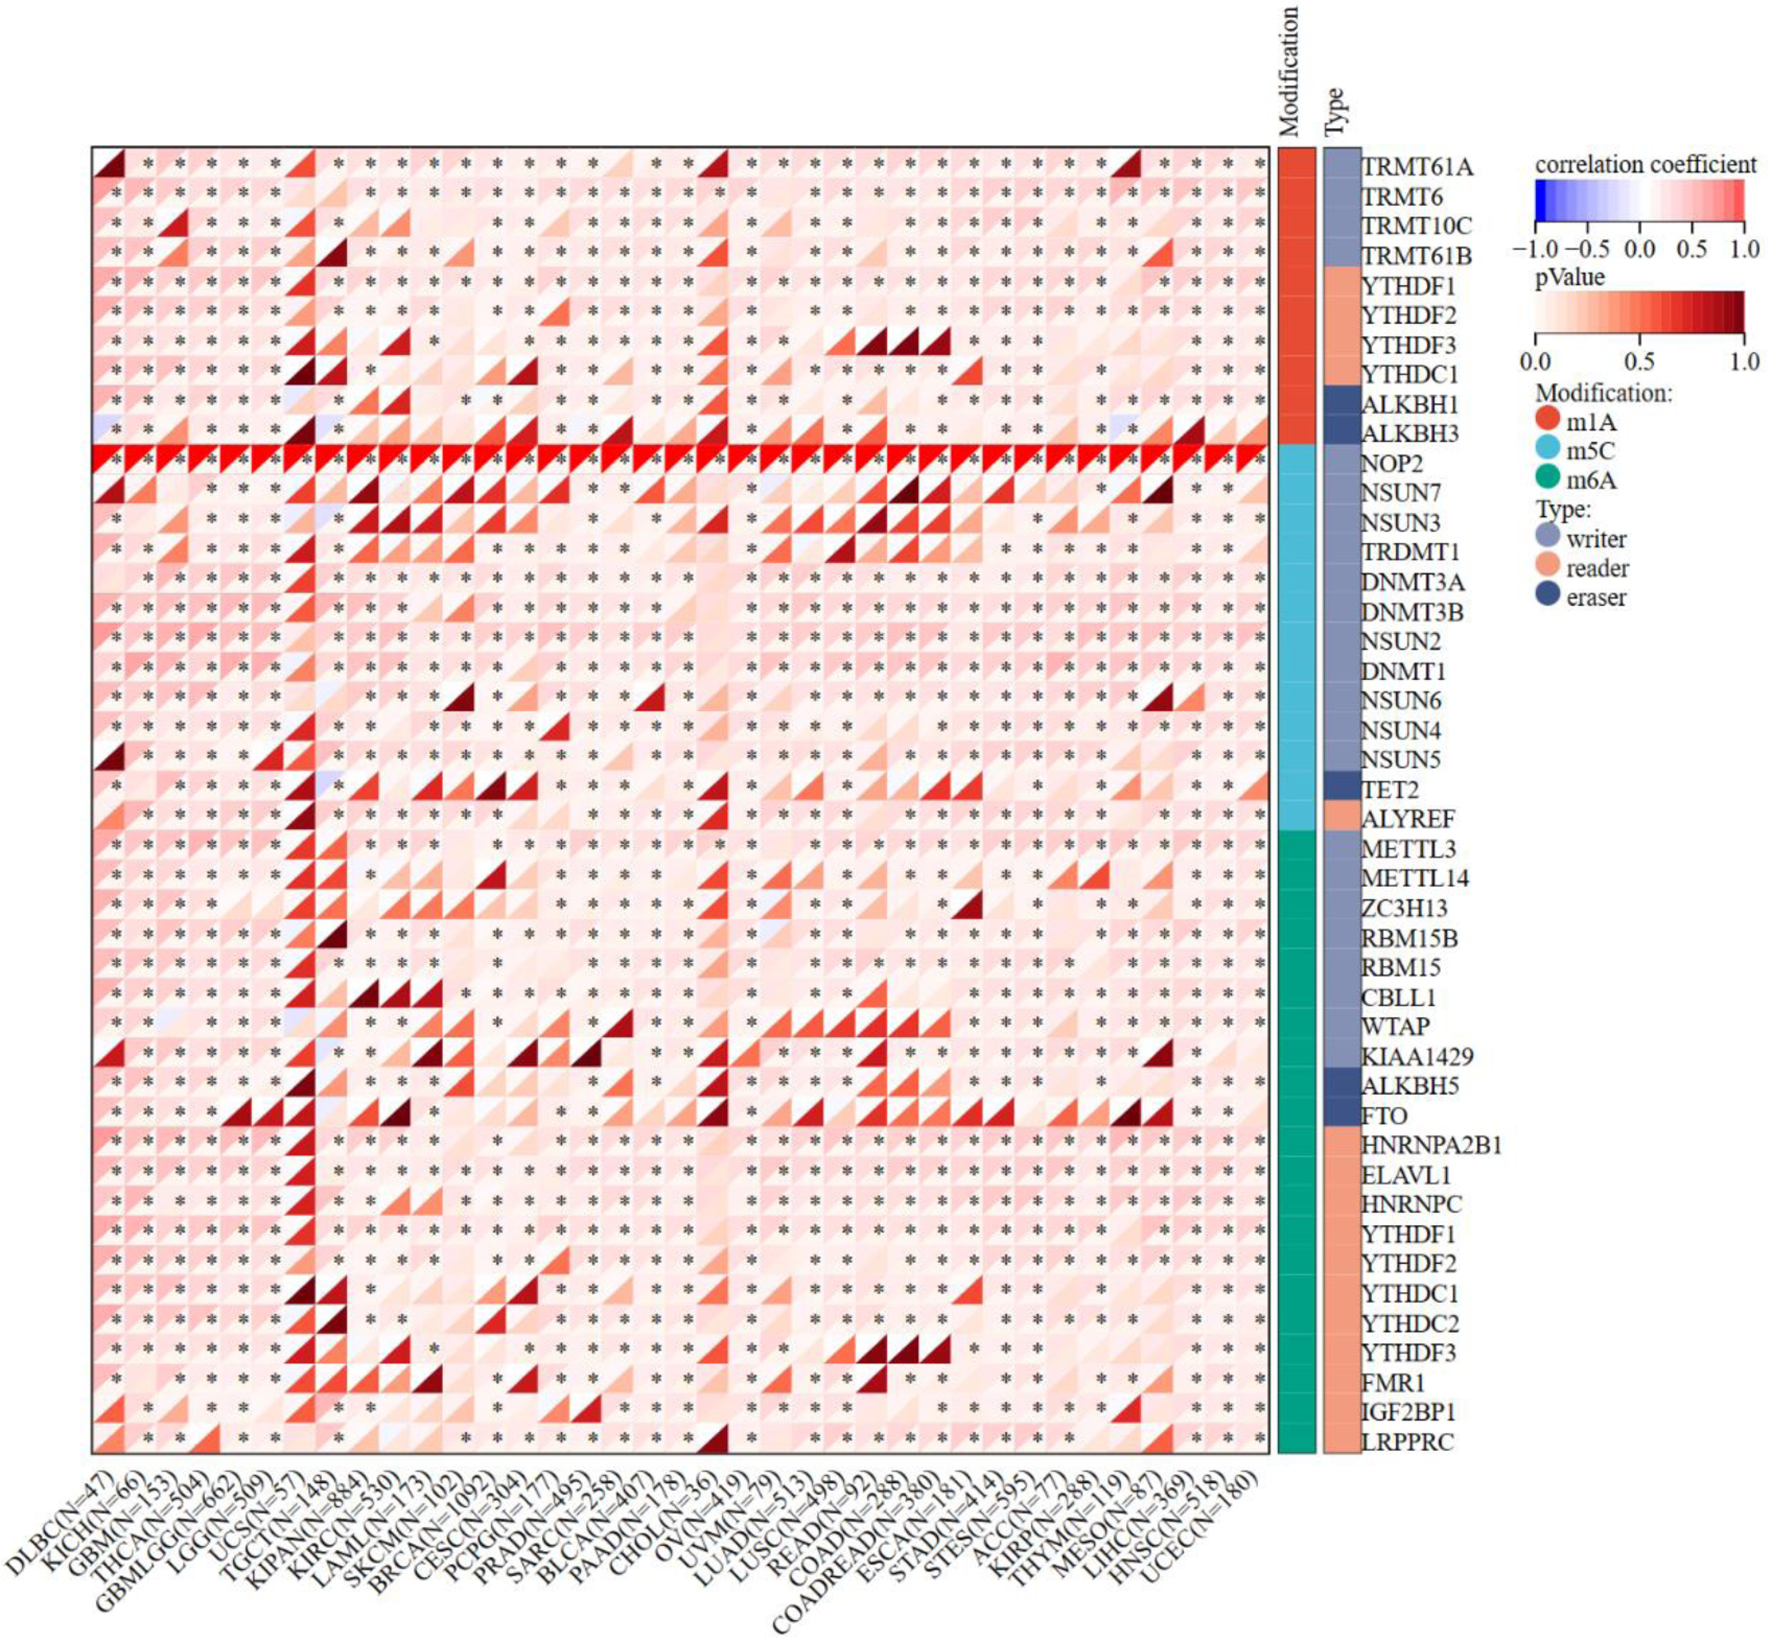
↓ Figure 6. Correlation matrix of NOP2 expression and RNA modification-related gene expression. Correlation analysis between NOP2 expression and genes associated with RNA modifications, including m1A, m5C, and m6A pathways across cancers. *P < 0.05.
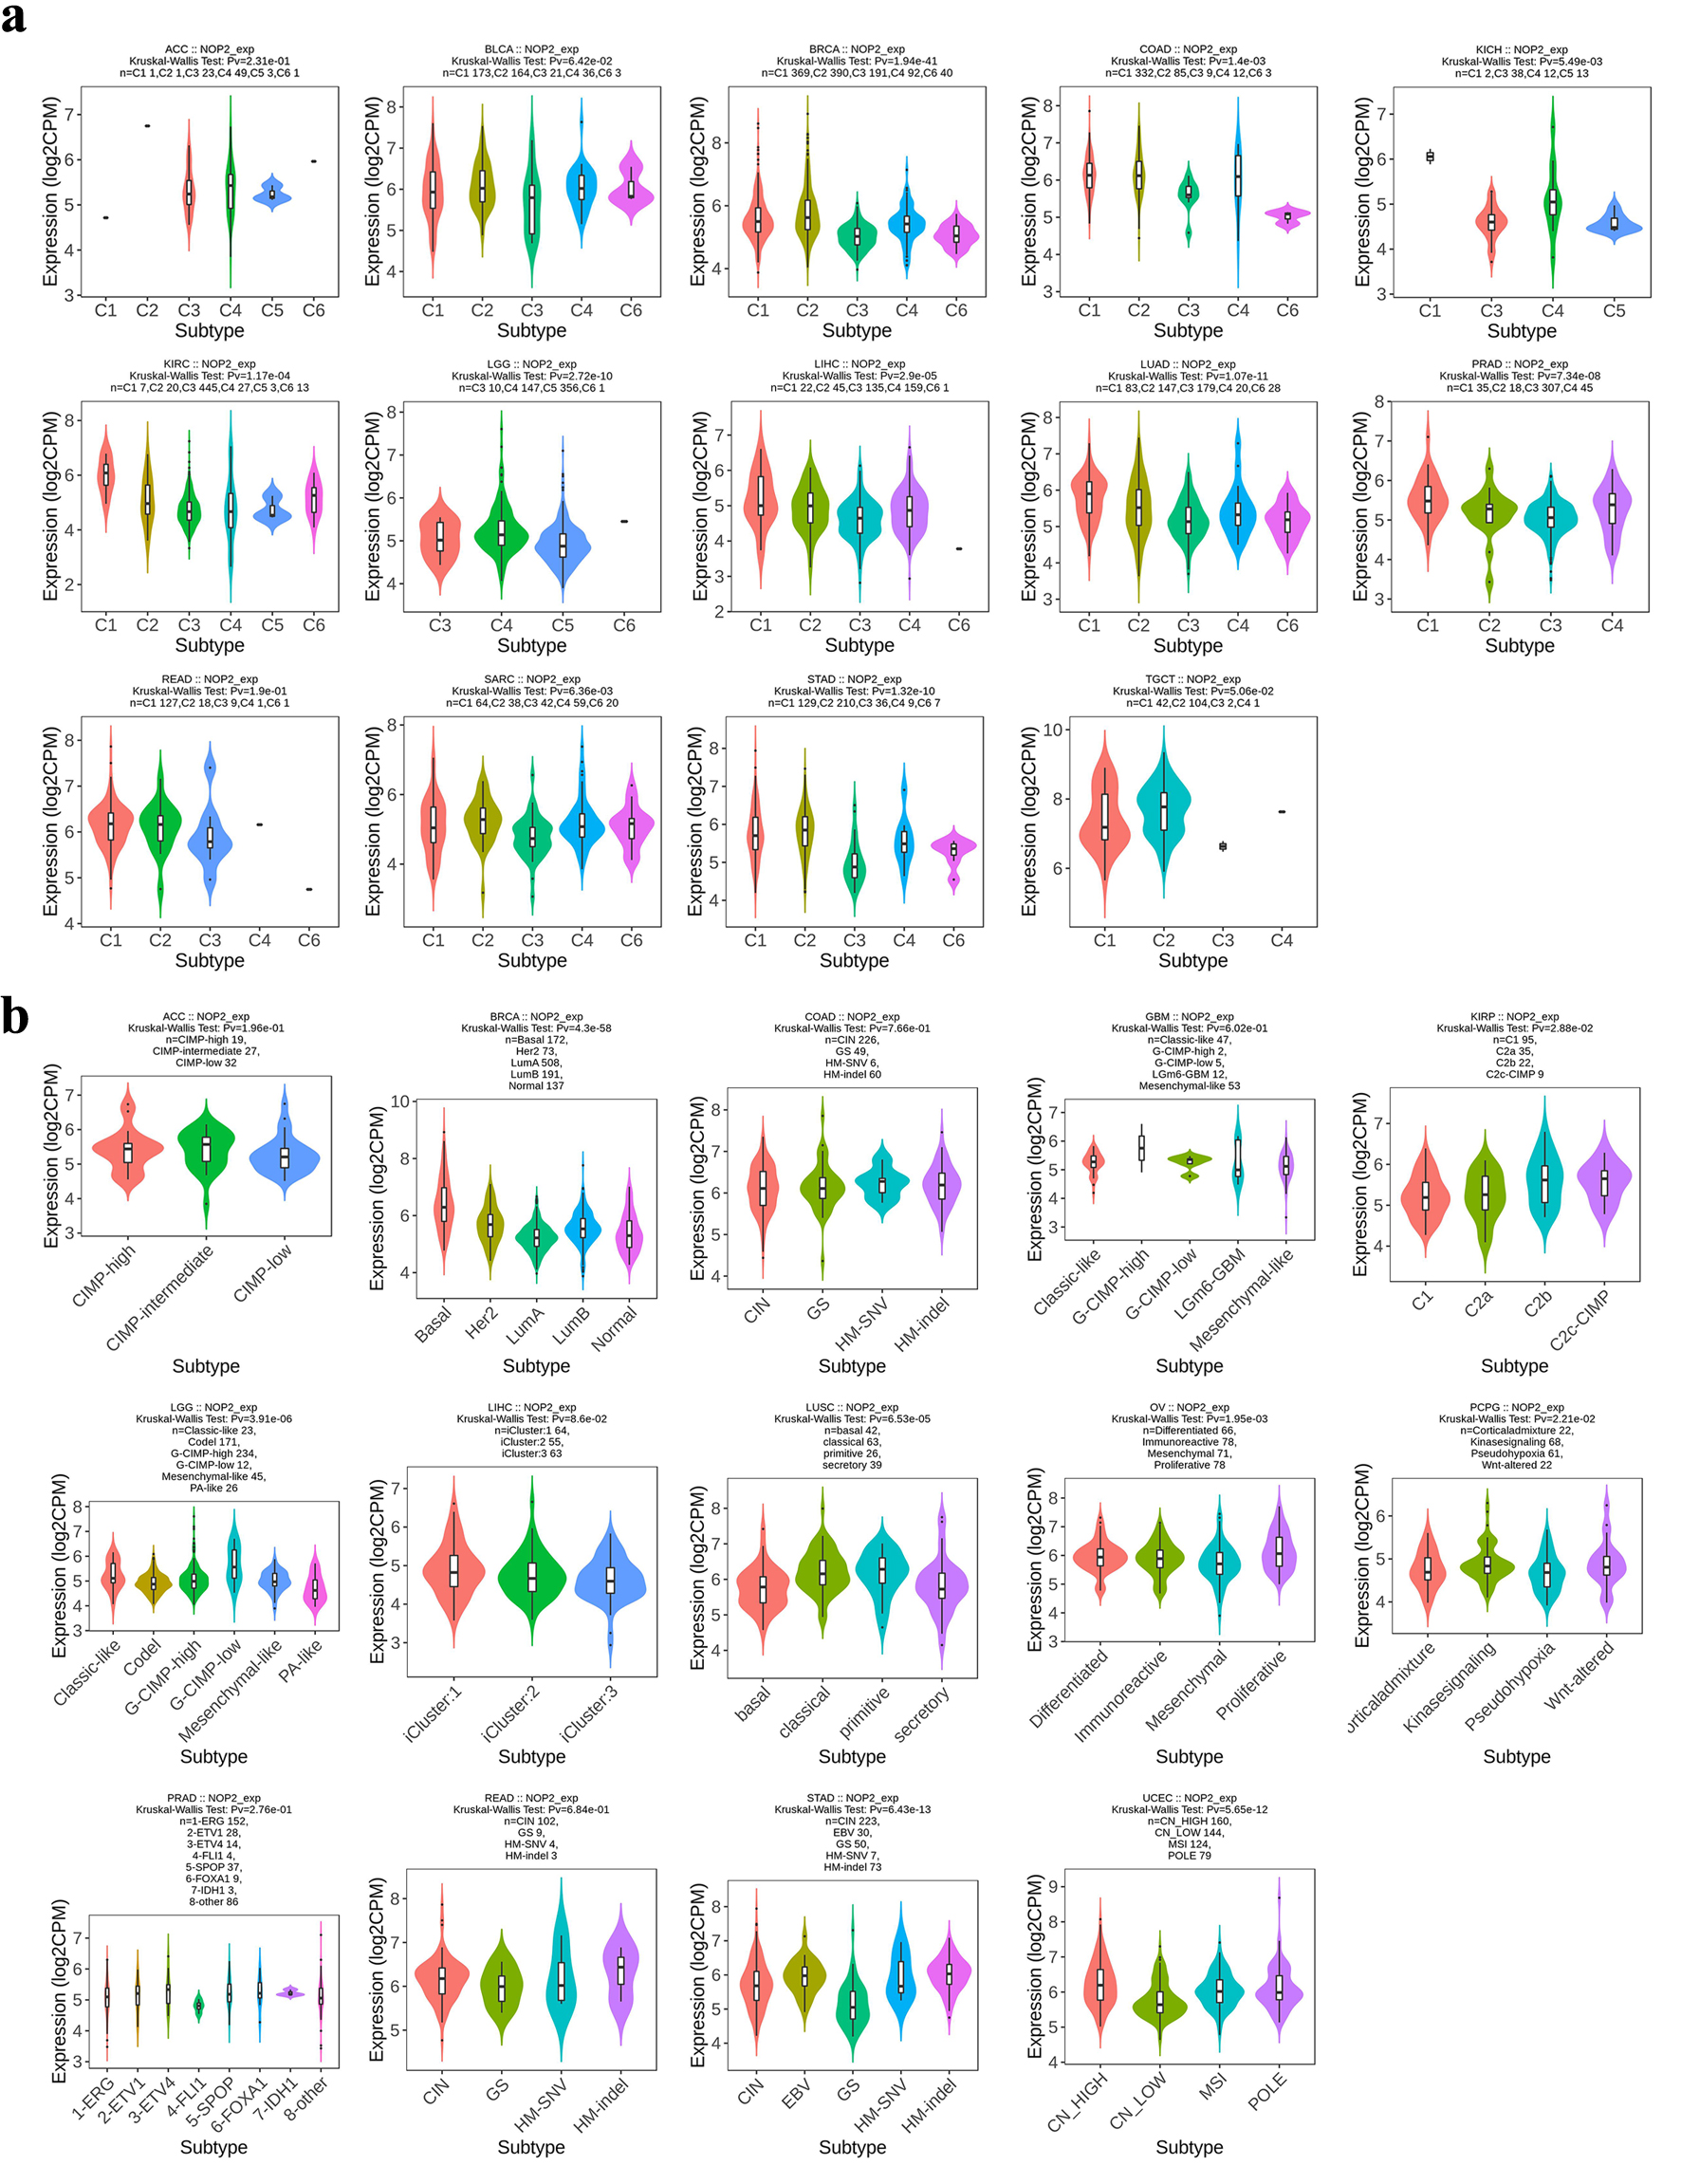
↓ Figure 7. Distribution of NOP2 expression across immune and molecular subtypes of cancers. (a) Association between NOP2 expression and immune subtypes (C1–C6) across cancers. (b) Association between NOP2 expression and molecular subtypes across cancers.
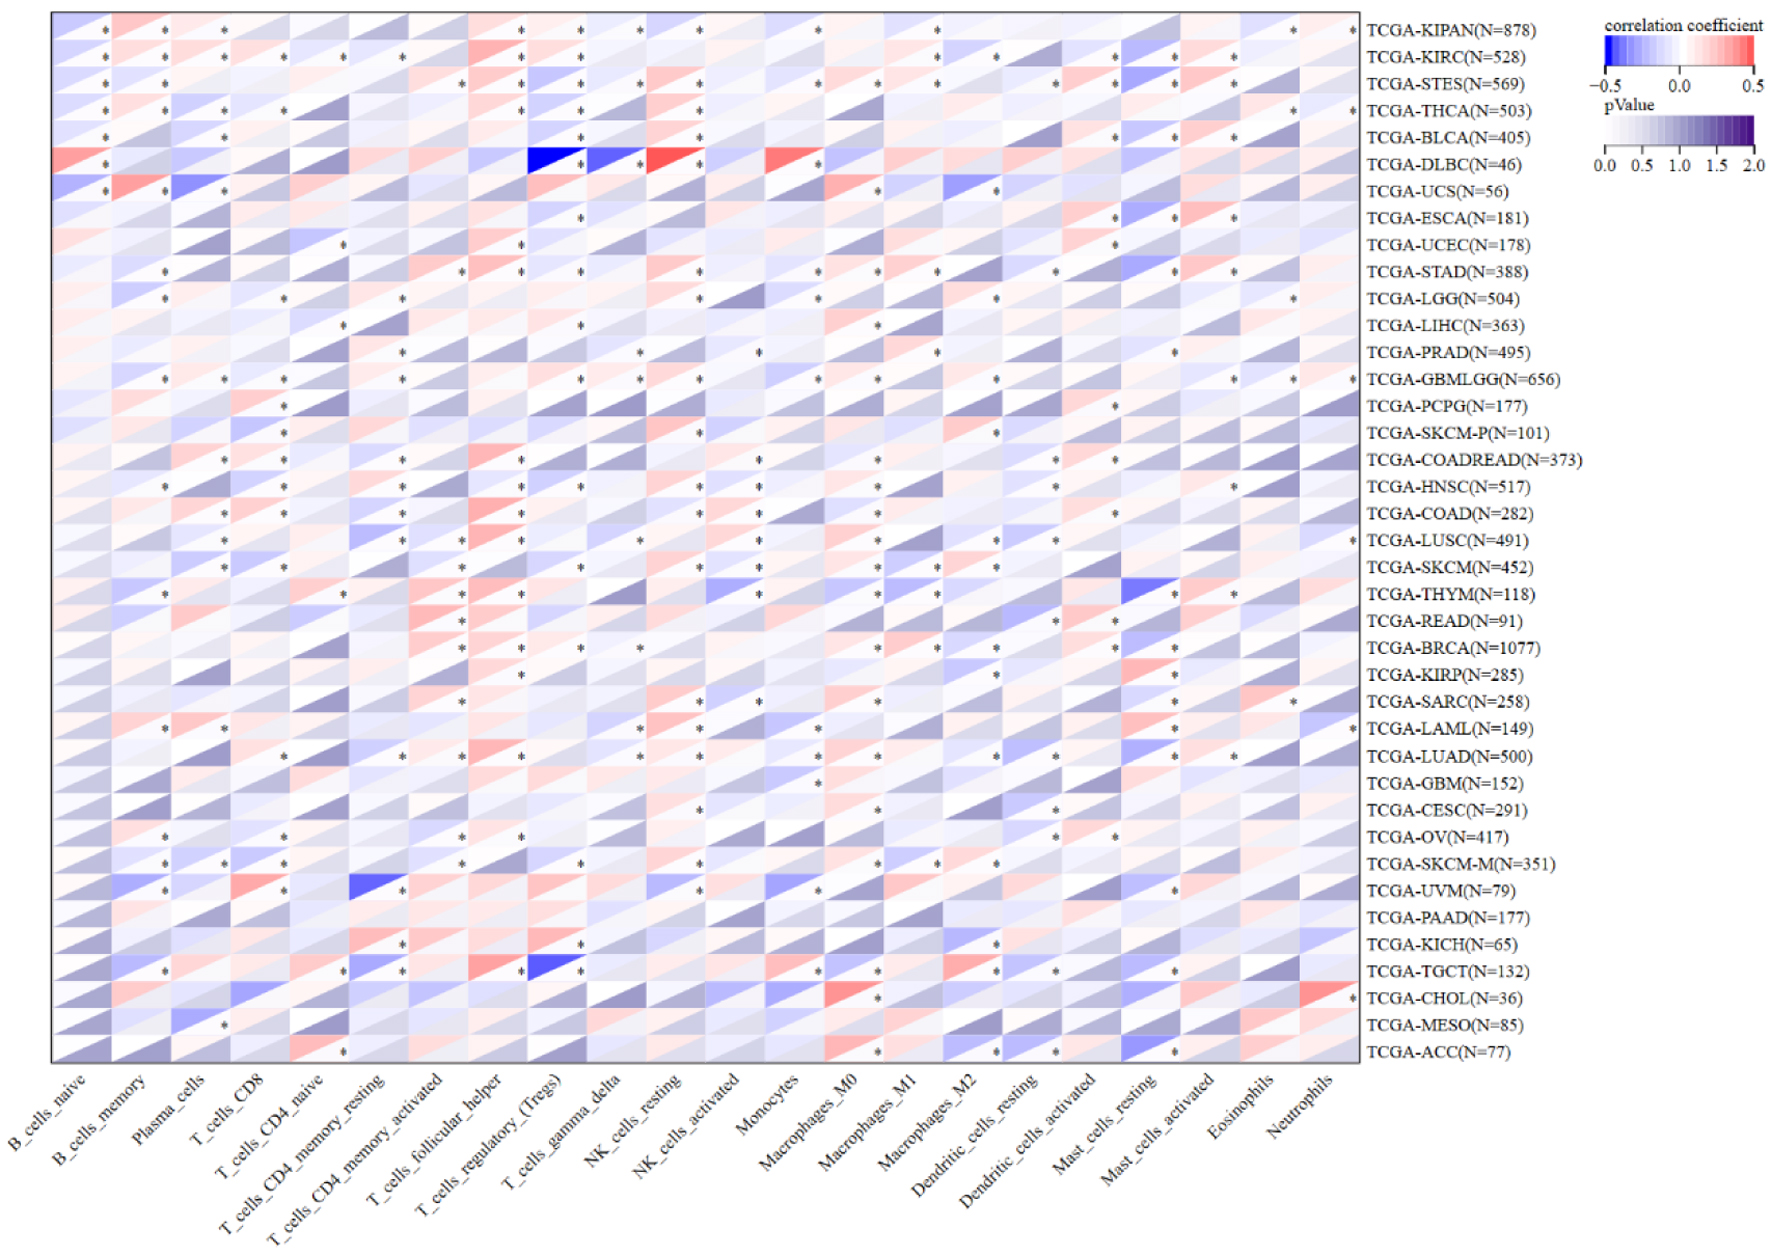
↓ Figure 8. Correlation between NOP2 expression and infiltration of 22 immune cell types. Correlation analysis between NOP2 expression and the estimated infiltration levels of 22 tumor-infiltrating immune cell populations across cancers. *P < 0.05.
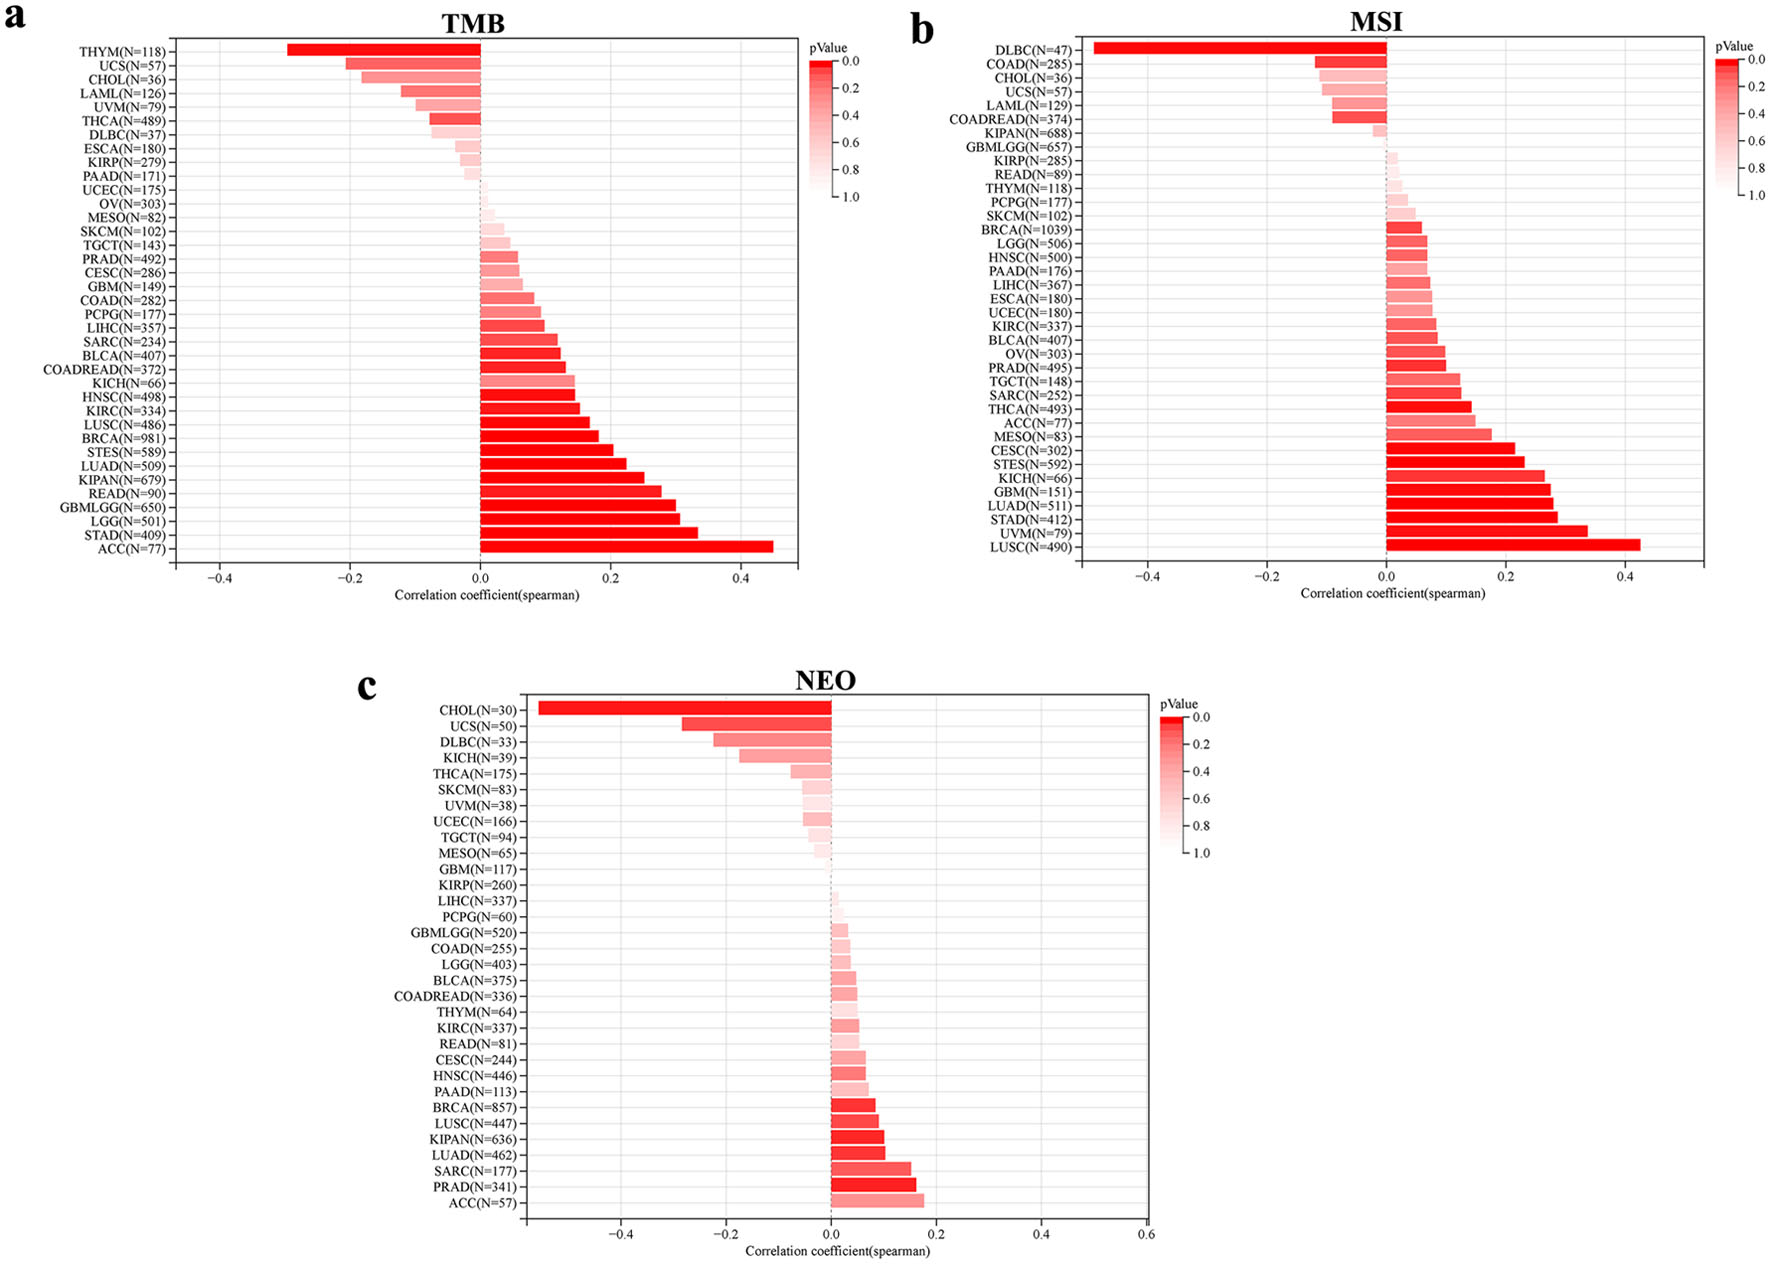
↓ Figure 9. Association between genomic heterogeneity and NOP2 expression. (a) Correlation between NOP2 expression and tumor mutational burden (TMB) across cancer types. (b) Correlation between NOP2 expression and microsatellite instability (MSI) across cancer types. (c) Correlation between NOP2 expression and neoantigen load (NEO) across cancer types.
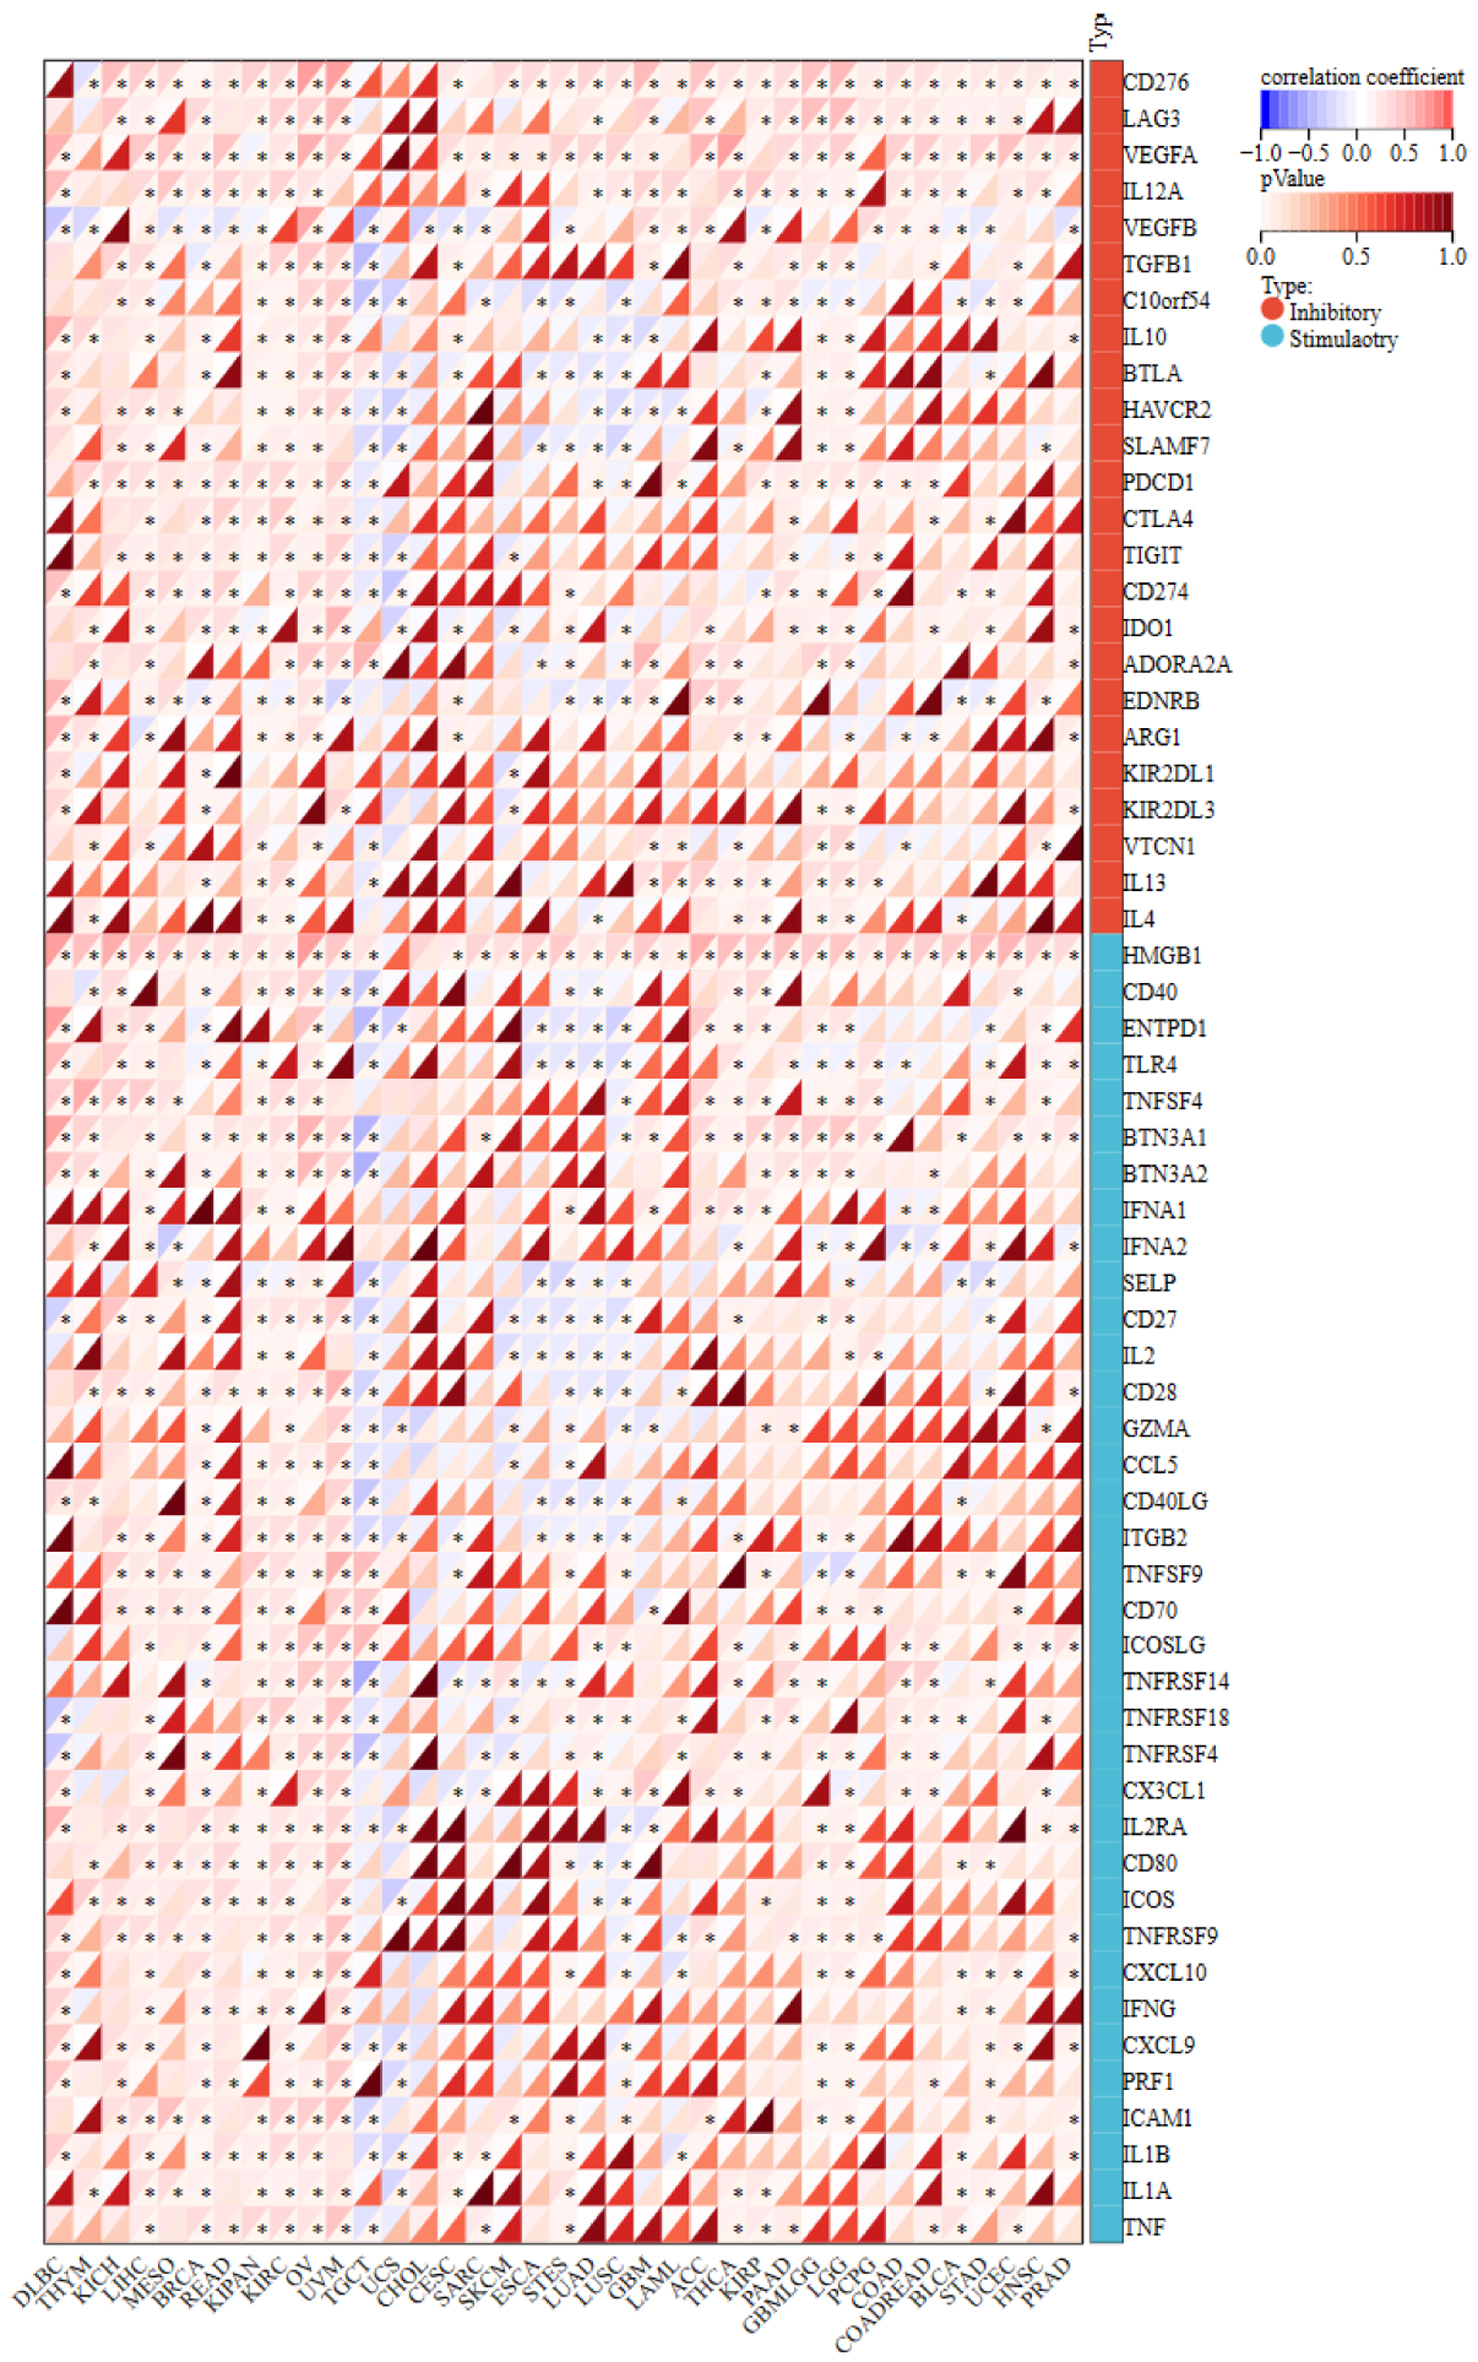
↓ Figure 10. The correlation matrix of NOP2 expression and immune checkpoint-related gene expressions. *P < 0.05.
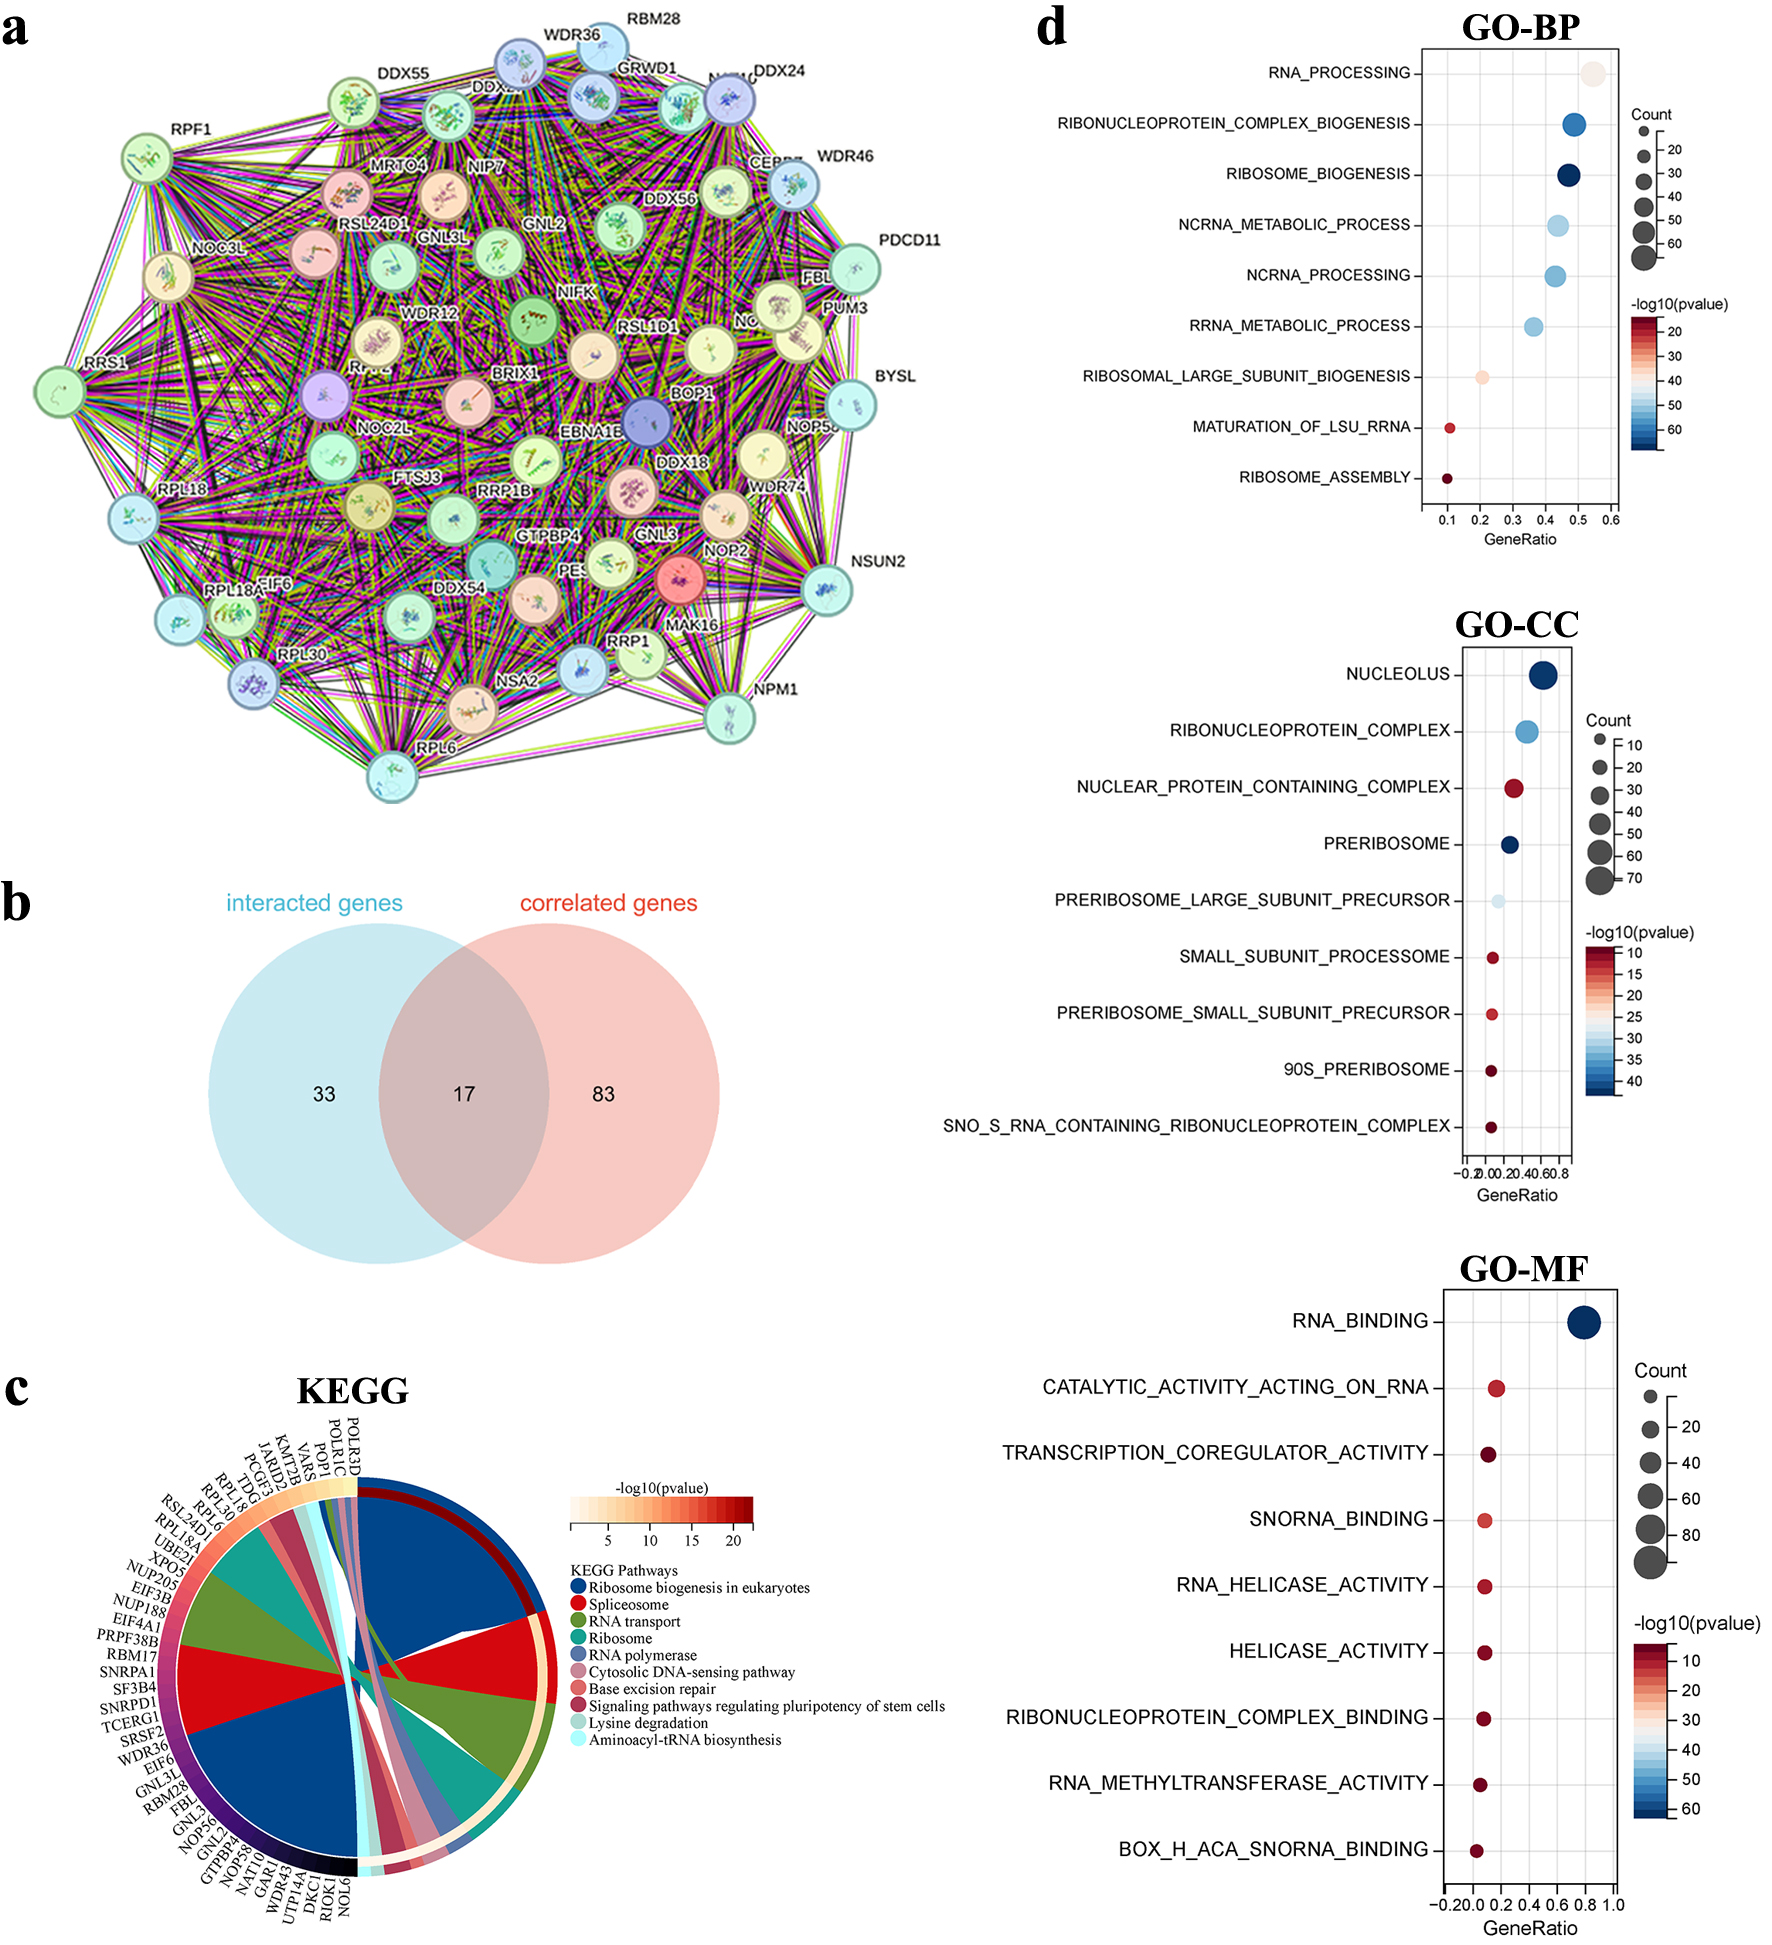
↓ Figure 11. Functional enrichment analysis of NOP2-related genes. (a) Protein-protein interaction (PPI) network of 50 NOP2-interacting proteins derived from the STRING database. (b) Venn diagram showing the overlap between NOP2-interacting proteins and NOP2-correlated genes identified from GEPIA2. (c) KEGG pathways enrichment analysis based on NOP2-related genes. (d) GO enrichment analysis based on NOP2-related genes, including BP, CC, and MF.