Figures
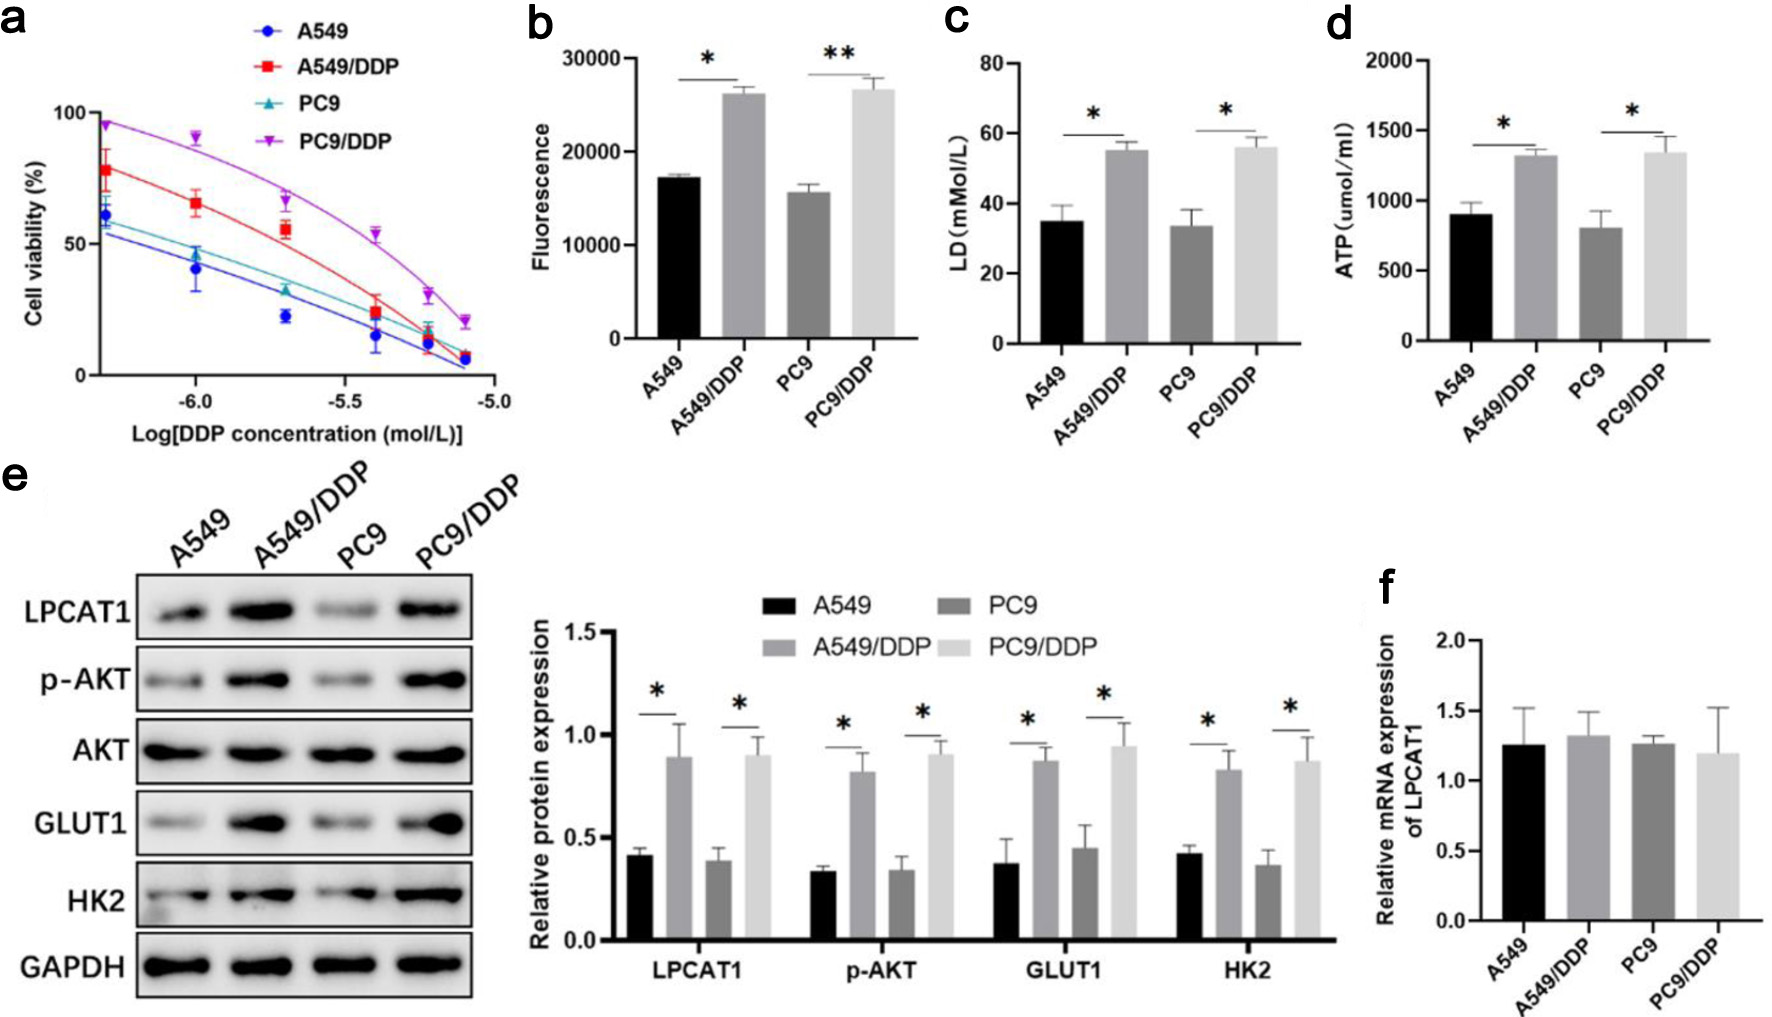
↓ Figure 1. Changes in LPCAT1, p-AKT, and glycolysis-related molecule expression in DDP-resistant lung cancer cells. (a) Viability of A549, A549/DDP, PC-9, and PC-9/DDP cells treated with DDP. (b) Intracellular glucose uptake. (c) Intracellular lactate levels. (d) Intracellular ATP levels. (e) Western blot analysis of LPCAT1, p-AKT, GLUT1, and HK2 protein expression. (f) qRT-PCR analysis of LPCAT1 mRNA expression. Data are presented as the mean ± SD (n = 3). *P < 0.05, **P < 0.01 vs. parental cells.
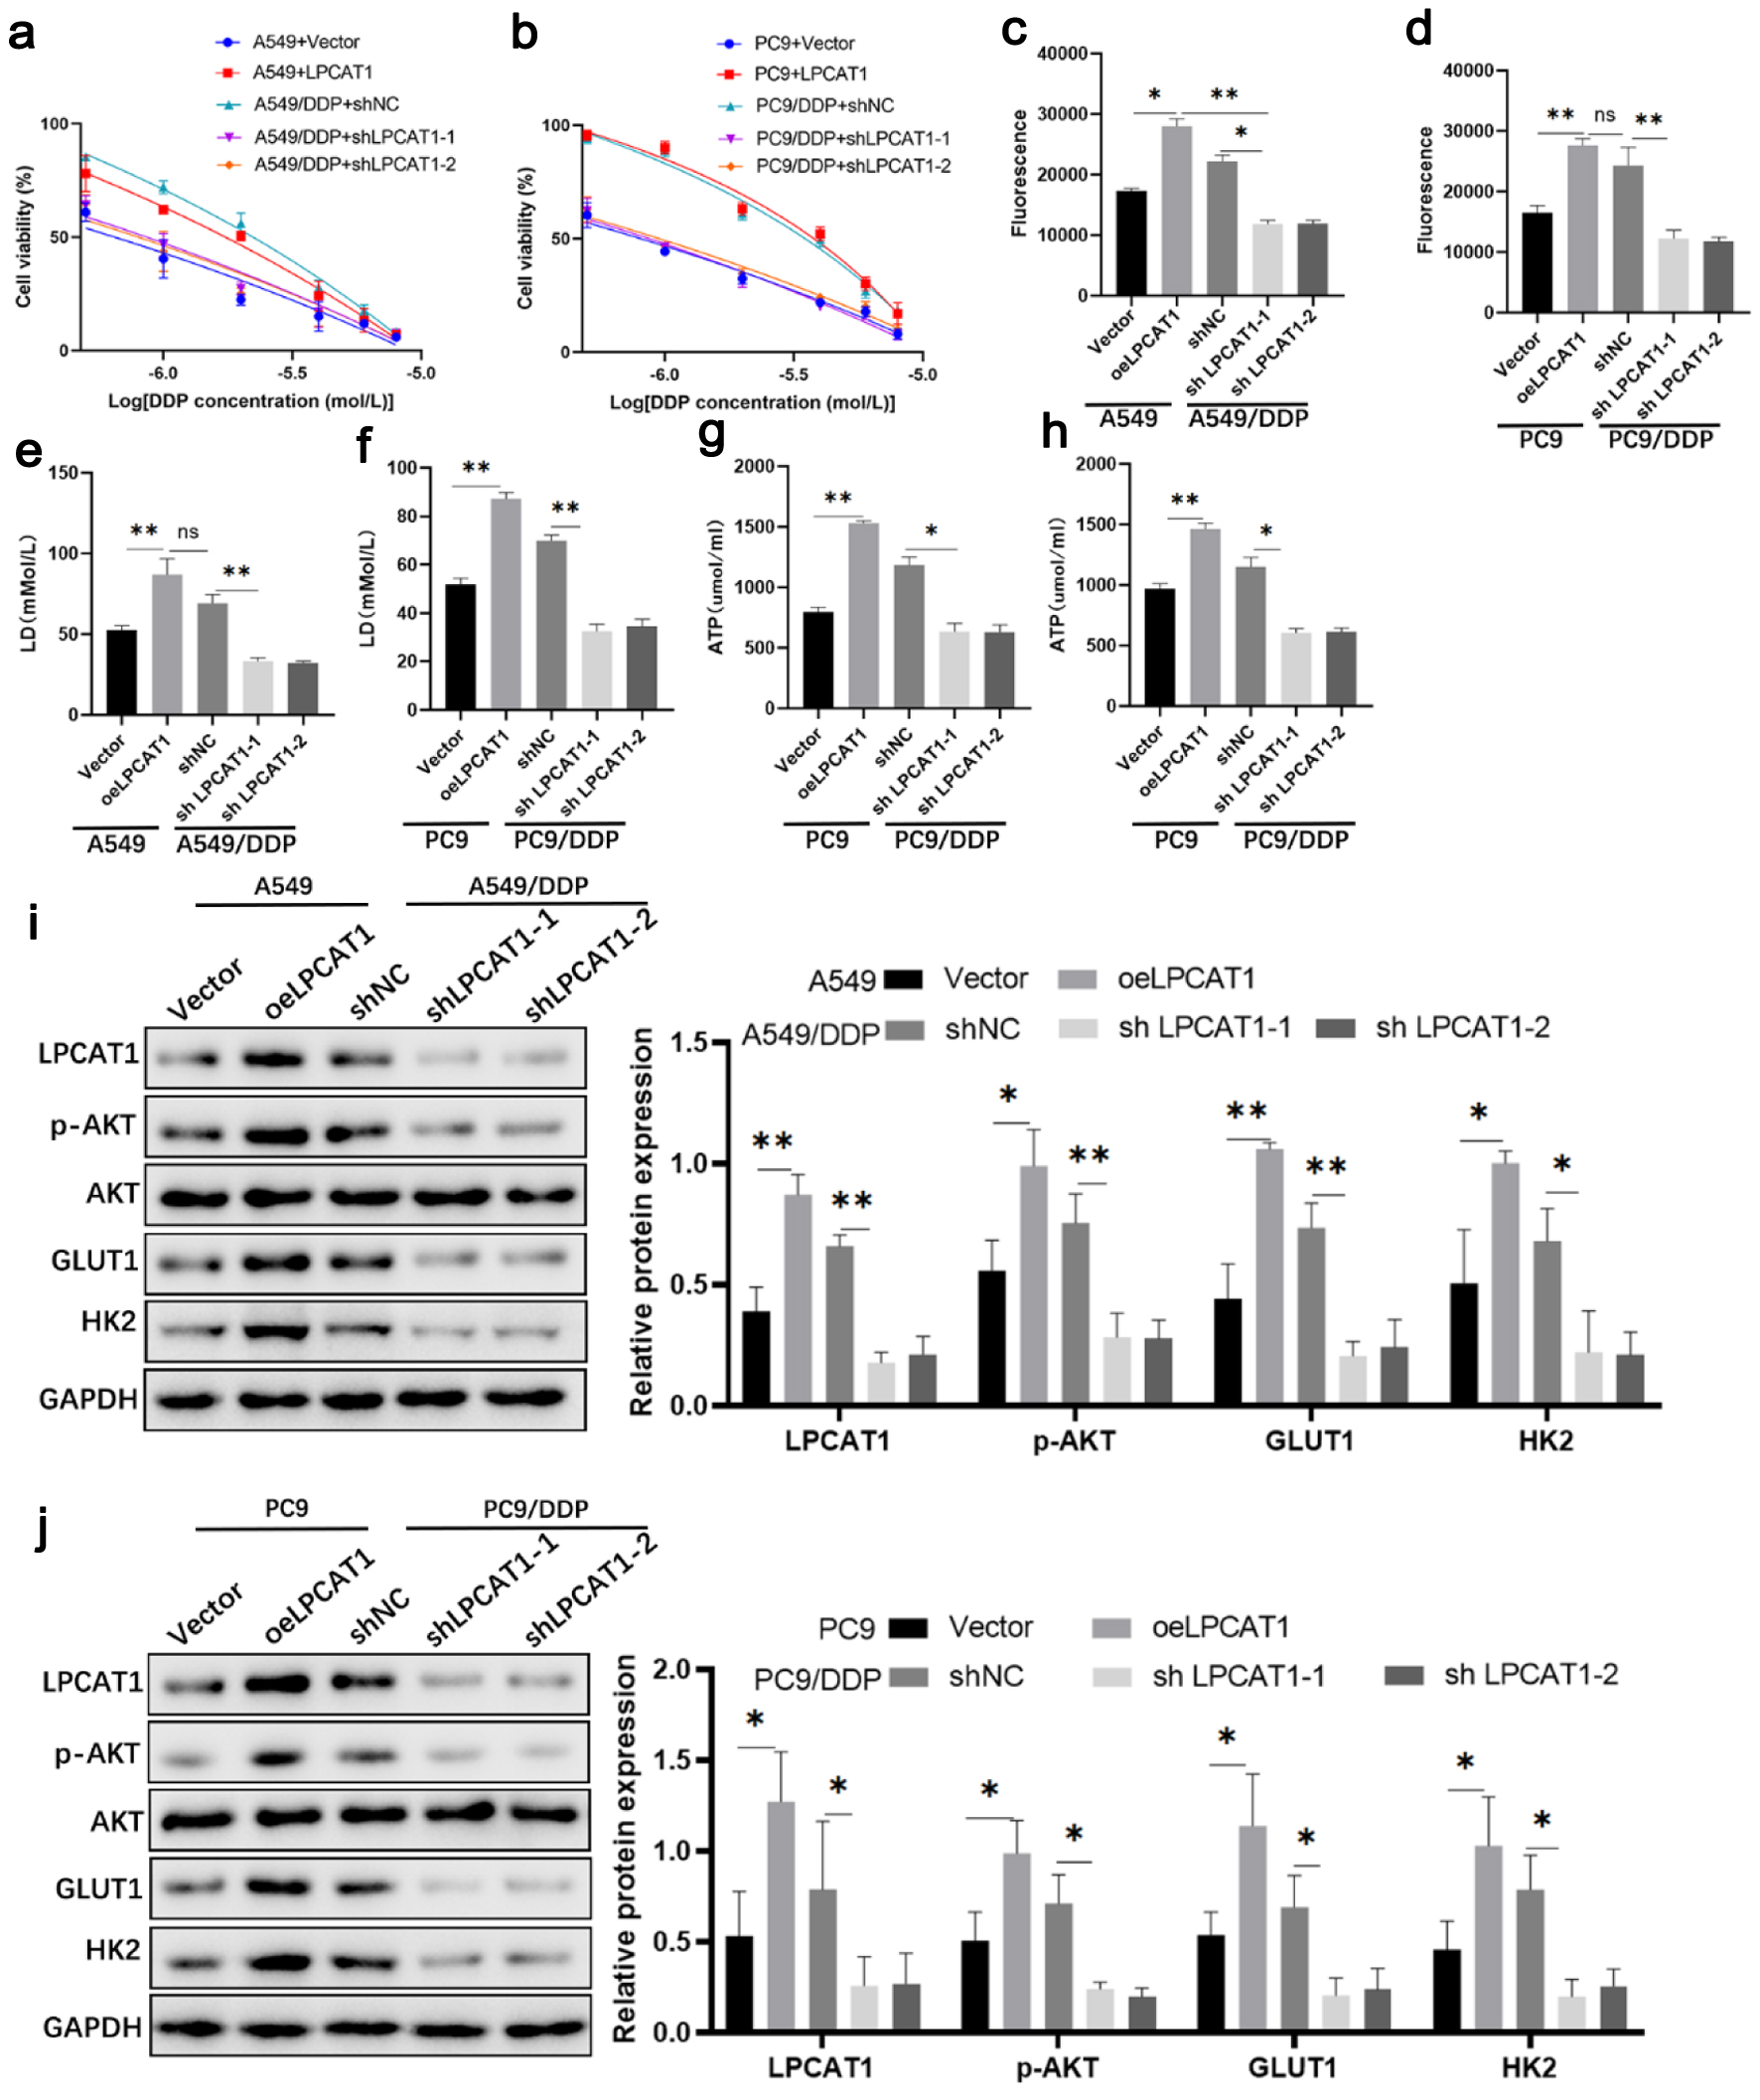
↓ Figure 2. Effect of LPCAT1 expression on cell drug resistance. (a) Viability of A549 and A549/DDP cells treated with DDP. (b) Viability of PC-9 and PC-9/DDP cells treated with DDP. (c) Glucose uptake in A549 and A549/DDP cells. (d) Glucose uptake in PC-9 and PC-9/DDP cells. (e) Lactate levels in A549 and A549/DDP cells. (f) Lactate levels in PC-9 and PC-9/DDP cells. (g) ATP levels in A549 and A549/DDP cells. (h) ATP levels in PC-9 and PC-9/DDP cells. (i) Western blot analysis of LPCAT1, p-AKT, GLUT1, and HK2 expression in A549 and A549/DDP cells. (j) Western blot analysis of LPCAT1, p-AKT, GLUT1, and HK2 expression in PC-9 and PC-9/DDP cells. Data are presented as the mean ± SD (n = 3). *P < 0.05, **P < 0.01 vs. control group.
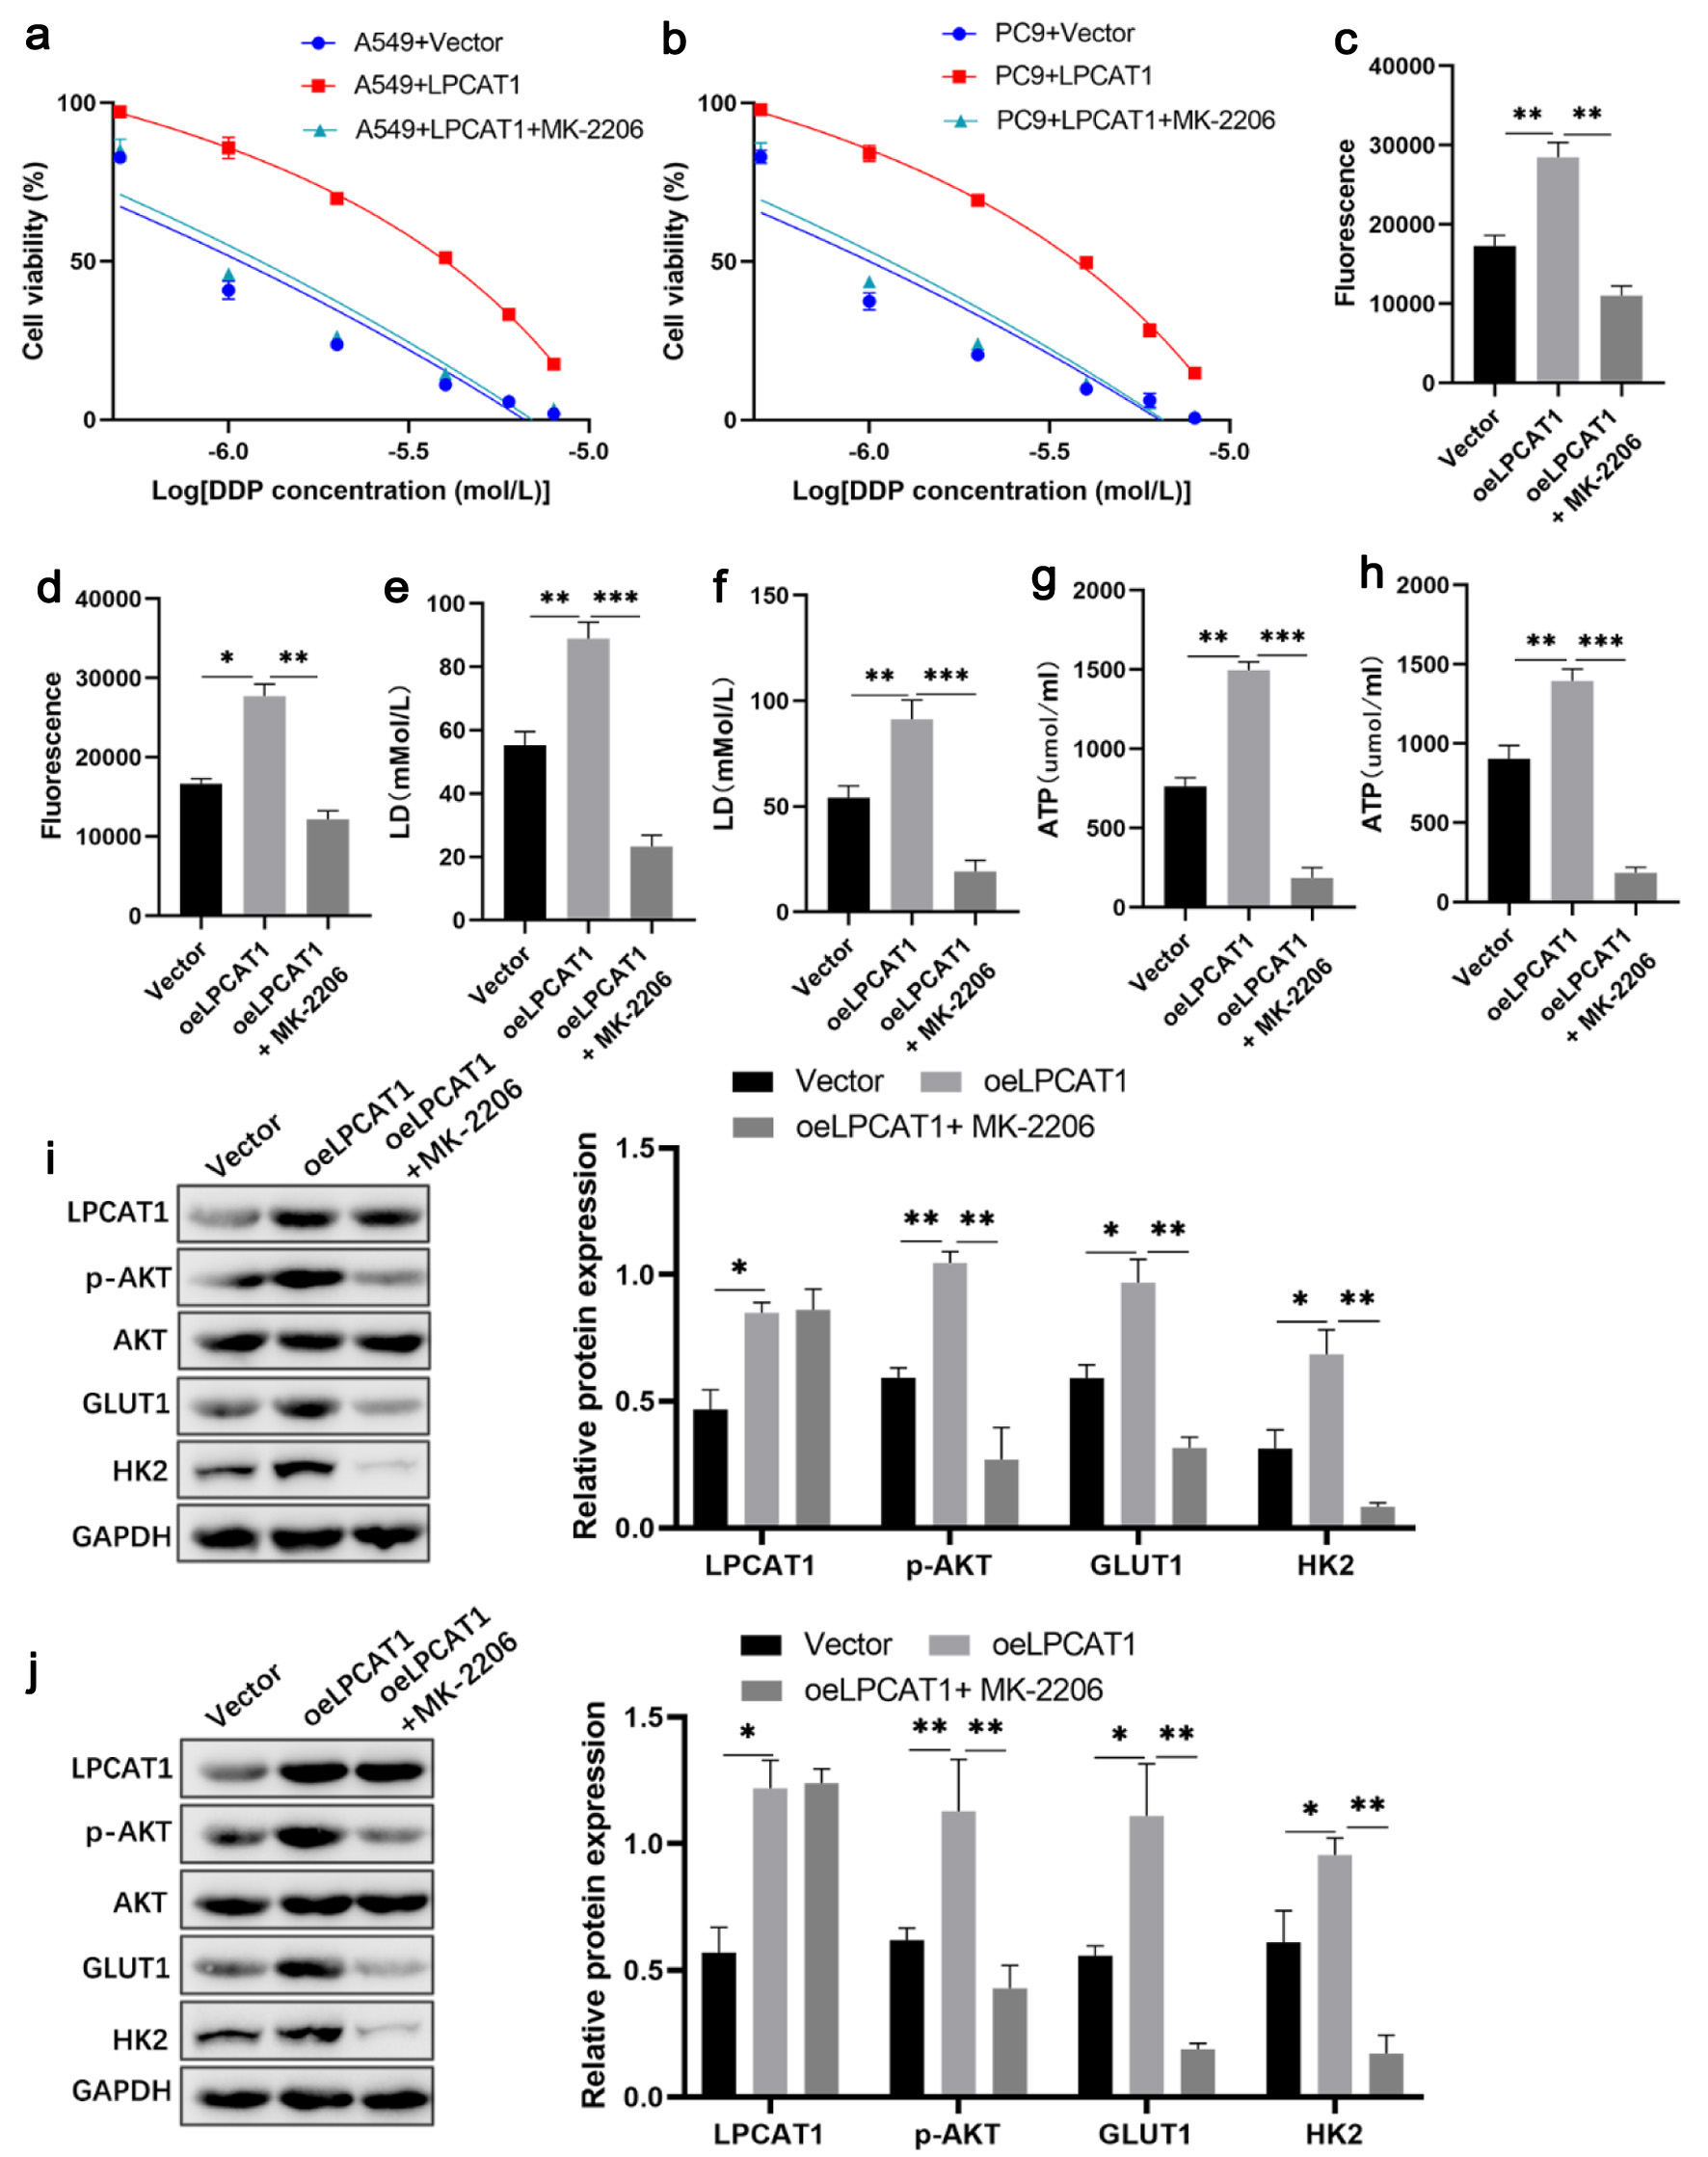
↓ Figure 3. Inhibition of AKT signaling reverses LPCAT1-mediated cisplatin resistance and glycolysis in NSCLC cells. (a) Viability of A549 cells treated with DDP. (b) Viability of PC-9 cells treated with DDP. (c) Glucose uptake in A549 cells. (d) Glucose uptake in PC-9 cells. (e) Lactate levels in A549 cells. (f) Lactate levels in PC-9 cells. (g) ATP levels in A549 cells. (h) ATP levels in PC-9 cells. (i) Western blot analysis of LPCAT1, p-AKT, GLUT1, and HK2 expression in A549 cells. (j) Western blot analysis of LPCAT1, p-AKT, GLUT1, and HK2 expression in PC-9 cells. Data are presented as the mean ± SD (n = 3). *P < 0.05, **P < 0.01 vs. control group.
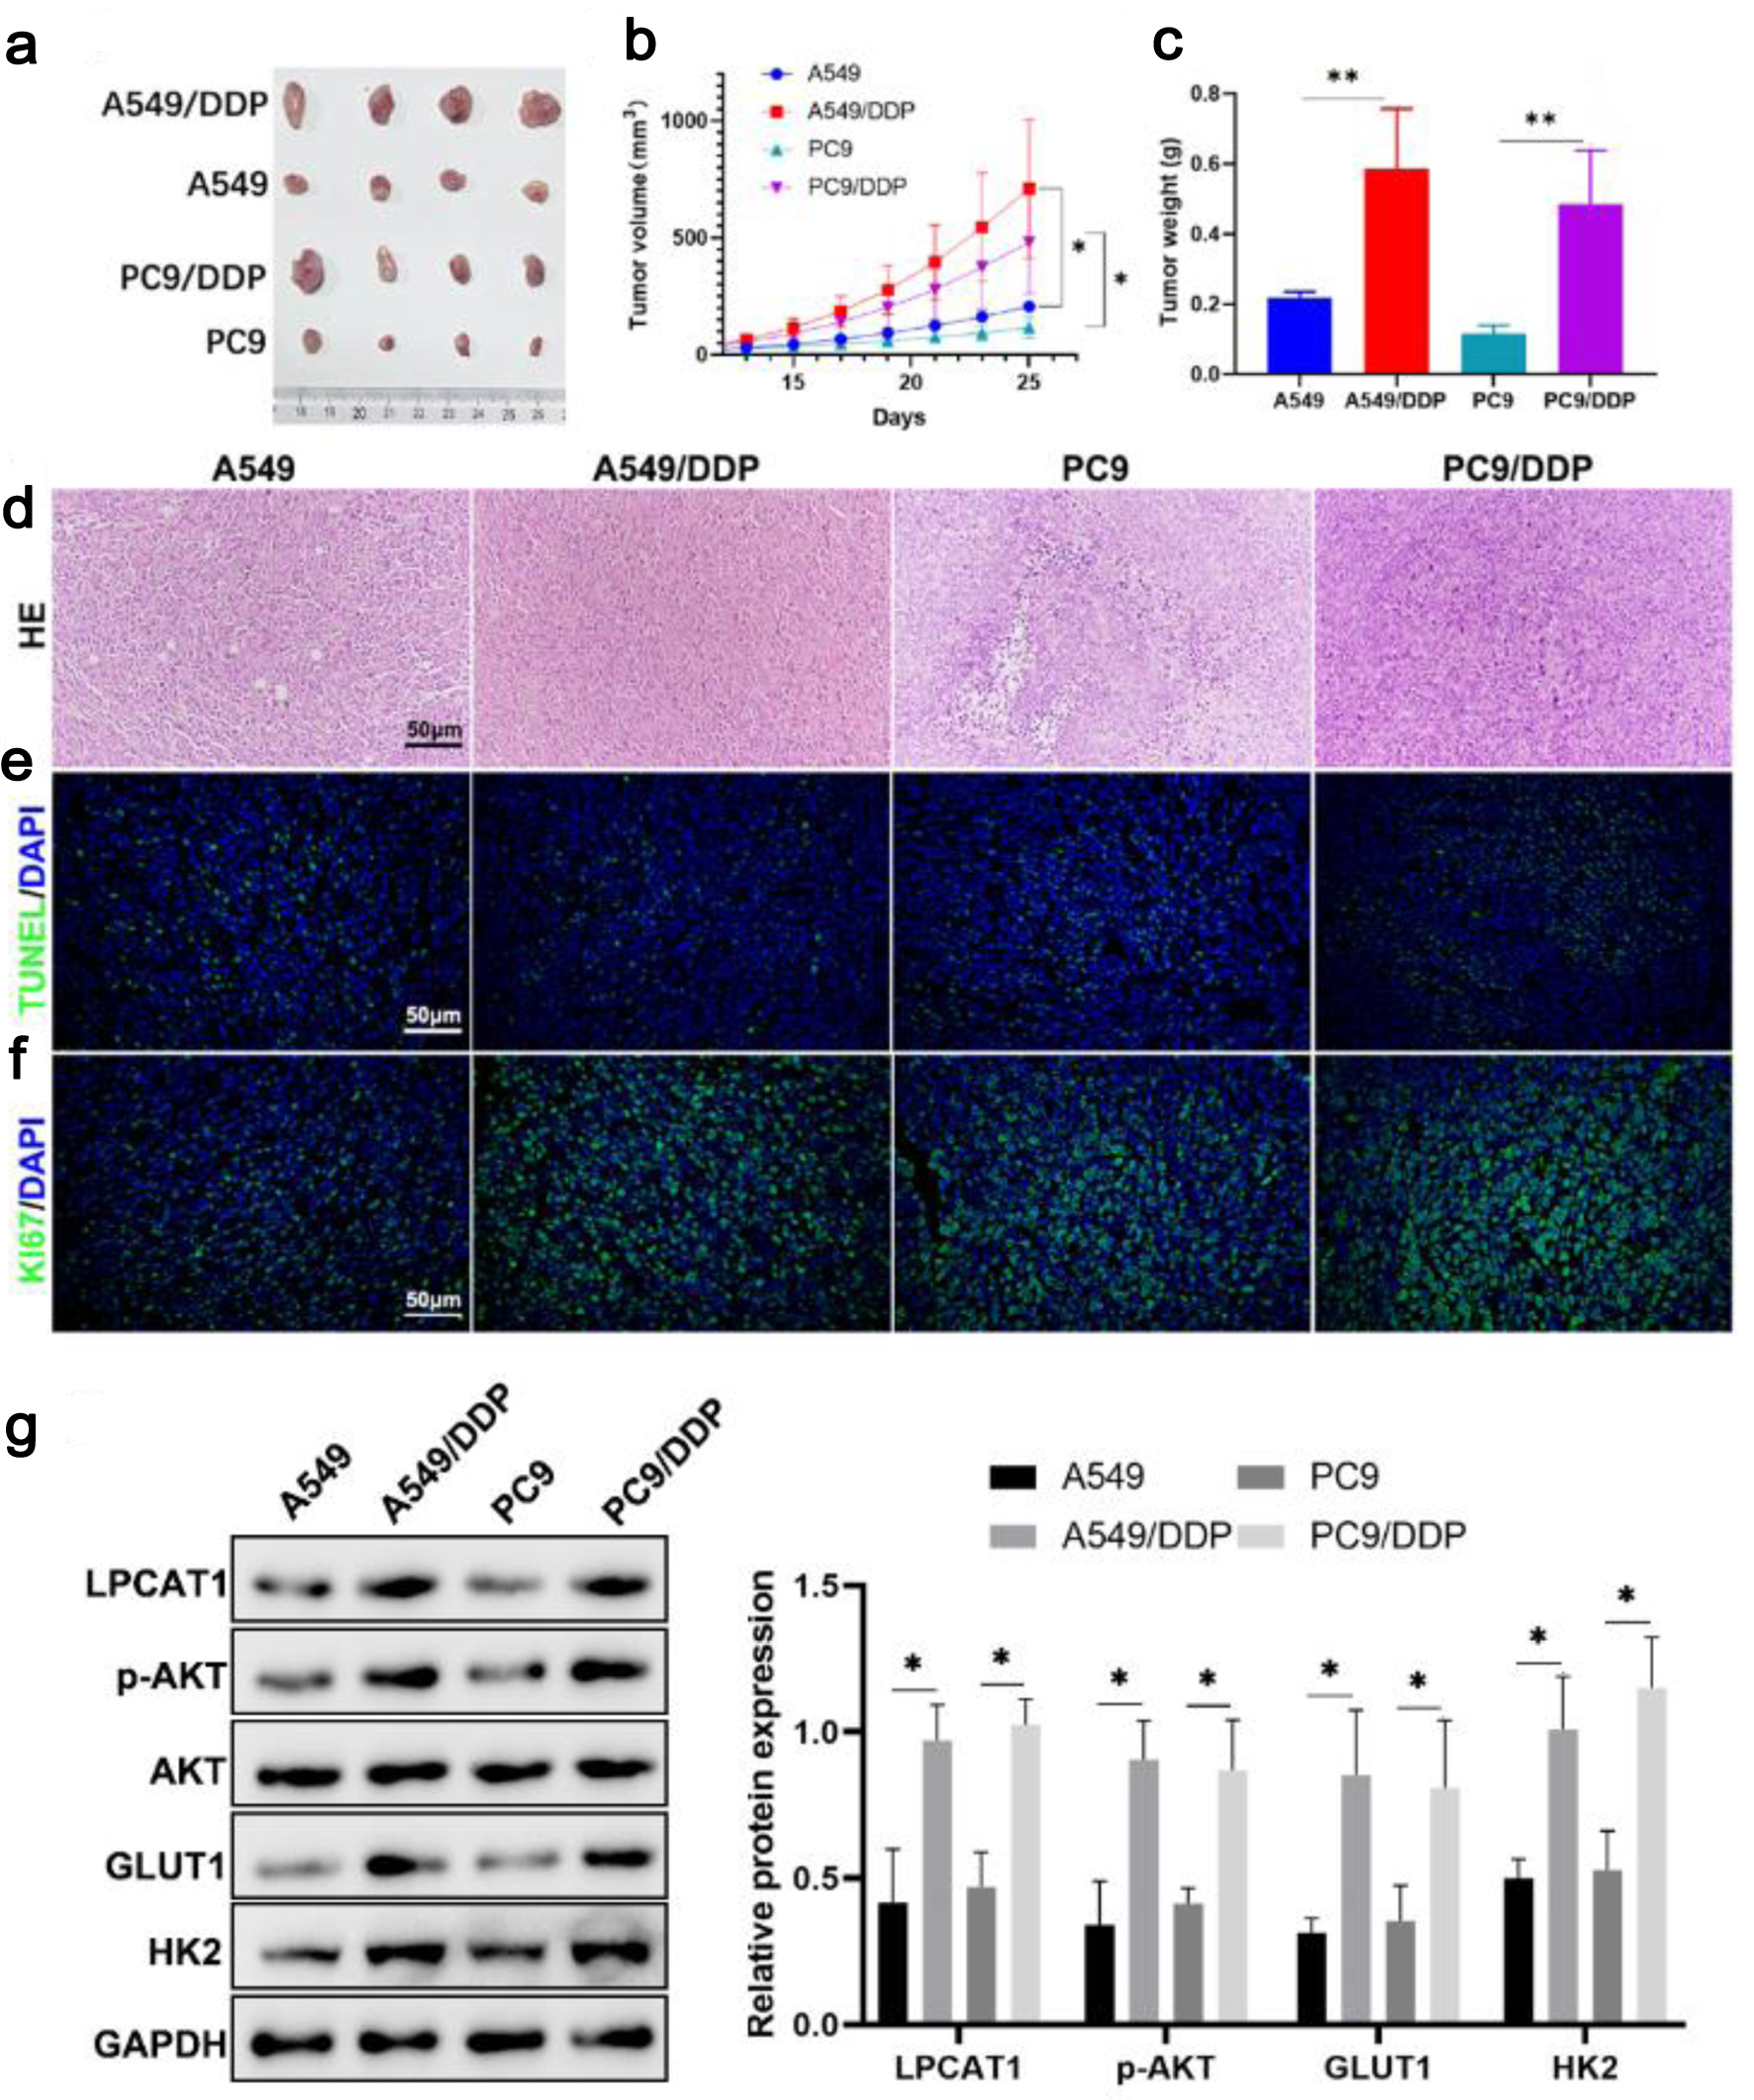
↓ Figure 4. In vivo experimental analysis showing that LPCAT1 promotes lung cancer drug resistance by regulating AKT and glycolysis. (a) Photos of xenograft tumors. (b) Tumor growth curves. (c) Weight of xenograft tumors. (d) H&E staining showing pathological changes in tumors (scale bar: 100 µm). (e) TUNEL staining showing tumor cell apoptosis (scale bar: 100 µm). (f) Ki67 staining showing tumor cell proliferation (scale bar: 100 µm). (g) Western blot analysis of LPCAT1, p-AKT, GLUT1, and HK2 expression in PC-9 and PC-9/DDP tumor tissues. Data are presented as the mean ± SD (n = 6). *P < 0.05, **P < 0.01 vs. parental cell groups.
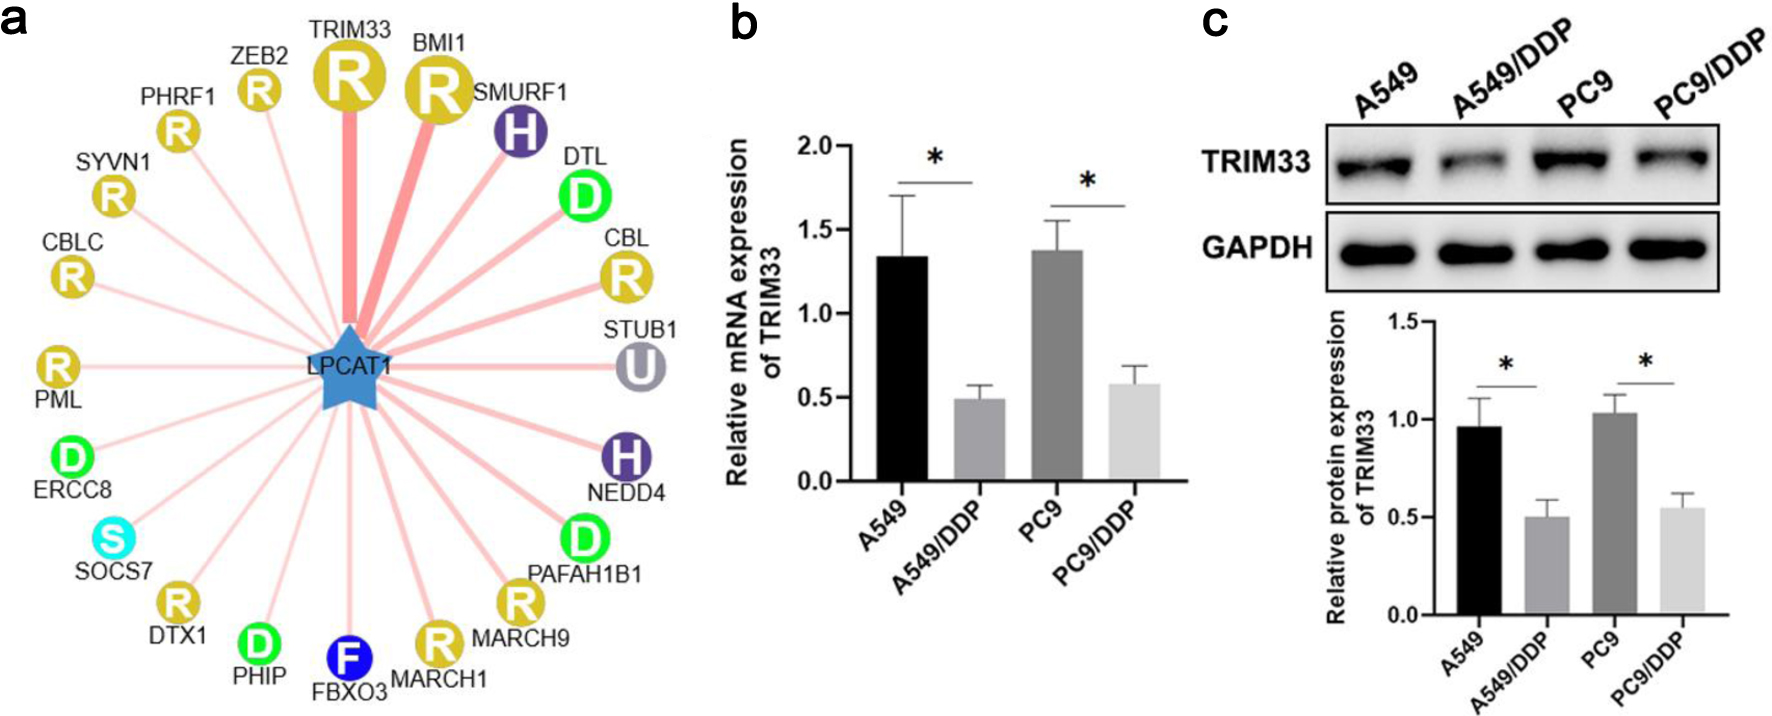
↓ Figure 5. TRIM33 affects lung cancer drug resistance by regulating LPCAT1 expression. (a) UbiBrowser database analysis showing that TRIM33 ubiquitinates LPCAT1. (b) TRIM33 mRNA expression levels in A549, PC-9, A549/DDP, and PC-9/DDP cells. (c) TRIM33 protein expression levels in A549, PC-9, A549/DDP, and PC-9/DDP cells. Data are presented as the mean ± SD (n = 3). *P < 0.05, **P < 0.01 vs. parental cells.
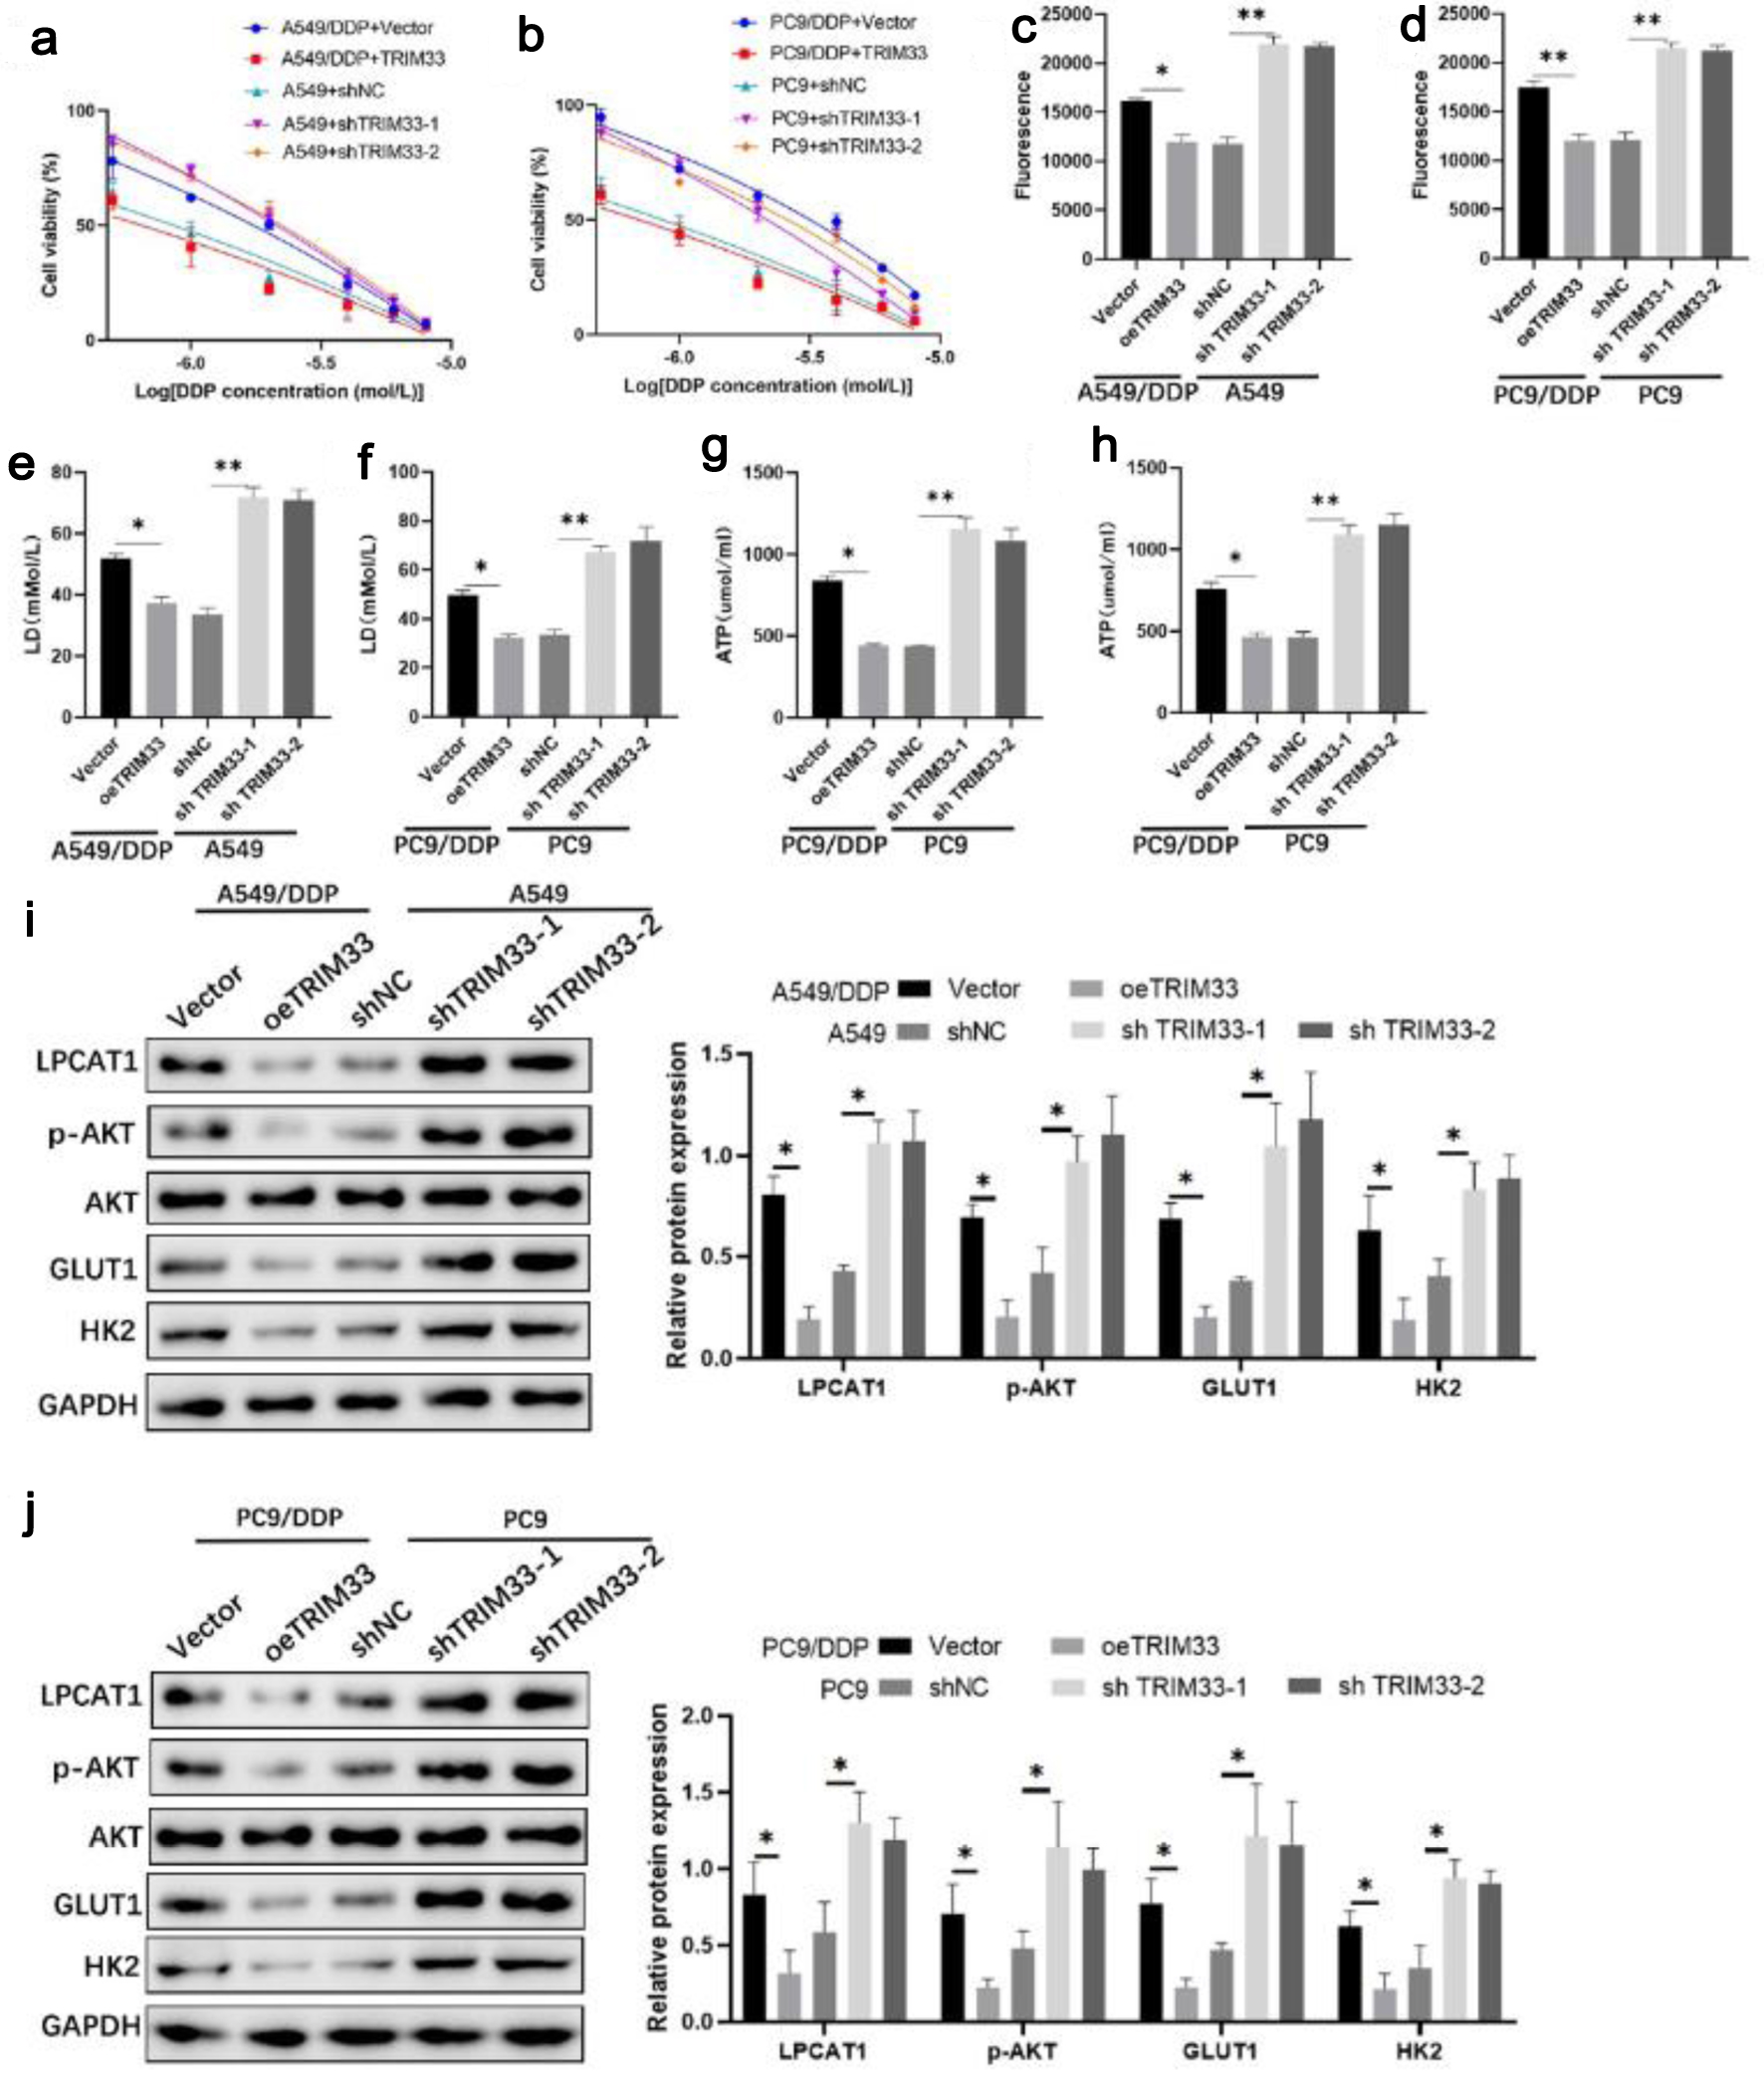
↓ Figure 6. Effect of TRIM33 expression on cell drug resistance. (a) Viability of A549 and A549/DDP cells treated with DDP. (b) Viability of PC-9 and PC-9/DDP cells treated with DDP. (c) Glucose uptake in A549 and A549/DDP cells. (d) Glucose uptake in PC-9 and PC-9/DDP cells. (e) Lactate levels in A549 and A549/DDP cells. (f) Lactate levels in PC-9 and PC-9/DDP cells. (g) ATP levels in A549 and A549/DDP cells. (h) ATP levels in PC-9 and PC-9/DDP cells. (i) Western blot analysis of LPCAT1, p-AKT, GLUT1, and HK2 expression in A549 and A549/DDP cells. (j) Western blot analysis of LPCAT1, p-AKT, GLUT1, and HK2 expression in PC-9 and PC-9/DDP cells. Data are presented as the mean ± SD (n = 3). *P < 0.05, **P < 0.01 vs. control group.
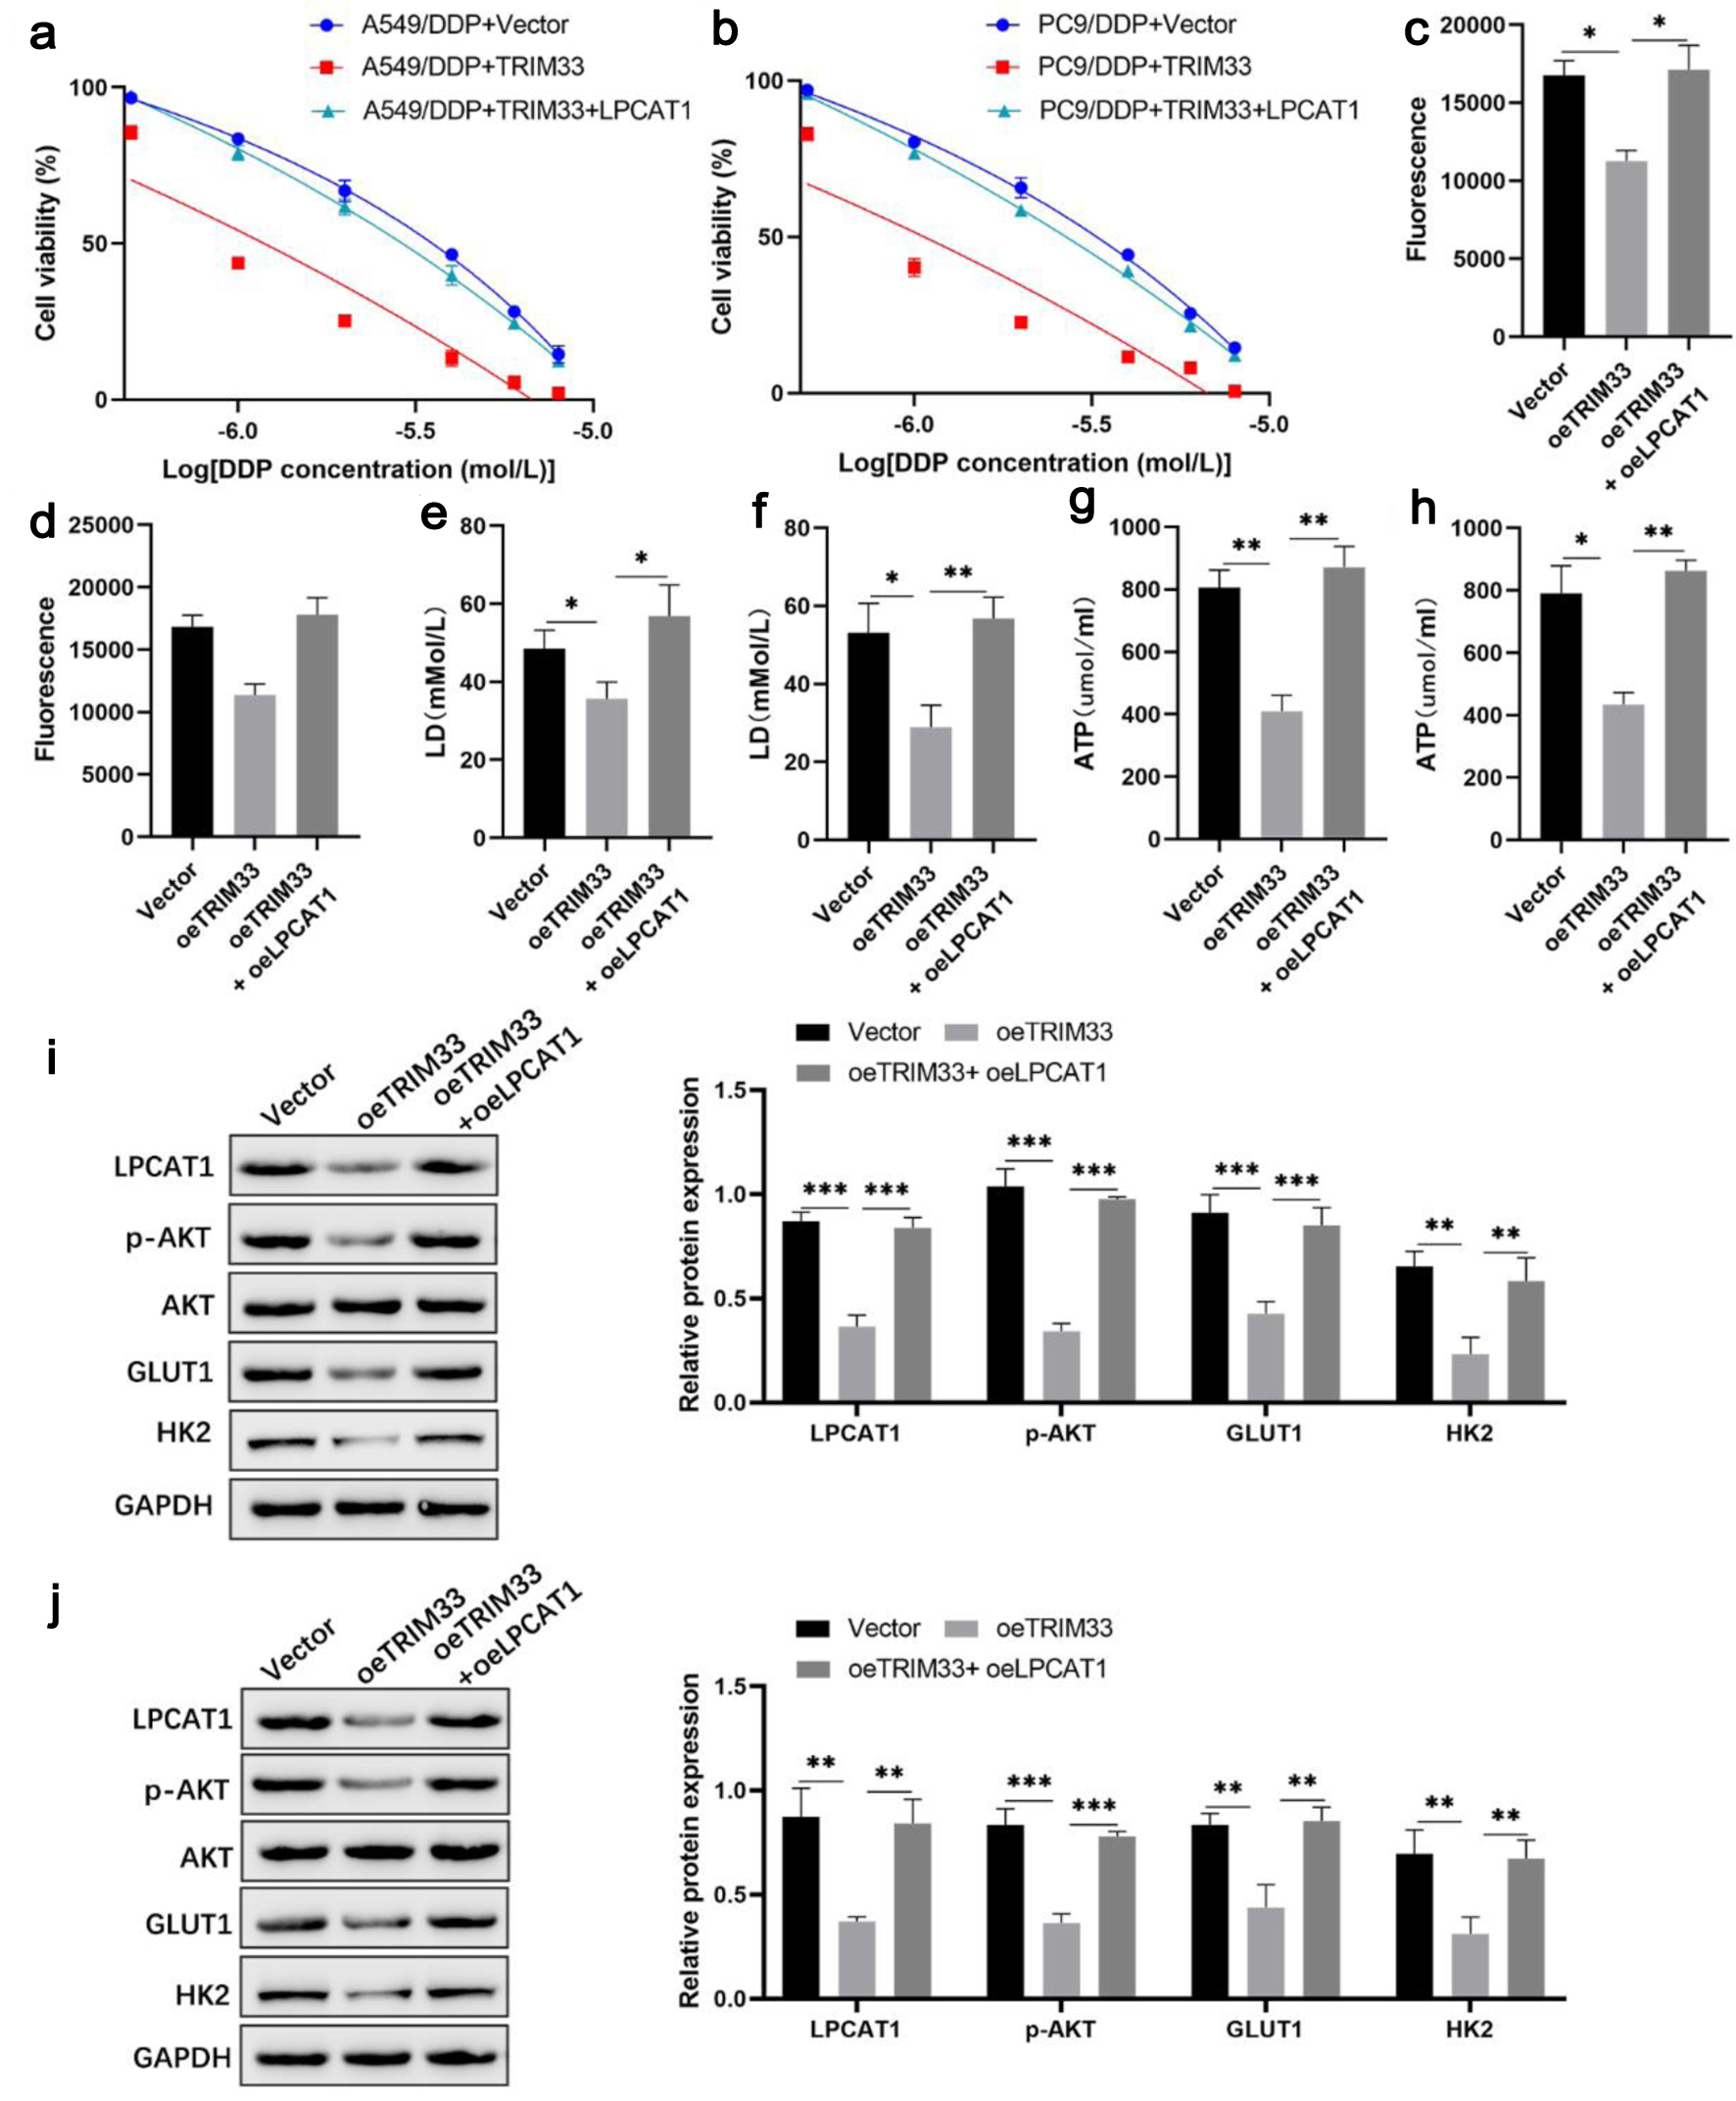
↓ Figure 7. LPCAT1 overexpression rescues TRIM33-induced cisplatin sensitization in NSCLC cells. (a) Viability of A549/DDP cells treated with DDP. (b) Viability of PC-9/DDP cells treated with DDP. (c) Glucose uptake in A549/DDP cells. (d) Glucose uptake in PC-9/DDP cells. (e) Lactate levels in A549/DDP cells. (f) Lactate levels in PC-9/DDP cells. (g) ATP levels in A549/DDP cells. (h) ATP levels in PC-9/DDP cells. (i) Western blot analysis of LPCAT1, p-AKT, GLUT1, and HK2 expression in A549/DDP cells. (j) Western blot analysis of LPCAT1, p-AKT, GLUT1, and HK2 expression in PC-9/DDP cells. Data are presented as the mean ± SD (n = 3). *P < 0.05, **P < 0.01 vs. control group.
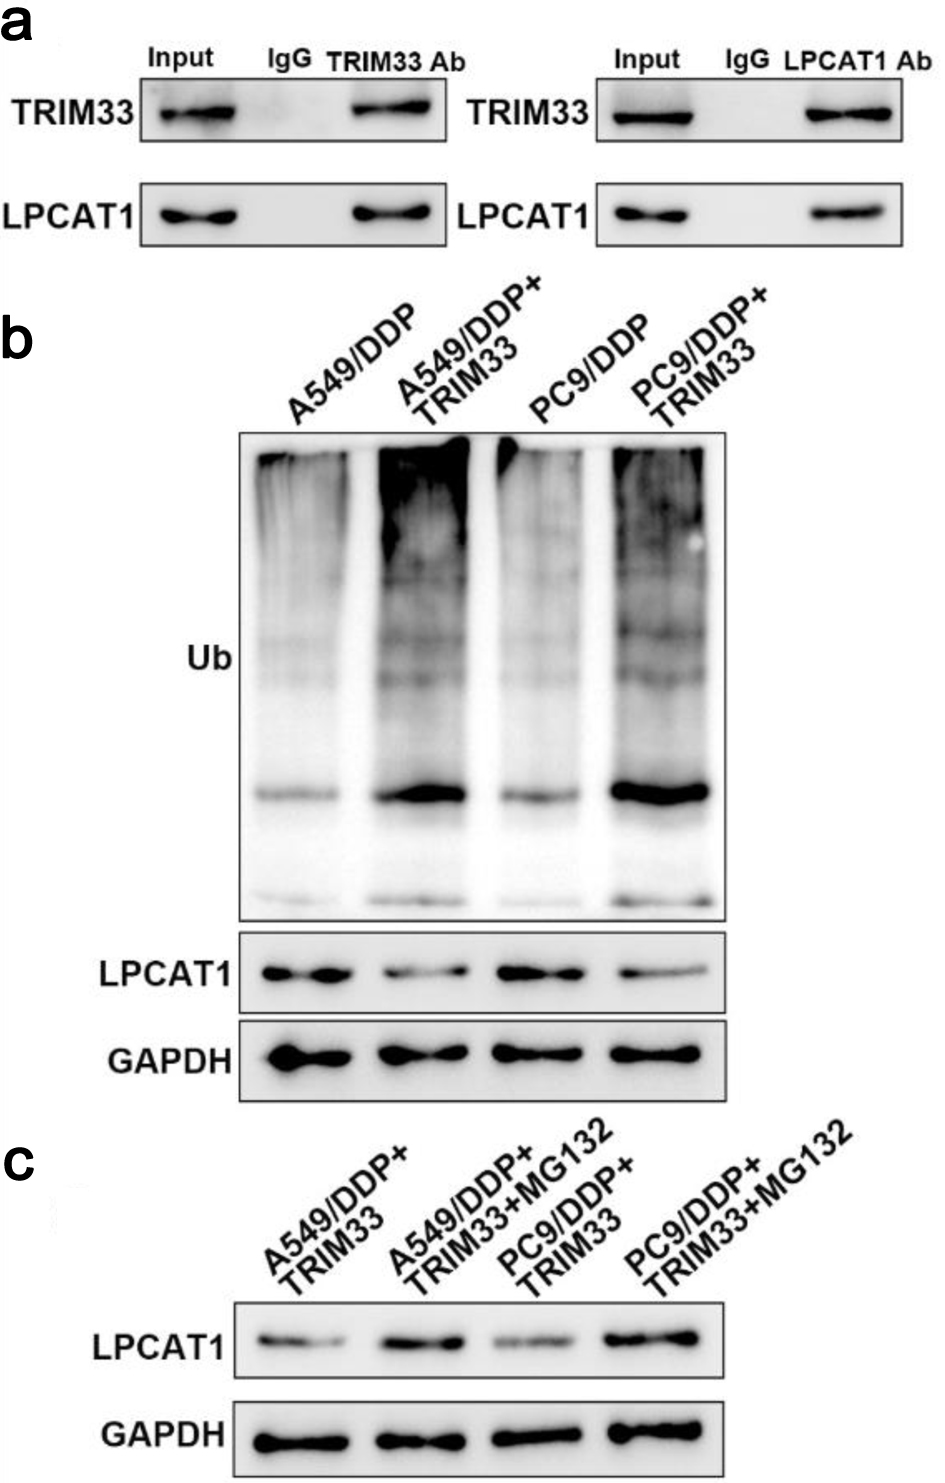
↓ Figure 8. TRIM33 promotes LPCAT1 degradation through ubiquitination. (a) Immunoprecipitation analysis of the interaction between TRIM33 and LPCAT1. (b) Detection of LPCAT1 ubiquitination levels. (c) Effect of MG132 on LPCAT1 ubiquitination levels.
Table
↓ Table 1. Primer Sequences for qRT-PCR
| Gene | Forward primer (5'-3') | Reverse primer (5'-3') |
|---|
| LPCAT1 | 5′-ATGGCAGCAGTCTTCTTCCTG-3′ | 5′-TCAGCAGCAGTCTTGTCCTT-3′ |
| TRIM33 | 5′-AAGGTGAAGGTCGGAGTCAAC-3′ | 5′-TCAGCTGCTGCTGCTTACTT-3′ |
| GAPDH | 5′-GGCATGGACTGTGGTCATGAG-3′ | 5′-TGCACCACCAACTGCTTAGC-3′ |