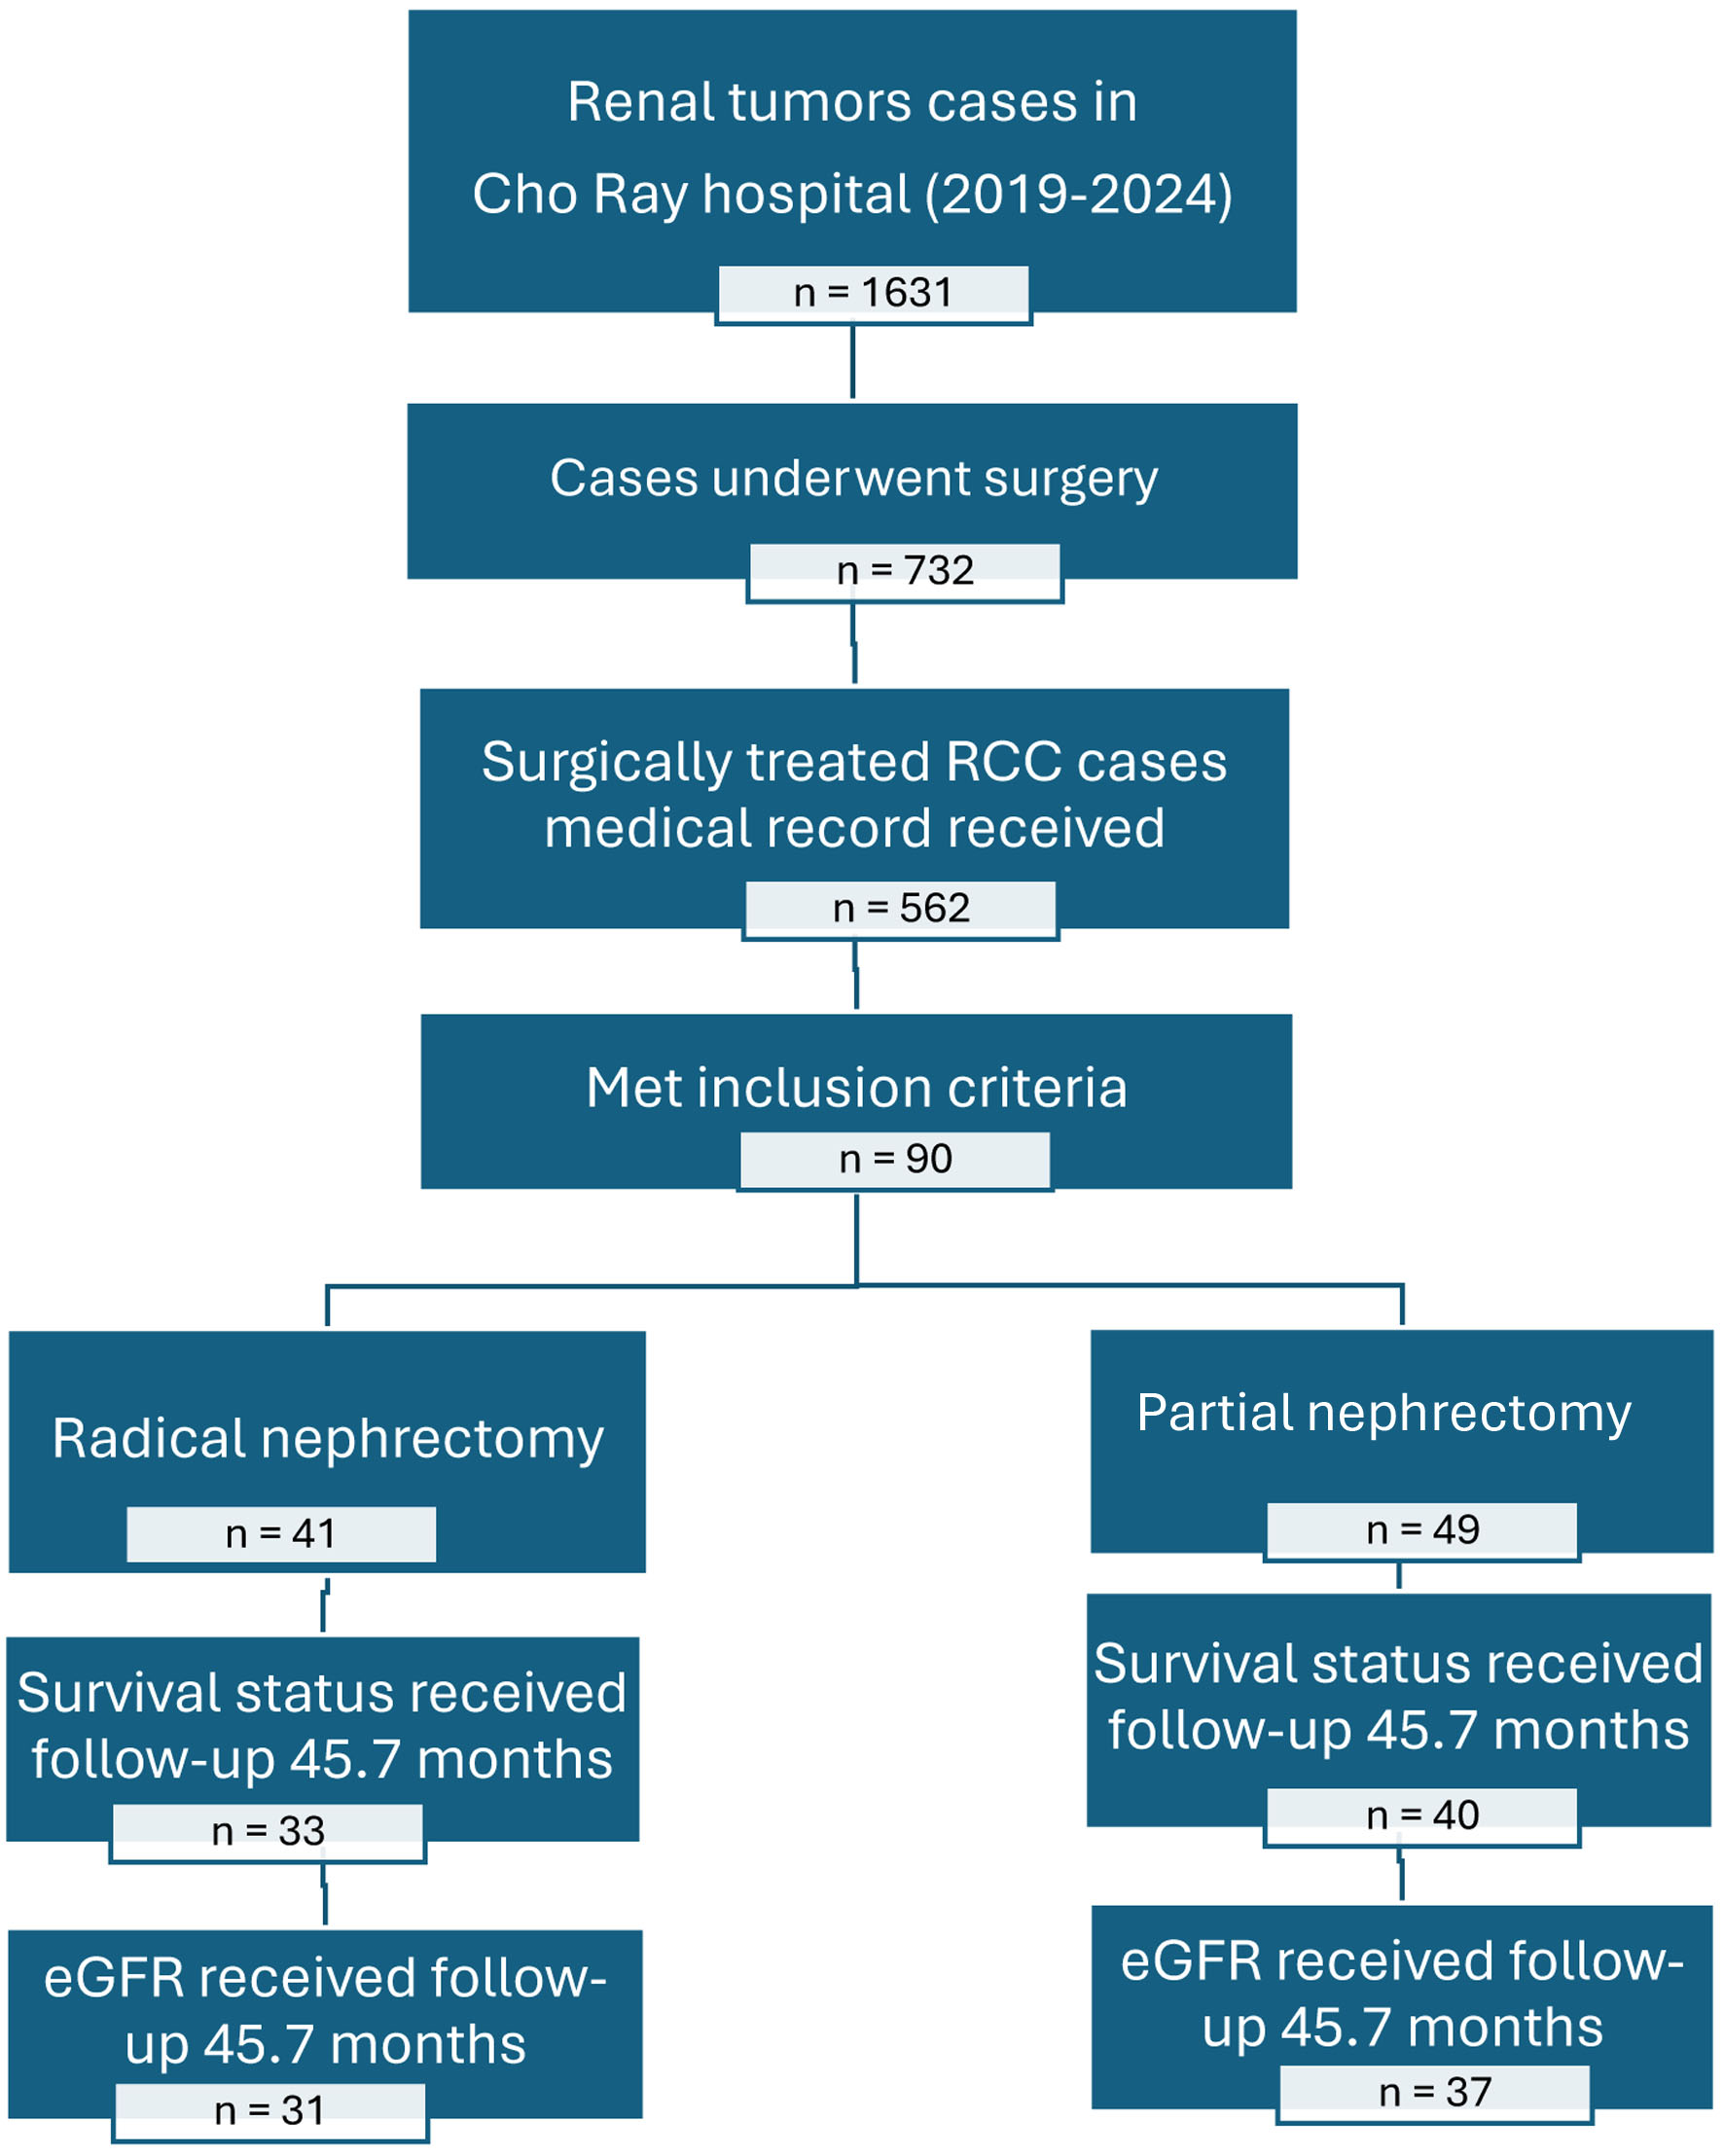
| World Journal of Oncology, ISSN 1920-4531 print, 1920-454X online, Open Access |
| Article copyright, the authors; Journal compilation copyright, World J Oncol and Elmer Press Inc |
| Journal website https://wjon.elmerpub.com |
Original Article
Volume 17, Number 2, April 2026, pages 237-246
Functional and Survival Outcomes of Partial Versus Radical Nephrectomy in Renal Cell Carcinoma Patients With Pre-Existing Chronic Kidney Disease: A Real-World Study
Figures


Tables
| Characteristic | RN group (N = 41) | PN group (N = 49) | Total cohort (N = 90) | P-value |
|---|---|---|---|---|
| This table summarizes patient demographics, clinical status, and tumor characteristics, demonstrating the selection bias in surgical indication. BMI: body mass index; eGFR: estimated glomerular filtration rate; ESRD: end-stage renal disease; Hb: hemoglobin; PN: partial nephrectomy; RCC: renal cell carcinoma; RN: radical nephrectomy. | ||||
| Patient demographics and pre-operative health | ||||
| Mean age (years) | 59.5 ± 13.3 | 63.1 ± 10.9 | 61.5 ± 12.1 | 0.16 |
| Male sex (%) | 78 | 77.6 | 77.8 | 0.96 |
| Mean BMI | 21.2 ± 3.2 | 20.8 ± 2.8 | 21.0 ± 3.0 | 0.54 |
| Flank pain (%) | - | - | 53.3 | - |
| Incidentally detected (%) | - | - | 41.1 | - |
| Cardiovascular disease (%) | - | - | 45.1 | - |
| Type II diabetes mellitus (%) | - | - | 18.9 | - |
| ESRD on dialysis (%) | 9.8 | 0 | 4.4 | 0.042 |
| Mean pre-operative Hb (g/L) | 121.6 ± 25.2 | 137.6 ± 17.6 | 130.3 ± 22.8 | < 0.001 |
| Mean pre-operative eGFR (mL/min/1.73 m2) | 43.2 ± 16.7 | 48.8 ± 10.4 | 46.3 ± 13.9 | 0.58 |
| Baseline eGFR < 45 (mL/min/1.73 m2) | 8 (19.5%) | 10 (20.4%) | 18 (20.0%) | 0.92 |
| Positive proteinuria (%) | 41.5 | 38.8 | 40 | 0.482 |
| Tumor and pathological characteristics | ||||
| Median tumor size (cm) | 8.0 | 3.7 | 5.9 | < 0.001 |
| Mean RENAL score | 10.2 | 7.1 | 8.5 | < 0.001 |
| Post-operative ≥ T2 (%) | 75.6 | 6.2 | 37.7 | 0.001 |
| Histology: clear cell RCC (%) | 75.5 | 69.4 | 72.3 | 0.4 |
| Outcome | RN group (N = 41) | PN group (N = 49) | Total cohort (N = 90) | P-value |
|---|---|---|---|---|
| This table summarizes surgical morbidity, technique utilized, and the initial functional response to surgery. AKI: acute kidney injury; eGFR: estimated glomerular filtration rate; PN: partial nephrectomy; RN: radical nephrectomy. | ||||
| Surgical technique and morbidity | ||||
| Open surgery (%) | 75.6 | 42.9 | 57.8 | 0.001 |
| Minimally invasive/robot (%) | 24.4 | 57.1 | 42.2 | 0.001 |
| Mean blood loss (mL) | 219.3 ± 307.7 | 118.2 ± 95.5 | 164.2 ± 223.6 | 0.02 |
| Transfusion required (%) | 12.2 | 0 | 5.6 | 0.017 |
| Overall AKI incidence (%) | 31.7 | 30.6 | 31.1 | 0.286 |
| Emergency dialysis required (%) | 7.3 | 0 | 3.3 | 0.091 |
| Severe complication (≥ Clavien IIIa) (%) | 9.76 | 2.04 | 5.5 | 0.229 |
| Functional change | ||||
| Change in eGFR post-operative (mL/min/1.73 m2) | -6.2 ± 9.0 | −6.3 ± 7.5 | −6.2 ± 8.2 | 0.652 |
| Pre-operative eGFR vs. post-operative eGFR | P < 0.001 (Paired) | P < 0.001 (paired) | P < 0.001 (paired) | - |
| Outcome | RN group (N = 31) | PN group (N = 37) | P-value |
|---|---|---|---|
| This table demonstrates the long-term functional advantage of PN over RN, particularly regarding the magnitude of eGFR decline. eGFR: estimated glomerular filtration rate; PN: partial nephrectomy; RN: radical nephrectomy. | |||
| Mean follow-up duration | 45.7 ± 15.8 months | ||
| Pre-operative eGFR (baseline) (mL/min/1.73 m2) | 49.8 ± 6.7 | 48.8 ± 11.1 | 0.522 |
| Long-term eGFR (endpoint) (mL/min/1.73 m2) | 26.5 ± 7.3 | 36.8 ± 10.8 | - |
| Total eGFR decline (mL/min/1.73 m2) | −23.3 ± 6.0 | −13.2 ± 3.5 | < 0.001 |
| CKD stage progression rate in F/U (%) | 100% (31/31) | 62.2% (23/37) | 0.004 |
| Subgroup: pre-operative eGFR ≥ 45 mL/min/1.73 m2 | RN group (N = 23) | PN group (N = 27) | P-value |
| Pre-operative eGFR (baseline) (mL/min/1.73 m2) | 53 ± 3.9 | 54.5 ± 4.1 | 0.124 |
| Long-term eGFR (endpoint) (mL/min/1.73 m2) | 28.3 ± 7.2 | 41.0 ± 6.9 | - |
| eGFR decline (mL/min/1.73 m2) | −24.7 ± 5.3 | −13.5 ± 3.8 | < 0.001 |
| Subgroup: pre-operative eGFR < 45 mL/min/1.73 m2 | RN group (N = 8) | PN group (N = 10) | P-value |
| Pre-operative eGFR (baseline) (mL/min/1.73 m2) | 40.5 ± 3.5 | 33.2 ± 8.7 | 0.083 |
| Long-term eGFR (endpoint) (mL/min/1.73 m2) | 21.3 ± 5.1 | 20.8 ± 8.3 | |
| eGFR decline (mL/min/1.73 m2) | −19.3 ± 6.5 | −12.4 ± 2.5 | 0.002 |
| Outcome | PN group (N = 40) | RN group (N = 33) | P-value |
|---|---|---|---|
| This table confirms comparable survival rates between the two surgical groups, while identifying independent systemic risk factors for overall mortality. eGFR: estimated glomerular filtration rate; PN: partial nephrectomy; RN: radical nephrectomy. | |||
| Overall survival (OS) rate (%) | 75.0 | 69.7 | 0.74 |
| Cancer-free survival (CFS) rate (%) | 82.5 | 75.8 | 0.35 |
| Dialysis-free survival (DFS) rate (%) | 85.0 | 78.8 | 0.59 |
| Independent risk factors for overall mortality (Cox regression) | Hazard ratio (HR) | 95% Confidence interval (CI) | P-value |
| Age (per year increase) | 1.1 | 1.02–1.12 | 0.01 |
| Positive proteinuria | 5.4 | 1.35–21.81 | 0.017 |
| Preoperative eGFR | 0.97 | 0.93–1.0 | 0.064 |
| Tumor size | 1.07 | 0.87–1.32 | 0.503 |
| RENAL score | 1.02 | 0.78–1.33 | 0.89 |
| Factor | Correlation coefficient (Pearson/Tau) | P-value | Interpretation (direction of decline) |
|---|---|---|---|
| eGFR: estimated glomerular filtration rate. | |||
| Total RENAL score | −0.454 (inverse) | < 0.001 | Correlates with greater decline |
| Tumor size | −0.500 (inverse) | < 0.001 | Correlates with greater decline |
| Intraoperative blood loss | −0.353 (inverse) | 0.012 | Correlates with greater decline |
| Pre-operative eGFR | 0.546 (positive) | < 0.001 | Correlates with less decline (protective) |
| eGFR of contralateral kidney | 0.349 (positive) | 0.014 | Correlates with less decline (protective) |