Figures
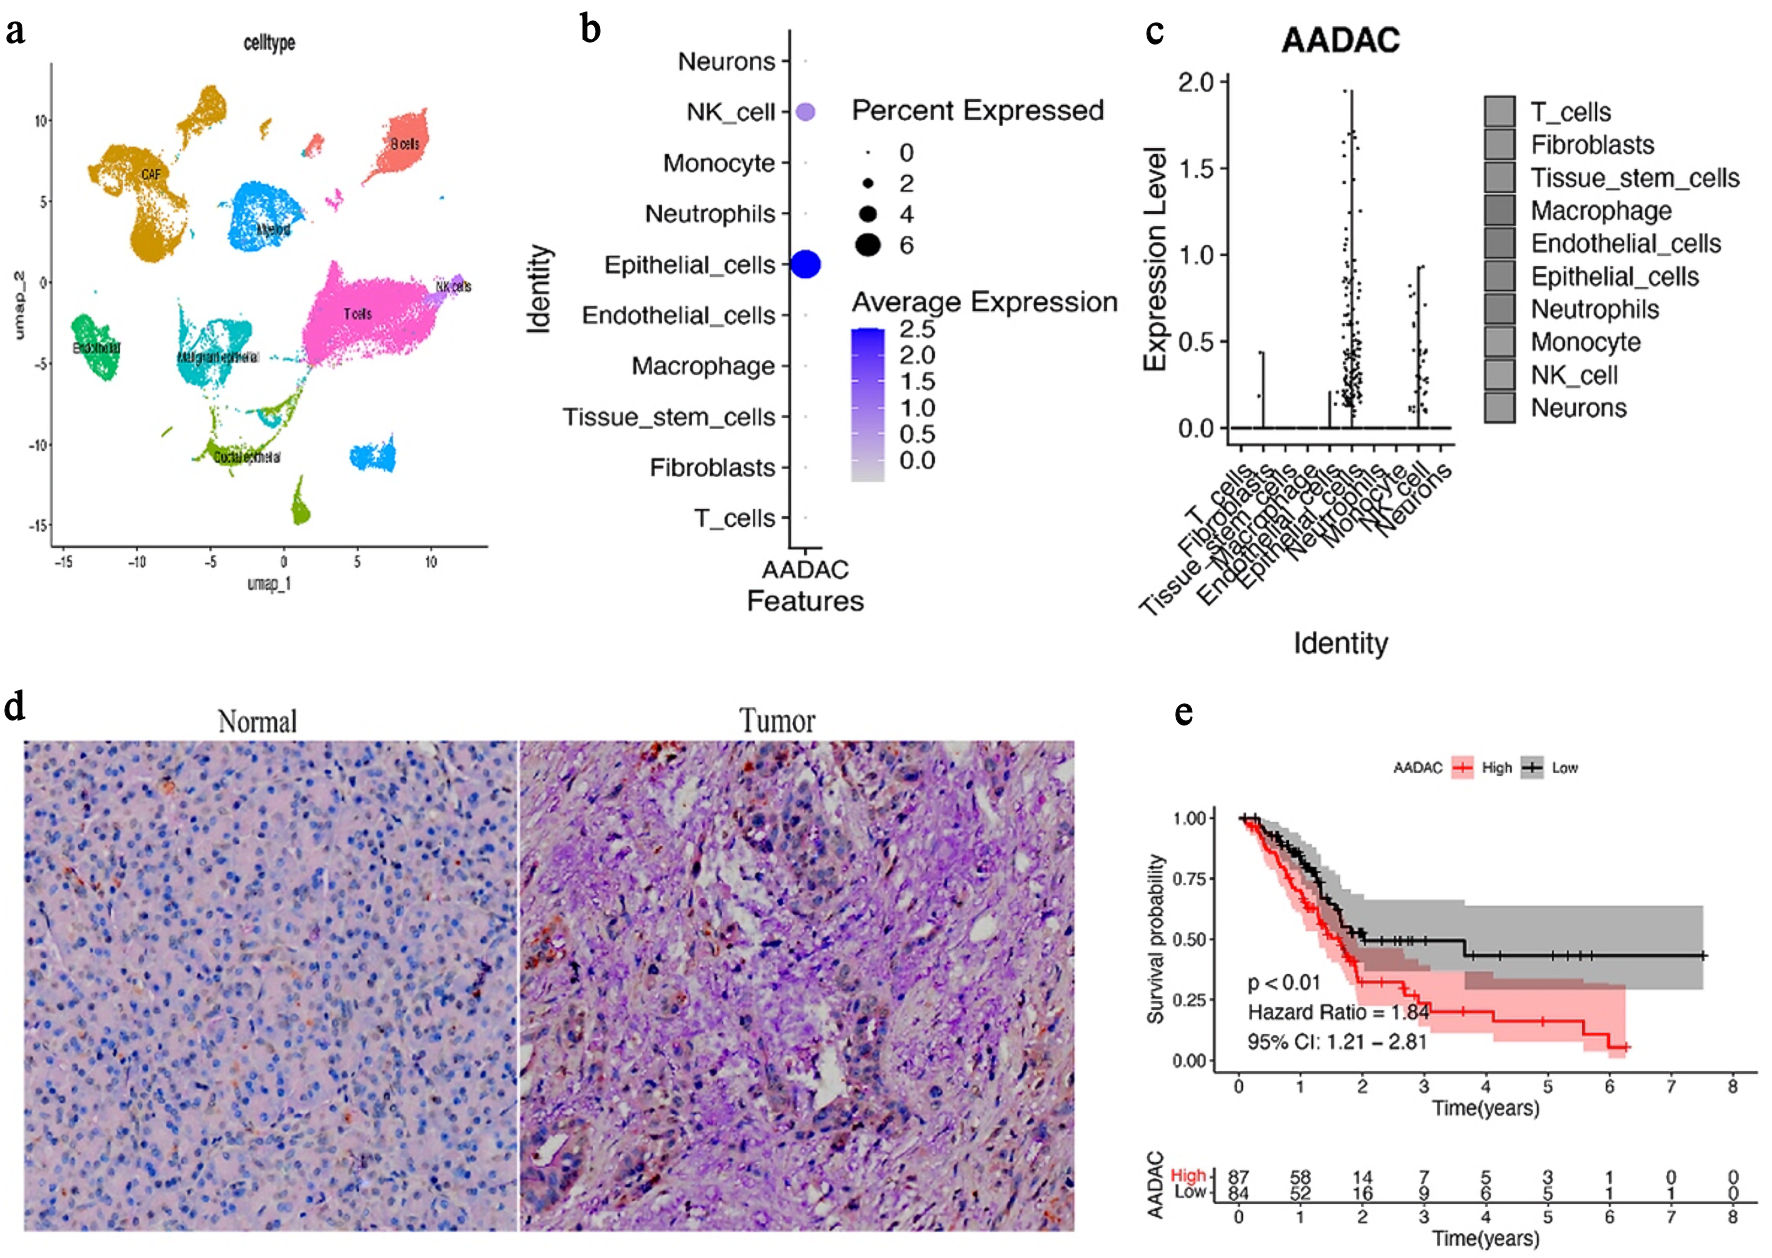
↓ Figure 1. AADAC is enriched in epithelial cells and is associated with poor prognosis in PDAC. (a) UMAP projection of scRNA-seq data from GSE212966 showing annotated cell clusters, including epithelial cells, fibroblasts, myeloid cells, and T cells. (b) FeaturePlot showing that AADAC expression is concentrated in epithelial clusters. (c) Violin plot comparing AADAC expression across major cell types; note that the result supports epithelial enrichment of AADAC-positive cells rather than indicating that all epithelial cells overexpress AADAC. (d) Representative AADAC immunohistochemistry images and corresponding quantification comparing tumor and adjacent normal epithelium. Tumor-derived epithelial regions show significantly higher AADAC staining intensity. (e) Kaplan–Meier survival analysis of TCGA PDAC patients stratified by median AADAC expression. Higher AADAC expression is associated with shorter overall survival. NK cell: natural killer cell; AADAC: arylacetamide deacetylase; PDAC: pancreatic ductal adenocarcinoma; TCGA: The Cancer Genome Atlas; scRNA-seq: single-cell RNA sequencing; UMAP: Uniform Manifold Approximation and Projection; CI: confidence interval.
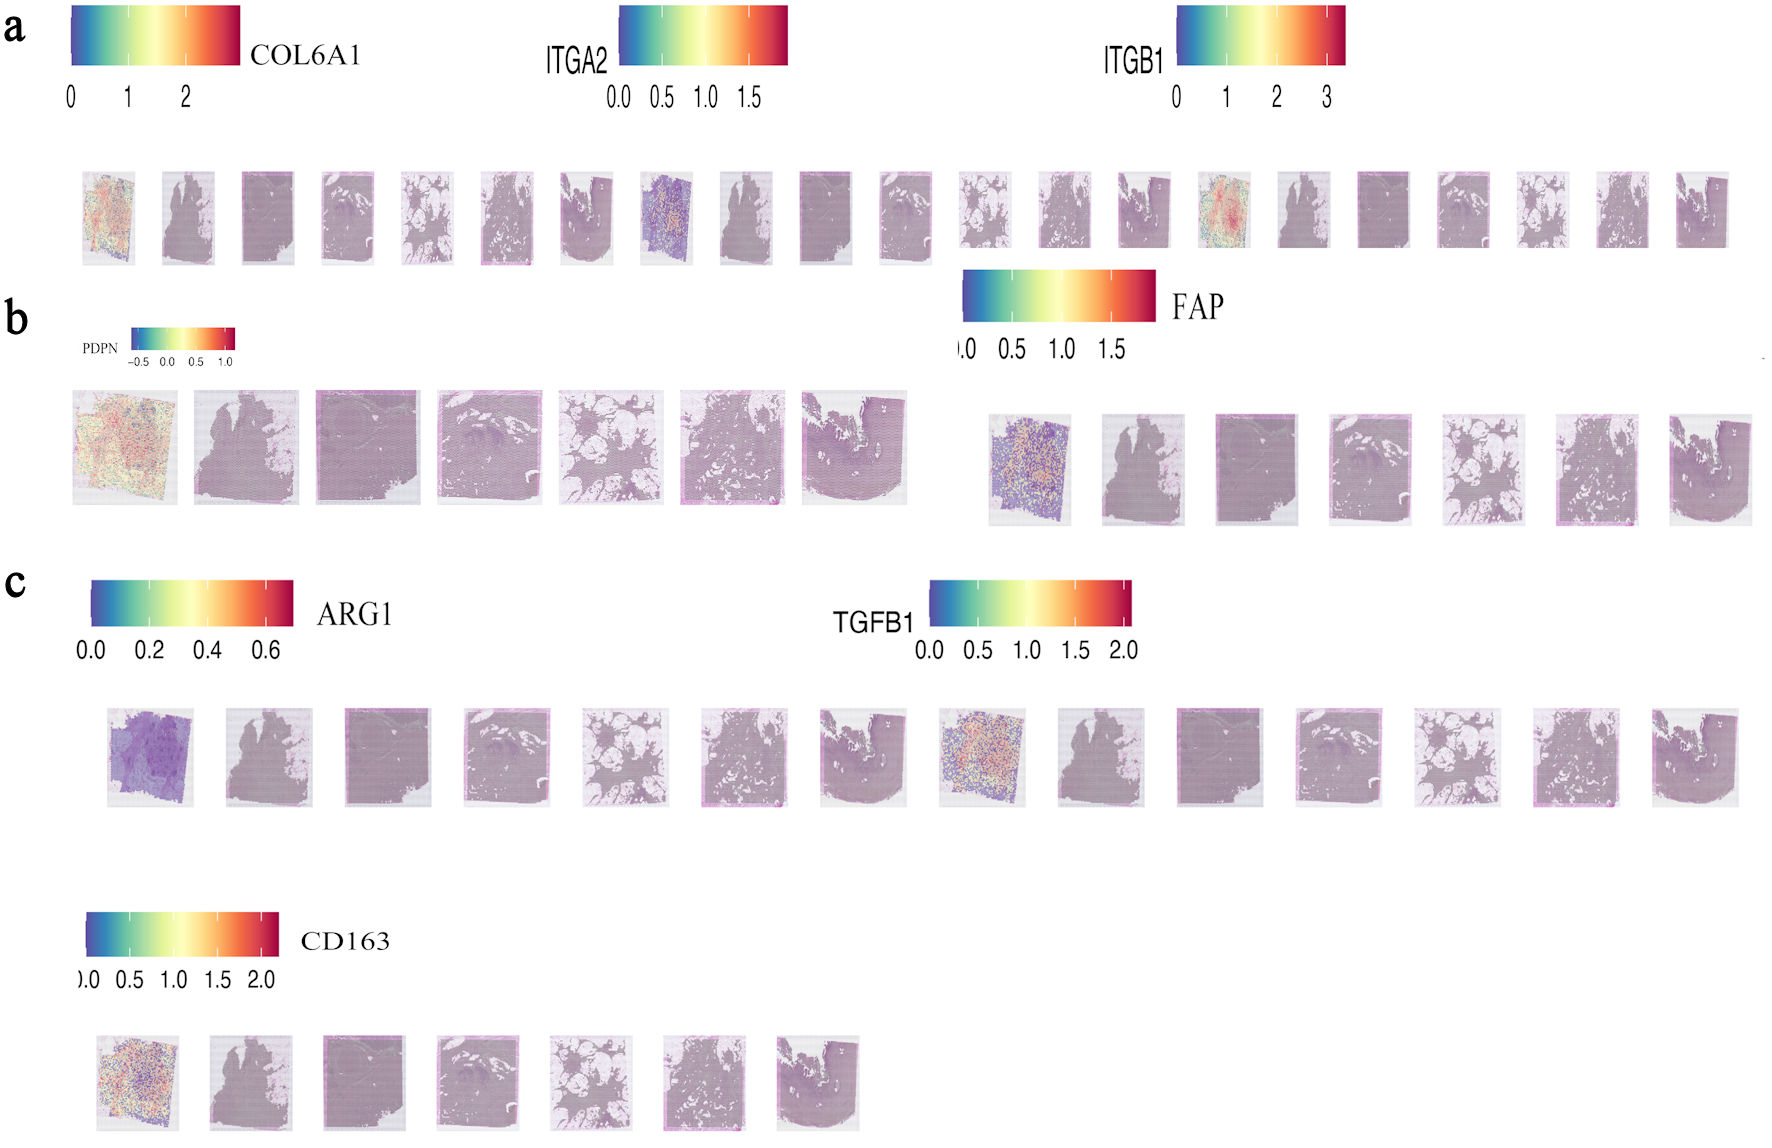
↓ Figure 2. AADAC-rich epithelial regions are spatially associated with ECM-rich and immunosuppressive stromal domains. (a) Spatial co-localization of AADAC with core ECM-integrin markers (COL6A1, ITGA2, and ITGB1) in PDAC tissue sections (GSE235315). (b, c) Spatial co-expression of AADAC with CAF-associated markers (PDPN and FAP) and immunosuppressive genes (TGFB1, ARG1, and CD163), indicating fibroblast-rich suppressive microenvironments adjacent to AADAC-positive regions. TGFB1: transforming growth factor beta 1; AADAC: arylacetamide deacetylase; ARG1: arginase 1; CAF: cancer-associated fibroblast; CD163: cluster of differentiation 163; ECM: extracellular matrix; PDAC: pancreatic ductal adenocarcinoma.
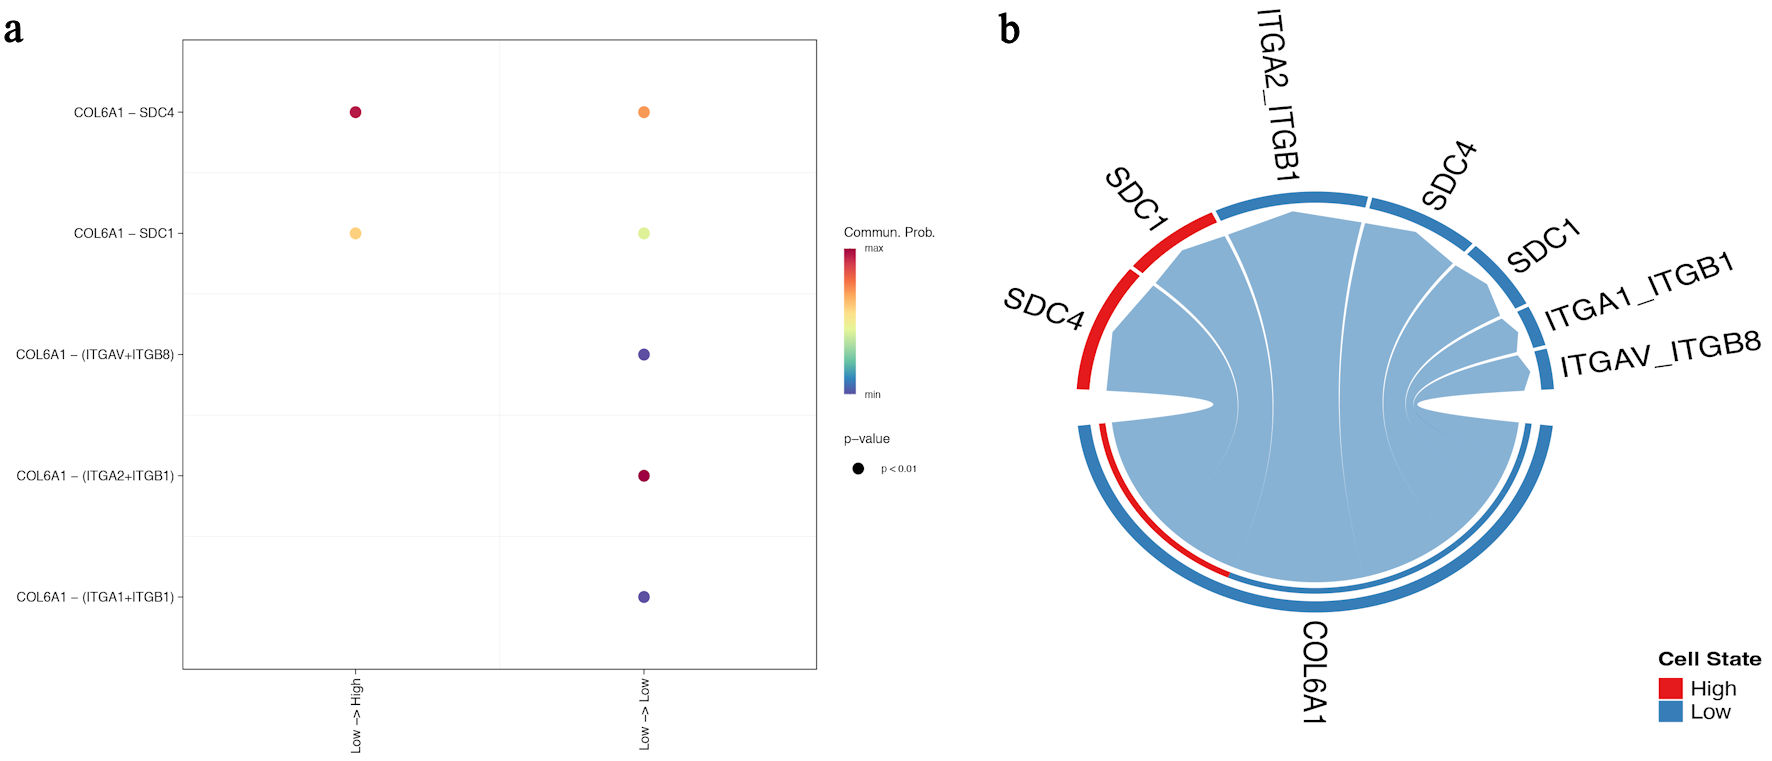
↓ Figure 3. High-AADAC regions show stronger representation of the COL6A1-integrin communication landscape. (a) GSVA-based spatial pathway map showing higher core COL6A1-integrin scores in AADAC-enriched regions. (b) CellChat-derived network plot comparing low- and high-AADAC states. COL6A1-ITGA2/ITGB1 interactions dominate the high-AADAC state, whereas SDC1 and SDC4 appear as additional but weaker contextual receptors/co-receptors. AADAC: arylacetamide deacetylase; GSVA: gene set variation analysis.
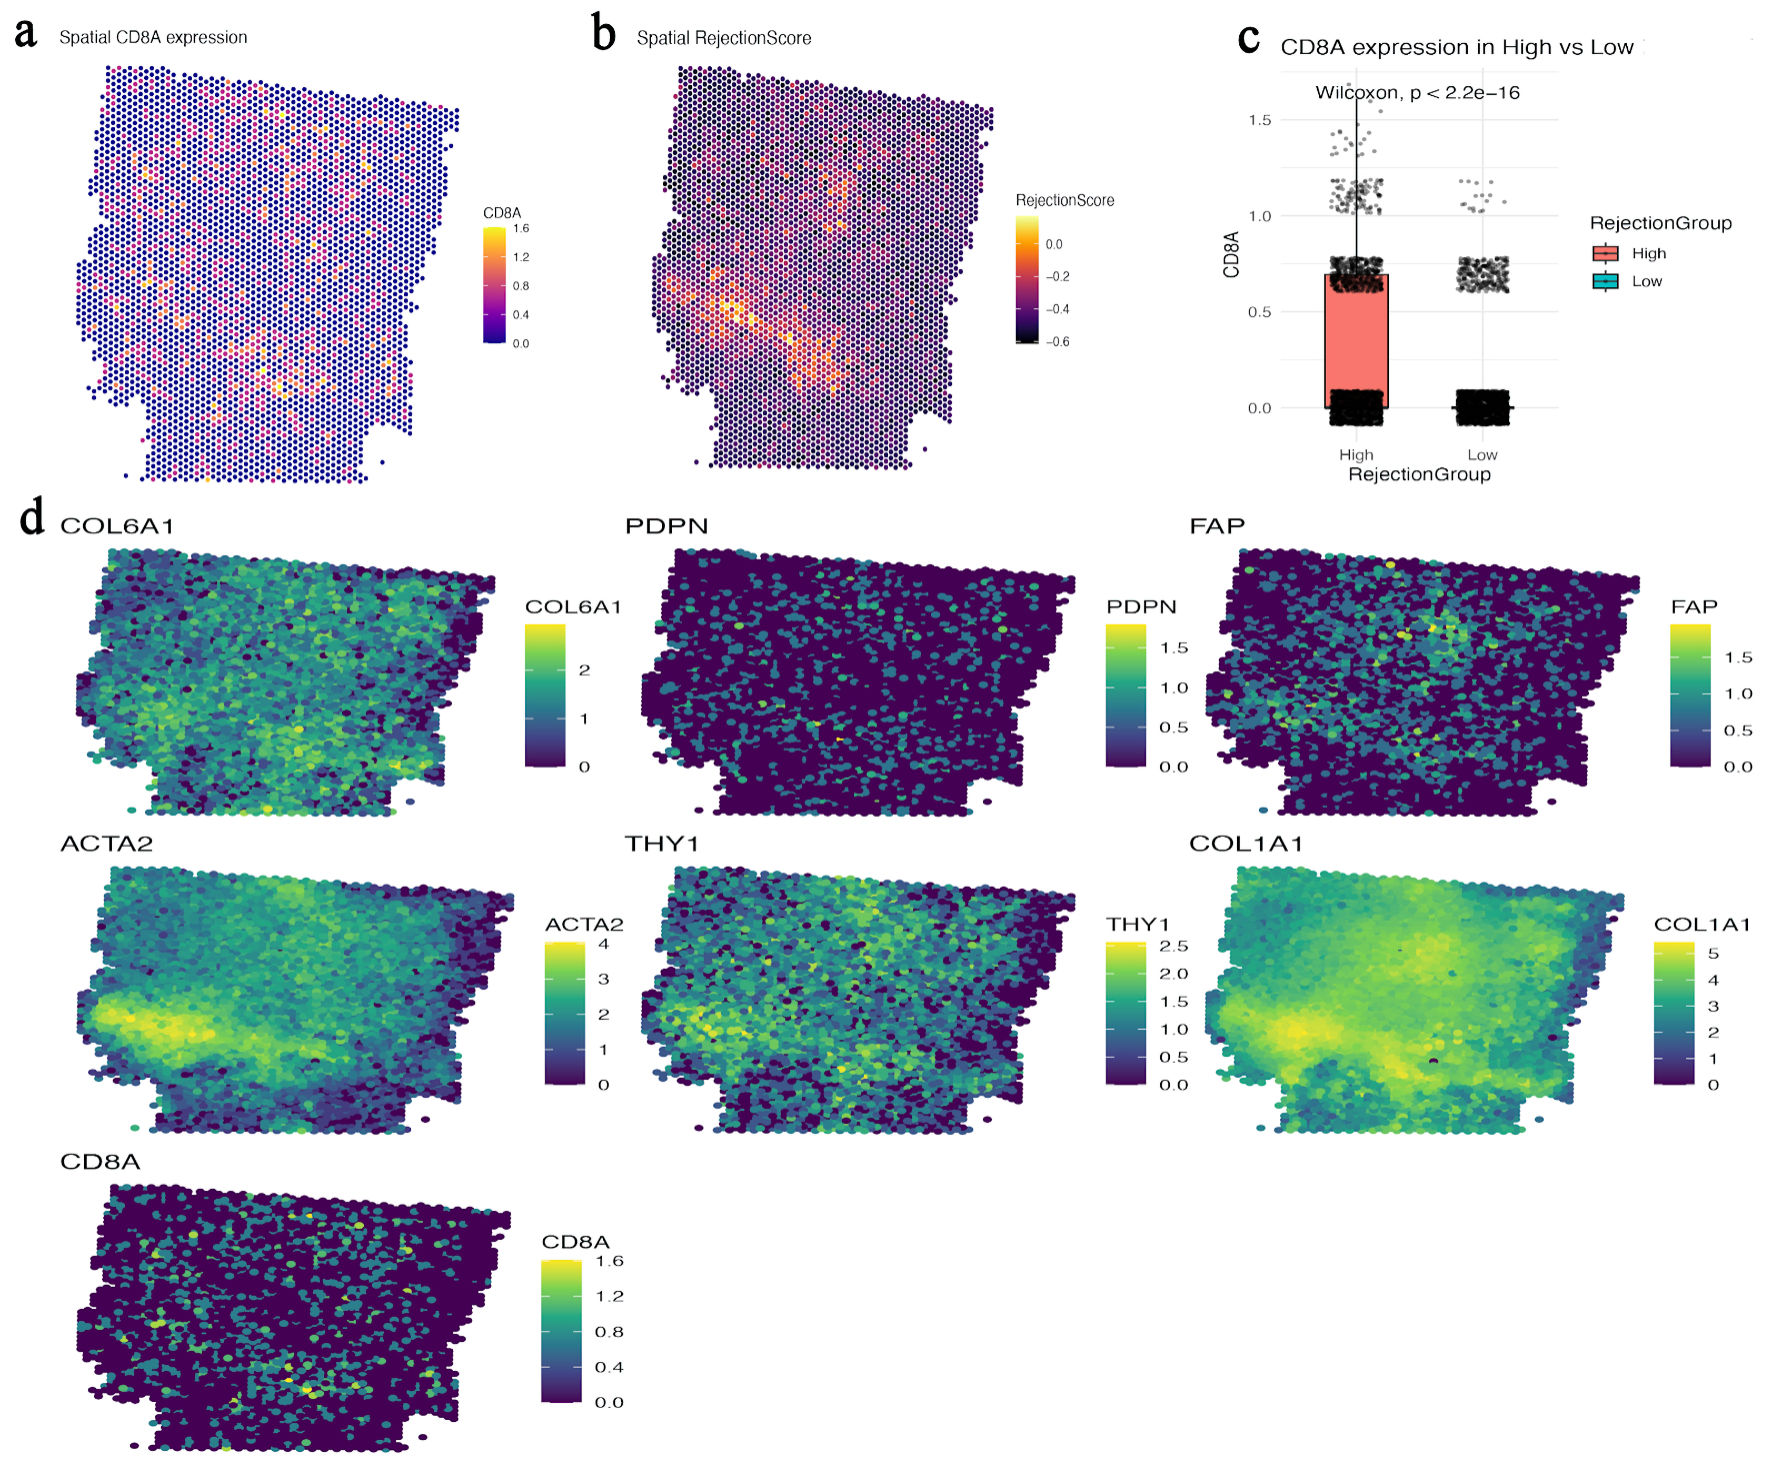
↓ Figure 4. CD8A-positive regions align with stromalized, suppressive niches rather than showing simple spatial exclusion. (a) Spatial map of CD8A expression across the PDAC section. (b) Spatial heatmap of the study-specific RejectionScore derived from CD274, CXCL12, and TGFB1. (c) Boxplot comparing CD8A expression between high- and low-RejectionScore spots, showing enrichment of CD8A in high-score regions. (d) Spatial maps of COL6A1, PDPN, FAP, ACTA2, THY1, COL1A1, and CD8A, illustrating close apposition of CD8A-positive regions to fibroblastic ECM-rich compartments. CD8A: CD8 alpha chain; ECM: extracellular matrix; FAP: fibroblast activation protein; PDAC: pancreatic ductal adenocarcinoma; PDPN: podoplanin; TGFB1: transforming growth factor beta 1; ACTA2: alpha-smooth muscle actin.
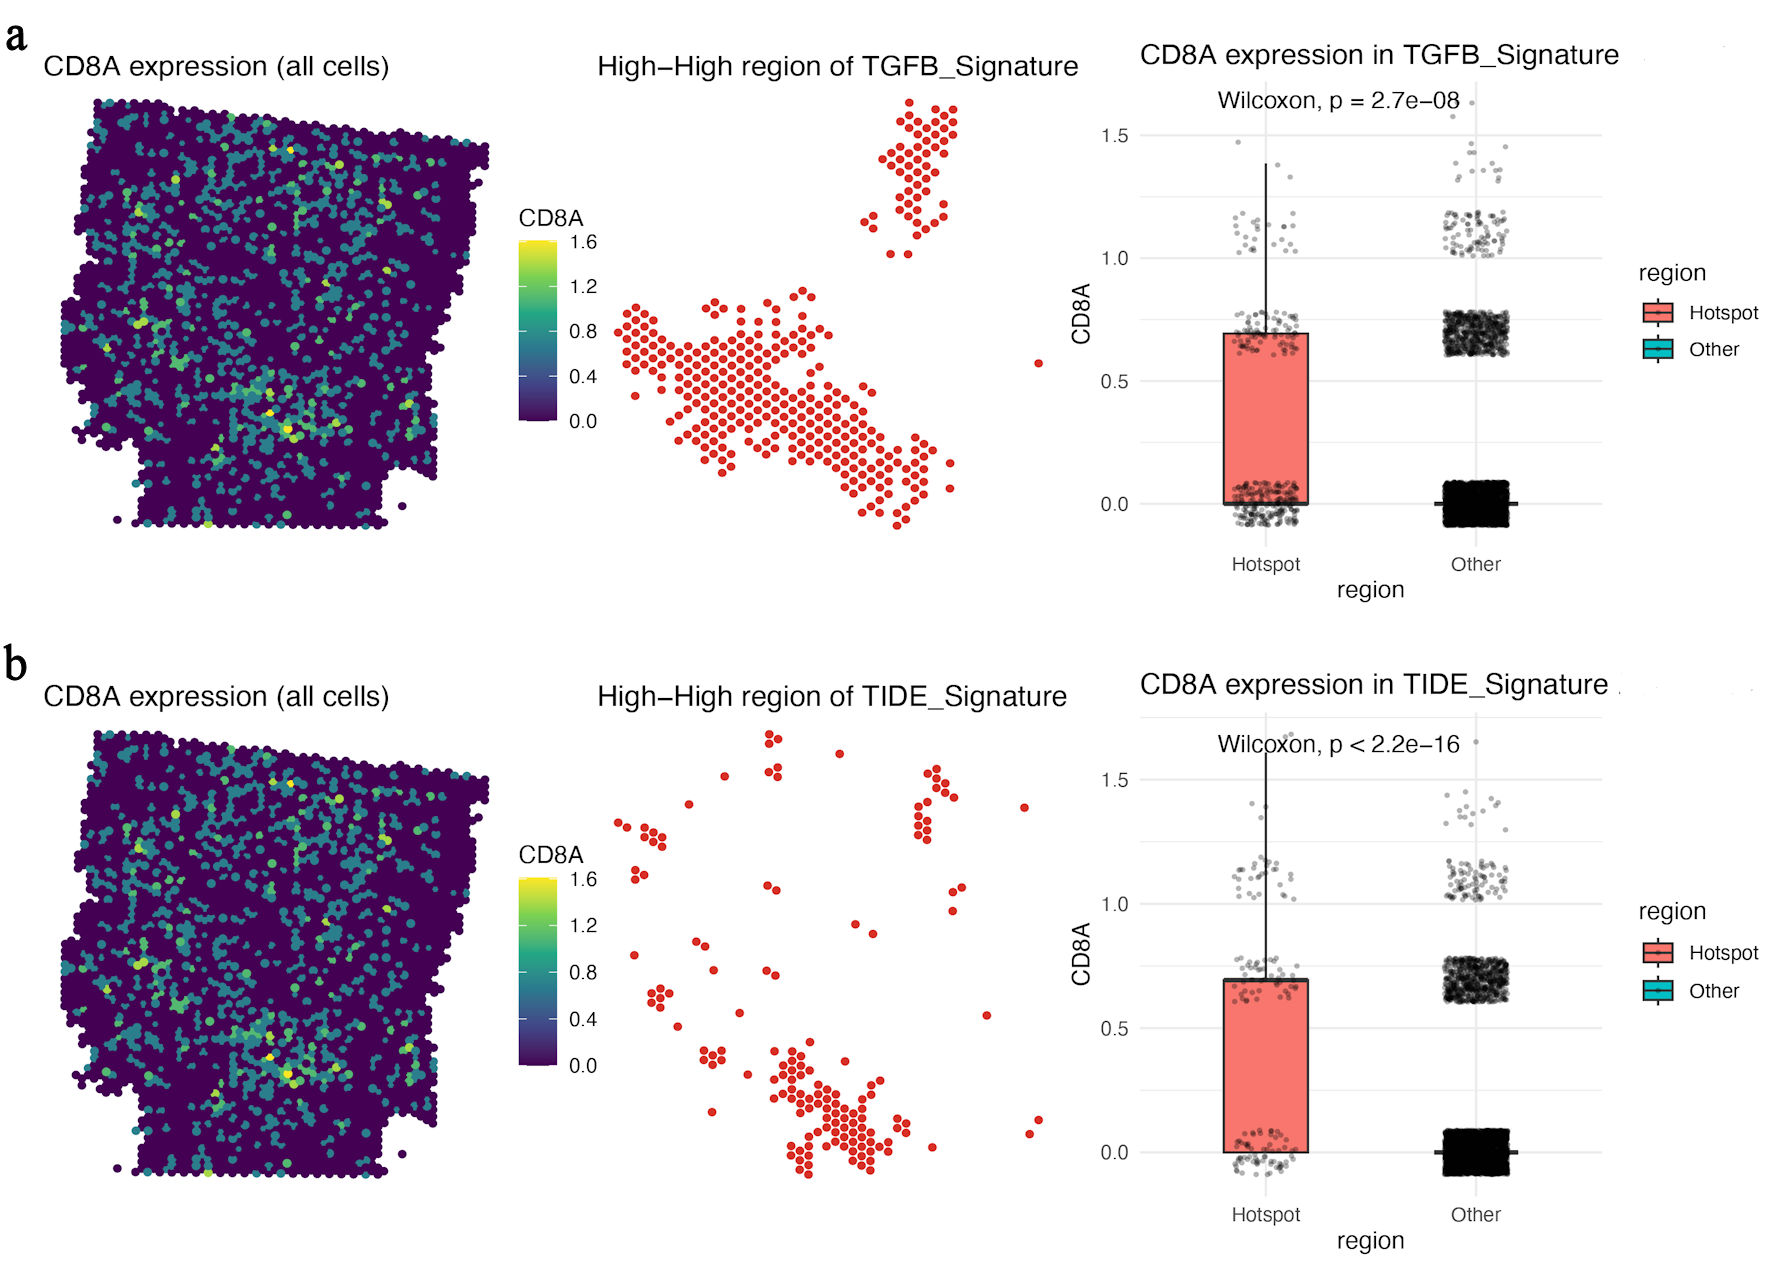
↓ Figure 5. CD8A-positive regions overlap with TGFB- and TIDE-high immunosuppressive hotspots. (a) Spatial map of CD8A expression, TGFB-signature-high hotspots, and boxplot comparison of CD8A expression between TGFB-signature hotspot and non-hotspot regions. (b) Spatial map of CD8A expression, TIDE-signature-high hotspots, and boxplot comparison of CD8A expression between TIDE-signature hotspot and non-hotspot regions. CD8A: CD8 alpha chain; TGFB: transforming growth factor beta.
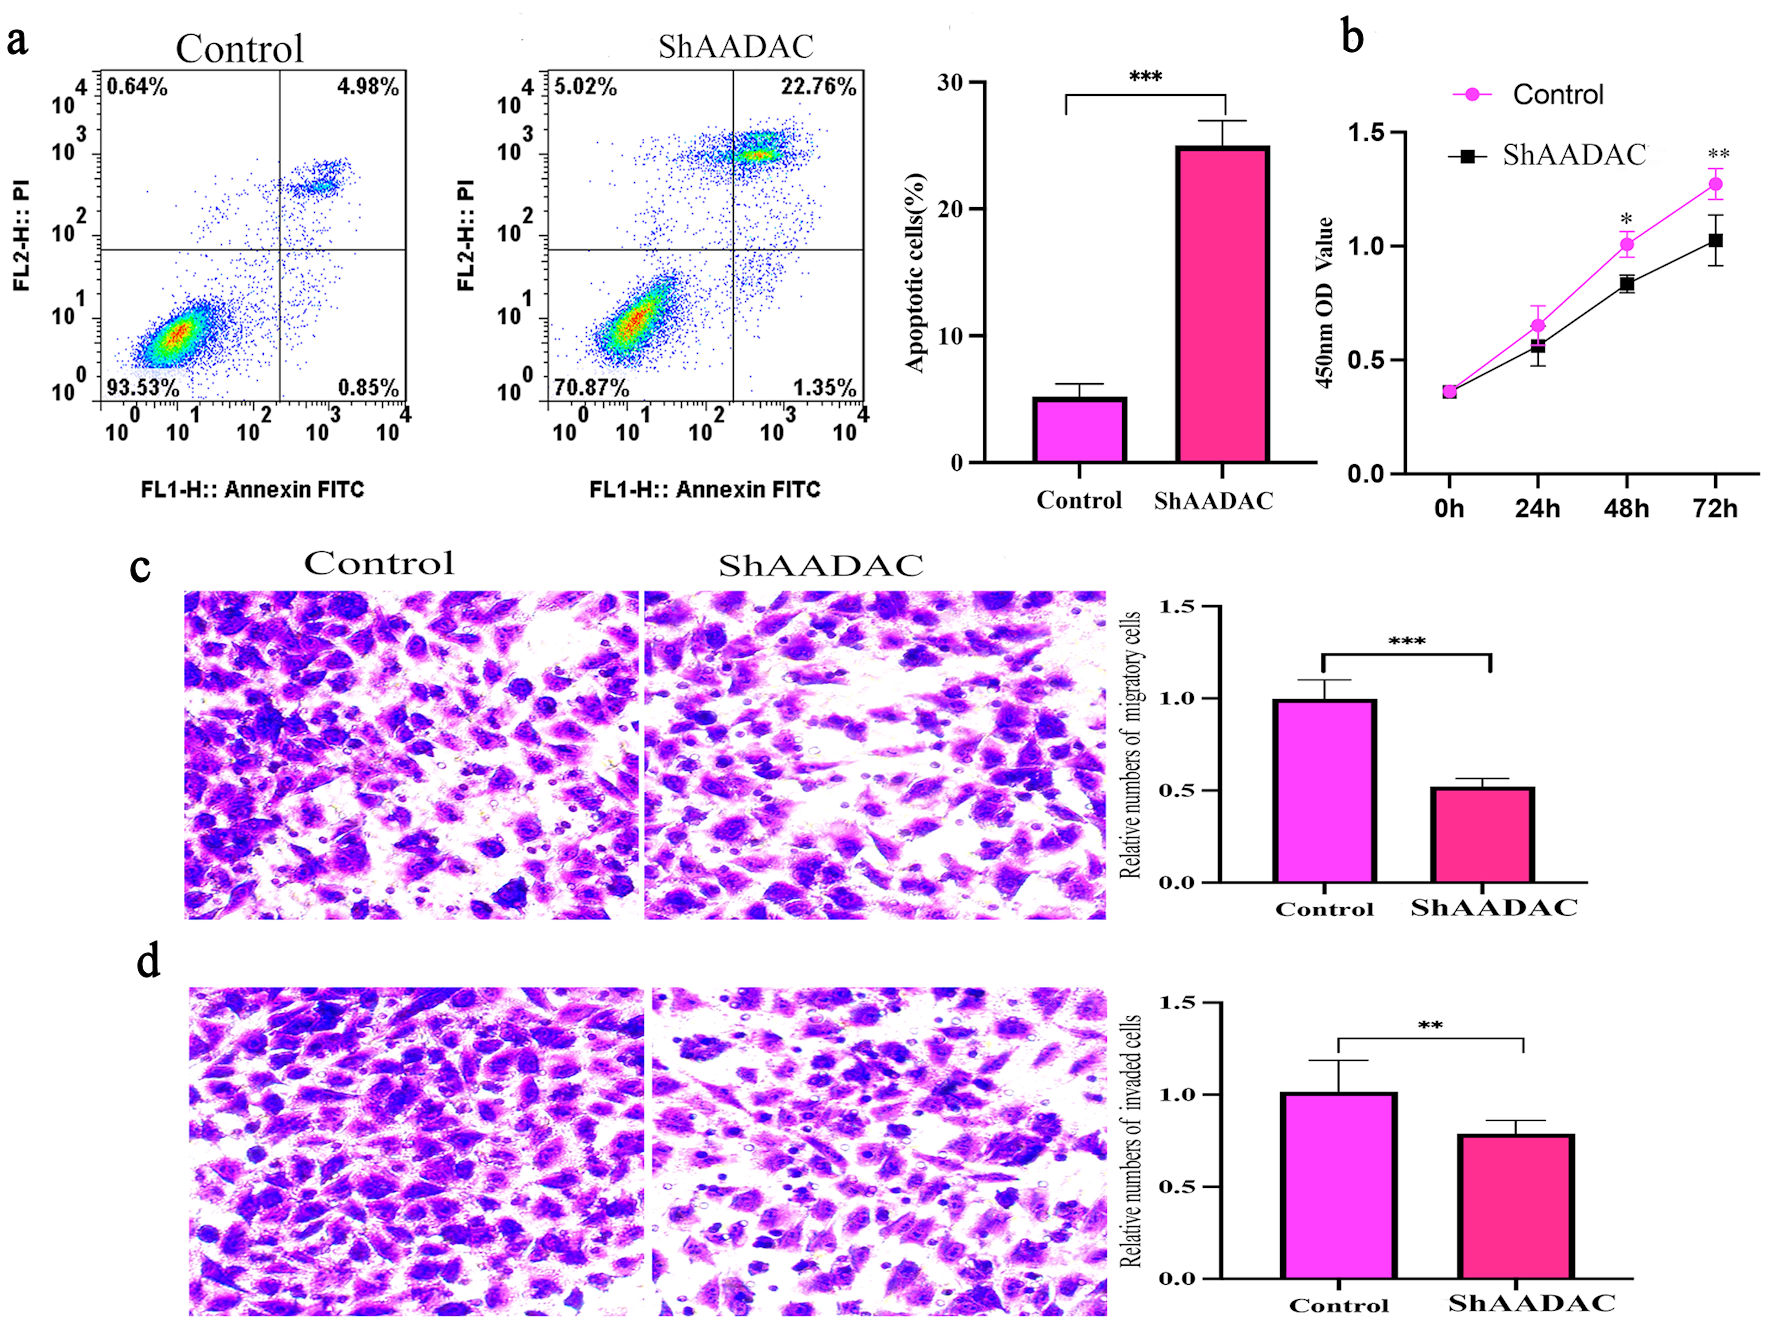
↓ Figure 6. AADAC knockdown increases apoptosis and suppresses proliferation, migration, and invasion in PANC-1 cells. (a) Flow-cytometry analysis showing increased apoptosis after AADAC knockdown compared with control cells, with quantification at right. (b) CCK-8 proliferation assay demonstrating reduced growth in the shAADAC group over 72 h. (c) Transwell migration assay showing reduced cell motility after AADAC silencing, with quantification at right. (d) Transwell invasion assay showing reduced invasive capacity after AADAC knockdown, with quantification at right. CCK-8: Cell Counting Kit-8; AADAC: arylacetamide deacetylase; FITC: fluorescein isothiocyanate.