Figures
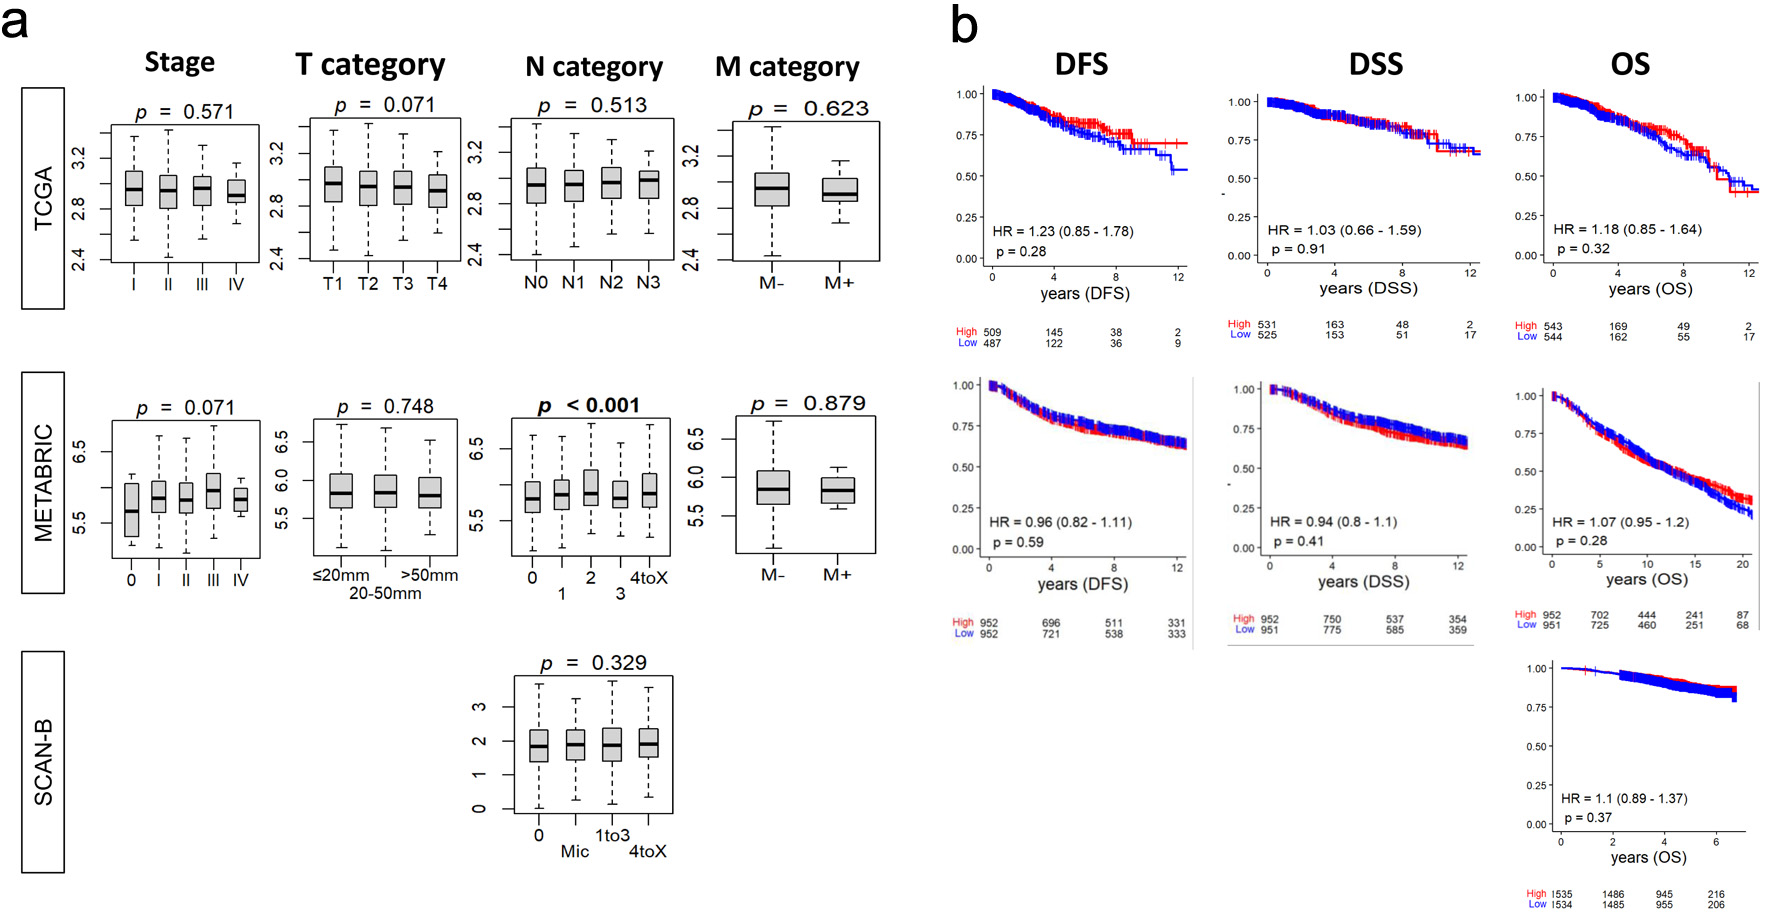
↓ Figure 1. Relationship between tumor BTK
expression and breast cancer aggressiveness and survival. BTK mRNA expression in three cohorts was
examined. (a) Tukey boxplots of BTK expression among tumors categorized by overall AJCC stage and status
for tumor size (T), lymph node (N), and metastasis (M). P values from Kruskal-Wallis test are shown. (b)
Estimated survival (Kaplan-Meier) with log-rank test P value and hazard ratio (HR) of disease-free
survival (DFS), disease-specific survival (DSS), and overall survival (OS) for groups of patients with
low and high BTK expression within the cohorts, using median value as cut-off.
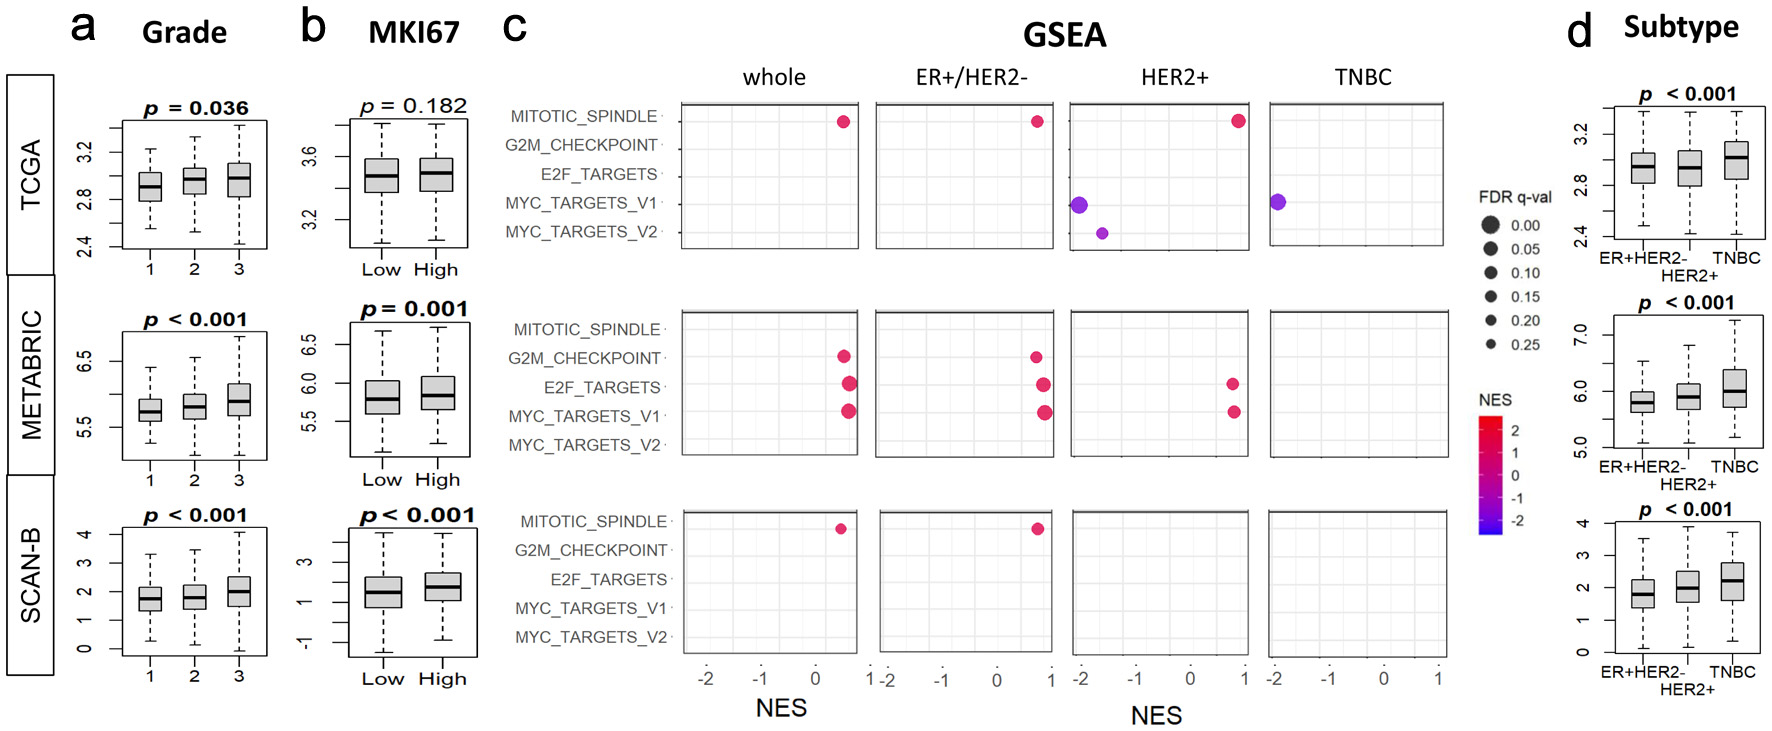
↓ Figure 2. Associations of tumor BTK expression
with Nottingham histological grade, MKI67 gene expression, and cell proliferation pathways in breast
cancer. BTK mRNA expression in three cohorts was examined. (a) Tukey boxplots of BTK expression in
different histological grades of breast cancer. (b) Tukey boxplots of tumor MKI67 expression in tumor
groups with low and high BTK expression, using median value as cut-off. (c) Gene set enrichment analysis
(GSEA) of cell proliferation-related Hallmark gene sets (E2F targets, G2M checkpoint, Myc targets v1 and
v2, mitotic spindle), comparing tumor groups with low and high BTK expression, using median value as
cut-off. (d) Tukey boxplots of BTK expression in different cancer subtypes. (e) GSEA analyses for
different cancer subtypes as in (c). GSEA NES and FDR values were calculated using GSEA software. P
values shown with boxplots are from Kruskal Wallis or Mann-Whitney U tests. NES: normalized enrichment
score; FDR: false discovery rate.
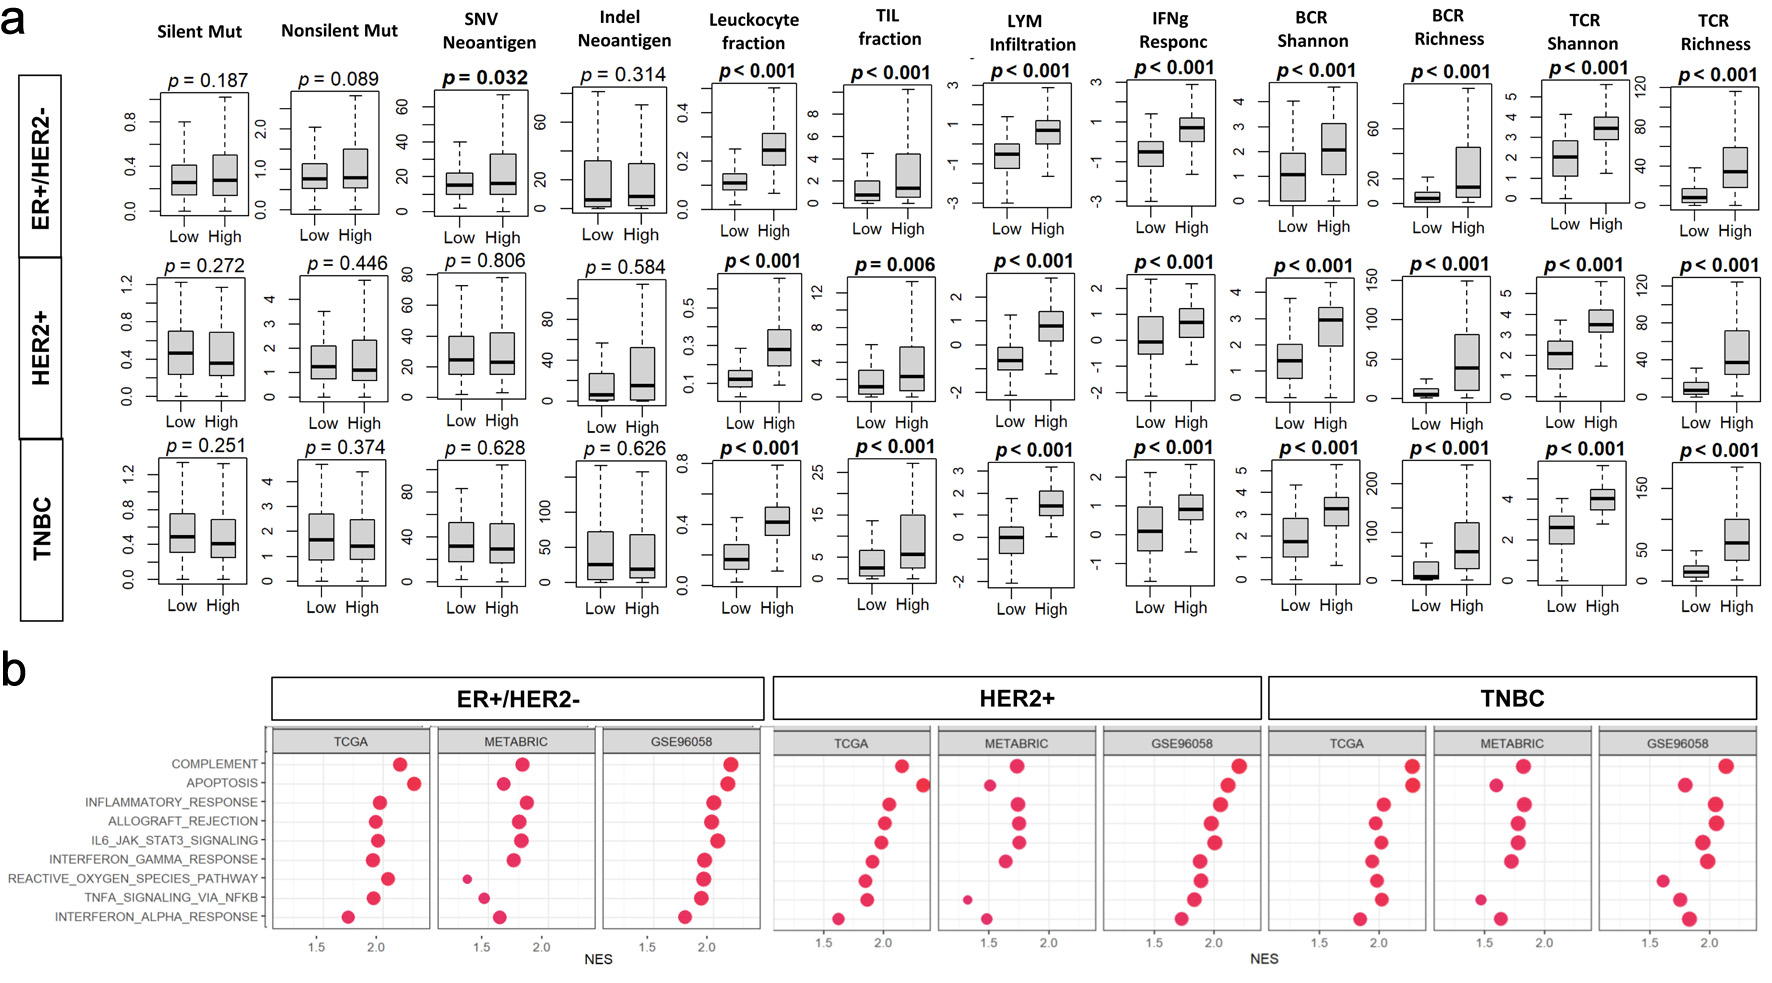
↓ Figure 3. Associations of tumor BTK expression
with mutation burden and immune cell infiltration in breast cancer. Tumor groups with low and high BTK
expression, using median value as cut-off, were compared. (a) Tukey boxplots of mutation- and immune
infiltration-related features in the TCGA cohort. BCR: B-cell receptor; LYM: lymphocyte; Mut: mutation;
SNV: single nucleotide variant; TCR: T-cell receptor; TIL: tumor-infiltrating lymphocyte. (b) Gene set
enrichment analysis (GSEA) comparing high- and low-BTK groups for three cohorts across whole cohorts or
by subtypes. Immune-related Hallmark gene sets are examined with GSEA software. NES: normalized
enrichment score; FDR: false discovery rate.
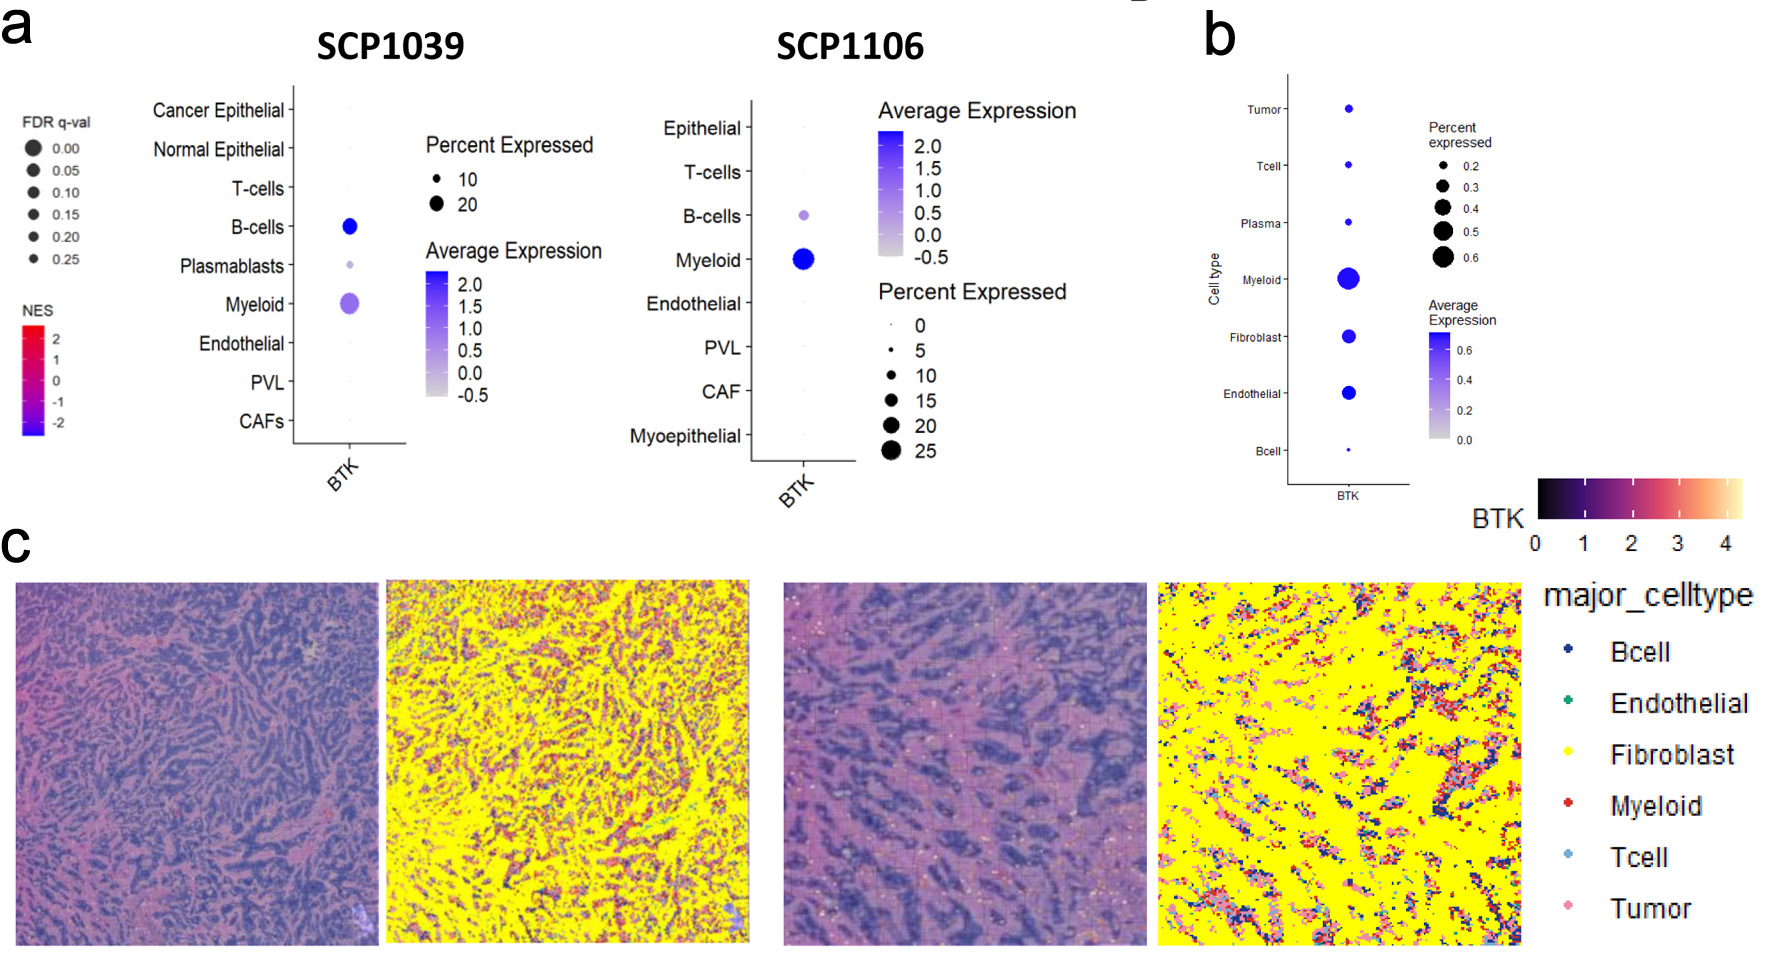
↓ Figure 4. Single cell sequencing and spatial
transcriptomic analyses of BTK expressing cells in breast cancer. (a) Heatmaps and dot plots represent
BTK expression patterns across various cell types in SCP1039 and SCP1106 single cell sequencing cohorts.
PVL: perivascular-like cells; CAF: cancer-associated fibroblast. The dot size corresponds to the
percentage of cells expressing BTK, while the color intensity represents the average expression level of
BTK within those cell populations. (b) Heatmaps and dot plots displaying the expression of BTK gene in
various cell populations, including tumor cells, T cells, plasma cells, myeloid, fibroblast, endothelial
and B cells. The dot size corresponds to the percentage of cells expressing BTK, while the color
intensity represents the average expression level of BTK within those cell populations. (c) Spatial
mapping of BTK gene expression and major cell types in human breast cancer tissue. The image displays
data from Visium HD gene expression library generated from a human breast tissue sample (fixed frozen)
with invasive ductal carcinoma, sourced from a 10x Genomics webpage. The left panel shows the expression
levels of the BTK gene, color-coded from low (purple/blue) to high (yellow/red). The right panel shows
the spatial distribution of annotated major cell types, including B cells, endothelial cells,
fibroblasts, myeloid cells, T cells, and tumor cells. Data were binned to an 8 × 8 µm
resolution for visualization and analysis.
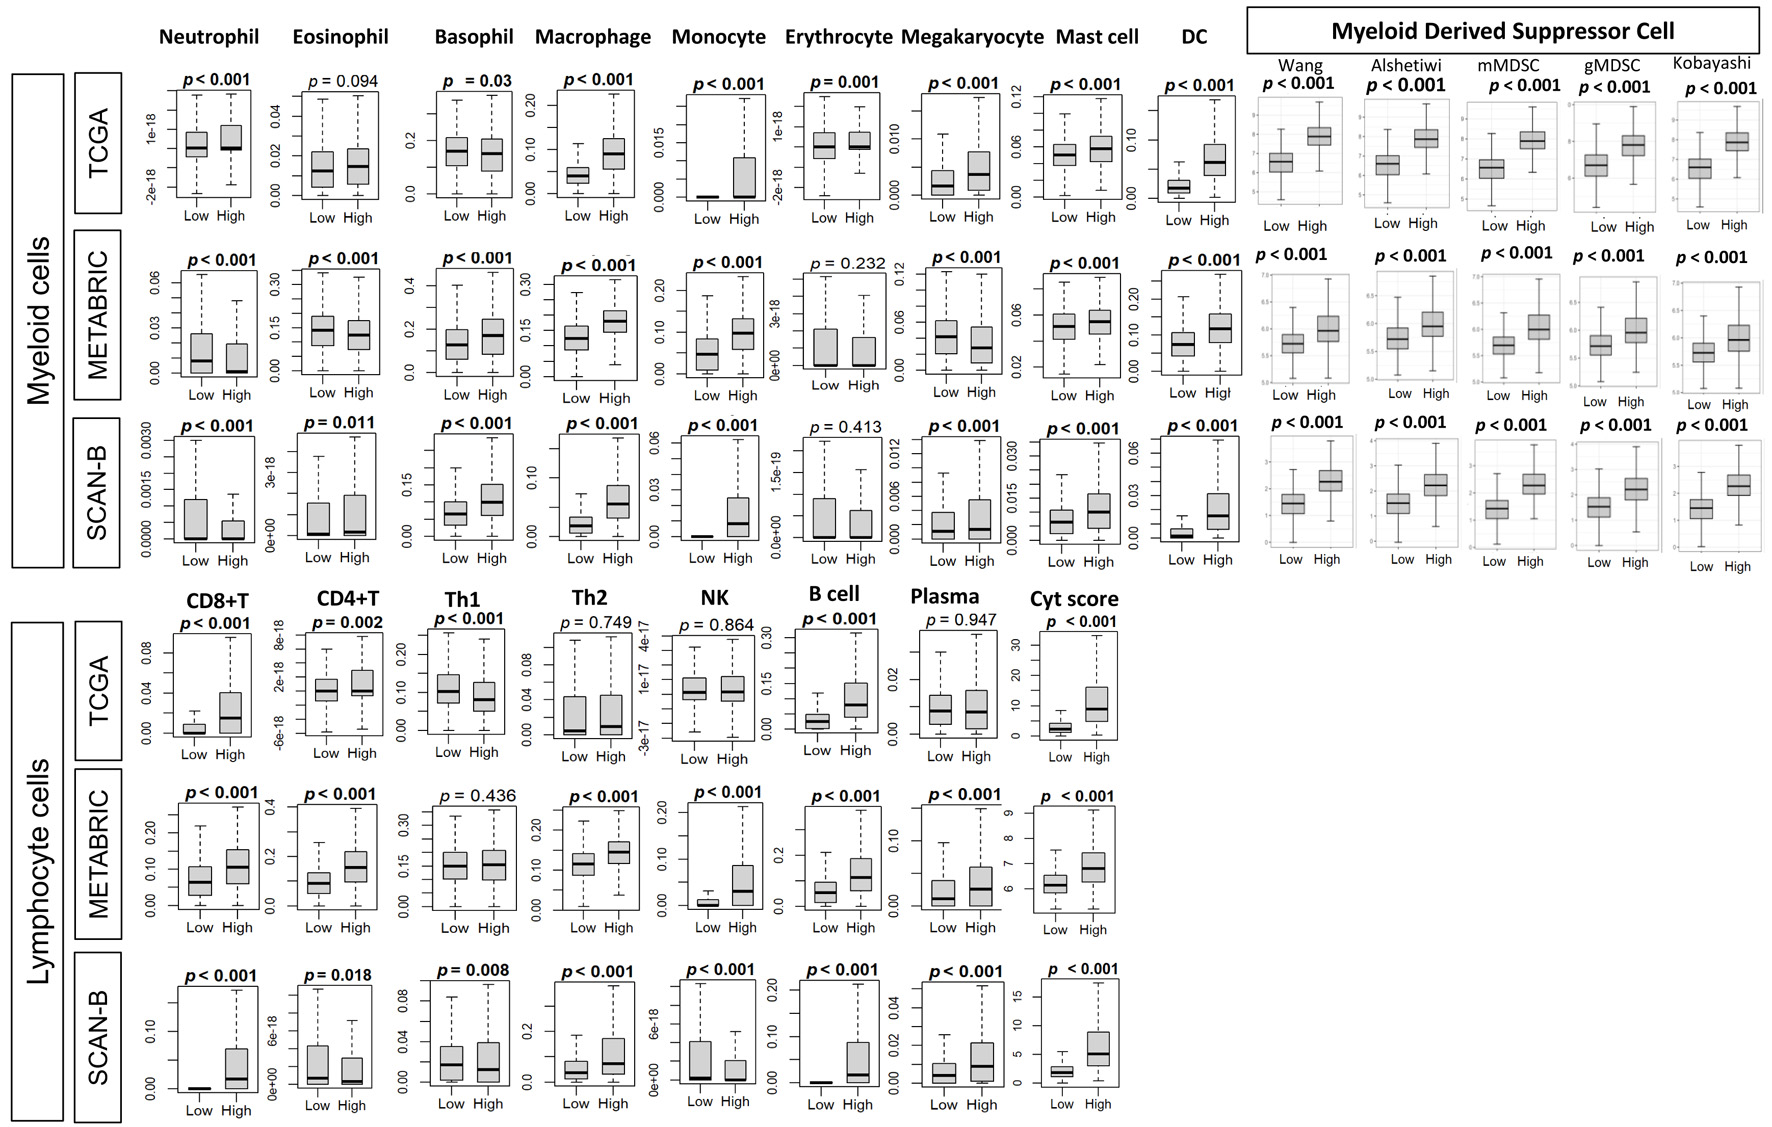
↓ Figure 5. Association of tumor BTK expression
with immune cell composition and with MDSC gene expression signatures. Immune cell composition was
estimated from tumor transcriptomes with xCell algorithm and compared between tumor groups with low and
high BTK expression, using median value cut-off, for three cohorts. Tukey boxplots are shown for various
immune cell-types and MDSC gene expression signatures, including Wang, Alshetaiwi, Cristecu granulocytic
MDSC (gMDSC), Cristecu monocytic MDSC (mMDSC), and Kobayashi. Mann-Whitney U test was used to determine
P values. MDSCs: myeloid derived suppressor cells; Cyt: cytolytic activity score; DC: dendritic cell;
NK: natural killer cell; Th: T helper cell.
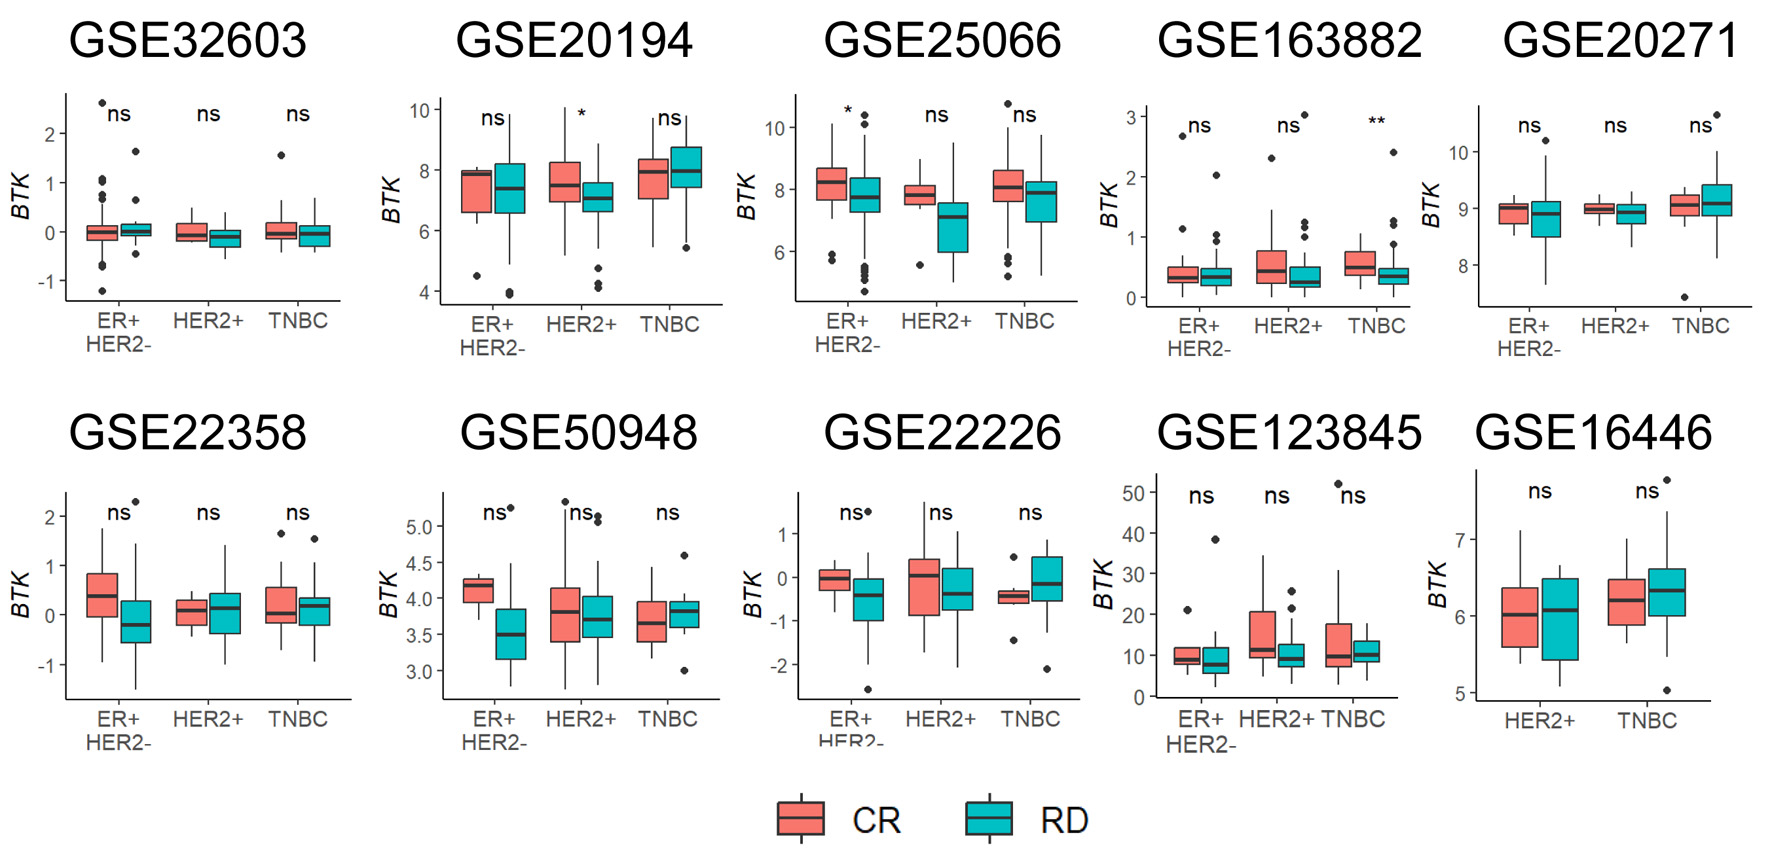
↓ Figure 6. Association of pre-treatment tumor
BTK expression with response to neoadjuvant chemotherapy. Tukey boxplots of BTK expression are shown for
patient groups with either complete response (CR) or residual disease (RD) after neoadjuvant
chemotherapy for different cancer subtypes. Mann-Whitney U test: *P < 0.05, **P < 0.005, ns >
0.05.
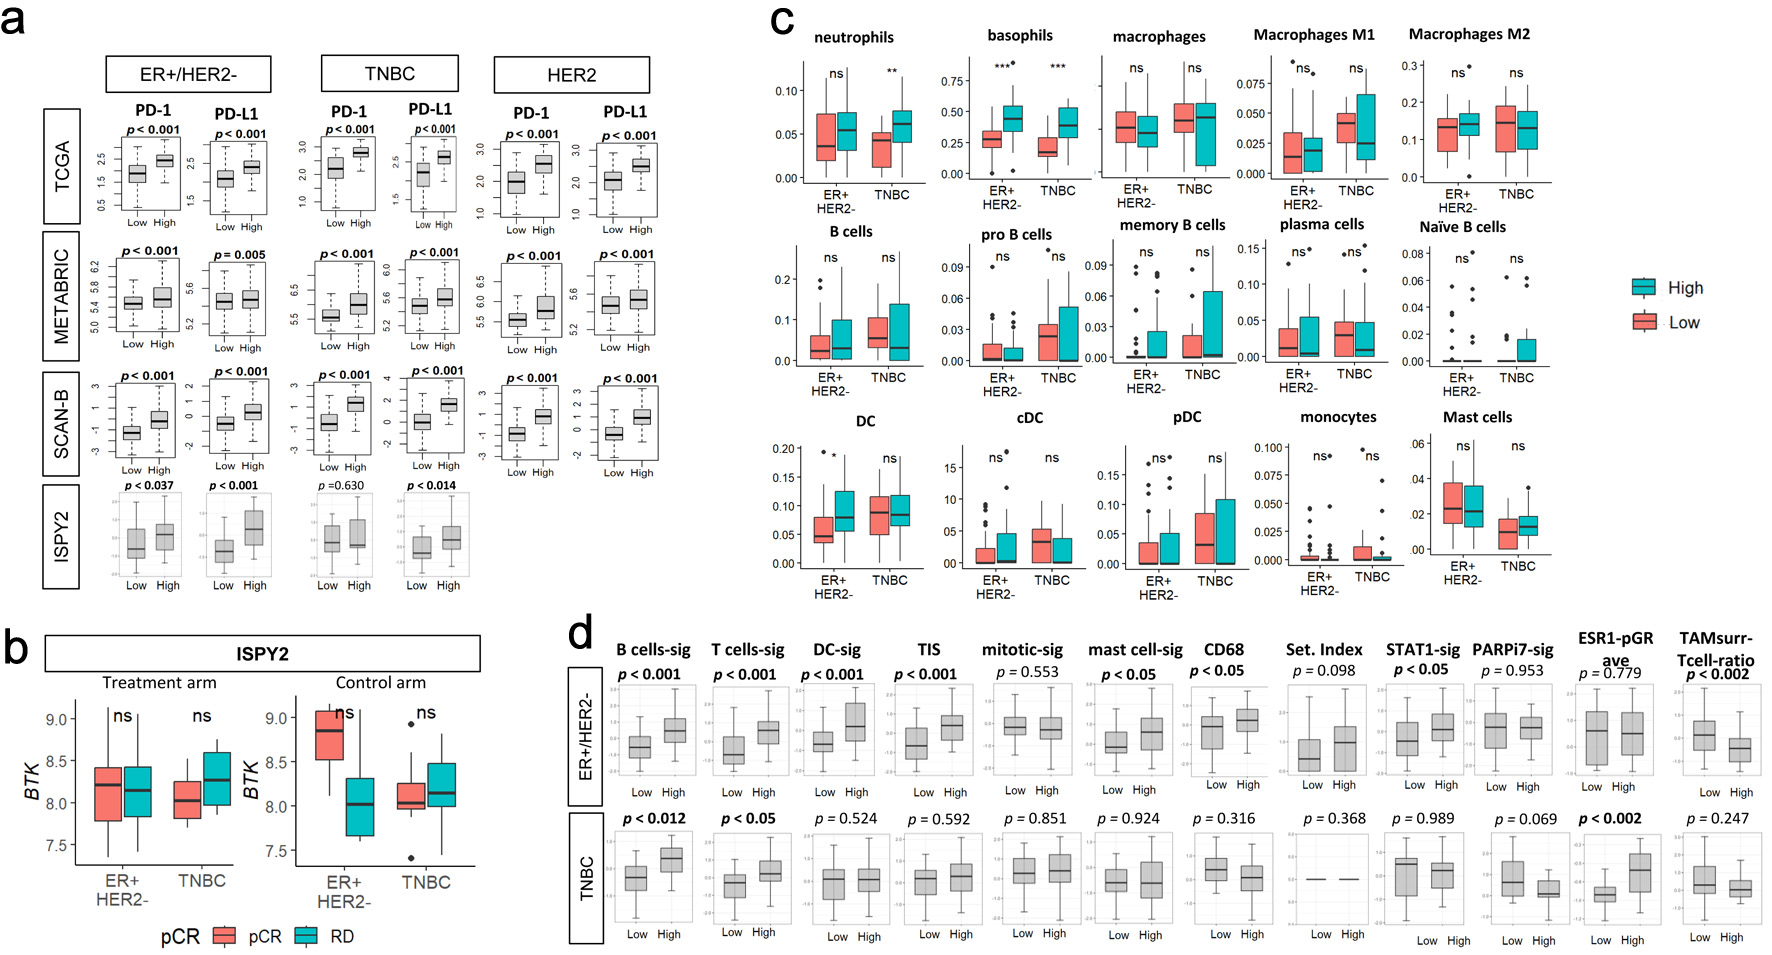
↓ Figure 7. Association of pre-treatment tumor
BTK expression with immune checkpoint molecule gene expressions, with response to immunotherapy or
chemotherapy, with immune cell infiltrations and with immune-related gene signatures in the I-SPY2
cohort. (a) PD-1 or PD-L1 expressions by low and high BTK expressions, using median value as cut-off,
for TCGA, METABRIC, SCAN-B, and I-SPY2 cohorts by subtypes. (b) Tukey boxplots of BTK expression by
pathological complete response (pCR) or residual disease (RD) after treatment (durvalumab/olaparib and
chemotherapy, n = 71, left panel) or control (chemotherapy alone, n = 34, right panel) arms by subtypes
in the I-SPY2 trial. The “ns” (not significant) Mann-Whitney U test P value > 0.05. (c)
Tukey boxplots display the relative expression of various immune cell populations in pretreatment tumor
biopsies from patients in the I-SPY2 trial by subtypes (ER+/HER2- and TNBC). (d)
Tukey boxplots display the relative expression levels of 12 immune-related gene signatures in tumors
from I-SPY2 trial. The “ns” (not significant) and asterisks above the plots indicate the
statistical significance: *P < 0.05, **P < 0.01, ***P < 0.001.