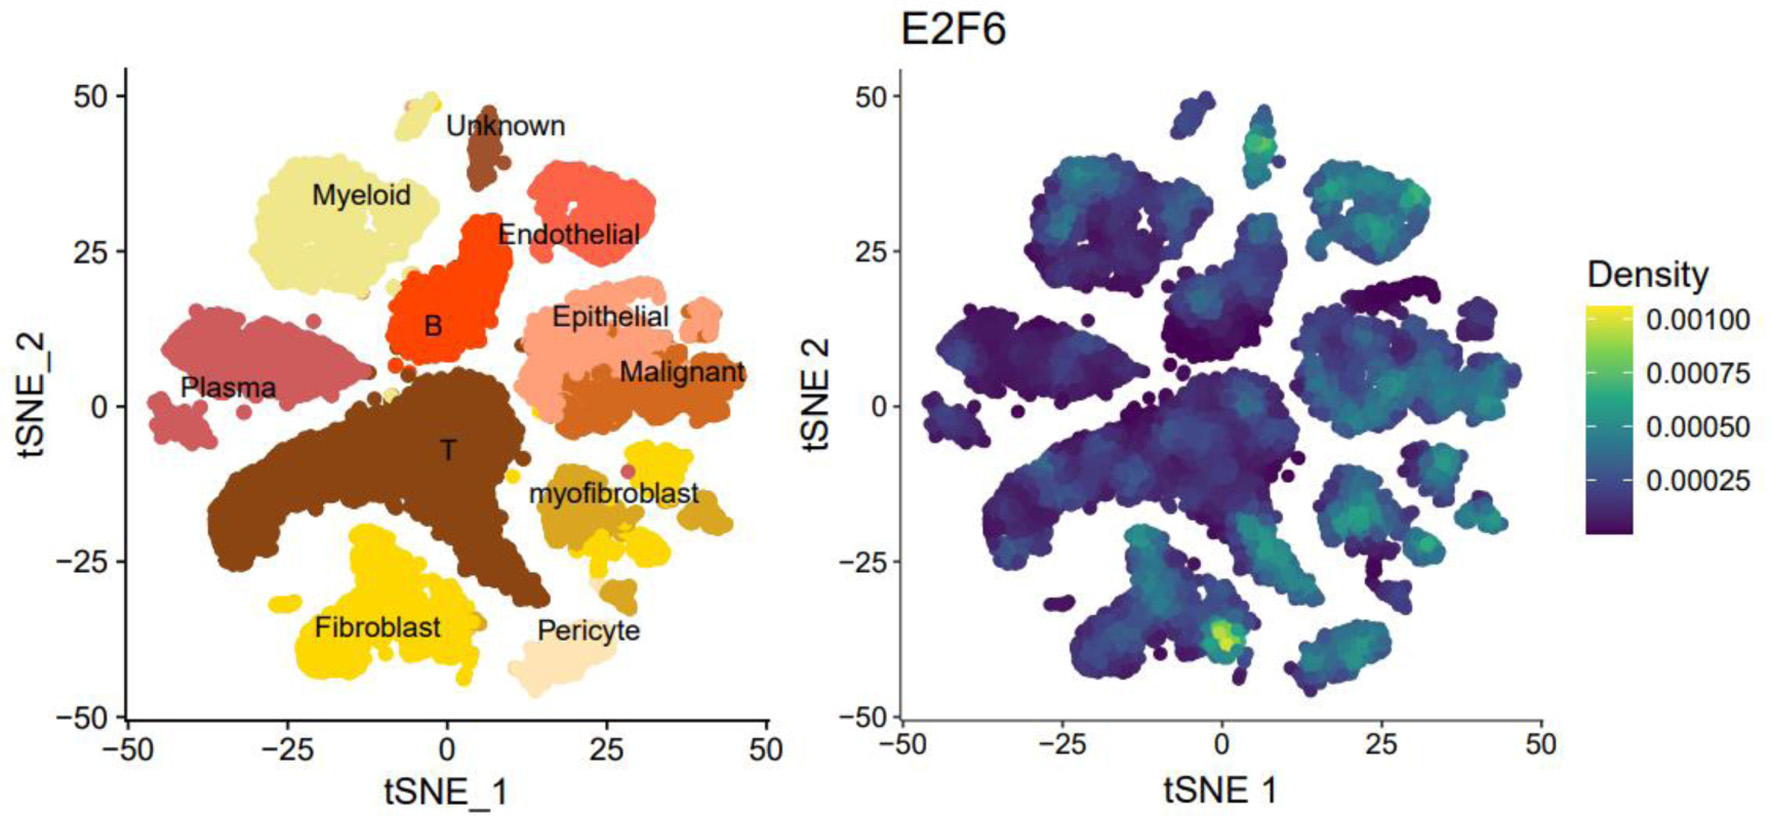
↓ Figure 1. The tSNE plot of single-cell sequencing data and the expression plot of E2F6.
| World Journal of Oncology, ISSN 1920-4531 print, 1920-454X online, Open Access |
| Article copyright, the authors; Journal compilation copyright, World J Oncol and Elmer Press Inc |
| Journal website https://wjon.elmerpub.com |
Original Article
Volume 17, Number 3, June 2026, pages 322-336
Elevated E2F6 Expression in Colorectal Cancer Tissues and Its Association With Clinicopathological Features
Figures
Table
| Parameter | E2F6 high expression | E2F6 low expression | P(t) | t/F |
|---|---|---|---|---|
| CRC: colorectal cancer; dMMR: deficient mismatch repair; MMR: mismatch repair; pMMR: proficient mismatch repair. | ||||
| Gender | 0.029 | 1.117 | ||
| Male | 64 (56.1%) | 55 (64%) | ||
| Female | 50 (43.9%) | 31 (36%) | ||
| Age | < 0.001 | −2.114 | ||
| < 60 years | 35 (30.7%) | 39 (45.3%) | ||
| ≥ 60 years | 79 (69.3%) | 47 (54.7%) | ||
| Location | 0.363 | 0.573 | ||
| Colon | 63 (55.3%) | 44 (51.2%) | ||
| Rectum | 51 (44.7%) | 42 (48.2%) | ||
| T stage | 0.001 | 1.555 | ||
| Stage I–II | 8 (7%) | 12 (14%) | ||
| Stage III–IV | 106 (93%) | 74 (86%) | ||
| Tumor budding | 0.026 | 1.353 | ||
| BD 1 | 58 (50.9%) | 52 (60.5%) | ||
| BD 2–3 | 56 (49.1%) | 34 (39.5%) | ||
| Clinical stage | 0.113 | −0.846 | ||
| Stage I–II | 73 (64%) | 50 (58.1%) | ||
| Stage III–IV | 41 (36%) | 36 (41.9%) | ||
| Number of lesions | 0.988 | −0.008 | ||
| Single lesion | 110 (96.5%) | 83 (96.5%) | ||
| ≥ 2 lesions | 4 (3.5%) | 3 (3.5%) | ||
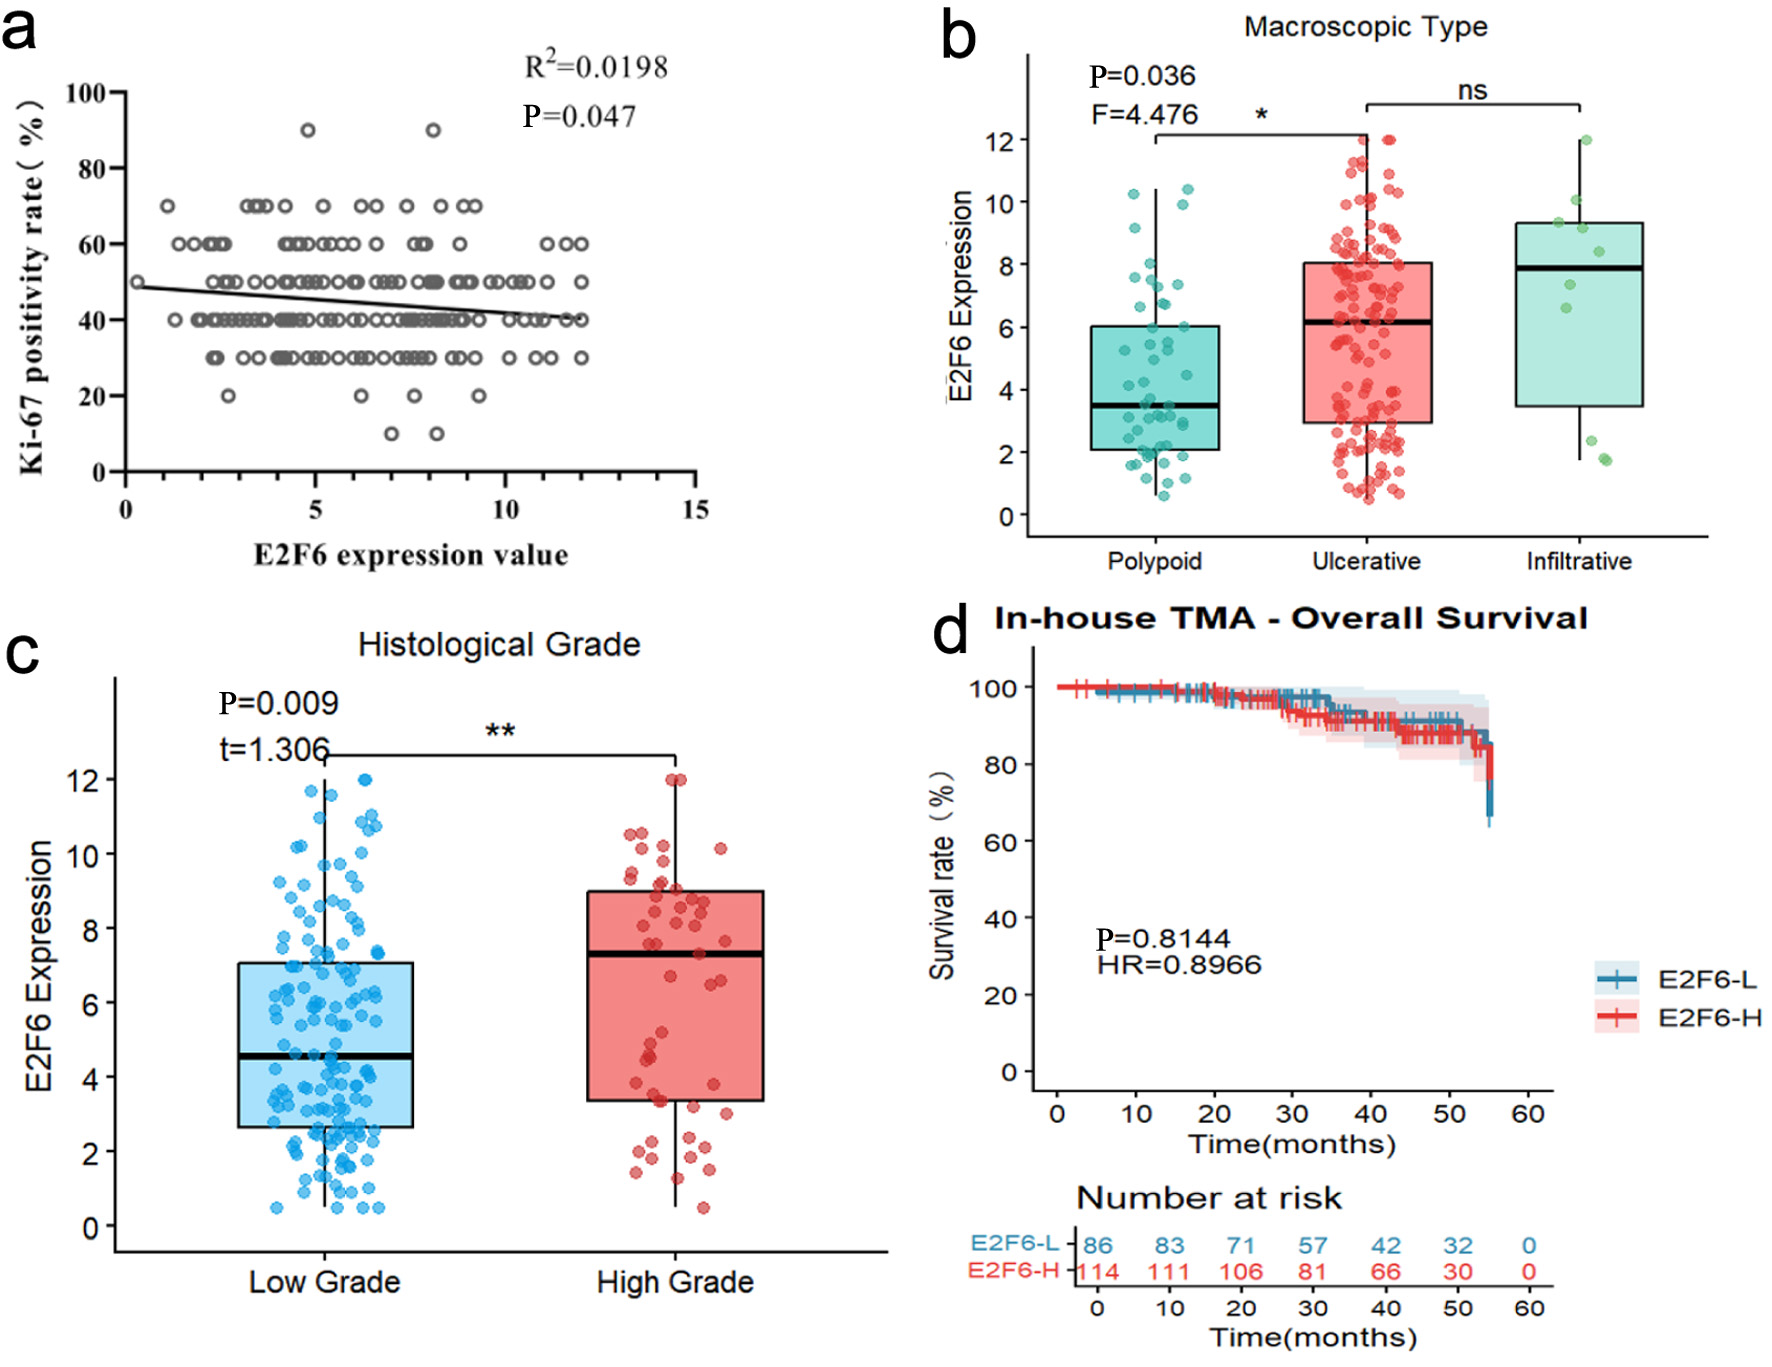
| Macroscopic type | 0.036 | 4.476 | ||
| Polypoid type | 23 (20.2%) | 26 (30.2%) | ||
| Ulcerative type | 84 (76.7%) | 57 (66.3%) | ||
| Infiltrative type | 7 (6.1%) | 3 (3.5%) | ||
| Histological type | 0.114 | 0.783 | ||
| Non-special type | 89 (78.1%) | 71 (82.6%) | ||
| Special type | 25 (21.9%) | 15 (17.4%) | ||
| Histological grade | 0.009 | 1.306 | ||
| Low grade | 81 (71.1%) | 68 (79.1%) | ||
| High grade | 33 (28.9%) | 18 (20.9%) | ||
| Vascular invasion | 0.722 | 0.178 | ||
| Yes | 21 (18.4%) | 15 (17.4%) | ||
| No | 93 (81.6%) | 71 (82.6%) | ||
| Perineural invasion | 0.001 | 1.649 | ||
| Yes | 16 (14%) | 6 (7%) | ||
| No | 98 (86%) | 80 (93%) | ||
| Lymph node metastasis | 0.023 | −1.262 | ||
| Yes | 39 (34.2%) | 37 (43%) | ||
| No | 75 (65.8%) | 49 (57%) | ||
| MMR status | 0.702 | −0.192 | ||
| dMMR | 5 (4.4%) | 6 (7%) | ||
| pMMR | 96 (84.2%) | 74 (86%) | ||