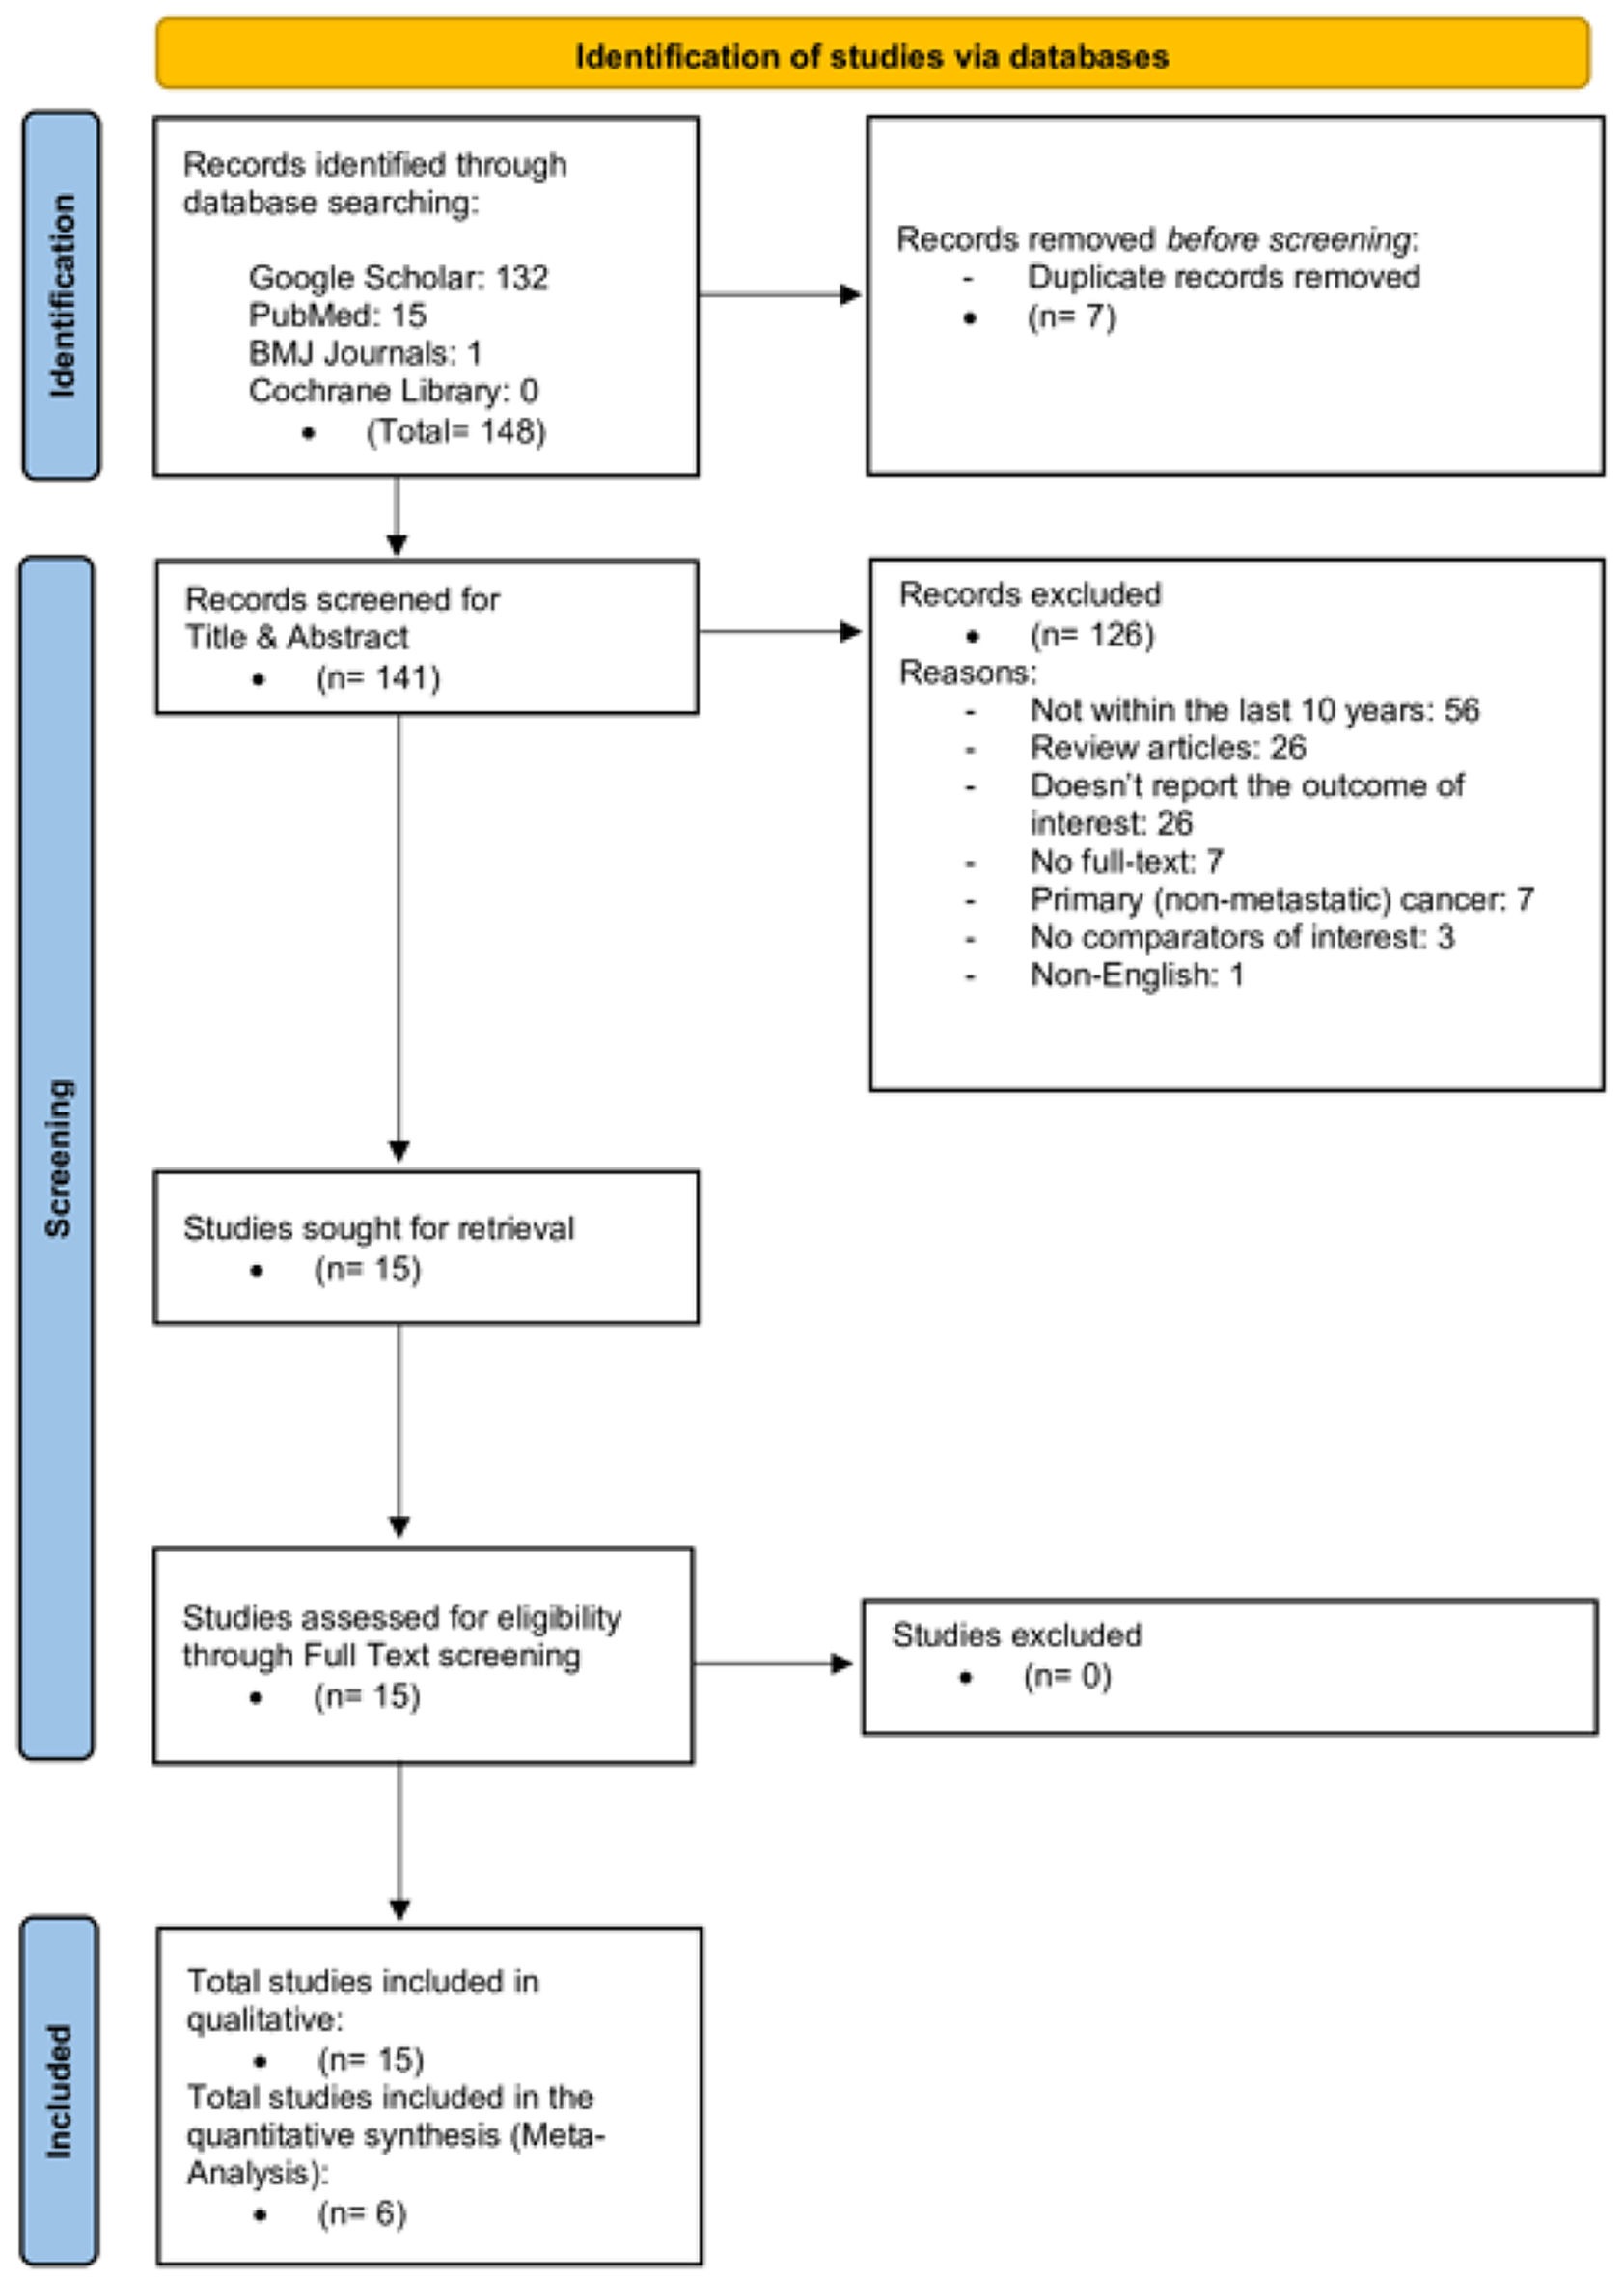
↓ Figure 1. PRISMA chart.
| World Journal of Oncology, ISSN 1920-4531 print, 1920-454X online, Open Access |
| Article copyright, the authors; Journal compilation copyright, World J Oncol and Elmer Press Inc |
| Journal website https://wjon.elmerpub.com |
Original Article
Volume 17, Number 1, February 2026, pages 95-105
A Comparison of Five-Year Survival Rates Between Thermal Ablation and Hepatic Resection for Colorectal Cancer Metastasis to the Liver: A Systematic Review and Meta-Analysis
Figures
Tables
| Author | Year | Design | Location | Sample size | Age (mean) | Males/females | Tumor size (mean, cm) | Follow-up (mean, months) |
|---|---|---|---|---|---|---|---|---|
| Vogl et al [9] | 2014 | Retrospective | Germany | 594 | 61.2 | 406:188 | 3.4 | 22.5 |
| Chiappa et al [10] | 2016 | Retrospective | Italy | 360 | 59 | 168:192 | 2.7 | 90.3 |
| Dijkstra et al [11] | 2021 | Prospective | Amsterdam | 136 | 65.1 | 104:32 | 29.1 | |
| Puijk et al [12] | 2022 | Prospective | Amsterdam | 329 | 65.3 | 222:107 | 16.5 | |
| Tinguely et al [13] | 2022 | Prospective | Sweden | 105 | 66.8 | 64:41 | 1.53 | 48 |
| McEachron et al [14] | 2020 | Retrospective | USA | 36 | 52 | 21:15 | 1.9 | 28 |
| Hof et al [15] | 2016 | Retrospective | Netherlands | 431 | 62.9 | 264:167 | 3.5 | 38.6 |
| Huang et al [16] | 2021 | Retrospective | China | 184 | 57.4 | 112:72 | 51.3 | |
| Wang et al [17] | 2017 | Retrospective | China | 96 | 59.5 | 74:22 | 4.5 | |
| Masuda et al [18] | 2018 | Retrospective | USA and Japan | 717 | 58.5 | 429:288 | 3 | |
| Knott et al [19] | 2021 | Prospective | USA | 57 | 60 | 35:22 | 1.8 | 49.3 |
| Valls et al [20] | 2014 | Prospective | Spain | 59 | 64.1 | 41:18 | 2.3 | 25.3 |
| De Graaff et al [21] | 2024 | Retrospective | Netherlands | 2,008 | 64.5 | 1,271:737 | 76.9 | |
| Shady et al [22] | 2016 | Retrospective | USA | 162 | 92:70 | 55 | ||
| Lee et al [23] | 2022 | Retrospective | South Korea | 92 | 60.2 | 63:29 | 1.4 | 33 |
| Author | Year | Ablation/resection | |||
|---|---|---|---|---|---|
| Sample size | Males/females | Age (mean) | Hospital length stay (mean, days) | ||
| Chiappa et al [10] | 2016 | 80/280 | 37:43/131:149 | 58/60 | 9/8 |
| Dijkstra et al [11] | 2021 | 100/36 | 79:21/25:11 | 66.9/63.3 | 1/5 |
| Tinguely et al [13] | 2022 | 52/53 | 33:19/31:22 | 67.5/66 | 1/7 |
| Huang et al [16] | 2021 | 98/86 | 56:42/56:30 | 58.8/55.9 | 3.5/7 |
| Masuda et al [18] | 2018 | 116/601 | 74:42/355:245 | 58.5/58.4 | |
| De Graaff et al [21] | 2024 | 1,005/1,003 | 644:361/627:376 | 64/65 | |
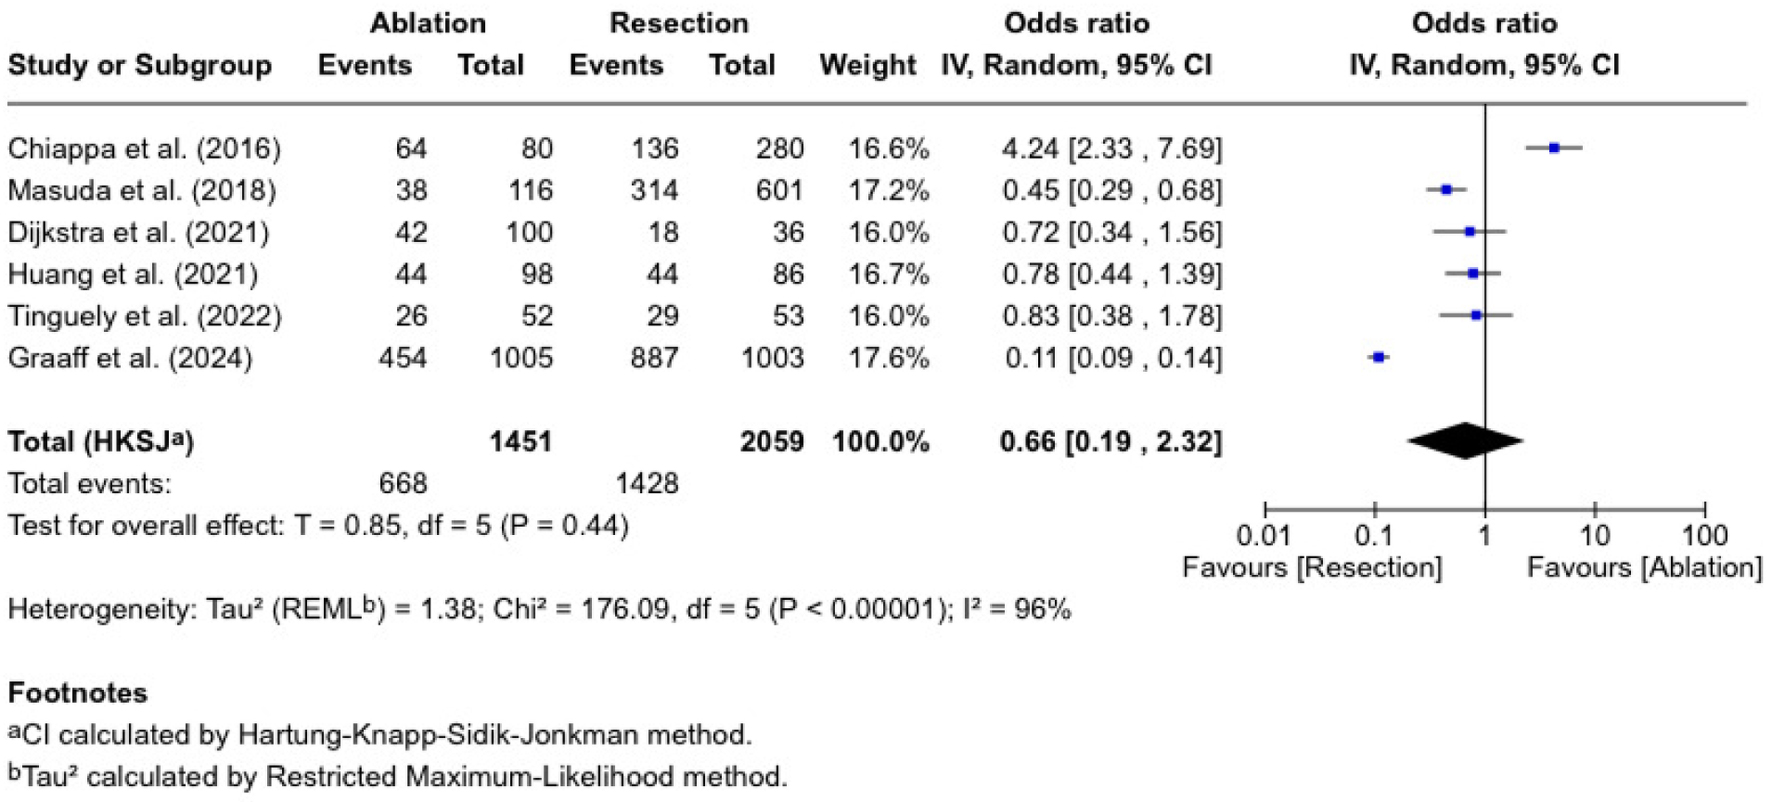
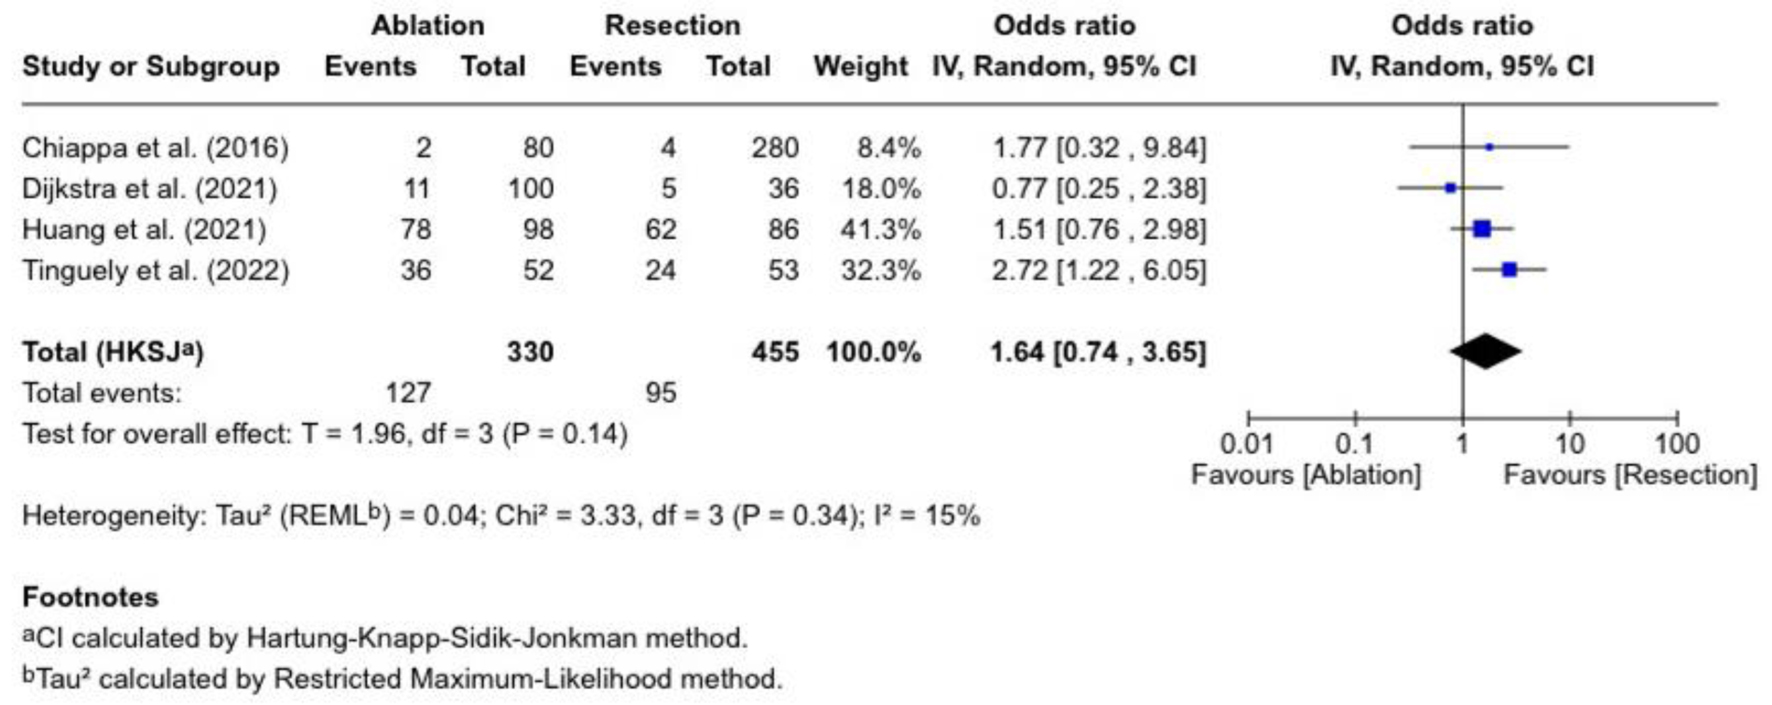
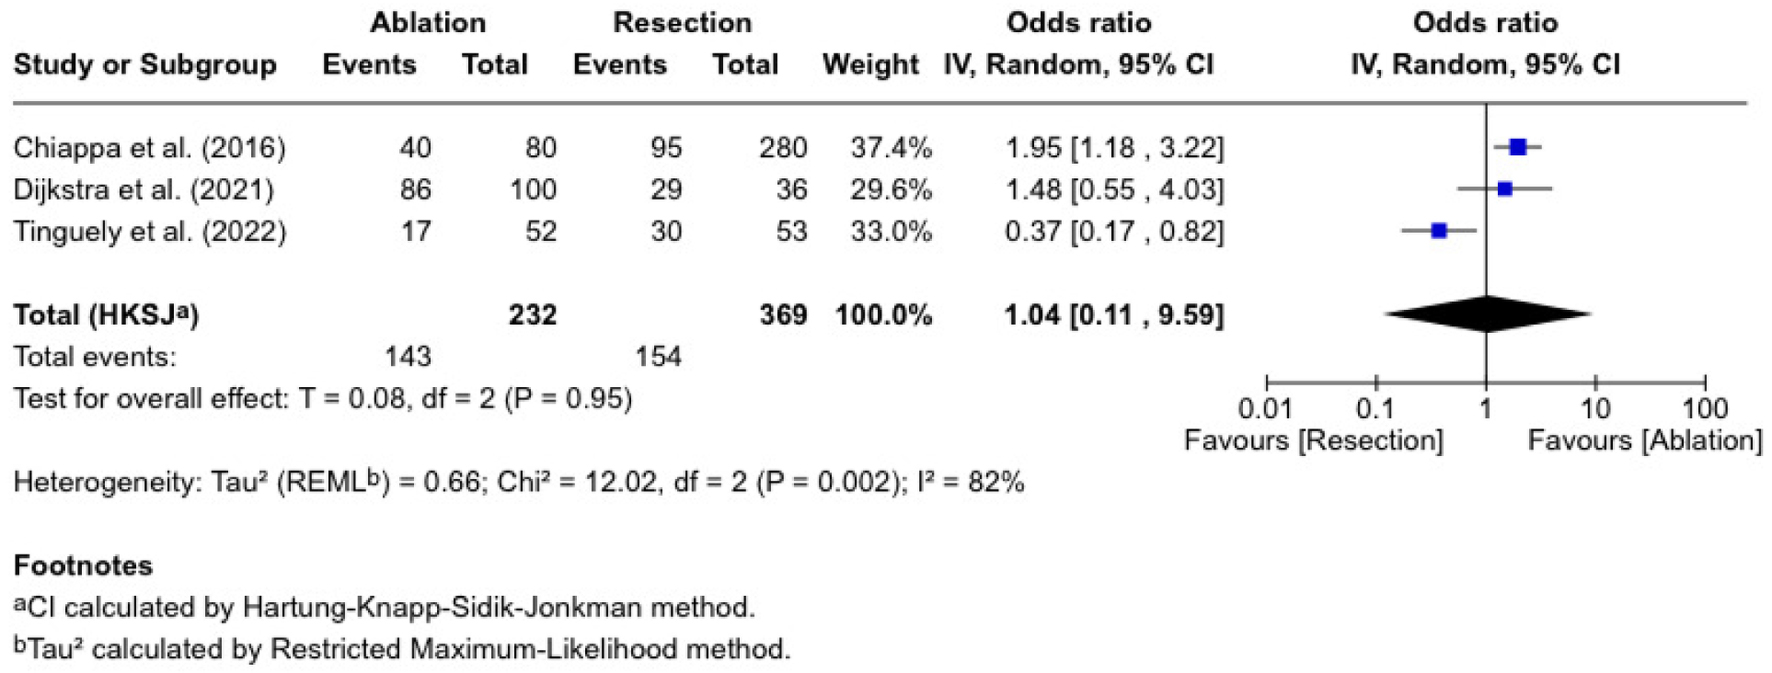
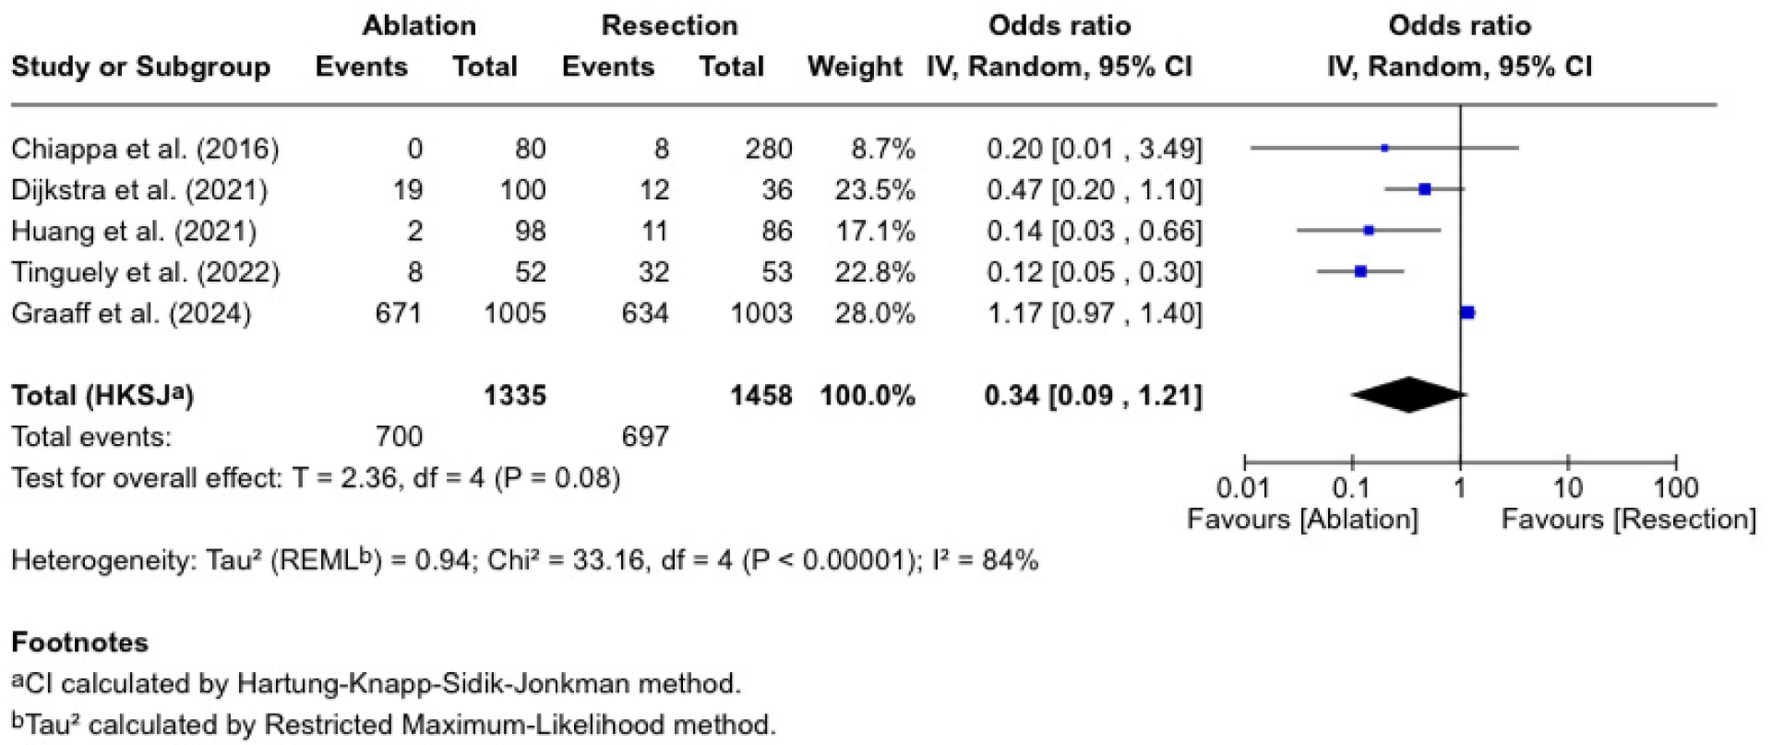
| Outcomes | Effect size | CI | Heterogeneity I2 | P value |
|---|---|---|---|---|
| CI: confidence interval; OR: odds ratio; RR: relative risk. | ||||
| Overall survival | RR: 0.84 | 0.54 - 1.30 | 94% | 0.35 |
| Tumor recurrence | OR: 1.66 | 1.06 - 2.62 | 10% | 0.03 |
| Disease-free survival | RR: 1.00 | 0.32 - 3.13 | 89% | 0.99 |
| Complications | OR: 0.34 | 0.09 - 1.21 | 84% | 0.08 |